Stringent constraint on the radio signal from dark matter annihilation in dwarf spheroidal galaxies using the TGSS
Abstract
Weakly Interacting Massive Particles (WIMPs) are considered to be one of the favoured dark matter candidates. Searching for any detectable signal due to the annihilation and decay of WIMPs over the entire electromagnetic spectrum has become a matter of interest for the last few decades. WIMP annihilation to Standard Model particles gives rise to a possibility of detection of this signal at low radio frequencies via synchrotron radiation. Dwarf Spheroidal Galaxies (dSphs) are expected to contain a huge amount of dark matter which makes them promising targets to search for such large scale diffuse radio emission. In this work, we present a stacking analysis of dSph galaxies observed at low frequency ( MHz) as part of the TIFR-GMRT Sky Survey (TGSS). The non-detection of any signal from these stacking exercises put very tight constraints on the dark matter parameters. The best limit comes from the novel method of stacking after scaling the radio images of the individual dSph galaxy fields after scaling them by the respective half-light radius. The constraint on the thermally averaged cross-section is below the thermal relic cross-section value over a range of WIMP mass for reasonable choices of relevant astrophysical parameters. Such analysis using future deeper observation of individual targets as well as stacking can potentially reveal more about the WIMP dark matter properties.
keywords:
galaxies: dwarf – dark matter – diffuse radiation – radio continuum: galaxies1 Introduction
The hierarchical structure formation model predicts existence of numerous low mass satellite galaxies gravitationally bound to larger, high mass galaxies. For the Milky Way (and the local group), a large fraction of these observed satellite galaxies are dwarf spheroidal (dSPh) galaxies. The dSph galaxies, very similar to the globular cluster population, are gravitationally bound, diffuse, low surface brightness and low luminosity systems (Strigari et al., 2008a), with low metallicity and old stellar population (McConnachie, 2012), and having negligible gas and dust content, as well as very little or no recent star formation. However, unlike the globular clusters, they have very high dynamical mass to light ratio (Sparke & Gallagher, 2016), indicating that they are dark matter (DM) dominated systems (e.g. Strigari et al., 2008a; Strigari et al., 2008b). The presence of dark matter can also be inferred from the kinematics studies of dSph galaxies (e.g. Bosma & van der Kruit, 1979; Rubin et al., 1980). Based on a variety of observations, the dSph galaxies are thought to be the most dark matter dominated systems, and hence are considered to be among the most promising targets for the indirect detection of dark matter (Strigari, 2018).
| Name | R.A. | Dec. | () | D () |
|---|---|---|---|---|
| Aquarius | ||||
| Bootes I | ||||
| Bootes II | ||||
| Carina | ||||
| Cetus | ||||
| Columba I | ||||
| Draco | ||||
| Fornax | ||||
| Grus I | ||||
| Grus II | ||||
| Hercules | ||||
| Hydra II | ||||
| Leo I | ||||
| Leo II | ||||
| Leo IV | ||||
| Leo V | ||||
| Phoenix | ||||
| Sagittarius II | ||||
| Sculptor | ||||
| Segue II | ||||
| Ursa Major II | ||||
| Ursa Minor | ||||
| Willman I |
One of the proposed scenarios for indirectly detecting the DM signal is to look for the standard model annihilation/decay products, and the corresponding excess signature in the electromagnetic spectra. A specific case of interest is the weakly interacting massive particles (WIMPs) as DM candidate; here the DM annihilation producing electron-positron pairs through various interaction and decay channels. These charged particles, in turn, can produce broadband electromagnetic emission like bremsstrahlung, inverse Compton, and, particularly at low radio frequency range, synchrotron emission in presence of the, albeit weak, galactic magnetic field Colafrancesco et al. (2007); Profumo & Ullio (2010). Although this signal is expected to be very faint, as the dSph galaxies otherwise have very little or no diffuse low radio frequency emission, due to their expected high DM fraction and their relative proximity, it is in principle possible to detect (or put stringent limit on) this signal, and in turn constrain or rule out certain models on the nature of DM from such observations. Another promising avenue is to look for an excess -ray signal arising due to DM annihilation. Several recent studies have explored this avenue and find some important clues on the nature of DM particle and annihilation cross section (Charbonnier et al., 2011; Walker et al., 2011; Ackermann et al., 2015; Brown et al., 2019).
There have been multiple attempts earlier to detect signature of DM annihilation using radio observations of the dSph galaxies. Spekkens et al. (2013) analysed radio maps of four nearby dwarf spheroidal galaxies observed by GBT at . Later, Regis et al. (2015) did deep radio observations of local group dSph galaxies at GHz using the Australia Telescope Compact Array (ATCA). However, they did not find evidence of any significant emission from DM annihilation. More recently, Kar et al. (2019) and Cook et al. (2020) analysed low frequency ( MHz) radio images of and dSphs respectively observed as a part of the GLEAM survey. Although their results are consistent with a null detection, these observations put an upper limit of and mJy beam-1 (for a beam) respectively on the diffuse synchrotron emission from the dark matter. A similar study by Vollmann et al. (2020) using LOFAR observations is also consistent with null detection. The results are mostly limited by the low sensitivity and Galactic foreground contamination. Based on the observed limit, they put some constraints on the magnetic field strength as well as DM parameters, e.g., the halo density profile (Navarro et al., 1996; Spekkens et al., 2013) and the degree of diffusion. Recently, Kar et al. (2020) have also used deep ( mJy beam-1) MWA observation of Centauri at MHz and best fit values of DM particle mass and annihilation cross-section from -ray observations (Brown et al., 2019) to rule out significant parts of the magnetic field - diffusion coefficient plane.
In this paper we present an analysis for dSph galaxies using the MHz data from the Giant Metrewave Radio Telescope (GMRT). The unique array configuration and high sensitivity of the GMRT allow identification and subtraction of compact sources and, at the same time, constraining the large scale diffuse emission with resolution. The paper is organized as follows. The dSph sample and the data used for the analysis are described in §2. Next, §3 outlines the analysis and the results are shown in §4. Finally, the conclusions are presented in §5.
2 Galaxy Sample and Data
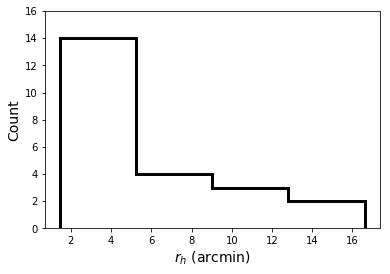
Deep, low frequency radio observation of dSph galaxies is sparse, but it is possible to use archival data for a number of targets, and to combine the images of the individual fields to search for weak diffuse emission from the targets (e.g. Cook et al., 2020). For this work, we have used data from the MHz TIFR GMRT Sky Survey (TGSS). The first alternative data release (TGSS-ADR1) of this survey (Intema et al., 2017) provides the continuum Stokes I images of % of the sky area north of declination (i.e., % of the full sky), at a resolution of for fields that are north of declination, and for fields south of . The median value of RMS noise is mJy beam-1 for the survey. Out of around 65 dSph galaxies of Milky way and local group (McConnachie, 2012; Drlica-Wagner et al., 2020), are found to be within the TGSS footprint. There were 5 more targets observed in the TGSS, but are not included in this analysis due to presence of image artifacts in those fields. The target coordinates, their half-light radius and distance (McConnachie, 2012; Cook et al., 2020; Koposov et al., 2015; Martin et al., 2015; Martínez-Vázquez et al., 2019; Laevens et al., 2015) are tabulated in Table 1, and the half-light radius distribution is shown in Fig. 1. Note that the unique hybrid array configuration of the GMRT implies that the telescope has sensitivity to both small scale compact structures as well as large scale diffuse emission, with the largest detectable structure (corresponding to the shortest baselines) being 68 arcmin. If the diffuse emission from these targets have angular extent few , there will not be any significant missing flux issue in this analysis.
3 Data Analysis
For the dSph galaxies, we have used the TGSS-ADR image archive to extract the image of a region centred around the optical position of each of the galaxies in FITS format combining data from multiple overlapping TGSS pointing. For the first part of our analysis, we have extracted region for each of the target dSph galaxies. Further analysis was done using the Common Astronomy Software Applications (CASA) package. We have visually inspected each field to identify and blank all the compact sources (unresolved and marginally resolved) using a cut off. These compact sources are unrelated to the expected faint diffuse emission (originating from processes directly involving the DM annihilation/decay) at the galaxy-wide scale, that is of our interest. This will also filter out any plausible unidentified imaging artifact present in the field. We then shift the central coordinate of all the fields, regrid and convolve the data to exactly same pixel size and same synthesized beam before combining to create a stacked image from all dSph target field. We have also selected “control” regions, located close to the corresponding target field regions, that are devoid of any prominent sources. The same process is repeated for these regions to create a stacked image of the control field. We have then compared the properties of the stacked target and control field to search for the presence of any weak, extended emission signal (see §4).
For the second part of our analysis, instead of stacking a fixed angular size of , we have used the half-light angular radius () of the dSph galaxies to scale the individual regions before stacking. For this, we start by extracting a subimage of for each source. The same steps of removing the compact sources, scaling, regridding and convolving to the same synthesized beam were followed to create the stacked image from the target regions. As earlier, exactly same method was followed to create a stacked image of the control field as well. The results of a careful comparison between the stacked target and control field are presented in the following section.
4 Results and Discussion
4.1 Comparison between target and control regions
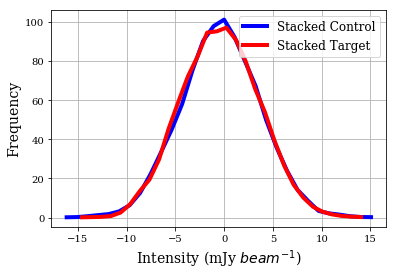
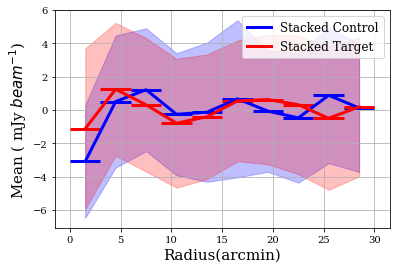
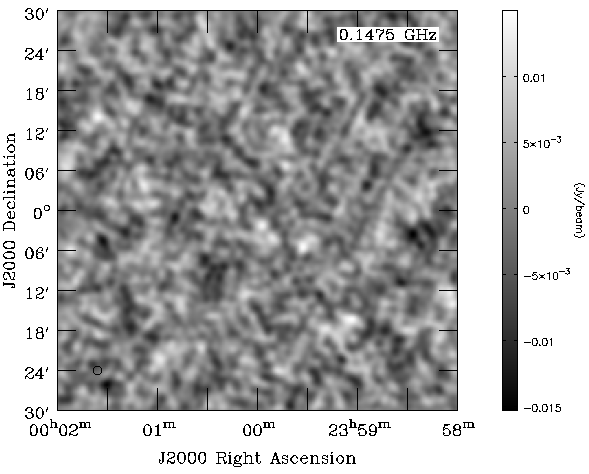
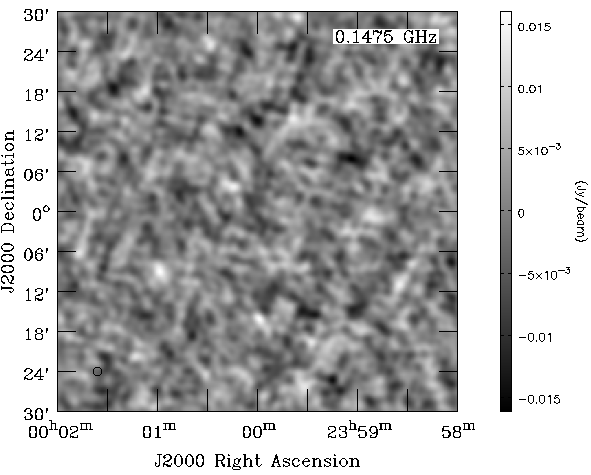
Fig. 2 shows the final stacked target (left) and control (right) regions obtained using the first method described in section 3. As described earlier, the stacking is done after removing all prominent compact sources from individual fields. Even after stacking, no significant large scale emission is visually prominent in either the target field or the control field. The final RMS noise is mJy beam-1 (with a beam size of ) for both target and control regions. For comparison, the stacked image for the GLEAM survey had a synthesized beam of size with the RMS sensitivity 5.5 mJy beam-1. We note that the mean values (0.11 mJy beam-1 for target field and 0.13 mJy beam-1 for control field) are consistent with each other within the error values. A more quantitative comparison between the intensity distributions of the target and control field, shown in Fig. 3 left panel, is also done. We have used the nonparametric Kolmogorov-Smirnov (K-S) test with the pixel intensity values (after regridding to arcsec); based on the K-S statistics values ( and the -value ), we conclude that the stacked target and control images intensity distributions are likely to be very similar. The radial intensity profiles (mean surface brightness in different radial bins, and measured RMS in each bin) shown in the right panel of Fig. 3 shows the two stacked images to also have indistinguishable profiles within the statistical uncertainties.
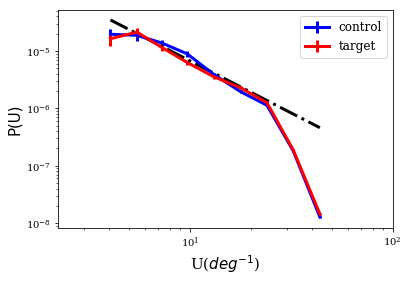
Apart from the mean and the distribution function of the intensity values, we have also compared the second order statistics by estimating the angular power spectra of the intensity fluctuations. We convert the image in the Fourier domain using the Fastest Fourier Transform in the West (FFTW; Frigo & Johnson 2005) and calculate the angular power spectrum. We also multiply the image with a cosine window function to avoid artifacts arising due to the sharp cut-off at the edge (Miville-Deschênes et al., 2016; Choudhuri & Roy, 2019). As shown in Fig. 4, the angular power spectrum of the stacked target and the control regions are same within the measurement uncertainty. We note that over the range of to deg-1 (i.e., ), the power spectra can be well represented by a power law with a power law index of and for the target and the control region respectively. We choose this range because the power spectrum is convolved with the Fourier transform of the window function, and the image is convolved with the synthesized beam. These measured slopes of the angular power spectrum are consistent with earlier power spectra measurements of the diffuse Galactic synchrotron emission (Bernardi et al., 2009; Ghosh et al., 2012; Iacobelli et al., 2013; Choudhuri et al., 2017; Chakraborty et al., 2019). Apart from an overall consistency check, this result clearly indicates that the TGSS data are suitable to probe diffuse emission at large angular scale, similar to the expected radio signal associated with the DM halo of the dSph galaxies, present in the field.
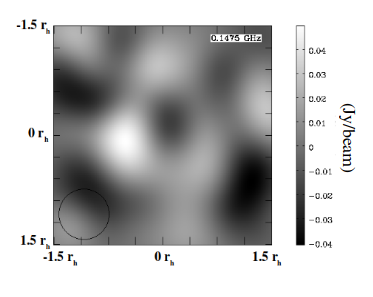
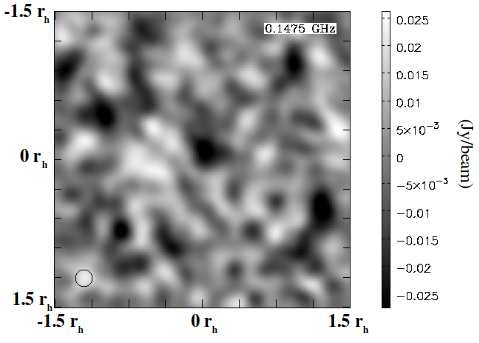
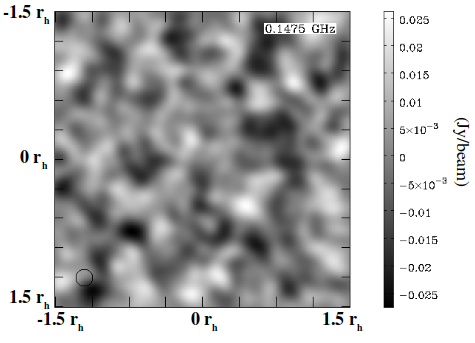
Next, we consider results from a novel stacking method after scaling the radio images of individual dSph fields by the respective half-light angular radius . Here, we have assumed that the large scale diffuse signal that we are searching for has characteristic angular scale related to the optical half-light radius (). In absence of any direct estimation of the DM halo size of the sample galaxies, this is a reasonable assumption. If that is indeed the case, then, by scaling all the images using the respective and stacking the images, the expected radio emission profiles align with each other and the stacked signal is more likely to be detected. After following the steps described earlier in §3, i.e. blanking compact sources, scaling and regridding the images, convolving to a common synthesized beam and stacking, the final images for the target and the control field are shown in the top panels of Fig. 5. For the two stacked images, the mean values are mJy beam-1 and mJy beam-1 and the rms values are mJy beam-1 and mJy beam-1, with the final convolving beam size of in unit, for the target and the control fields respectively.
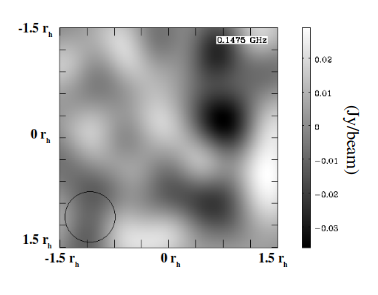
One limitation of the analysis with scaling is that the final stacked images have poor resolution. The images are convolved to the same Gaussian beam before stacking, and the resolution is determined by the target with smallest in angular size. We hence also repeat the same analysis for a subsample of targets with . The final stacked images of the target and the control fields are shown in the bottom panels of Fig. 5. For a final convolving beam of in unit, the mean values are 0.9 mJy beam-1 and 0.5 mJy beam-1 where as the rms values are 10 mJy beam-1 and 9 mJy beam-1, respectively.
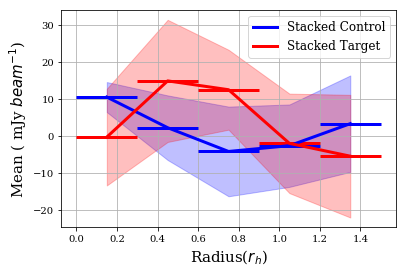
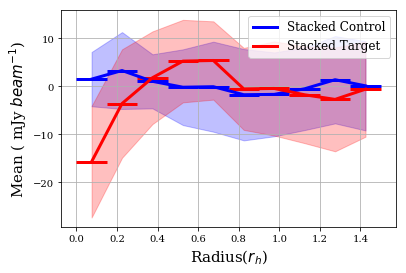
For the “-stacking” also, we have carried out the similar comparison of the intensity distributions, the radial intensity profiles and the angular power spectra for both the subsample and the full sample. The target and the control region have statistical properties consistent with each other within the measurement uncertainties ( and for the full sample and and for the sub-sample in K-S test, indicating very similar distribution of intensities for the stacked target and control image). As shown in Fig. 6, there is indication of possible slight excess in the radial profile, however significantly higher sensitivity data are required to check if the feature is real. Overall, the results are consistent with no detection of diffuse large scale signal, and we put some stringent constraints on the galaxy scale diffuse emission at low radio frequency from the dSph galaxies.
4.2 Constraints on dark matter
Based on the non-detection of diffuse low frequency emission in these stacking exercises, one can put constraints on DM parameters under reasonable assumptions for the astrophysical conditions in dSph galaxies. This is done by first evaluating the equilibrium electron positron spectra considering diffusion equation (where the source term depends on the DM particle cross-section and mass), and then computing the expected signal for the frequency range of interest due to different emission mechanism (see, e.g., Natarajan et al., 2013; Colafrancesco et al., 2006; Storm et al., 2017; Colafrancesco et al., 2007; Beck & Colafrancesco, 2016; McDaniel et al., 2017; Geringer-Sameth et al., 2015; Kar et al., 2020, for more details). A comparison of the expected and observed signal (or the upper limit in case of non-detection) can then constrain the DM particle mass and cross-section.
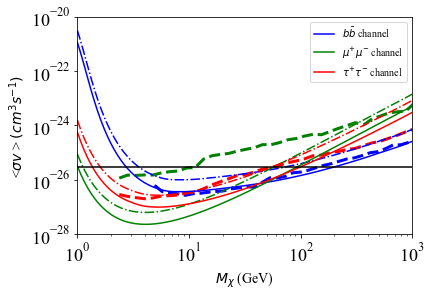
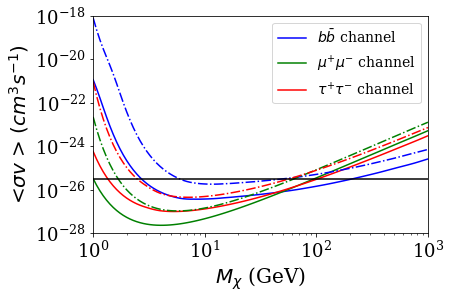
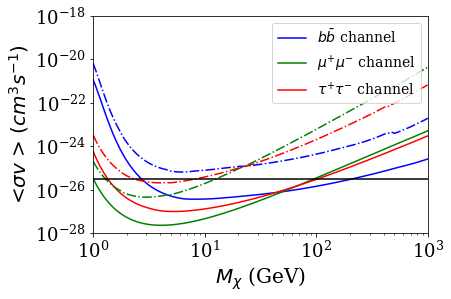
For the purpose of deriving the constraints from these observations, publicly available package RX-DMFIT (McDaniel et al., 2017) has been used. We choose a very conservative upper limit of the estimated flux density at GHz for these computations. The signal is computed for an archetypal dSph galaxy for our sample (similar to the Draco dwarf spheroidal galaxy with core radius kpc and radius for diffusion effect kpc) placed at a distance of kpc, which the median distance for our sample. We also choose G, and diffusion coefficient (Kar et al., 2019; Natarajan et al., 2015, 2013; Jeltema & Profumo, 2008; Regis et al., 2015; Chyży et al., 2011) as fiducial parameters. As shown in Fig. 7, we get the best constraint on the average cross-section (<>) for different DM mass () for the flux density limit of Jy from the “ stacking” (solid lines in all three panels). The constraints are shown for three different channels, namely , and (see McDaniel et al., 2017, for details). The cross-section values are shown for a WIMP mass range of GeV. We note that the constraint on <> is below the thermal relic cross-section limit (Steigman et al., 2012) for a range of of interest.
For comparison, we have also checked how the constraints vary for different choices of these parameters. If we use the flux density limit of Jy from stacking of the region, the constraints are slightly less tight. This is shown is the left panel of Fig. 7. The flux density limit for the sub-sample stacking is very similar to this value, hence it is not shown separately. Similarly, the top right panel of Fig. 7 shows a comparison between and G, and the bottom right panel shows how the constraints change if we assume instead of . The “no spacial diffusion” scenario results in constraints very similar to the ones for . We also show the combined limits from the 11 years Fermi-LAT observations of 27 dSph galaxies (Hoof et al., 2020b) using data available on Zenodo (Hoof et al., 2020a). The limits derived from the present analysis is comparable to that from the Fermi-LAT observations for and decay channels, and is more stringent for the decay channel. Overall, in all these cases, due to the stringent flux density limits, our results put comparable limits as some of the recent works (e.g. Archambault et al., 2017; Biswas et al., 2017; Bhattacharjee et al., 2019; Vollmann et al., 2020) from other radio as well as high energy observations of the dSph galaxies.
5 Conclusions
Detection of diffuse radio emission from dSph galaxies can be a smoking gun evidence for WIMP as possible dark matter candidate. In this paper, we present a stacking analysis for dSph galaxies using the archival MHz data from the TGSS, in order to search for such signal. Quantitative comparisons of first order and second order statistics of the stacked target and control fields show no excess signal for the targets compared to the control regions. Apart from straightforward stacking, we have also tried a novel method of scaling the radio images by the corresponding of the respective dSph galaxies followed by stacking to get a deeper limit on the average flux density from this sample. However, over a range of scale probed in this analysis , the angular power spectra are found to be power law, with the best fit power law index being consistent with earlier measurements of the diffuse Galactic synchrotron emission. Based on the non-detection of any detectable excess radio emission, we have put tight limits on the thermally averaged cross-section for WIMP mass range of GeV under the assumption of some reasonable astrophysical conditions. With our choices of the parameters, the cross section limit over a significant fraction of the DM mass range is below the thermal relic cross-section limit for , and channels. It should be noted that the current analysis is limited by the sensitivity due to the small on-source time per field for the TGSS images. Hence, application of the this method of “ stacking” with deeper images of the targets from future observations can further improve the limits. Also, combining such observations for larger sample and over the electromagnetic spectrum to put joint limits will also push the constraints. Finally, upcoming telescopes like the Square Kilometre Array (SKA) will have the sensitivity to detect this radio signal or to put orders of magnitude better limits.
Acknowledgements
This work makes use of the NASA/IPAC Extragalactic Database (NED), The SAO/NASA Astrophysics Data System (ADS), and the archival images from the TGSS-ADR1. We thank the staff of the GMRT that made these observations possible. GMRT is run by the National Centre for Radio Astrophysics of the Tata Institute of Fundamental Research. We also acknowledge Alex McDaniel (UCSC) for useful discussion and help with RX-DMFIT. We thank the reviewer for encouraging comments. We thank Sebastian Hoof for useful discussion on the Fermi-LAT results.
Data Availability
The data used for this study is available from the TGSS ADR image archive (data release 1). The final data products from this study will be shared on reasonable request to the corresponding author.
References
- Ackermann et al. (2015) Ackermann M., et al., 2015, Phys. Rev. Lett., 115, 231301
- Archambault et al. (2017) Archambault S., et al., 2017, Phys. Rev. D, 95, 082001
- Beck & Colafrancesco (2016) Beck G., Colafrancesco S., 2016, J. Cosmology Astropart. Phys., 2016, 013
- Bernardi et al. (2009) Bernardi G., et al., 2009, A&A, 500, 965
- Bhattacharjee et al. (2019) Bhattacharjee P., Majumdar P., Biswas S., Joarder P. S., 2019, J. Cosmology Astropart. Phys., 2019, 028
- Biswas et al. (2017) Biswas S., Bhattacharjee P., Majumdar P., Das S., Das M., Joarder P. S., 2017, J. Cosmology Astropart. Phys., 2017, 003
- Bosma & van der Kruit (1979) Bosma A., van der Kruit P. C., 1979, A&A, 79, 281
- Brown et al. (2019) Brown A. M., Massey R., Lacroix T., Strigari L. E., Fattahi A., Bœhm C., 2019, arXiv e-prints, p. arXiv:1907.08564
- Chakraborty et al. (2019) Chakraborty A., et al., 2019, MNRAS, 487, 4102
- Charbonnier et al. (2011) Charbonnier A., et al., 2011, MNRAS, 418, 1526
- Choudhuri & Roy (2019) Choudhuri S., Roy N., 2019, MNRAS, 483, 3437
- Choudhuri et al. (2017) Choudhuri S., Bharadwaj S., Ali S. S., Roy N., Intema H. T., Ghosh A., 2017, MNRAS, 470, L11
- Chyży et al. (2011) Chyży K. T., Weżgowiec M., Beck R., Bomans D. J., 2011, A&A, 529, A94
- Colafrancesco et al. (2006) Colafrancesco S., Profumo S., Ullio P., 2006, A&A, 455, 21
- Colafrancesco et al. (2007) Colafrancesco S., Profumo S., Ullio P., 2007, Phys. Rev. D, 75, 023513
- Cook et al. (2020) Cook R. H. W., et al., 2020, MNRAS, 494, 135
- Drlica-Wagner et al. (2020) Drlica-Wagner A., et al., 2020, ApJ, 893, 47
- Frigo & Johnson (2005) Frigo M., Johnson S. G., 2005, Proceedings of the IEEE, 93, 216
- Geringer-Sameth et al. (2015) Geringer-Sameth A., Koushiappas S. M., Walker M., 2015, ApJ, 801, 74
- Ghosh et al. (2012) Ghosh A., Prasad J., Bharadwaj S., Ali S. S., Chengalur J. N., 2012, MNRAS, 426, 3295
- Hoof et al. (2020a) Hoof S., Geringer-Sameth A., Trotta R., 2020a, Supplementary Material for A Global Analysis of Dark Matter Signals from 27 Dwarf Spheroidal Galaxies using 11 Years of Fermi-LAT Observations, https://doi.org/10.5281/zenodo.2612268
- Hoof et al. (2020b) Hoof S., Geringer-Sameth A., Trotta R., 2020b, J. Cosmology Astropart. Phys., 2020, 012
- Iacobelli et al. (2013) Iacobelli M., et al., 2013, A&A, 558, A72
- Intema et al. (2017) Intema H. T., Jagannathan P., Mooley K. P., Frail D. A., 2017, A&A, 598, A78
- Jeltema & Profumo (2008) Jeltema T. E., Profumo S., 2008, ApJ, 686, 1045
- Kar et al. (2019) Kar A., Mitra S., Mukhopadhyaya B., Choudhury T. R., Tingay S., 2019, Phys. Rev. D, 100, 043002
- Kar et al. (2020) Kar A., Mitra S., Mukhopadhyaya B., Choudhury T. R., 2020, Phys. Rev. D, 101, 023015
- Koposov et al. (2015) Koposov S. E., Belokurov V., Torrealba G., Evans N. W., 2015, ApJ, 805, 130
- Laevens et al. (2015) Laevens B. P. M., et al., 2015, ApJ, 813, 44
- Martin et al. (2015) Martin N. F., et al., 2015, ApJ, 804, L5
- Martínez-Vázquez et al. (2019) Martínez-Vázquez C. E., et al., 2019, MNRAS, 490, 2183
- McConnachie (2012) McConnachie A. W., 2012, AJ, 144, 4
- McDaniel et al. (2017) McDaniel A., Jeltema T., Profumo S., Storm E., 2017, J. Cosmology Astropart. Phys., 2017, 027
- Miville-Deschênes et al. (2016) Miville-Deschênes M. A., Duc P. A., Marleau F., Cuillandre J. C., Didelon P., Gwyn S., Karabal E., 2016, A&A, 593, A4
- Natarajan et al. (2013) Natarajan A., Peterson J. B., Voytek T. C., Spekkens K., Mason B., Aguirre J., Willman B., 2013, Phys. Rev. D, 88, 083535
- Natarajan et al. (2015) Natarajan A., Aguirre J. E., Spekkens K., Mason B. S., 2015, arXiv e-prints, p. arXiv:1507.03589
- Navarro et al. (1996) Navarro J. F., Frenk C. S., White S. D. M., 1996, ApJ, 462, 563
- Profumo & Ullio (2010) Profumo S., Ullio P., 2010, arXiv e-prints, p. arXiv:1001.4086
- Regis et al. (2015) Regis M., Richter L., Colafrancesco S., Profumo S., de Blok W. J. G., Massardi M., 2015, MNRAS, 448, 3747
- Rubin et al. (1980) Rubin V. C., Ford W. K. J., Thonnard N., 1980, ApJ, 238, 471
- Sparke & Gallagher (2016) Sparke L., Gallagher J., 2016, Galaxies in the Universe
- Spekkens et al. (2013) Spekkens K., Mason B. S., Aguirre J. E., Nhan B., 2013, ApJ, 773, 61
- Steigman et al. (2012) Steigman G., Dasgupta B., Beacom J. F., 2012, Phys. Rev. D, 86
- Storm et al. (2017) Storm E., Jeltema T. E., Splettstoesser M., Profumo S., 2017, ApJ, 839, 33
- Strigari (2018) Strigari L. E., 2018, Reports on Progress in Physics, 81, 056901
- Strigari et al. (2008a) Strigari L. E., Bullock J. S., Kaplinghat M., Simon J. D., Geha M., Willman B., Walker M. G., 2008a, Nature, 454, 1096
- Strigari et al. (2008b) Strigari L. E., Koushiappas S. M., Bullock J. S., Kaplinghat M., Simon J. D., Geha M., Willman B., 2008b, ApJ, 678, 614
- Vollmann et al. (2020) Vollmann M., Heesen V., W. Shimwell T., Hardcastle M. J., Brüggen M., Sigl G., J. A. Röttgering H., 2020, MNRAS, 496, 2663
- Walker et al. (2011) Walker M. G., Combet C., Hinton J. A., Maurin D., Wilkinson M. I., 2011, ApJ, 733, L46