Candidate Lyman Continuum Sources in the GOODS Fields
Abstract
We use the wealth of deep archival optical spectroscopy on the GOODS-South field from Keck, the VLT, and other facilities to select candidate high-redshift Lyman continuum (LyC) leakers in the Hubble Deep UV Legacy Survey (HDUV) dataset. We select sources at , where the HST/WFC3 F275W filter probes only the redshifted LyC. We find five moderately F275W-bright sources (four detected at significance) in this redshift range. However, two of these show evidence in their optical spectra for contamination by foreground galaxies along the line-of-sight. We then perform an F275W error-weighted sum of the fluxes of all 129 galaxies at in both the GOODS-N and GOODS-S HDUV areas to estimate the total ionizing flux. The result is dominated by just five candidate F275W-bright LyC sources. Lastly, we examine the contributions to the metagalactic ionizing background, finding that, at the sensitivity of the HDUV F275W data and allowing for the effects of LyC transmission in the intergalactic medium (IGM), star-forming galaxies can match the UV flux required to maintain an ionized IGM at .
1 Introduction
For the past few decades, one of the most active areas of research in observational astronomy has been the identification of sources that contribute to the metagalactic ionizing background. This has been particularly important for building a cohesive picture of reionization — an important epoch in the history of the Universe in which the first galaxies formed and the bulk of hydrogen in the intergalactic medium (IGM) transitioned from neutral to ionized (e.g., Bouwens et al. 2006, 2012, 2015; Ouchi et al. 2009; Robertson et al. 2015). Massive stars and quasars/active galactic nuclei (AGN) both produce ionizing photons, though their relative importance to the global ionizing background appears to evolve over time. Most evidence currently favors a scenario in which dwarf star-forming galaxies (SFGs) are the primary driver of hydrogen reionization (Riccoti & Shull, 2000; Bouwens et al., 2006; Fontanot et al., 2007, 2014; Robertson et al., 2010, 2015; Japelj et al., 2017), while AGN contributions to the ionizing background are small until 2 – 3 (Barger et al., 2003; Bolton et al., 2005; Cowie, Barger, & Trouille, 2009; Cristiani et al., 2016; Smith et al., 2020). However, because these scenarios typically rely on an extrapolation of observed galaxy counts to faint absolute magnitudes unobtainable even in the deepest HST imaging, some authors have argued that quasars/AGN could produce a non-negligible or even dominant fraction of UV photons during the era of reionization (e.g., Fontanot et al. 2012; Madau & Haardt 2015). Of course, arguments for or against this alternate scenario depend critically on the assumed number density of AGN at high redshift, which is still a subject of significant debate (see, e.g., Giallongo et al. 2019; Cowie et al. 2020; Grazian et al. 2020 and Shin et al. 2020 for some recent analyses).
Another major uncertainty in determining the relative importance of SFGs and AGN to reionization is constraining the escape fraction , defined as the fraction of all Lyman continuum (LyC, rest frame 912 Å) photons that manage to escape their galaxy of origin to interact with the IGM. Most theoretical and semi-analytical models of reionization require an average for SFGs of about 10% or greater, if SFGs are to be the primary driver of reionization (e.g., Bolton & Haehnelt 2007; Vanzella et al. 2012a; Feng et al. 2016; Price et al. 2016; Kimm et al. 2017; see, however, Faucher-Giguère et al. 2008 and Matthee et al. 2017), though at the highest redshifts, remains largely unconstrained by observations. For sources at 4, the rising density of intervening neutral hydrogen absorption systems leads to much lower transmissivity of the IGM to LyC photons (Madau, 1995; Songaila, 2004; Inoue et al., 2014). This effectively prohibits direct detections of LyC emission (and hence estimates of ) along most sightlines at redshifts where such measurements are most needed, though some exceptions have been reported in recent years (e.g., the source Ion3 in Vanzella et al. 2018 and the source Ion1 in Ji et al. 2020). Thus, observations focused on analogous objects at slightly lower redshifts are often used to constrain the ionization history of the Universe.
Literature reports of individual or stacked LyC detections suggest that most galaxies have small values of , at most (e.g., Leitherer et al. 1995; Steidel et al. 2001; Grimes et al. 2009; Cowie et al. 2010; Leitet et al. 2013; Rutkowski et al. 2016), and that the typical escape fraction increases with redshift (e.g., Mitra et al. 2013; Fontanot et al. 2014; Faisst 2016; Khaire et al. 2016; Japelj et al. 2017). The latter observation is based on a growing number of LyC detections at (e.g., Vanzella et al. 2010b, 2012b, 2018; Mostardi et al. 2015; Grazian et al. 2016; Shapley et al. 2016; Jones et al. 2018; Steidel et al. 2018; Fletcher et al. 2019; Rivera-Thorsen et al. 2019; Saha et al. 2020), though it is now well known that direct LyC searches can be affected by contamination from foreground galaxies (e.g., the projections from Vanzella et al. 2010a or the reexamination of sources first reported in Shapley et al. 2006 by Siana et al. 2015). Stacking analyses also tend to give a relatively weak average LyC signal at these redshifts (e.g., Siana et al. 2010; Grazian et al. 2017; Rutkowski et al. 2017; Marchi et al. 2018; Naidu et al. 2018; Fletcher et al. 2019; see, however, Steidel et al. 2018).
However, some studies have suggested that particular subgroups of galaxies are more likely to have significant LyC escape. For example, moderately large Ly equivalent width in emission (e.g., Micheva et al. 2017; Marchi et al. 2018; Steidel et al. 2018; Fletcher et al. 2019) or multiply-peaked Ly line profiles (Verhamme et al., 2017; Vanzella et al., 2020) appear to be signposts of nonzero ; see, however, the confirmed LyC leaker Ion1, which shows Ly in absorption only (Ji et al., 2020). A high flux ratio of [OIII] to [OII] (O32) has also recently been proposed as an optical marker of LyC escape (e.g., Nakajima & Ouchi 2014; Izotov et al. 2016a, b, 2018; Steidel et al. 2018; Fletcher et al. 2019; Tang et al. 2019). However, this connection remains tenuous, with several studies reporting that large O32 by itself is insufficient to guarantee significant LyC escape (e.g., Reddy et al. 2016b; Izotov et al. 2017; Rutkowski et al. 2017; Naidu et al. 2018; Barrow et al. 2020).
Legacy fields like the GOODS-North and South (Giavalisco et al., 2004) tend to be especially attractive targets for LyC leaker searches, due to the abundance of deep multiwavelength imaging and thorough spectroscopic coverage. In particular, the advent of the Hubble Deep UV (HDUV) Legacy Survey (Oesch et al., 2018) has now made it possible to perform direct photometric searches for LyC leakers at high redshift. Using the HDUV’s deep HST/WFC3 imaging in the F275W and F336W bands, Naidu et al. (2017) identified six candidate LyC sources in the GOODS fields at , all with 13%. However, at the redshifts probed by Naidu et al. (2017), the Lyman break sits squarely in the middle of the F275W bandpass. Since both ionizing and non-ionizing photons contribute to each object’s F275W photometry, a number of modeling assumptions are needed to sift out the contribution of just the LyC to the F275W flux.
However, if one were to push to slightly higher redshifts, say , as we did in the GOODS-N in Jones et al. (2018), then the F275W filter becomes sensitive to LyC photons only. In that work, we identified a raw total of six sources with spectroscopic redshifts that remained bright in F275W. However, four of these were then shown via optical spectroscopy to be line-of-sight blends of low- and high-redshift galaxies.
In this paper, we turn our attention to the GOODS-S, using the wealth of optical/IR spectroscopy in this field in concert with deep F275W imaging from the HDUV survey, to search for individual candidate LyC-leaking galaxies at 2.35. We place constraints on the mean LyC signal at this redshift using an averaging analysis and on the contributions to the overall ionizing luminosity density from SFGs. In Section 2, we describe the data we used to select and characterize potential high-redshift LyC leakers, including optical/IR redshift catalogs and spectra, and UV, X-ray, and optical imaging. We present our search for individual candidate LyC leakers in Section 3 and discuss the properties of our candidate sources, along with evidence for or against contamination by foreground galaxies for each. In Section 4, we perform an averaging analysis of all sources with F275W coverage in the GOODS-N, in the GOODS-S, and in the two fields combined, from which we measure their total F275W contributions. In Section 5, we stack the F275W and F336W images for each GOODS field and for the two fields combined—first for , and then for three redshift bins for the combined images to look for differences that might arise due to “dilution” from Lyman absorption along the line-of-sight, which increases with redshift. In Section 6, we estimate the metagalactic ionizing background at and compare to the flux required to maintain an ionized IGM at these redshifts. Finally, we summarize our findings in Section 7.
We assume = 0.3, = 0.7, and = 70 km s-1 Mpc-1 throughout this work. All magnitudes are given in the AB system; magnitude zero-points for the HDUV F275W and F336W observations are given in Oesch et al. (2018).
2 Data
2.1 F275W Imaging
The HDUV survey (GO13872; Oesch et al. 2018) is a 132-orbit WFC3 imaging program centered on the GOODS-North and South fields. Designed to capitalize on existing WFC3/UVIS imaging from the CANDELS (Grogin et al., 2011; Koekemoer et al., 2011) and UVUDF (Teplitz et al., 2013; Rafelski et al., 2015) programs, the HDUV survey imaged both of the GOODS fields in the F275W and F336W filters around or within the existing CANDELS and UVUDF footprints.
We focused on the HDUV GOODS-N dataset in Jones et al. (2018). Here we focus on the HDUV GOODS-S dataset, which includes one science image per filter and corresponding maps of the per-pixel rms, all drizzled to a 60 mas pixel resolution. The final HDUV images incorporate data from the UVUDF survey, which substantially deepens this region of the field. We do not include data from the region of the CDF-S field observed by the Early Release Science (ERS; Windhorst et al. 2011). This area is almost a magnitude shallower in F275W than the regions that we use, and it contains significantly more artifacts; thus, we are unable to construct a high-significance magnitude sample for that region.
When measuring our F275W fluxes (see Section 3.1), we smoothed the F275W and F336W images using the scipy.ndimage.gaussian_filter function with a standard deviation of 2 to minimize the impact of residual noise on our measurements, though as we will show, these residuals still contribute significantly to our flux uncertainties.
2.2 Optical/NIR Spectroscopy
Secure spectroscopic redshifts are required for reliable identification of LyC-leaking candidates, as photometric redshift estimates and by-eye inspections are frequently contaminated by galaxies along the line-of-sight (e.g., Vanzella et al. 2010a; Siana et al. 2015; Jones et al. 2018). We therefore narrow our search only to those galaxies with robust spectroscopic redshifts between 2.35 and 3.05. At the lower redshift bound, the Lyman limit sits at 3055.2 Å, at which point the total throughput of the F275W filter has declined to 2.3% on the red side. Adopting a slightly stricter redshift minimum of , at which point the Lyman limit sits at 3073.4 for a total F275W throughput of 1%, does not remove any of our candidates, nor does it substantially change the results of our stacking analyses in Section 4.
Similarly, the upper redshift bound relates to the wavelength at which the F336W filter probes only the redshifted LyC. Although we considered F275W-bright candidates with redshifts up to in the GOODS-N in Jones et al. (2018), in this work we use as the upper redshift bound in both the GOODS-N and GOODS-S subsamples for consistency. In principle, ionizing sources at could also be detected in F336W using the methods described below, though the rapidly increasing opacity of the IGM to LyC photons at would make such a search somewhat more difficult (e.g., Inoue et al. 2014). Since the LyC is redshifted fully into the F275W bandpass at , the deep and relatively wide F275W coverage provided by the HDUV survey enables us to search for potential sources of ionizing radiation at high redshift.
We consulted spectroscopic catalogs from the literature (Popesso et al. 2009; Balestra et al. 2010; Cowie et al. 2012; Kurk et al. 2013; Morris et al. 2015; Bacon et al. 2017; Inami et al. 2017; Pentericci et al. 2018; Barger et al. 2019; Urrutia et al. 2019), along with unpublished spectra that we have obtained with Keck/DEIMOS, to identify sources in the GOODS-S in the redshift range of interest. We limited ourselves to objects with redshifts marked as high-quality/confidence by the respective authors. For example, we only included spectroscopic redshifts from the MUSE-Deep and MUSE-Wide surveys that are flagged as confidence level 3, which represent unambiguous, multiple-line detections (for MUSE-Deep; Bacon et al. 2017 and Inami et al. 2017) or identifications with “very high certainty” (for MUSE-Wide; Urrutia et al. 2019).
2.3 X-ray Imaging
To identify X-ray counterparts to our F275W sample (see Section 3.1) and to weed out probable AGN, we used X-ray data and catalogs from the 7 Ms Chandra X-ray Observatory exposure of the Chandra Deep Field-South (Luo et al., 2017), which reaches a limiting flux of erg cm-2 s-1 near the image center. There are 95 F275W sources with X-ray counterparts within a 15 search radius. We computed the rest-frame 2 – 8 keV luminosities, , of these counterparts from the 0.5 – 2 keV fluxes with an assumed and no absorption correction using
| (1) |
Of the sources with X-ray counterparts, four have erg s-1, which classifies them as AGN. One of these is a BALQSO. However, none of our candidate high-redshift LyC-leaking sample (defined below) have X-ray counterparts.
3 Search for Individual Candidate LyC Leakers in the GOODS-S
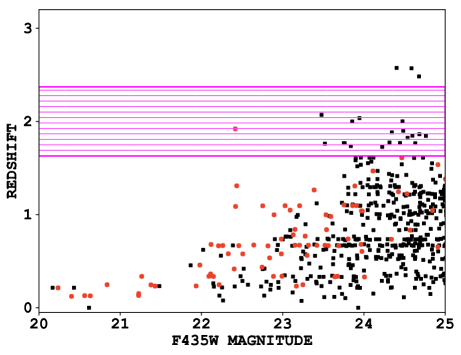
Jones et al. (2018) describes our search for LyC-leaking candidates in the HDUV GOODS-N field. In the GOODS-S, we begin with all F850LP 26 galaxies that are covered by the 43.5 arcmin2 footprint of the HDUV observations. This area lies entirely within the GOODS-S observations of Giavalisco et al. (2004) obtained with HST’s Advanced Camera for Surveys (ACS). At 2.5, the ACS F850LP filter probes the rest-frame FUV at 2500 Å, providing a reasonable selection of star-forming galaxies at these redshifts. In the top panel of Figure 1, we plot redshift versus F435W magnitude for this area. Spectroscopic identifications are 97% complete below F435W = 24, 85% from F435W = 2424.5, and 63% from F435W = 24.525.
3.1 F275W Measurements in the GOODS-S
Using the Python Source Extraction and Photometry (SEP) library111https://github.com/kbarbary/sep (Barbary, 2016), which is based on the SExtractor program of Bertin & Arnouts (1996), we measured F275W fluxes in and diameter apertures at the position of each F850LP 26 source with UV coverage. We also estimated the local median background at each source position in a diameter annulus and subtracted this from the aperture fluxes. Comparing background-subtracted small- and large-aperture magnitudes (for extended objects with F275W , to avoid saturated or low S/N sources) reveals a median offset of -0.18 mag, which we added back to the magnitudes as an aperture correction.
We initially measured magnitude errors in apertures from the associated rms noise files, with the same -0.18 mag aperture correction applied. However, this resulted in the selection of objects that, though they are detected nominally at moderate () significance in F275W, appeared to be pure noise upon visual inspection.
To estimate the effect of residual noise in the science maps on our flux measurements, we performed the same aperture photometry methods described above at 10,000 random positions across the HDUV field in both the F275W science and rms images, with the same smoothing applied for consistency with our source flux measurements. If we were to use only the rms image to determine uncertainties, we would underestimate the true noise by a factor of 2. This translates to an offset of -0.376 mag, which we added to our initial magnitude errors.
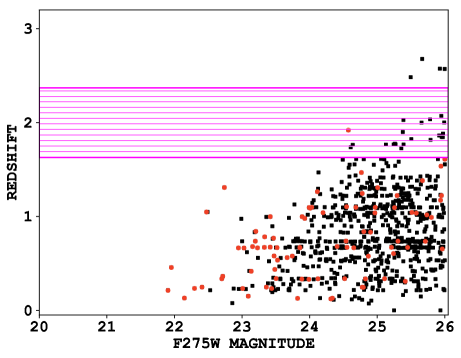
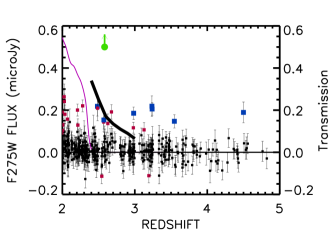
Our primary UV sample consists of 1115 sources with F275W magnitudes brighter than 26 and total errors fainter than 27.19, corresponding to a detection. In the bottom panel of Figure 1, we show redshift versus F275W magnitude for this sample. Spectroscopic identifications are nearly fully complete to F275W = 24.5 (with only two sources out of 248 missing or unidentified), 92% complete from F275W , and 57% complete from F275W . The rapid drop-off in spectroscopic completeness at fainter UV magnitudes is a major motivation for our F275W = 26 cutoff, even though one might expect the number of candidate LyC leakers to increase at very faint UV magnitudes. We have four LyC-leaking candidates in the redshift range from this selection.
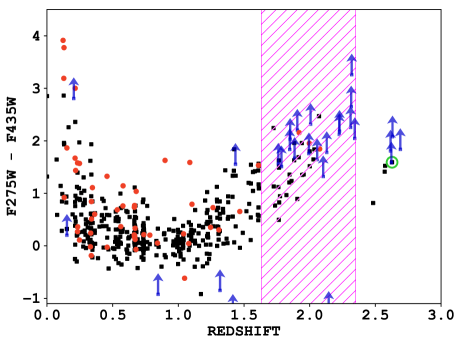
Requiring a detection in F275W at the depth of the HDUV imaging will necessarily miss UV-fainter sources that otherwise may merit further consideration as LyC-leaking candidates. We therefore used the following color selection as a secondary way of selecting potential LyC leakers. We required (1) F435W 25; (2) F606W F850LP 1 mag; and (3) F275W signal-to-noise ratio (SNR) 2. The first condition ensures that this color-selected sample remains fairly spectroscopically complete, while the other conditions select sources with at least marginal F275W detections and relatively flat rest-frame, non-ionizing UV continua. As shown in Figure 2, this selection yields four candidates above our minimum redshift threshold, three of which were already selected directly using our criterion. The remaining source (enclosed in the green circle in Figure 2) is detected at 2.6 in F275W.
In summary, we have identified five candidate high-redshift LyC leakers in the redshift range in the GOODS-S, four of which are detected at significance in F275W. With a total of 46 sources with UV coverage and secure redshifts in the redshift range, this leads to a raw success rate in identifying candidate LyC-leaking galaxies. However, after removing two candidates contaminated by foreground galaxies (see Section 3.2), this success rate drops to .
|
|
|
|
|
|
|
|
|
|
3.2 Five Candidate LyC Leakers in the GOODS-S
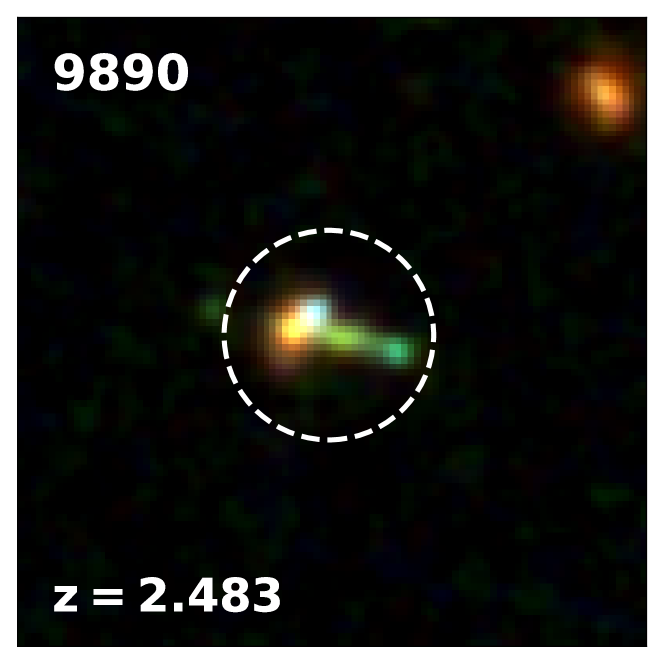
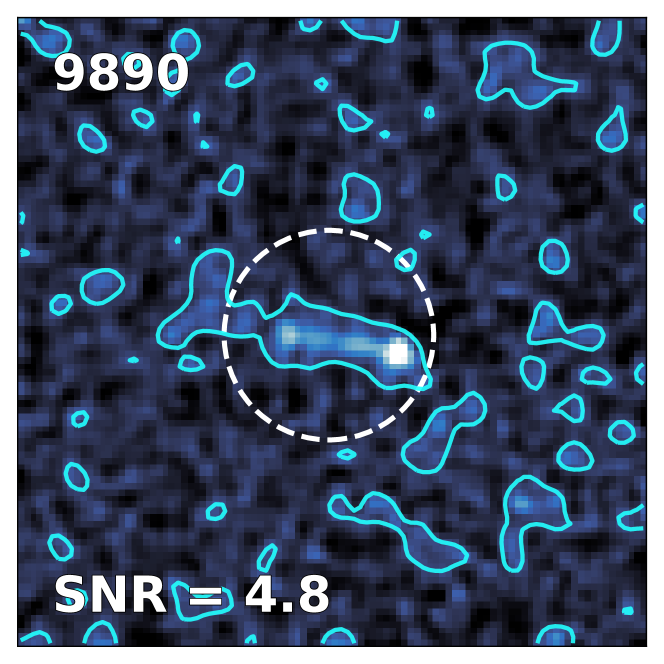
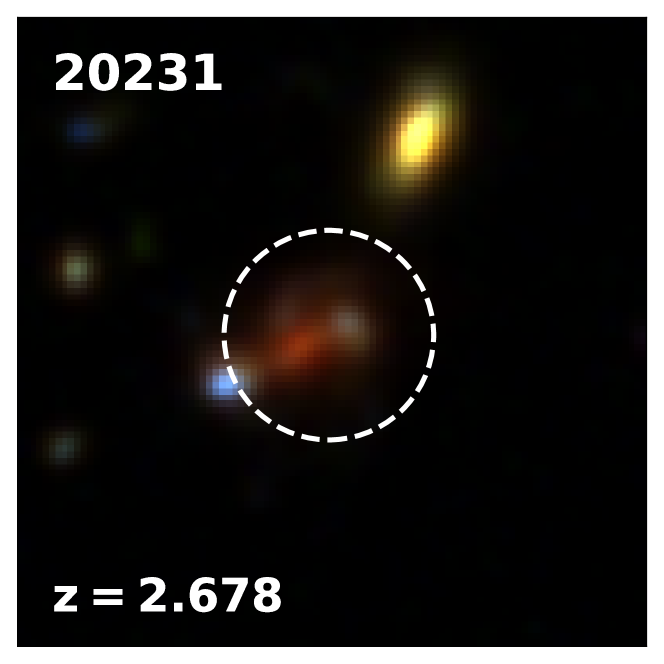
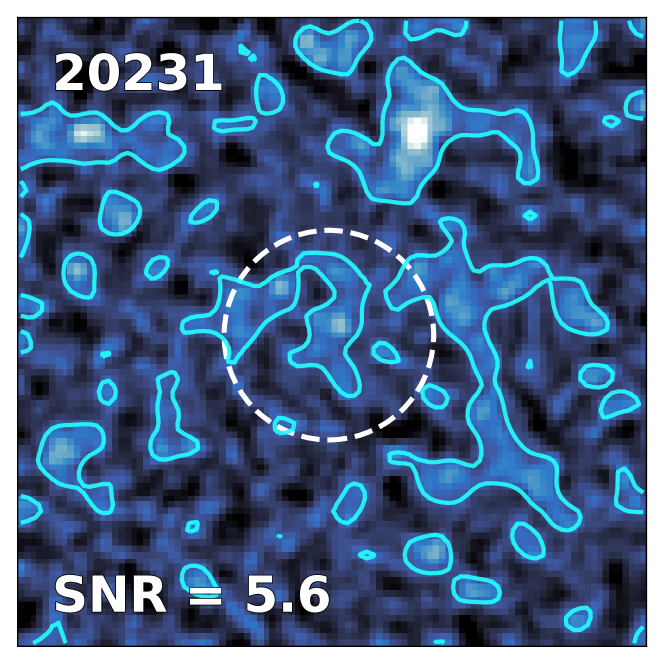
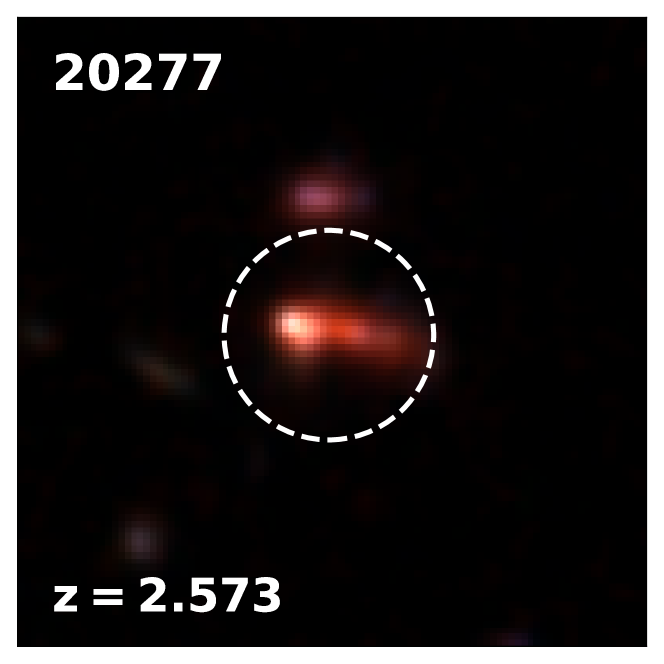
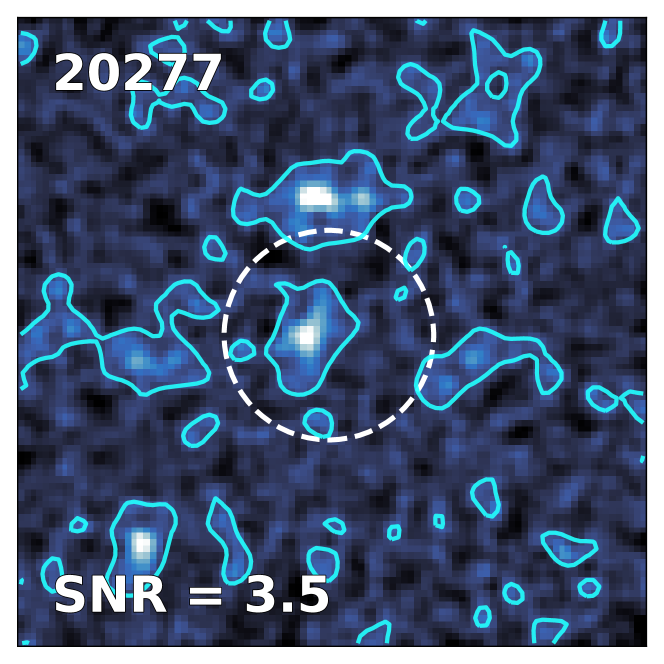
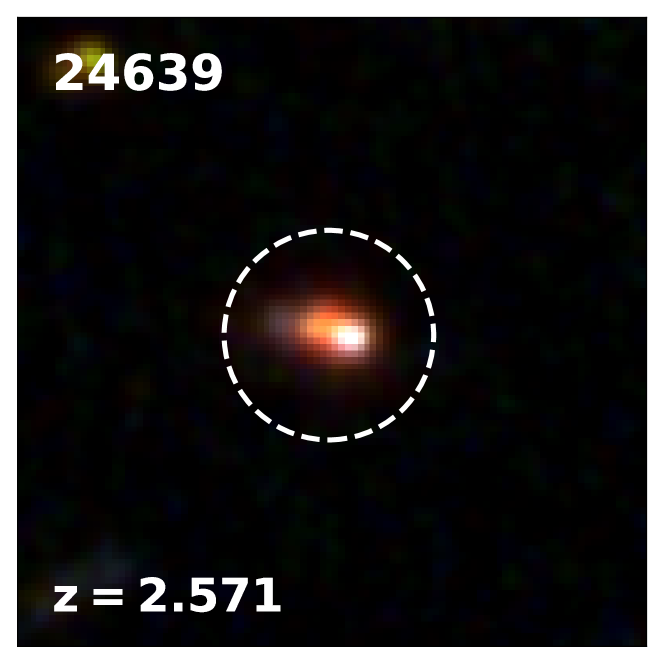
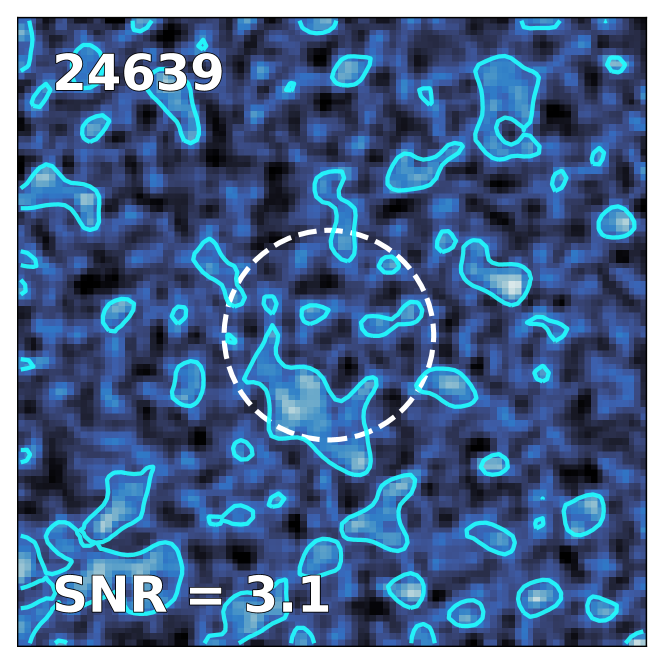
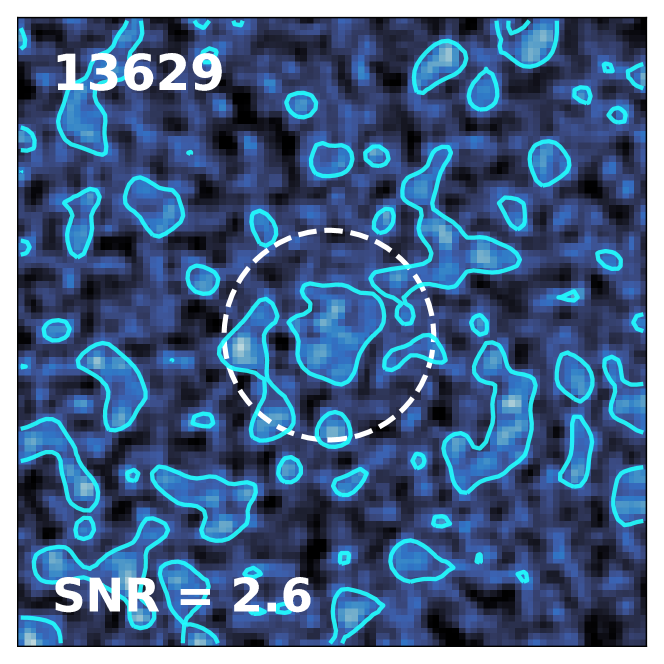
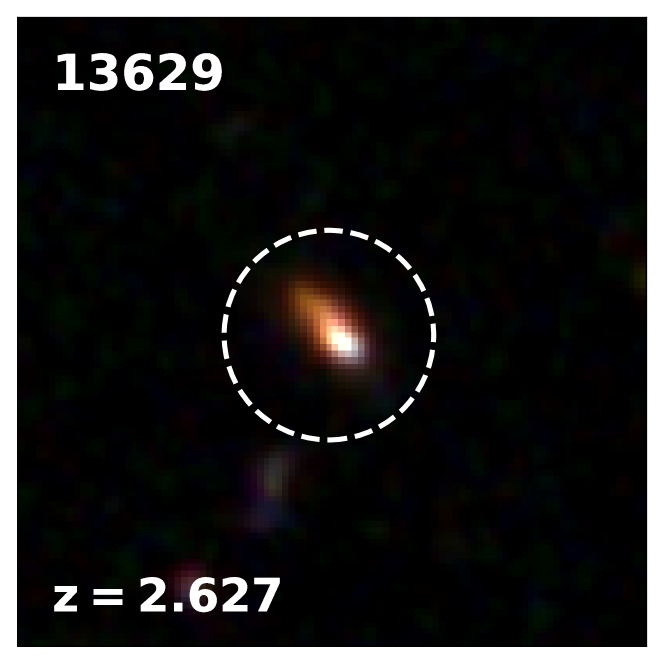
In Table 1, we list the basic properties of our five candidate LyC leakers in the GOODS-S. This includes an ID number, identical to those given in Table 3 of Guo et al. (2013); decimal coordinates; a spectroscopic redshift from ground-based observations; the F275W magnitude and error (including the -0.18 mag aperture correction and -0.376 mag noise correction); F435W magnitude; and F606W – F850LP color. In Figure 3, we show both a three-color thumbnail (left; red = F160W, green = F850LP, blue = F435W) and the F275W thumbnail (right) of each source.
Summary of Candidate LyC Leakers
| IDa | R.A. | Dec. | F275W (Error) | F435W | F606W – F850LP | |
|---|---|---|---|---|---|---|
| 98901 | 53.096661 | -27.772339 | 2.483 | 25.50 (27.21) | 24.68 | 0.57 |
| 202312 | 53.157532 | -27.798981 | 2.678 | 25.67 (27.54) | 25.49 | 0.33 |
| 202773 | 53.157845 | -27.814756 | 2.573 | 25.93 (27.30) | 24.40 | 0.39 |
| 246393 | 53.188301 | -27.829344 | 2.571 | 26.00 (27.22) | 24.58 | 0.21 |
| 136291 | 53.118439 | -27.805323 | 2.627 | 26.18 (27.24) | 24.59 | 0.16 |
Although we selected our candidates to have high-quality spectroscopic redshifts from , the optical spectra for two sources (objects 9890 and 20277 in Table 1) show evidence of an intermediate redshift galaxy along the line-of-sight to the high-redshift galaxy. In source 9890, this is betrayed by the presence of an [OIII]/H complex at . In source 20277, we see a strong [OII] doublet at . At these intermediate redshifts, the F275W filter probes the rest-frame FUV at Å, well above the Lyman limit. The UV fluxes for these two sources are almost certainly dominated by the foreground galaxies and hence cannot be used to measure the ionizing flux output at .
We note that these contaminated galaxies, particularly object 9890, reinforce the need for deep optical and NIR spectroscopy to confirm the nature of any proposed LyC leakers. In the case of object 9890, the photometric redshift without HDUV data (; Momcheva et al. 2016) is more consistent with the spectroscopic redshift of the foreground, low-redshift galaxy. Yet once the HDUV data are included, the photometric redshift better matches the spectroscopic redshift of the background galaxy (; Oesch et al. 2018), meaning a selection based only on photometric redshifts would falsely label this source as a LyC leaker.
We now briefly discuss our remaining three candidate LyC leakers in the GOODS-S and the foreground contamination rate in our overall candidate sample. First, three distinct components are seen in the three-color thumbnail for source 20231 (upper-right of Figure 3): a generally red galaxy with two clumps, both of which are at almost-identical spectroscopic redshifts (R. Bacon, private communication), though it is unclear whether they constitute a single galaxy or an interacting pair. In any case, the F275W flux is not coincident with the blue clump to the southeast, but instead with the relatively red knot of emission near the image center.
Second, in source 24639 (middle-right of Figure 3), the F275W emission is offset from the position of the non-ionizing flux from this galaxy by , which corresponds to about 6.4 proper kpc at . Though regions of LyC escape may not always be fully coincident with the bulk of the stellar emission, the lack of non-ionizing flux at the position of the F275W emission in this source is unusual. We do not remove this object from the list of LyC candidates, but in subsequent sections we note the effects of excluding it from our calculations.
Third, there is a similar off-center clump of F275W emission to the east of source 13629. However, unlike the case for source 24639, object 13629 also shows hints of F275W emission coincident with the position of the non-ionizing flux from this galaxy.
To estimate the expected level of foreground contamination, we ran Monte Carlo simulations to randomize the positions of all galaxies in the HDUV GOODS-S field, regardless of redshift identification or F275W magnitude. This assumes a spatially uniform foreground F275W population with a surface density of around 486,900 deg-2 (the number of galaxies within the HDUV GOODS-S footprint divided by its 43.5 arcmin2 area), similar to the assumptions in Vanzella et al. (2010a). For a sample size of 5, at least one galaxy is contaminated in 27% of our 500 simulations, with a mean of 0.3 0.6 contamination events. This is consistent with expectations from a simple binomial probability distribution, in which the probability of any single contamination event is proportional to the source surface density and the aperture size (Nestor et al., 2013). For the surface density given above and an aperture of radius 1″, an average of 0.48 0.66 contamination events are expected in a sample of size 5.
Finally, we must also be concerned about the limitations of our sample selection in that we are only using sources with known spectroscopic redshifts. As we have argued above, it is dangerous to use photometric redshifts, which may be biased against continuum leakers, and where sources with incorrect high redshifts may also result in incorrect high fluxes. However, we have inspected the 185 SFGs that would be placed in the = 2.35 – 3.05 redshift range by the Straatman et al. (2016) catalog of photometric redshifts in the field and do not have spectroscopic redshifts. These have only two F275W detections and no significant total signal (Jy).
Although the apparent offsets between the ionizing and non-ionizing radiation in some of these sources (particularly object 24639) are peculiar, we retain all of these objects as candidate LyC leakers. We emphasize that an absence of evidence for contamination by foreground galaxies does not equate to positive evidence that such foreground contaminants are absent. For this reason and out of an abundance of caution, we assert that our three remaining sources in the GOODS-S should only be considered LyC-leaking candidates.
4 Mean ionizing emission from an averaging analysis using both GOODS fields
In addition to searches for individual LyC leakers, the depth and breadth of UV coverage offered by the HDUV data enable a robust measurement of the “typical” ionizing flux output of galaxies via averaging.
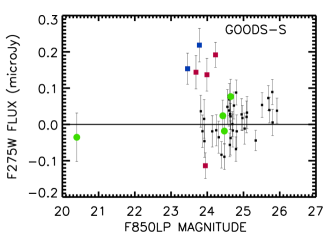
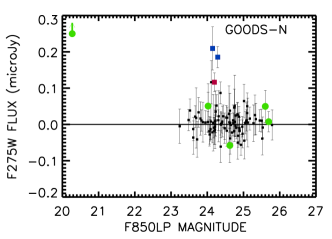
We select all galaxies with high-quality spectra that lie within the F275W footprint of the HDUV survey in both GOODS fields. For each field and band subsample, we applied the same photometric procedure that we used in our search for individual candidate LyC leakers in Section 3.1 in order to determine the flux and error for all the sources, including those not detected individually. In Figure 4, we show F275W flux versus F850LP magnitude for our F275W subsamples in the GOODS-S and the GOODS-N.
We next excluded sources with X-ray counterparts and sources whose spectra clearly include emission features from a line-of-sight foreground contaminant. The X-ray non-detection criterion precludes any major contributions from AGNs to our stacks. For the GOODS-S, we use the 7 Ms Chandra Deep Field-South catalog (Luo et al. 2017; see Section 2.3). For the GOODS-N, we use the 2 Ms Chandra Deep Field-North catalog (Alexander et al. 2003; Xue et al. 2016). We also searched for any objects with very nearby () projected neighbors that might affect our aperture flux measurements, but we did not find any. Our upper redshift bound is approximately the redshift at which the F336W filter begins to probe only rest-frame wavelengths Å.
We then computed the error-weighted mean flux of all the sources in each subsample and multiplied that value by the number of sources in the subsample. Because the flux errors for our sources are very similar to one another, this is quite similar to computing an unweighted sum. In the GOODS-S, this selection yielded 38 sources. In the GOODS-N, where the areal coverage in F275W is wider than in F336W, this yielded 91 sources with F275W coverage and 69 sources with coverage in both bands. In Table 2, we summarize the measured properties for the individual and combined GOODS fields.
In the GOODS-S, the overwhelming majority of the total contribution at F275W (0.46 Jy of 0.51 Jy) comes from the three candidate LyC leakers listed in Table 1. If we remove individual candidates from the stack (specifically, source 24639, which appears to have no non-ionizing emission coincident with its F275W detection), the total F275W flux drops to 0.42 Jy, of which 0.32 Jy is attributable to the remaining two candidates. Removing all three candidates from the stack reduces the error-weighted mean to 0.002 0.006 Jy, giving a total contribution of only 0.070 0.21 Jy.
Properties of the Error-Weighted Summed Fluxes
| Field | F275W | (SNR) | F336W | (SNR) |
|---|---|---|---|---|
| (Jy) | (Jy) | |||
| GOODS-S | 0.51 | (2.3) | 2.83 | (21) |
| GOODS-N | 0.52 | (1.5) | 6.74 | (23) |
| Both | 1.00 | (2.5) | 9.10 | (30) |
In order to check the background, we randomized the positions of the GOODS-S subsample and measured the magnitudes at these positions. We then processed the sample in the same way as the real sample, i.e., by eliminating low redshift sources, X-ray sources, or very nearby bright neighbors. We measured 120 random samples and found a mean background of 0.070 0.023 Jy, which is negligible compared with the measured value in the real sample. 15% of the random samples had mean backgrounds that exceeded the total contribution of the real sample, which may suggest that we are slightly underestimating the true noise. However, it should be emphasized that we did not carefully curate the random samples in the same way that we did the real sample, and, thus, we may have a higher degree of unrecognized foreground contamination, which could result in an overly large dispersion.
Despite the greater number of sources in the GOODS-N, the total contribution at F275W is similarly small at just 0.52 Jy. As with the GOODS-S, a large fraction of the total contribution comes from just a small number of sources; here % (0.21 Jy) is attributable to just two sources. These are GN-UVC-6, a color-selected LyC-leaking candidate at that we discussed in Jones et al. (2018) (a detection in F275W), and a galaxy with an F275W magnitude of 26.21 (an detection). The latter object was not discussed in Jones et al. (2018), because we considered only high-redshift objects detected at significance in constructing our F275W sample, and the source also did not turn up in our color-selected sample, which probed to lower significance. In any case, this leaves 0.3 Jy of F275W unaccounted for, which must come from the remaining 89 sources.
Finally, if we combine the two fields, we calculate a total contribution of 1.00 0.41 Jy at F275W, of which about 0.67 Jy is directly attributable to the five LyC-leaking candidates discussed above (3 in the GOODS-S and 2 in the GOODS-N). Removing an individual candidate from this calculation (specifically source 24639, for the reasons mentioned in Section 3.2) does not substantially change this result: the remaining 128 galaxies combined contribute 0.87 0.39 Jy, of which 0.53 is directly attributable to the remaining candidates. Given the error on the total contribution, both cases are consistent with the remainder of our sample contributing little or nothing to the overall ionizing flux output at .
 |
|
 |
 |
 |
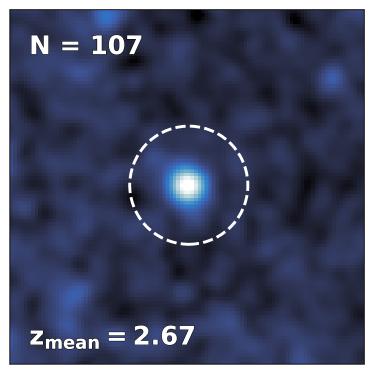 |
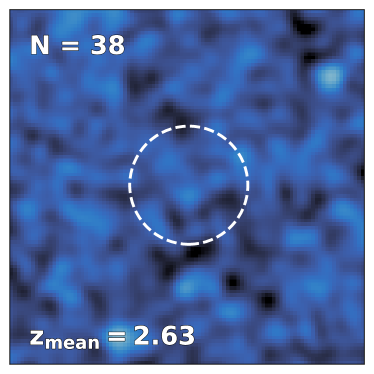
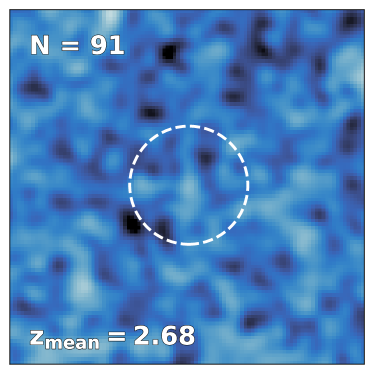
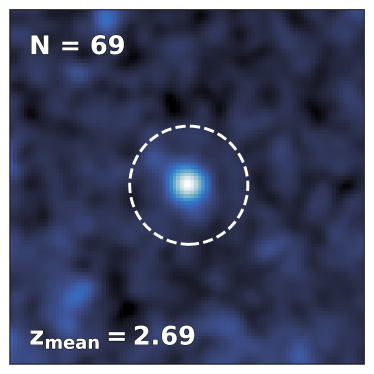
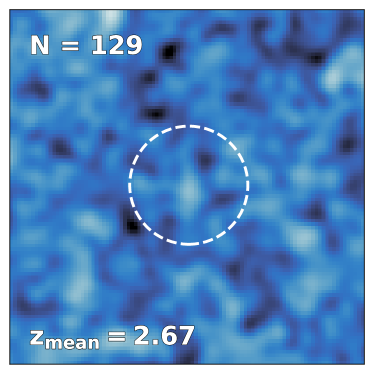
5 An Image stacking visualization in both GOODS fields
For visualization purposes, in Figure 5, we show stacked images in each band for the sample in each GOODS field, as well as for both fields combined. Bright points more than 1″ away from the image center (for example, the bright spot to the upper right in the first row of Figure 5) are likely foreground galaxies with significant F275W flux, though these do not affect our measurements at . Most of our candidate LyC leakers across both fields lie at , just above our redshift threshold of 2.35. At higher redshifts, it is increasingly likely that a Lyman limit system along some line-of-sight will wipe out any emergent ionizing flux, leading to a greater number of non-detections (see Section 6). Because of this, it is possible that including sources at the higher-redshift end of the range we probe here in the stacks could “dilute” some underlying average signal from sources at the lower-redshift end.
To test this, we broke apart our stacks for the combined GOODS fields into three redshift bins, each with equal numbers of galaxies, and performed the same analysis. At F275W, we found nondetections in all three redshift bins. This suggests that the “dilution” does not affect our ability to detect possible LyC-leaking galaxies at the depth of the HDUV F275W data. Meanwhile, the stacked detection in F336W remains fairly strong in all three redshift bins, dropping from SNR = 21.6 in the lowest-redshift bin to SNR = 5.7 in the highest, where most of the band now probes the rest-frame Lyman continuum.
In summary, we are left with (1) a handful of candidate LyC-leaking galaxies that appear to be individually detected at moderate significance (at the level), and (2) a general population of galaxies that are essentially invisible at LyC wavelengths, even in stacked images. This has some parallels to the results of the LACES program (Fletcher et al., 2019), which used deep WFC3/UVIS imaging in F336W of the SSA22 field to search for LyC leakers that are also Ly emitters and Lyman break galaxies. While they successfully detect significant LyC flux in of their targets, the majority of their sources (42 of 54) are faint in F336W (SNR 4). Stacking these non-detections yielded no net signal, with an upper limit of F336W = 31.8 (3 in a 0.12″aperture). This led the authors to conclude that detection of LyC emission in their sample is dichotomous, occurring either fairly strongly in individual sources or not at all.
However, we note two important differences in methodology that distinguish this work from Fletcher et al. (2019). First, their high success rate in identifying LyC leakers (for comparison, we have a success rate in the GOODS-S—that is, three candidates out of 46 total sources with robust redshifts in the range and with UV coverage) can be attributed largely to (1) the depth of their F336W exposures compared to the typical depth of an HDUV pointing (30 mag at 3 in a 012 diameter aperture in LACES vs. 27.5 mag at 5 in a 04 diameter aperture in HDUV), and (2) the higher throughput in F336W compared to F275W, which partially offsets the rising opacity of the IGM to LyC photons at . Second, their HST/WFC3 followup was highly targeted, focusing on a set of sources that were already known to have high Ly equivalent widths and large O32—both of which may correlate with LyC escape (Nakajima & Ouchi, 2014; Izotov et al., 2016a, b, 2018; Micheva et al., 2017; Marchi et al., 2018; Steidel et al., 2018). In contrast, the sample presented here is virtually blind to such selection effects, since we require only that a source be reasonably bright in F275W and that it have a spectroscopic redshift.
6 Contributions to the Metagalactic Ionizing Background
Determining the absolute escape fraction for each of our candidate LyC leakers is challenging, if not impossible, without reliable knowledge of each source’s intrinsic spectral energy distribution (SED) and degree of reddening. Instead, we consider the extent to which our candidate sample contributes to the metagalactic ionizing background. To do so, we combine the GOODS-N and the GOODS-S data. Excluding the spectroscopically contaminated sources, we have a total of 129 SFGs together with 9 AGNs based on the X-ray properties. We have identified six ofthese as candidate LyC leakers. These consist of a single quasar (the LyC-luminous source GN-UVC-1 from Jones et al. 2018) and the five SFGs described in Section 4. GN-UVC-1 dominates the flux in the two fields with a F275W flux of 2 Jy, roughly twice the contribution of all of the SFGs even when including the candidate LyC leakers ( Jy). The remaining AGNs contribute only an insignificant total of 0.096 Jy. Because of the sparseness of the luminous AGNs, the fields are too small to make an accurate estimate of the AGN contributions, and we focus solely on the SFGs.
We converted each SFG’s F275W flux density to an ionizing volume emissivity, , defined as the luminosity density at 900 Å per unit frequency, divided by the comoving survey volume based on (1) the total survey area in F275W (131 arcmin2) and (2) the redshift bounds . We simplified our calculations by assuming that the entirety of each SFG’s F275W flux falls at the filter’s effective wavelength of Å, or rest-frame 750 Å. We further assumed that the emergent SEDs of these galaxies are flat in frequency space (i.e., f with ) both blueward and redward of 912 Å, albeit with different amplitudes on each side of the Lyman limit. While a shallower spectral slope at Å may be more plausible, the assumption of a spectrally flat LyC allows us to use our measured flux densities “as-is”, without the need for scaling to 900 Å, which would only increase our calculated values of . This assumption thus allows us to remain as conservative as possible when estimating the ionizing emissivities.
Intergalactic transmission losses are substantial for the higher redshift galaxies seen in the F275W band, and these losses need to be taken into account in computing the ionizing emissivity. Below the LyC wavelength, the opacity is dominated by sources with column densities near the Lyman limit ( cm-2). Because the number of absorbing systems is small, there is a wide variation in the mean flux in the F275W filter, after intergalactic absorption, relative to the galaxy flux at rest-frame 900 Å (e.g., Inoue et al. 2014 and references therein). The transmission also drops rapidly with increasing galaxy redshift as the intergalactic path length increases.
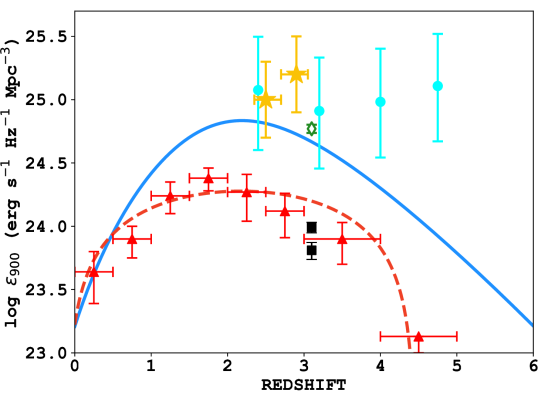
In order to compute the transmission correction, we ran Monte Carlo simulations, assuming the number of systems per unit is a power law with index , and the number of Lyman limit systems with per unit is given by the analytic form of Songaila & Cowie (2010). In Figure 6, we show the mean flux in the F275W filter relative to the galaxy flux at rest-frame 900 Å versus redshift, which drops from 0.37 at to 0.065 at . Because of this rapid drop in the mean transmission, we have chosen to divide the sample into two redshift intervals in computing the corrected emissivity. We find a logarithmic value for of erg s-1 Hz-1 Mpc-3 in the – 2.7 interval and erg s-1 Hz-1 Mpc-3 in the – 3.05 interval. Removing source 24639 from our calculation in the lower-redshift interval decreases the value of log by about 0.15 dex.
The bulk of our ionizing flux () comes from the five SFGs, with the remaining galaxies contributing only a small fraction. This is consistent with the results of Smith et al. (2018, 2020), who do not detect significant LyC emission in their own stacking analyses. This bimodality may be caused by favorable lines-of-sight through the ISM of the host galaxy (e.g., Cen & Kimm 2015) and/or the IGM rather than by the intrinsic galaxy properties, with the small number of candidate LyC leakers corresponding to lines-of-sight with low IGM absorption. Even at , 14% of the lines-of-sight have % transmission in the F275W filter, and only 30% of the lines-of-sight have transmission above 50%, while at , 48% of the lines-of-sight have % transmission in the F275W filter, and only 5% of the lines-of-sight have transmission above 50%. This is consistent with the redshift distribution of the candidate LyC leakers (Figure 6), four of which lie in the lower-redshift interval ().
In Figure 7, we summarize the results of our calculations and put them into context using other measurements of the ionizing background from the literature. The level of ionizing volume emissivity that we estimate from the SFGs is roughly consistent with other recent estimates, such as that of Steidel et al. (2018) at slightly higher redshifts. It is above the AGN ionizing output measured by Cowie, Barger, & Trouille (2009), Haardt & Madau (2012), and Micheva et al. (2017) in large samples of quasars and broad-line AGNs at similar redshifts. Becker & Bolton (2013) used Ly forest observations to infer the total ionizing background from . At , they estimated a nominal log erg s-1 Hz-1 Mpc-3, which is comparable to our estimates of for the SFG ionizing background at these redshifts. However, we emphasize that there may be further contamination in our sample by intervening sources that we have not identified. Hence, the present values should be considered as upper limits.
7 Summary
We have presented a search for candidate LyC leakers at in the GOODS-S field using a combination of deep HST/WFC3 F275W imaging data from the HDUV survey (Oesch et al., 2018) and extensive optical/NIR spectroscopy. We found four candidate ionizing sources brighter than F275W , plus one additional source just below this cutoff with very blue rest-frame UV colors. However, two of these five sources are contaminated by foreground lower redshift galaxies, as seen in their optical spectra, leaving only three possible candidate LyC leakers.
We performed an averaging analysis of all the sources with spectroscopic redshifts in the HDUV areas in both the GOODS-S and GOODS-N and found that the total ionizing output of galaxies at these redshifts is dominated by just five individual candidate LyC leakers. These include the three GOODS-S sources described above, and two sources in the GOODS-N (one of which was presented in Jones et al. 2018). Allowing for the very substantial effects of intergalactic absorption, we found that the volume ionizing flux roughly matches that required to ionize the IGM at these redshifts (Becker & Bolton 2013) and is consistent with other recent estimates.
References
- Alexander et al. (2003) Alexander, D. M., Bauer, F. E., Brandt, W. N., et al. 2003, AJ, 126, 539
- Bacon et al. (2017) Bacon, R., Conseil, S., Mary, D., et al. 2017, A&A, 608, A1
- Balestra et al. (2010) Balestra, I., Mainieri, V., Popesso, P., et al. 2010, A&A, 512, A12
- Barbary (2016) Barbary, K. 2016, JOSS, 1, 58
- Barger et al. (2003) Barger, A. J., Cowie, L. L., Capak, P., et al. 2003, ApJ, 584, L61
- Barger et al. (2019) Barger, A. J., Cowie, L. L., Bauer, F. E., & González López, J. 2019, ApJ, 887, 23
- Barrow et al. (2020) Barrow, K. S. S., Robertson, B. E., Ellis, R. S., et al. 2020, ApJ, 902, 39
- Becker & Bolton (2013) Becker, G. D. & Bolton, J. S., 2013, MNRAS, 436, 1023
- Bertin & Arnouts (1996) Bertin, E. & Arnouts, S. 1996, A&ASupplement, 117, 393
- Bolton et al. (2005) Bolton, J. S., Haehnelt, M. G., Viel, M., & Springel, V. 2005, MNRAS, 357, 1178
- Bolton & Haehnelt (2007) Bolton, J. S. & Haehnelt, M. G. 2007, MNRAS, 382, 325
- Bouwens et al. (2006) Bouwens, R. J., Illingworth, G. D., Blakeslee, J. P., & Franx, M. 2006, ApJ, 653, 53
- Bouwens et al. (2012) Bouwens, R. J., Illingworth, G. D., Oesch, P. A., et al. 2012, ApJ, 752, L5
- Bouwens et al. (2015) Bouwens, R. J., Illingworth, G. D., Oesch, P. A., et al. 2015, ApJ, 811, 140
- Bouwens et al. (2015) Bouwens, R. J., Illingworth, G. D., Oesch, P. A., et al. 2015, ApJ, 803, 34
- Cen & Kimm (2015) Cen, R. & Kimm, T. 2015, ApJ, 801, 25
- Cowie, Barger, & Trouille (2009) Cowie, L. L., Barger, A. J., & Trouille, L. 2009, ApJ, 692, 1476
- Cowie et al. (2010) Cowie, L. L., Barger, A J., & Hu, E. M. 2010, ApJ, 711, 928
- Cowie et al. (2012) Cowie, L. L., Barger, A. J., & Hasinger, G. 2012, ApJ, 748, 50
- Cowie et al. (2020) Cowie, L. L., Barger, A. J., Bauer, F. E., & González-López, J. ApJ, 891, 69
- Cristiani et al. (2016) Cristiani, S., Serrano, L. M., Fontanot, F., Vanzella, E., & Monaco, P. 2016, MNRAS, 462 2478
- Faisst (2016) Faisst, A. L. 2016, ApJ, 829, 99
- Faucher-Giguère et al. (2008) Faucher-Giguère, C.-A., Lidz, A., Hernquist, L., & Zaldarriaga, M. 2008, ApJ, 688, 85
- Feng et al. (2016) Feng, Y., Di-Matteo, T., Croft, R. A., et al. 2016, MNRAS, 455, 2778
- Finkelstein et al. (2015) Finkelstein, S. L., Papovich, C., Ryan, R. E., et al. 2015, ApJ, 758, 93
- Fletcher et al. (2019) Fletcher, T. J., Tang, M., Robertson, B. E., et al. 2019, ApJ, 878, 87
- Fontanot et al. (2007) Fontanot, F., Cristiani, S., Monaco, P., et al. 2007, A&A, 461, 39
- Fontanot et al. (2012) Fontanot, F., Cristiani, S., & Vanzella, E. 2012, MNRAS, 425, 1413
- Fontanot et al. (2014) Fontanot, F., Cristiani, S., Pfrommer, C., Cupani, G., & Vanzella, E. 2014, MNRAS, 438, 2097
- Giallongo et al. (2019) Giallongo, E., Grazian, A., Fiore, F. et al. 2019, ApJ, 884, 19
- Giavalisco et al. (2004) Giavalisco, M., Ferguson, H. C., Koekemoer, A. M., et al. 2004, ApJ, 600, L93
- Grazian et al. (2020) Grazian, A., Giallongo, E., Fiore, F., et al. 2020, ApJ, 897, 94
- Grazian et al. (2016) Grazian, A., Giallongo, E., Gerbasi, R., et al. 2016, A&A, 585, A48
- Grazian et al. (2017) Grazian, A., Giallongo, E., Paris, D., et al. 2017, A&A, 602, A18
- Grogin et al. (2011) Grogin, N. A., Kocevski, D. D., Faber, S. M., et al. 2011, ApJS, 197, 35
- Grimes et al. (2009) Grimes, J. P., Heckman, T., Aloisi, A., et al. 2009, ApJS, 181, 272
- Guo et al. (2013) Guo, Y., Ferguson, H. C., Giavalisco, M., et al. 2013, ApJS, 207, 24
- Haardt & Madau (2012) Haardt, F. & Madau, P. 2012, ApJ, 746, 125
- Inami et al. (2017) Inami, H., Bacon, R., Brinchmann, J., et al. 2017, A&A, 608, A2
- Inoue (2010) Inoue, A. K. 2010, MNRAS, 401, 1325
- Inoue et al. (2014) Inoue, A. K., Shimizu, I., Iwata, I., & Tanaka, M. 2014, MNRAS, 442, 1805
- Ishigaki et al. (2018) Ishigaki, M., Kawamata, R., Ouchi, M., et al. 2018, ApJ, 854, 73
- Izotov et al. (2016a) Izotov, Y. I., Orlitová, I., Schaerer, D., et al. 2016, Nature, 529, 178
- Izotov et al. (2016b) Izotov, Y. I., Schaerer, D., Thuan, T. X., et al. 2016, MNRAS, 461, 3683
- Izotov et al. (2017) Izotov, Y. I., Thuan, T. X., & Guseva, N. G. 2017, MNRAS, 471, 548
- Izotov et al. (2018) Izotov, Y. I., Worseck, G., Schaerer, D., et al. 2018, MNRAS, 478, 4851
- Japelj et al. (2017) Japelj, J., Vanzella, E., Fontanot, et al. 2017, MNRAS, 468, 389
- Ji et al. (2020) Ji, Z., Giavalisco, M., Vanzella, E., et al. 2020, ApJ, 888, 109
- Jones et al. (2018) Jones, L. H., Barger, A. J., Cowie, L. L., et al. 2018, ApJ, 862, 142
- Khaire et al. (2016) Khaire, V., Srianand, R., et al. 2016, MNRAS, 457, 4051
- Kimm et al. (2017) Kimm, T., Katz, H., Haehnelt, M. G., et al. 2017, MNRAS, 466, 4826
- Koekemoer et al. (2011) Koekemoer, A. M., Faber, S. M., Ferguson, H. C., et al. 2011, ApJS, 197, 36
- Kurk et al. (2013) Kurk, J., Cimatti, A., Daddi, E., et al. 2013, A&A, 549, A63
- Leitet et al. (2013) Leitet, E., Bergvall, N., Hayes, M., et al. 2013, A&A, 553, A106
- Leitherer et al. (1995) Leitherer, C., Ferguson, H. C., Heckman, T. M., & Lowenthal, J. D. 1995, ApJ, 454, 19L
- Livermore et al. (2017) Livermore, R. C., Finkelstein, S. L., & Lotz, J. M. 2017, ApJ, 835, 113
- Luo et al. (2017) Luo, B., Brandt, W. N., Xue, Y. Q., et al. 2017, ApJS, 228, 2
- Madau (1995) Madau, P. 1995, ApJ, 441, 18
- Madau & Haardt (2015) Madau, P. & Haardt, F. 2015, ApJ, 813, L8
- Marchi et al. (2018) Marchi, F., Pentericci, L., Guaita, L., et al. 2018, A&A, 614, A11
- Matthee et al. (2017) Matthee, J., Sobral, D., Best, P., et al. 2017, MNRAS, 465, 3637
- Micheva et al. (2017) Micheva, G., Iwata, I., & Inoue, A. K. 2017, MNRAS, 465, 302
- Mitra et al. (2013) Mitra, S., Ferrara, A., & Choudhury, T. R. 2013, MNRAS, 428, L1
- Momcheva et al. (2016) Momcheva, I. G., Brammer, G. B., van Dokkum, P. G., et al. 2016, ApJS, 225, 27
- Morris et al. (2015) Morris, A. M., Kocevski, D. D., Trump, J. R., et al. 2015, AJ, 149, 178
- Mostardi et al. (2015) Mostardi, R. E., Shapley, A. E., et al. 2015, ApJ, 810, 107
- Naidu et al. (2017) Naidu, R. P., Oesch, P. A., Reddy, N., et al. 2017, ApJ, 847, 12
- Naidu et al. (2018) Naidu, R. P., Forrest, B., Oesch, P. A., et al. 2018, MNRAS, 478, 791
- Nakajima & Ouchi (2014) Nakajima, K., & Ouchi, M. 2014, MNRAS, 442, 900
- Nestor et al. (2013) Nestor, D. B., Shapley, A. E., Kornei, K. A., et al. 2013, ApJ, 765, 47
- Oesch et al. (2018) Oesch, P. A., Montes, M., Reddy, N., et al. 2018, ApJS, 237, 12
- Ouchi et al. (2009) Ouchi, M., Mobasher, B., Shimasaku, K., et al. 2009, ApJ, 706, 1136
- Pentericci et al. (2018) Pentericci, L., McLure, R. J., Garilli, B., et al. 2018, A&A, 616, 174
- Popesso et al. (2009) Popesso, P., Dickinson, M., Nonino, M., et al. 2009, A&A, 494, 443
- Price et al. (2016) Price, L. C., Trac, H., & Cen, R. 2016, arXiv:1605.03970
- Rafelski et al. (2015) Rafelski, M., Teplitz, H. I., Gardner, J. P., et al. 2015, AJ, 150, 31
- Reddy et al. (2016b) Reddy, N. A., Steidel, C. C., Pettini, M., et al. 2016b, ApJ, 828, 108
- Riccoti & Shull (2000) Riccoti, M., & Shull, J. M. 2000, ApJ, 542, 548
- Rivera-Thorsen et al. (2019) Rivera-Thorsen, T. E., Dahle, H., Chisholm, J., et al. 2019, Science, 366, 738
- Robertson et al. (2010) Robertson, B. E., Ellis, R. S., Dunlop, J. S., McLure, R. J., & Stark, D. P. 2010, Nature, 468, 49
- Robertson et al. (2015) Robertson, B. E., Ellis, R. S., Furlanetto, S. R., & Dunlop, J. S. 2015, ApJ, 802, L19
- Rutkowski et al. (2016) Rutkowski, M. J., Scarlata, C., Haardt, F., et al. 2016, ApJ, 819, 81
- Rutkowski et al. (2017) Rutkowski, M. J., Scarlata, C., Henry, A., et al. 2017, ApJ, 841, 27
- Saha et al. (2020) Saha, K., Tandon, S. N., Simmonds, C., et al. 2020, Nature Astronomy, 193
- Shapley et al. (2006) Shapley, A. E., Steidel, C. C., Pettini, M., et al. 2006, ApJ, 651, 688
- Shapley et al. (2016) Shapley, A. E., Steidel, C. C., Strom, A. L., et al. 2016, ApJ, 826, L24
- Shin et al. (2020) Shin, S., Im, M., Kim, Y., et al. 2020, ApJ, 893, 45
- Siana et al. (2010) Siana, B., Teplitz, H. I., Ferguson, H. C., et al. 2010, ApJ, 723, 241
- Siana et al. (2015) Siana, B., Shapley, A. E., Kulas, K. R., et al. 2015, ApJ, 804, 17
- Smith et al. (2018) Smith, B. M., Windhorst, R. A., Jansen, R. A., et al. 2018, ApJ, 853, 191
- Smith et al. (2020) Smith, B. M., Windhorst, R. A., Cohen, S., et al. 2020, ApJ, 897, 41
- Songaila (2004) Songaila, A.. 2004, AJ, 127, 2598
- Songaila & Cowie (2010) Songaila, A., & Cowie, L. L. 2010, ApJ, 721, 1448
- Steidel et al. (2001) Steidel., C. C., Pettini, M., & Adelberger, K. L. 2001, ApJ, 546, 665
- Steidel et al. (2018) Steidel, C. C., Bogosavlevic, M., Shapley, A. E., et al. 2018, ApJ, 869, 123
- Straatman et al. (2016) Straatman, C. M. S., Spitler, L. R., Quadri, R. F., et al. 2016, ApJ, 830, 51
- Tang et al. (2019) Tang, M., Stark, D. P., Chevallard, J., & Charlot, S. 2019, MNRAS, 489, 2572
- Teplitz et al. (2013) Teplitz, H. I., Rafelski, M., Kurczynski, P., et al. 2013, AJ, 146, 159
- Urrutia et al. (2019) Urrutia, T., Wisotzki, L., Kerutt, J., et al. 2019, A&A, 624, A141
- van der Velden (2020) van der Velden, E. 2020, JOSS, 5, 2004.
- Vanzella et al. (2010a) Vanzella, E., Siana, B., Cristiani, S., & Nonino, M. 2010, MNRAS, 404, 1672
- Vanzella et al. (2010b) Vanzella, E., Giavalisco, M., Inoue, A. K., et al. 2010, ApJ, 725, 1011
- Vanzella et al. (2012a) Vanzella, E., Nonino, M., Cristiani, S., et al. 2012, MNRAS, 424, 54
- Vanzella et al. (2012b) Vanzella, E., Guo, Y., Giavalisco, M., et al. 2012, ApJ, 751, 70
- Vanzella et al. (2018) Vanzella, E., Nonino, M., Cupani, G., et al. 2018, MNRAS, 476, 15
- Vanzella et al. (2020) Vanzella, E., Caminha, G. B., Calura, F., et al. 2020, MNRAS, 491, 1093
- Verhamme et al. (2017) Verhamme, A., Orlitová, I., Schaerer, D., et al. 2017, A&A, 597, 13
- Windhorst et al. (2011) Windhorst, R. A., Cohen, S. H., Hathi, N. P., et al. 2011, ApJS, 193, 27
- Xue et al. (2016) Xue, Y. Q., Luo, B., Brandt, W. N., et al. 2016, ApJS, 224, 15