All-Optical and Microwave-Free Detection of Meissner Screening using Nitrogen-Vacancy Centers in Diamond
Abstract
Microscopic studies on thin film superconductors play an important role for probing non-equilibrium phase transitions and revealing dynamics at the nanoscale. However, magnetic sensors with nanometer scale spatial and picosecond temporal resolution are essential for exploring these. Here, we present an all-optical, microwave-free method, that utilizes the negatively charged nitrogen-vacancy (NV) center in diamond as a non-invasive quantum sensor and enables the spatial detection of the Meissner state in a superconducting thin film. We place an NV implanted diamond membrane on a thick superconducting La2-xSrxCuO4 (LSCO) thin film with of . The strong B-field dependence of the NV photoluminescence (PL) allows us to investigate the Meissner screening in LSCO under an externally applied magnetic field of in a non-resonant manner. The magnetic field profile along the LSCO thin film can be reproduced using Brandt’s analytical model, revealing a critical current density of . Our work can be potentially extended further with a combination of optical pump probe spectroscopy, for the local detection of time-resolved dynamical phenomena in nanomagnetic materials.
I Introduction
Microscopic phenomena revealing complex magnetic phases in two-dimensional materials are catching the central attention in modern condensed-matter physics Bandy . Prime examples are superconducting systems which are accompanied by electronic phases Wu ; Bednorz ; Hazen , such as vortex formation in the case of type II superconductors Essmann . Various approaches are already established for studying superconductivity mainly based on superconducting quantum interference devices (SQUIDs) Ceccarelli , magnetic force microscopy (MFM) Hug , scanning tunneling microscopy (STM) Kot and the investigation of magneto-optical effects Goa . However, each of these techniques suffer from drawbacks such as limited temperature and magnetic field ranges, spatial resolution and complex sample preparation. A promising alternative for surpassing these drawbacks is to employ negatively charged nitrogen vacancy (NV) centers in diamond. In fact, the NV center in diamond is a non-invasive nanoscale magnetic field sensor allowing measurements at both, cryogenic as well as ambient conditions, with a magnetic field sensitivity of for NV ensembles and in the case of single NV centers Degen . Applications of NV center sensing have been shown in single molecular systems, investigated using nuclear magnetic resonance (NMR) Staudacher and electron spin resonance (ESR) Schlipf ; Pinto . In addition, magnetic properties of materials have been investigated including spin waves Du , ferromagnetism Page ; Ferror and superconductivity Waxman ; Thiel ; Pelliccione ; Nusran ; Joshi ; Xu ; Rohner ; Sydney ; SCreview at the nanoscale with this approach. The fundamental sensing principle of the NV center relies on the spin dependent photoluminescence (PL) of the defect center Wrachtrup ; Donghun . Microwave excitations allow coherent manipulation within different spin sublevels present in the ground state. The resulting transition frequencies show a Zeeman effect, forming a toolset for magnetic field sensing, known as optically detected magnetic resonance (ODMR) technique.
However, microwave excitations are usually linked with heating effects, which could locally change properties of the investigated sample Sydney .
Here, we introduce the magnetic field dependent fluorescence yield of an NV center ensemble which allows a reliable and direct investigation of the spatial modulation of superconductivity on a microscopic scale. Besides calibrating the change in the NV emission intensity caused by an external magnetic field with ODMR spectroscopy, our experiments rely solely on an all-optical, non-resonant, microwave-free measurement scheme. We position an NV implanted diamond membrane at the edge of a superconducting La2-xSrxCuO4 (LSCO) thin film. We collect the NV center fluorescence at different positions on the superconductor at and under an external magnetic field of aligned along the -direction. Normalization to zero-field measurements provides us a fingerprint of the Meissner screening in terms of the PL rate drop when the NV ensembles are in close proximity () to the LSCO thin film. Combining this with an analytical model, developed by E. H. Brandt Brandt , allows us to extract the critical current density . Furthermore, we provide a comparison of our results with a complementary SQUID measurement.
II Experimental Setup and Methods
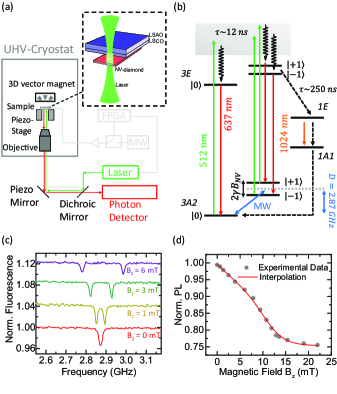
All measurements are carried out using a confocal microscope connected to an UHV-He bath cryostat operating at a base pressure of at (Fig. 1(a)) Nolte . A green pulsed laser is used to excite the NV centers. The emitted fluorescence is recorded with a photon detector device. The laser spot is scanned over the sample, while recording the NV fluorescence, resulting in a confocal image. Further details of this experimental setup and of an additional setup used for NV characterization at ambient conditions can be found in section 1 of the Supporting Information (SI). The pulsed microwave source integrated with the setup allows us to perform magnetometry with NV centers and ODMR measurements which require NV spin manipulations.
Magnetometry with NV centers relies on the energy-level scheme shown in Fig. 1(b). The ground electronic state of the NV center is a spin triplet. The energy gap between the excited triplet state and the ground state corresponds to a photon emission of . The NV center can be excited from the ground state into the phonon side band using green laser light. Subsequently, it relaxes to the ground state by emitting photons in the range of 637-. The fluorescence is highly spin state selective Wrachtrup . In particular, the fluorescence rate of the states is lower than that of the . In presence of an externally applied magnetic field, the states experience a Zeeman splitting. Subsequently, a resonant microwave excitation enables the transition between the bright state and one of the less fluorescent dark states, whenever the microwave frequency matches the induced energy splitting. Therefore, in absence of an external magnetic field, the NV fluorescence shows only a single resonance signifying the zero field splitting of . For a non zero magnetic field, this splits into two resonances corresponding to the and transitions. The unique combination of these properties of the NV center, allows us to calibrate the magnetic field, by observing field dependent ODMR spectra, as shown in Fig. 1(c). For all measurements, the magnetic field is applied along the z direction (), normal to the (100) surface. Therefore, all four possible NV orientations experience the same Zeeman splitting Nusran given by .
is the gyromagnetic ratio, which is for the NV electronic spin.
The observed frequency splitting is proportional to the applied magnetic field following this equation.
However, this method requires the application of a resonant microwave driving frequency. Microwave applications are often accompanied by local heating effects, which could cause undesired changes in the properties of the investigated system, especially in case of a superconducting sample.
This can be circumvented by utilizing a non-resonant measurement scheme without microwave excitations. The fluorescence yield detected from the NV center strongly depends on the applied off-axis magnetic field. In particular, it decreases with increasing the -field. This can be explained by the spin mixing of the sublevels when the magnetic field is misaligned with respect to the NV axis. The mixing of the spin sublevels leads to an inefficient spin-dependent PL rate by enhancing the probablity of the non-radiative inter system crossing to the metastable state. The resulting PL drop can be used for a qualitative investigation of the magnetic fields Tetienne .
Fig. 1(d) shows this behavior of the NV emission for different magnetic fields at ambient conditions. A significant decrease of the detected PL up to is observed for the highest applied magnetic field of along the -direction. This approach still relies on ODMR spectra for the quantitative calibration of the magnetic fields on the NV axis. However, besides this the direct all-optical record of the NV emission relies on a non-resonant, microwave-free method. Measurements of field variations and qualitative observations of magnetic properties, which are often required for supercondcting systems, are still viable using the direct emission of the NV centers. Therefore, the magnetic field dependent PL can be a sensitive tool for detecting non-equilibrium phase transitions and dynamical phenomena with a high spatial resolution.
III Results and Discussion
III.1 Investigated LSCO Sample
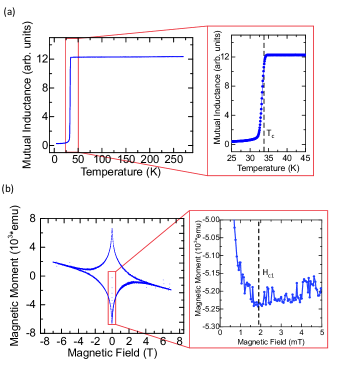
In order to demonstrate this, we characterized the Meissner screening caused by a type II cuprate superconducting LSCO sample. LSCO is among the most studied high superconductors in recent years Logvenov ; Gilardi . Furthermore, it has attracted much interest since Cooper pair formation, diamagnetism Li and vortex mechanisms Iguchi have been measured above . Therefore, LSCO is not only an ideal sample to benchmark our technique with existing quantities and models, but also forms a system with interesting superconducting properties which could be investigated with our method in future experiments. The studied sample consists of a single crystalline LSCO thin film epitaxially grown on a (001) LaSrAlO4 (LSAO) substrate Gideok and exhibits a critical temperature of which is depicted in the mutual inductance measurement shown in Fig 2(a). The mutual inductance has been measured by placing the LSCO sample within two pick-up coils (see section 7 of the SI). By applying a weak magnetic field through one of the coils, the magnetic interaction through the superconducting sample can be investigated. We also recorded the magnetic moment as a function of the magnetic field at 4 K for gaining more information about the magnetic phase diagram including the lower critical field (see Fig. 2(b)). This indicates a first magnetic penetration at about , where magnetic fluxes start to enter the superconducting sample.
III.2 Detection of Meissner State with the NV Center PL Drop
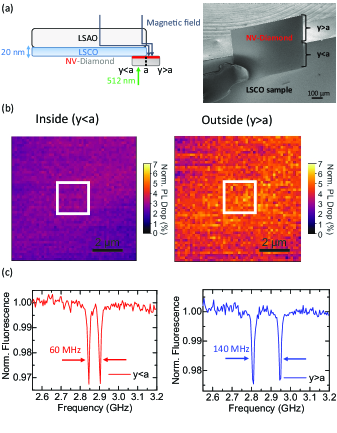
To study the spatial distribution of the Meissner screening caused by the LSCO thin film at , we positioned our diamond membrane across the edge of the LSCO sample (see Fig. 3(a)). This particular geometry allows us to characterize the effect of an external magnetic field on the LSCO thin film , as well as background measurement without having LSCO on top . Note that all PL measurements are normalized with respect to a corresponding zero field confocal scan for estimating the effective fluorescence rate drop. Fig. 3(b) shows a confocal scan of the NV ensemble obtained from regions (left panel) and (right panel) respectively, for an applied field of . It is evident that the zero-field normalized confocal scan obtained from is significantly brighter compared to the case of . We choose the central area (depicted as white square) of the confocal images for evaluation, since the center of the image shows the least distortion (see section 2 of the SI). For , the normalization with respect to a zero field measurement reveals an average fluorescence drop of in the central area. In contrast, for the fluorescence count rate drop amounts to . The increase in the fluorescence count rate drop can be explained by the presence of the LSCO thin film. The superconducting phase in the LSCO thin film causes a Meissner expulsion Takeda leading to varying magnetic fields experienced over the whole diamond membrane. NV centers in the area of experience a reduced magnetic field strength and therefore show a significantly decreased PL drop compared to the region. For , which is outside the superconductor, no Meissner screening is present. Therefore, the NV center ensemble measures the unscreened applied field of resulting in a higher fluorescence drop. Note that, the confocal scans have been obtained by a fixed laser power of , measured in front of the UHV chamber glass with a powermeter. With such low laserpower we can ensure, that the laser spot is not changing the superconducting properties of our sample Sydney .
In order to quantify the strength of the magnetic field that penetrates through the LSCO thin film, we first verify the Meissner effect using a resonant process, i.e. ODMR spectroscopy. We obtained ODMR spectra on the NV ensembles for both regions, and . The corresponding spectra are depicted in Fig. 3(c). The red curve on the left panel shows the resonance peaks of the NV ensemble inside the LSCO thin film with a frequency splitting of . This corresponds to a -aligned magnetic field of . In contrast, the blue curve (Fig. 3(c), right panel), which represents the ODMR spectrum of the NV ensemble for , exhibits a splitting of corresponding to a magnetic field strength of along the -direction. This is in an excellent agreement with the fact, that the NV ensemble in does not experience any Meissner screening. Therefore, the magnetic field strength calculated from the ODMR spectrum matches the applied, unscreened magnetic field value. Consequently, these results corroborate a magnetic field screening of . Note that, the magnetic field in the region of is not vanishing. This can be attributed to the relatively large NV to superconductor distance () (see section 6 of the SI). Also the formation of magnetic vortices in type II superconductors could result in a non vanishing magnetic field in the LSCO sample Gilardi .
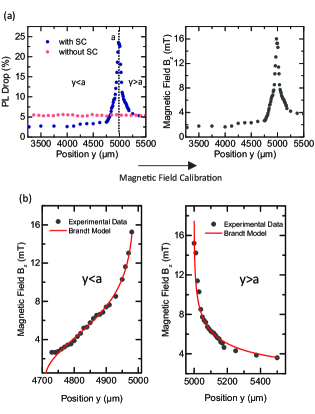
This approach can be extended further to gain insights about the Meissner screening and for characterizing the LSCO thin film to a greater detail. This is achieved by raster sweeping the laser focal spot over the diamond membrane along the direction. The corresponding spatial variation of the PL drop under an applied magnetic field of is shown in Fig. 4(a) (left panel). Again, each confocal scan and corresponding fluorescence rate is normalized to a zero field measurement for evaluating the relative fluorescence drop. Two distinct regimes characterized by different degrees of PL drops, are observed for and respectively. Inside the superconductor, we measure a relatively homogeneous PL drop of about , which slowly increases towards the boundary, i.e. . Note that, the conversion from PL drop to an effective magnetic field is achieved using the calibration data presented in Fig. 1(d). The latter reveals a magnetic field strength ranging between and , as plotted on the right panel of Fig. 4(a). In contrast, an increased PL drop of is observed at locations which are far away from the LSCO thin film. This corresponds to a magnetic field strength of which is in good agreement with the applied magnetic field. In addition, we have also observed a significant and sharp increase in the PL drop at the boundary, i.e., , implying an equivalent increase of the effective magnetic flux density, which penetrates through the LSCO thin film. While the majority of the LSCO thin film expels the magnetic field, near the boundaries the field is enhanced to almost . The magnetic field flux is screened to the edge of the LSCO sample due to the diamagnetic properties of the superconducting compound. This leads to an enhanced magnetic flux density at the boundary of the superconducting LSCO sample. Note that, in absence of the LSCO sample, such a spatial dependence of the PL drop is not observed in the bare NV membrane (red dots in Fig. 4(a)).
III.3 Application of Brandt’s Model
The magnetic field profile in a superconducting thin film can be analytically evaluated by Brandt’s modelBrandt . The spatial dependence along the -direction, of the magnetic field applied perpendicular to the superconducting thin film is:
| (1) |
stands for the critical sheet current in units of and the parameters and can be represented as
where corresponds to the halfed sample length. The parameter can be interpreted as a lateral penetration depth of the externally applied magnetic field , indicating how far penetrates from the sides into the sample. We fit our experimental data using this model in order to quantify the critical current density , in which the flux lines start to move under the action of Lorentz force. Note that, similar to the observation in Fig. 3, the magnetic field is not vanishing inside the superconductor. Therefore, we restrict our fit within the limit where the magnetic field is reduced to of the maximum observed field. This model agrees very well with our data for both (Fig. 4(b), left panel) and for (Fig. 4(b), right panel). The corresponding fitting paramaters for fixed values of and are, , and . Knowing and the sample thickness we have extracted the critical current density as . This value is in very good agreement with recently reported values for LSCO nanowires Lit indicating the NV fluorescence drop as reliable quantity for characterizing thin film superconductors. Also note, that the corresponding value agrees very well with a calculation based on our SQUID measurement in Fig. 2. The magnetic moment can be obtained using Brandt’s analytical model and the corresponding with Brandt
| (2) |
resulting into a magnetic moment of . This is comparable with our SQUID measurement in Fig. 2(b), in which the magnetic moment ranges from to . The slight mismatch in can be explained by the performed calibration measurement. The PL drop to magnetic field strength conversion in Fig. 1(d) assumes a magnetic field applied in z-direction (). This is a fair assumption for the region and (far inside and outside of the superconductor). However, in close proximity of the LSCO edge () the magnetic field is forced to curl around the edge of the superconductor. Therefore, it is expected, that the off-axis component of the magnetic field is not pointing only in the z-direction. Instead, a strong in-plane component has to be assumed. This fact can explain the overestimation of .
IV Conclusion
In conclusion, we have presented a microwave-free NV center based method for characterizing relative magnetic field changes. In order to demonstrate this, we investigated a superconducting LSCO thin film. So far, the NV center has mainly been used as magnetic field sensor in a resonant measurement scheme utilizing microwave excitations. Here we extend its application by employing the magnetic field dependent PL of an NV center ensemble in a microwave-free manner providing a direct manifestation of the Meissner screening in our LSCO sample. To the best of our knowledge, this is the first demonstration of NV center magnetometry on a superconducting sample that does not require resonant microwave pulse schemes, apart from calibrating the absolute magnetic field. The PL calibration can either over-or underestimate the magnetic field strength to a certain extent. However, this is not important for measurements relying on relative strength changes of the magnetic field such as in the case of the Meissner state in superconductors. The presented method enables a fast and precise measurement of such relative magnetic changes excluding heating effects on the sample. Furthermore, the magnetic field dependent NV emission used in this work can be extended further by combining optical pump probe spectroscopy, thereby enabling access to dynamical systems with fast timescales. With the NV center as nanoscale magnetic field sensor, this opens up a promising avenue for exploring a multitude of problems in condensed-matter physics such as non-equilibrium collective phenomena including the vortex formation and motion in type II superconductors.
Acknowledgments
We acknowledge financial support for this work provided by the European Research Council (ERC) under the European Union’s Horizon 2020 research and innovation programme (grant agreement No. 742610), EU via project ASTERIQS, Max Planck Society and DFG via FOR 2724.
Data Availability
The data that support the findings of this study are available from the corresponding author upon reasonable request.
References
References
- (1) Bandyopadhyay, A.; Frey, N. C.; Jariwala, D.; Shenoy, V. B. Nano Lett. 2019, 19, 7793-7800.
- (2) Wu, M. K.; Ashburn, J. R.; Torng, C. J.; Hor, P. H.; Meng, R. L.; Gao, L.; Huang, Z. J.; Wang, Y. O.; Chu, C. W. Phys. Rev. Lett. 1987, 58 (9), 908-910.
- (3) Bednorz, J. G.; Müller, K. A. Z. Phys. B 1986, 64, 189-193.
- (4) Hazen, R. M.; Finger, L. W.; Angel, R. J.; Prewitt, C. T., Ross, N. L.; Hadidiacos, C. G., Heaney, P.; Veblen, D. R.; Sheng, Z. Z.; El Ali, A.; Hermann, A. M. Phys. Rev. Lett. 1988, 60 (16), 1657-1660.
- (5) Essmann, U.; Träuble, H. Phys. Rev. A 1967, 24, 526-527.
- (6) Ceccarelly, L.; Vasyukov, D.; Wyss, M.; Romagnoli, G.; Rossi, N.; Moser, L.; Poggio, M. Phys. Rev. B 2019, 100, 104504.
- (7) Hug, H. J.; Stiefel, B.; Schendel, P. J. A.; Moser, A.; Hofer, R.; Martin, S.; Porthun, S.; Abelmann, L.; Lodder, J. C.; Bochi, G.; Handley, R. C. J. Appl. Phys. 1998, 83, 5609-5620.
- (8) Kot, P.; Drost, R.; Uhl, M.; Ankerhold, J.; Cuevas, C. C.; Ast, C. R. Phys. Rev. B 2020, 101, 134507.
- (9) Goa, P. E.; Hauglin, H.; Baziljevich, M.; Yaschenko, E. I.; Gammel, P. L.; Johansen, T. H. Supercond. Sci. Technol. 2001, 14, 729-731.
- (10) Degen, C. L.; Reinhard, F.; Cappellaro, P. Rev. Mod. Phys. 2017, 89, 035002.
- (11) Staudacher, T.; Shi, F.; Pezzagna, S.; Meijer, J.; Du, J.; Meriles, C. A.; Reinhard, F.; Wrachtrup, J. Science 2013, 339, 561-563.
- (12) Schlipf, L.; Oeckinghaus, T.; Xu, K.; Dasari, D. B. R.; Zappe, A.; Oliveria, F. F.; Kern, B.; Azarkh, M.; Drescher, M.; Ternes, M.; Kern, K.; Wrachtrup, J.; Finkler, A. Sci. Adv. 2017, 3, e1701116.
- (13) Pinto, D.; Paone, D.; Kern, B.; Dierker, T.; Wieczorek, R.; Singha, A.; Dasari, D.; Finkler, A.; Harneit, W.; Wrachtrup, J.; Kern, K., under review
- (14) Du, C.; Sar, T.; Zhou, T. X.; Upadhyaya, P.; Casola, F.; Zhang, H.; Onbasli, M. C.; Ross, C. A.; Walsworth, R. L.; Tserkovnyak, Y.; Yacoby, A. Science 2017, 357, 195-198.
- (15) Page, M. R.; McCullian, B. A.; Purser, C. M.; Schulze, J. G.; Nakatami, T. M.; Wolfe, C. S.; Childress, J. R.; McConney, M. E.; Howe, B. M:; Hammel, P. C.; Bhallamudi, V. P. J. Appl. Phys. 2019, 126, 124902.
- (16) Lee, M.; Jang, B.; Yoon, J.; Mathpal, M. C.; Lee, Y.; Kim, C.; Pane, S.; Nelson, B. J.; Lee, D. Nanotechnology 2018, 29, 405502.
- (17) Waxman, A.; Schlussel, Y.; Groswasser, D.; Acosta, V. M.; Bouchard, L. S.; Budker, D.; Folman, R. Phys. Rev. B 2014, 89, 054509.
- (18) Thiel, L.; Rohner, D.; Ganzhorn, M.; Appel, P.; Neu, E.; Müller, B.; Kleiner, R.; Koelle, D.; Malitensky, P. NNano. 2016, 11, 677-682.
- (19) Pelliccione, M.; Jenkins, A.; Ovartchaiyapong, P.; Reetz, C.; Emmanouilidou, E.; Ni, N.; Jayich, A. C. B. Nnano. 2016, 11 700-705.
- (20) Nusran, N. M.; Joshi, K. R.; Cho, K.; Tanatar, M. A.; Meier, W. R.; Budko, S. L.; Canfield, P. C.; Liu, Y.; Lograsso, T. A.; Prozorov, R. New J. Phys. 2018, 20, 043010.
- (21) Joshi, K. R.; Nusran, N. M.; Tanatar, M. A.; Cho, K.; Meier, W. R.; Budko, S. L.; Canfield, P. C.; Prozorov, R. Phys. Rev. Appl. 2019, 11, 014035.
- (22) Xu, Y.; Yu, Y.; Hui, Y. Y.; Su, Y.; Cheng, J.; Chang, H. C.; Zhang, Y.; Shen, Y. R.; Tian, C. Nano Lett. 2019, 19, 5697-5702.
- (23) Rohner, D.; Thiel, L.; Müller, B.; Kasperczyk, M.; Kleiner, R.; Koelle, D.; Malitensky, P. Sensors 2018, 3790, s18113790.
- (24) Lillie, S. E.; Broadway, D. A.; Dontschuk, N.; Scholten, S. C.; Johnson, B. C.; Wolf, S.; Rachel, S.; Hollenberg, L. C. L.; Tetienne, J-P. Nano Lett. 2020, 3, 1855-1861.
- (25) Acosta, V.M.; Bouchard, L. S.; Budker, D.; Folman, R.; Lenz, T.; Maletinsky, P.; Rohner, D.; Schlussel, Y.; Thiel, L. Journal of Superconductivity and Novel Magnetism 2019, 32, 85-95.
- (26) Wrachtrup, J.; Jelezko, F. phys. stat. sol. 2006, 203, 3208-3225.
- (27) Lee, D.; Lee, K. W.; Cady, J. V.; Ovartchaiyapong, P.; Jayich, A. C. B. Journal of Optics 2017, 19, 033001.
- (28) Brandt, E. H.; Indenbom, M. Phys. Rev. B 1993, 48 (17), 893-906.
- (29) Schaefer-Nolte, E.; Reinhard, F.; Ternes, M.; Wrachtrup, J.; Kern, K. Rev. Sci. Instrum. 2014, 85, 013701.
- (30) Pham, L. M.; Mar-Gill, N.; Sage, D.; Belthangady, C.; Stacey, A.; Markham, M.; Twitchen, D. J.; Lukin, M. D.; Walsworth, R. L. Phys. Rev. B 2012, 86, 121202.
- (31) Tetienne, J-P.; Rondin, L.; Spinicelli, P.; Chipaux, M.; Debuisschert, T.; Roch, J-F.; Jacques, V. New J. Phys. 2012, 14, 103033.
- (32) Logvenov, G.; Gozar, A.; Bozovic, I. Science 2009, 326, 699-702.
- (33) Gilardi, R.; Streule, S.; Momono, N.; Oda, M.; Mesot, J. Eur. Phys. J. B 2005, 47, 231-237.
- (34) Li, L.; Wang, Y.; Komiya, S.; Ono, S.; Ando, Y.; Gu, G. D.; Ong, N. P. Phys. Rev. B 2010, 81, 054510.
- (35) Iguchi, I.; Yamaguchi, T.; Sugimoto, A. Nature 2011, 412, 420-423.
- (36) Kim, G.; Christiani, G.; Logvenov, G.; Choi, S.; Kim, H. H.; Minola, M.; Keimer, B. Phys. Rev. Mat. 2017, 1, 054801.
- (37) Iguchi. I.; Takeda, T. Appl. Phys. Lett. 2003, 83, 2193-2195.
- (38) Litombe, N. E.; Bollinger, A. T.; Hoffman, J. E.; Bozovic, I. Physica C 2014, 506, 169-173.