Time-resolved rheometry of drying liquids and suspensions
Abstract
From paints and inks to personal care and food products, solvent evaporation is ubiquitous and critically impacts product rheological properties. It affects Newtonian fluids, by concentrating any non-volatile components, as well as viscoelastic materials such as gels, which hardens up and become solid upon complete drying. In both of these cases, solvent evaporation also leads to a change in volume of the sample, which makes any measurements of resulting rheological properties particularly challenging with traditional shear geometries. Here we show that the rheological properties of a sample experiencing ‘slow’ evaporation can be monitored in a time-resolved fashion by using a zero normal-force controlled protocol in a parallel-plate geometry. In this framework, the solvent evaporation from the sample leads to a decrease of the normal force, which is compensated at all times by a decrease of the gap height between the plates. As a result, the sample maintains a constant contact area with the plates despite the significant decrease of its volume. We validate the method under both oscillatory and continuous shear by accurately monitoring the dynamic and shear viscosities of samples of water and water-glycerol mixtures experiencing evaporation for several hours, and a corresponding relative volume decrease as large as 70%. Moreover, we show that this protocol is also applicable for characterizing complex fluids such as suspensions experiencing evaporation. Specifically, we monitor a colloidal dispersion of charged silica nanoparticles undergoing a glass transition induced by evaporation. While the decrease in gap height between the plates provides a direct estimate of the increasing particle volume fraction, oscillatory and continuous shear measurements allow us to monitor the evolving viscoelastic properties of the suspension in real time. Overall, our study shows that a zero normal-force protocol can provide a simple approach to bulk and time-resolved rheological characterization of a variety of simple and complex fluid systems experiencing slow volume variations.
I Introduction
Evaporation of volatile liquids alter the rheological properties of numerous materials from Newtonian liquids (e.g., water in water-glycerol mixtures) to viscoelastic liquids and soft solids (e.g., volatile solvents in suspensions and gels) Boger and Rama Murthy (1969); Macosko (1994). On the one hand, evaporation can be an issue that needs to be limited, for instance when performing rheological measurements to characterize functional properties of samples with volatile solvents, such as paints or inks, etc. Ewoldt, Johnston, and Caretta (2015). In that case, rheological experiments are performed with a solvent trap, or an oil rim at the sample periphery for parallel-plate and cone-and-plate geometry, or even in an insulated chamber Orafidiya (1989); Wee and Mackley (1998); Sato and Breedveld (2005). On the other hand, evaporation can be used to alter the microstructure of a sample and tune its properties, often through a sol-gel or sol-glass transition. For instance, solvent evaporation plays a key role in the formation of films with self-assembled nanostructure Lee, Lu, and Shen (2006); Prevo, Kuncicky, and Velev (2007). Moreover, solvent evaporation can be used to concentrate a suspension of particles into a solid, whose microstructure and mechanical properties can be accurately controlled Leng et al. (2006); Merlin, Salmon, and Leng (2012); Lidon and Salmon (2014); Piroird et al. (2016). Similarly, a solvent can also be evaporated from a polymer mixture to create a hardened composite. Contrary to UV-curing where the addition of a photo-initiator is needed to form an interconnected network from low molecular weight components through photo-polymerization Endruweit, Johnson, and Long (2006), solvent evaporation can happen with or without curing agents. This is the case of coatings where the formation of intermolecular or interparticle bonds start after evaporation Poth (2001); Zhou et al. (2013). Finally, natural materials such as skin, hair and horns are classical examples of extra-organismal biomacromolecular materials that undergo various levels of dehydration in time and space as part of their life cycle Fudge et al. (2009). In fact, material dehydration has been documented as an effective biological material design strategy for achieving unique mechanical properties, as in some cases the synergistic effect of dehydration and local macromolecular network densification can lead to exceptional mechanical strength. This is the case of the beak of the Humboldt Squid, which shows a strong gradient in water content, and whose tip is among the hardest and stiffest wholly organic materials known Miserez et al. (2008).
A key challenge in studies of complex fluids or soft solids with volatile solvents remains how to quantify the changes induced by solvent evaporation on the rheological properties of a system experiencing dehydration. Evaporation is a non-isochoric process, which often involves spatially heterogeneous dynamics that leads to concentration gradients Zakharov and Scheffold (2010). As a result, time-resolved rheological measurements at the macroscale are very challenging Molenaar, Svanholm, and Toussaint (1997). This is the reason why most of the experimental effort has been focused on indirect measurements, e.g., based on film surface topography Figliuzzi et al. (2012), and local investigation techniques such as active and passive micro-rheology Bodiguel and Leng (2010); Kim et al. (2013); Komoda, Leal, and Suires (2014); Castro et al. (2017).
Here we propose to perform time-resolved measurements of the macroscopic rheological properties of samples experiencing slow evaporation, i.e., slow enough to safely assume that the sample does not develop any spatial plug stopping dehydration. Specifically, after placing the sample in a parallel-plate geometry connected to a stress-controlled rheometer, we use a zero normal-force (ZNF) protocol, in which the normal force exerted on the sample is maintained equal to zero, while the gap height is free to adjust. This method, which was previously shown to be efficient in measuring rheological properties during non-isochoric gelation in agarose dispersions Mao, Divoux, and Snabre (2016); Mao et al. (2017) and organogels Beniazza et al. (2020), is employed here on Newtonian fluids and charged colloidal suspensions. We show that the ZNF protocol allows us to monitor the continuous increase in viscosity of a dehydrating water-glycerol mixture, as well as the discontinuous changes in viscoelastic properties of a drying colloidal suspension during its glass transition. This study thereby paves the way for systematic time-resolved rheological measurements on macroscopic samples of complex fluids experiencing strongly non-isochoric transitions induced by solvent evaporation.
The article is organized as follows: in section II, we describe the samples characterized in the drying experiments and motivate the ZNF protocol. In section III, we validate this protocol by confirming the invariant viscosity of a drying water sample monitored over several hours. We then apply the ZNF protocol to monitor the increasing viscosity of drying water-glycerol mixtures as water progressively evaporates. Drying experiments performed either under oscillatory or continuous shear demonstrate that the ZNF protocol allows us to monitor sample viscosity with high precision, while the sample volume decreases by up to 70%. Finally, we apply the ZNF protocol to monitor the drying of a stable colloidal suspension. Here, we further validate the ZNF protocol by confirming that the estimate of the critical volume fraction associated with the dehydration-induced glass transition is in good agreement with values from the literature. Moreover, interpretations based on image correlation analysis from simultaneous video recordings collected during rheological measurements on the colloidal suspensions suggest that data collected under continuous shear, rather than oscillatory shear, provide more accurate information on dehydration-induced microstructural changes, likely due to suppress concentration gradients.
II Material and methods
II.1 Rheological setup
Rheological measurements are performed with a parallel-plate geometry (diameter 25 mm), connected to a stress-controlled rheometer (MCR 302, Anton Paar). The bottom plate consists of a Peltier module (P-PTD 200), which sets the temperature of the sample. All the experiments were performed at C. The upper plate is smooth and made of stainless steel (PP 25). Samples are loaded with a micropipette, which allows us to precisely fill the cell, whose initial gap is set by default to m. The normal force is reset to N immediately after loading the sample and prior to the start of the experiment, which simply consists of initiating the dehydration of the sample at constant temperature. The parallel-plate geometry is topped by a Peltier temperature-controlled hood (H-PTD 200), which consists of a cylinder (diameter 95 mm) centered with the rotation axis of the upper plate. The hood strongly reduces convection around the sample and allows us to control the evaporation rate by controlling the spacing between the foot of the hood and the bottom plate (the hood is typically placed at about 1 mm above the bottom plate). In some experiments, the bottom plate and the Peltier module are replaced by a transparent glass plate to visualize the sample. In that case, images of the sample are taken through the transparent plate, which sits atop a support containing a semi-reflective blade forming a 45∘ angle with respect to the rotation axis of the rotor. The support is pierced with two 25 mm diameter holes; the first one is located under the sample, and the second one is facing the camera objective (Canon EF 100 mm, aperture mounted on a DSLR Canon 6D), which is focused on the semi-reflective blade. In this configuration the entire surface of the plate is imaged with a spatial resolution of 352 m/pixel.
II.2 Samples
In the present study, we monitor the drying of three different samples: () distilled water, () water-glycerol mixtures with an initial weight fraction in glycerol (Sigma Aldrich, G9012, 99.5) ranging between 20% wt. and 60% wt., and () a suspension of silica nanoparticles (Ludox HS-40, Sigma Aldrich) with a particle diameter of 12 nm and a specific surface area of 220 m2.g-1. The mass fraction of the as-purchased-dispersion is 40% wt., which corresponds to an initial volume fraction of . The suspension was degassed for 10 h under vacuum before testing. The colloids are stabilized by the presence of negative silanol groups at their free surface, which attract Na+ cations in solution, hence forming an electrical double layer (EDL) responsible for the strong repulsive interaction between colloids. Several studies have shown that these colloids and their EDL display an elastic behavior well below the usual random close packing fraction. For Ludox HS-40, it was found that the critical volume fraction beyond which a solid-like response dominates Loussert, Bouchaudy, and Salmon (2016); Di Giuseppe et al. (2012); Boulogne et al. (2014); Ziane and Salmon (2015).
II.3 Constant gap vs. zero normal force protocol
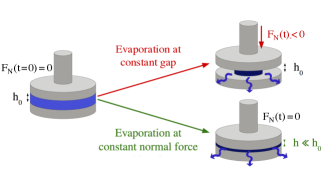
Following the loading of the sample, the top plate is put in contact with the sample, and the normal force is reset to N. As the volatile components of the sample slowly evaporates at the periphery of the plate, the volume of the sample decreases (Fig. 1). On the one hand, if the gap height is maintained constant, the evaporation leads to a decrease of the curvature radius of the fluid meniscus at the periphery the cell. As a result, capillary forces pull on the upper plate of the geometry, leading to an increase of the absolute value of the normal force, which is about , where is the surface tension at the air-fluid interface, and is the radius of curvature of the air/sample meniscus, with . In the first case, the sample considered is water and N, which is larger than the sensitivity of the rheometer’s normal force sensor (0.5 mN). Eventually, as the evaporation goes on, the contact line of the sample at the plate periphery contracts radially and the amount of sample left inside the geometry does not cover the entire surface of the plates, yielding a systematic error in the determination of the shear stress. On the other hand, if the normal force is maintained constant, equal to zero, while the gap height is left free to vary, the latter will decrease to compensate for the increase in the capillary forces induced by the sample evaporation, and indeed maintain N. As a result, the sample will occupy a constant surface area identical to that of the plates, thus allowing for bulk rheological measurements, while the sample is slowly evaporating. In the rest of the paper, we validate and use this ZNF protocol to monitor the temporal evolution of the rheological properties of drying Newtonian fluids and viscoelastic samples.
III Results and discussion
III.1 Measuring the viscosity of a drying Newtonian liquid
To validate the ZNF protocol, we monitor the viscosity of a single-component Newtonian fluid sample composed of distilled water during evaporation from the parallel-plate geometry at C over 30 min. The experiment is repeated twice in two different configurations. In the first experiment, the sample dynamics viscosity , where is the viscous modulus is assessed by oscillations of constant strain amplitude =50% at a frequency Hz. In the second experiment, the shear viscosity , where is the measured shear stress is monitored under continuous shear at a fixed shear rate 10 s-1. The results are summarized in Figure 2.
In both cases, the normal force is successfully maintained equal to zero (within 2%) [Fig. 2(a) and 2(d)], while the gap height decreases by about 4% over the entire duration of the experiment to compensate for the decrease in the sample volume induced by evaporation [Fig. 2(b) and 2(e)]. Moreover, the viscosity is measured to be constant throughout both types of experiments, i.e., the dynamic viscosity determined under oscillations, and the shear viscosity are both constant in time and within error bars compatible with tabulated viscosity values of water at 25∘C ( = 0.89 mPa.s – see for instance IAPWS 2008) [Fig. 2(c) and 2(f)]. Note that the viscosity measurements under oscillatory shear [Figs. 2(c)] show more noise than under continuous shear [Figs. 2(f)]. This observation can be explained by the fact that the torque applied during an oscillatory shear experiment (2 nN.m) is closer to the lower torque detection limit ( 0.5 nN.m) than the torque applied during a steady-shear experiment (420 nN.m).
Following the same ZNF protocol, we were able to monitor the viscosity of water under continuous shear for more than 10h during which the gap decreases by about 60% (see Fig. 7 in Appendix A). The continuous relative gap decrease over time is a direct measurement of the evaporation rate, which allows us to compute the mass flux of water leaving the shear cell as g.m-2.s-1 at 25∘C. This estimate is in good agreement with the values reported in the literature measured with different experimental techniques Gatapova et al. (2014); Kuznetsov et al. (2019). Repeating the drying experiment under continuous shear at different temperatures allows us to confirm that the temperature dependence of the evaporation rate follows a scaling that is in agreement with previous work Sobac and Brutin (2012) (see Fig. 8 in Appendix B). Furthermore, the viscosity was found to decrease with increasing temperature likewise in agreement with reported values of water viscosity Cheng (2008). In conclusion, the results from this section on single-component Newtonian fluids demonstrate the validity of the ZNF protocol.
III.2 Measuring the viscosity of drying water-glycerol mixtures
In this section, we monitor the viscosity of a Newtonian fluid composed of two miscible liquids, only one of which is volatile. Specifically, we apply the ZNF protocol to the study of drying water-glycerol mixtures by measuring the increase in viscosity as a function of water evaporation. Similar to section III.1, we monitor the drying of the samples by applying either an oscillatory shear (50%, Hz) or a continuous shear (10 s-1), thereby providing measurements of the dynamic viscosity and the shear viscosity , respectively.
We first discuss results from a mixture with a 20% wt. glycerol content, which are reported in Figure 3. A constant normal force is maintained during 4 hours of both oscillatory and continuous shear [Fig. 3(a) and 3(e)]. The gap thickness decreases by about 70% wt. in both experiments due to water evaporation [Fig. 3(b) and 3(f)], whereby the weight fraction in glycerol increases as manifested by an increase in sample viscosity [Fig. 3(c) and 3(g)]. Moreover, the relative gap decrease follows an exponential behavior with a characteristic time h and 3.1 h for continuous and oscillatory shear tests, respectively. These timescales are shorter than the ones reported for evaporation experiments conducted between static circular plates separated by a fixed gap Daubersies and Salmon (2011), most likely due to the presence of additional convective flows in the air surrounding the shear cell, which speed up the evaporation.
Let us now have a closer look at the evolution of the sample dynamic viscosity reported in Fig. 3(c). In the first stage of the drying experiment, i.e., for 1.2 h, the dynamic viscosity of the water-glycerol mixture agrees well with tabulated viscosity values of water-glycerol mixtures Cheng (2008) [continuous red line in Fig. 3(c)], based on glycerol concentrations determined from the gap decrease [Fig. 3(b)]. This result suggests that the glycerol concentration is homogeneous in the shear cell. However, for , the dynamic viscosity significantly differs from the tabulated values. This discrepancy most likely originates from the formation of a concentration gradient along the radial direction of the shear cell. Indeed, concentration gradients were reported in drying experiments performed in geometries of fixed volume Daubersies and Salmon (2011) for Peclet numbers, , where is the sample size, is the diffusion coefficient of glycerol in water and is the characteristic time of evaporation. In that context, represents the diffusive length-scale in the sample of size . For the experiments reported in Fig. 3(c), Pe , which supports the idea that the glycerol concentrates at the rim of the parallel-plate geometry, forming a ring of non-volatile fluid, which limits the water evaporation. As a result, the drying of the sample slows down, as evidenced by the decrease in speed at which the gap diminishes [Fig. 3(b)]. In contrast, the viscosity measured under continuous shear is in excellent agreement at all times with literature values Cheng (2008), which suggests that the glycerol concentration remains more homogeneous along the radial direction under continuous shear flow conditions.
To make sense of the time-evolution of the dynamic viscosity for [Figure. 3(c)], we assume the existence of a linear gradient of glycerol along the radial direction with a larger glycerol concentration at the edge of the plate. The glycerol concentration at a position and time reads: , where is the mass fraction at the center of the geometry () and the concentration gradient. We can determine the values of and at each point in time, using mass conservation and the viscosity measured with the rheometer during the drying experiment. First, the mass conservation in glycerol reads , where denotes the gap height, stands for the average mass fraction of glycerol at a time , and is the initial volume fraction in glycerol, originally homogeneous in the sample. The average mass fraction provides a first equation to determine and , namely:
| (1) |
Second, the rheometer displays the viscosity of the sample computed at the rim of the geometry, without any single-point correction Montgomery and Zhizhong (2006). Using tabulated values of the viscosity for water-glycerol mixtures Cheng (2008), we compute the mass fraction of glycerol at the edge of the shear cell:
| (2) |
Finally, the resolution of the linear system of Eqs. (1) and (2) leads to the determination of the glycerol concentration at the center of the cell and the gradient at all time during the experiment.
The profile of glycerol concentration obtained with this method is shown as a spatio-temporal diagram in Fig. 3(d). The same approach applied to the viscosity measurement performed under continuous shear are also reported in Fig. 3(h). We note that a gradient develops beyond for oscillatory measurements, with , whereas the gradient remains negligible for measurement under continuous shear at s-1 (see Fig. 9 in Appendix C). Continuous shear allows for the homogenization of the water-glycerol mixture while the water evaporates, whereas oscillatory shear is less efficient in doing so. Strikingly, this result for continuous shear depends on the shear intensity , and imposing a larger shear rate leads to a detrimental effect, e.g., imposing s-1 leads to the formation of a gradient, with (see Fig. 10 in Appendix D). In that case, the volume fraction of glycerol is larger at the center of the shear cell as a result of the influence of on the diffusion of glycerol in water Rusu et al. (1999). Therefore, we conclude that a continuous shear of moderate intensity is the most appropriate method to monitor the time-evolution of the viscosity of a dehydrating water-glycerol mixture.
To illustrate the robustness of our results, we have repeated the drying experiments for water-glycerol mixtures with two other glycerol mass fractions, namely 40% wt. and 60% wt. The viscosity of the drying mixtures is monitored as before, with the ZNF protocol under oscillatory and continuous shear. We report the viscosity as a function of the glycerol concentration for the three water-glycerol mixtures (i.e., 20, 40 and 60% wt.) in Fig. 4(a), which displays the mixture viscosity as a function of the glycerol weight fraction determined from the gap decrease, assuming that only water is evaporating. The data sets for the three mixtures are reported separately in Fig. 4(b), (c) and (d). Except for the long-time measurements in the case of the 20% wt. discussed above, all the experimental data are in excellent agreement with tabulated viscosity values of water-glycerol mixtures of various composition, in the absence of any evaporation. These results suggests that the 40% wt. and 60% wt. glycerol solutions are much less prone to develop concentration gradients. Our results therefore demonstrate that the ZNF protocol allows us to accurately monitor the continuously increasing viscosity of a drying Newtonian liquid.
III.3 Monitoring the drying-induced sol-gel transition in a colloidal suspension
In this section, we use the ZNF protocol to monitor the rheological properties of a drying aqueous suspension of charged silica nanoparticles. The experiments are here performed in a parallel-plate geometry, whose bottom plate is transparent in order to visualize the sample (see section II.1 for details).
We first discuss the case of a drying aqueous suspension monitored by oscillatory shear. The linear viscoelastic moduli are determined at Hz, with a variable strain amplitude , which is adjusted to the sample viscoelastic properties so as to optimize the sensitivity of the measurement, without affecting the gelation process Ewoldt, Johnston, and Caretta (2015). We found empirically that a good compromise consists in imposing a large strain amplitude % while the sample is mainly viscous before switching to a small amplitude % as soon as becomes comparable to to avoid damaging the soft solid that is forming as a result of the solvent evaporation. Such a strain-adapted protocol allows us to monitor the temporal evolution of the elastic and viscous modulus of the suspension over 12h, while the solvent evaporates. The results are plotted as a function of time in Fig. 5(d), and the same data are reported in Fig. 6(a) as a function of the volume fraction, which is inferred from the gap variation.
At the start of the experiment, the sample is liquid and characterized solely by its viscous modulus , which slowly increases as the solvent evaporates [Fig. 5(d)]. At h, the sample shows a linear viscoelastic response such that . Beyond h, both modulus increase as a result of the solvent evaporation up to h at which crosses , marking the emergence of a yield stress. The crossing of and marked by a dashed vertical line in Fig. 5(d) and Fig. 6(a) occurs at a volume fraction , which is in reasonable agreement with the value expected for Ludox HS-40, i.e., Loussert, Bouchaudy, and Salmon (2016); Di Giuseppe et al. (2012); Boulogne et al. (2014); Ziane and Salmon (2015). Note that up to , the normal force is correctly maintained within the interval 0.01) N [Fig. 5(a)], while the relative gap decrease speeds up before reaching [Fig. 5(b)]. Beyond the intersection of an , i.e., for h (or ), both and increase up to h, where they reach a plateau such that . Interestingly, the viscoelastic plateau coincides with the cessation of the gap decrease, which suggests that the evaporation has completely stopped beyond h. Finally, for h, both and decrease while the gap stays constant, which hints at some local reorganization of the colloidal glass, without any supplemental loss of solvent.
To confirm this scenario, we take advantage of the transparent bottom plate of the shear cell in which the drying experiment is conducted (see section II.1). Images of the entire surface of the sample shot through the transparent bottom plate and taken every 10 min allow us to quantify the local dynamics associated with the evaporation. The degree of correlation between two images separated by a lag time are determined by the ensemble-average intensity correlation function defined as follows:
| (3) |
where represents the brightness of the pixel , the average over all the pixels Cipelletti et al. (2002); Divoux, Mao, and Snabre (2015). The correlation function is further normalized into a function noted , which satisfies . The normalized correlation function is computed at a frame rate of about 1.6 mHz with a lag time ranging between 0 and 1 h. The results are pictured in a lag-time temporal diagram in Fig. 5(c). At any point in time for h, the images slowly de-correlates over h. The rate of decorrelation decreases abruptly in the vicinity of the gelation point ( h) before stopping completely at h when the elastic and viscous modulus reach a plateau. The lack of decorrelation beyond h confirms that the cessation of the gap decrease visible in Fig. 5(b) marks the end of the evaporation, which results from the formation of a solid crust at the sample edge. Such a solid crusts isolating the sample from the ambient atmosphere is indeed visible, when separating the two plates at the end of an experiment.
We now turn to drying experiments performed on the suspension of silica particles under continuous shear, at s-1. The results, including the shear viscosity, are reported as a function of time in Fig. 5(e–h), and of the volume fraction in Fig. 6(b). As the solvent evaporates, the viscosity rises over time at increasing speed [Fig. 5(h)]. The normal force is correctly set to 0.01) N [Fig. 5(e)], while the relative gap decrease shows a somewhat linear trend over the 4.5 h that the experiment lasts [Fig. 5(f)]. Note that the total relative gap decrease is % at h, which is comparable to the value reached at the same time for experiments performed under oscillatory shear [see Fig. 5(b)]. However, here the gap decrease accompanies a spatially homogeneous increase of the particle volume fraction, as confirmed by images of the drying suspension. Indeed, the normalized correlation function pictured in Fig. 5(g) shows roughly the same rate of decorrelation as a function of the lag-time for the entire duration of the experiment. This observation shows that, in stark contrast with the experiments performed under oscillatory shear, drying experiments performed under constant shear yield a spatially more homogeneous sample, thus preventing the formation of a solid crust.
As supplemental evidence that the drying colloidal suspensions remains homogeneous under continuous shear, we find that the corresponding viscosity measured as a function of time, and reported in Fig. 6(b) as a function of the volume fraction , is well-described by the Quemada model that reads Quemada (1977):
| (4) |
where is the viscosity of the solvent and is the volume fraction at maximum packing. Such a model has been successfully applied to describe the rheology of Ludox suspensions Di Giuseppe et al. (2012); Sobac et al. (2020). Here too, this phenomenological model describes our data very well with , in good agreement with the value expected for suspensions for Ludox HS-40. The fact that , and the good agreement of with the literature, confirm that the sample remains more spatially homogeneous during the experiment performed under continuous shear. Indeed, assuming a linear gradient of concentration following the steps discussed in section III.2 yields negligible values of [see Fig. 9(b) in Appendix C]. This result shows that drying experiments performed under continuous shear yield more accurate values of than experiments performed under oscillatory shear.
IV Conclusion
The ZNF protocol has been successfully applied to perform time-resolved rheological measurements during the drying of Newtonian fluids and colloidal suspensions. This protocol can be employed with both oscillatory shear and continuous shear to measure in a single experiment with only one sample loading what is usually obtained with multiple measurements on samples of various concentrations, in the absence of evaporation. Moreover, we have shown that in comparison to oscillatory shear experiments, continuous shear at moderate intensity allows for the homogenization of the sample, which limits the growth of spatial gradients and therefore leads to more accurate rheological measurements. This work constitutes a proof of concept and opens new perspectives for determining the macroscopic rheological properties of viscoelastic samples subject to solvent evaporation, and monitor their eventual sol-gel or glass transition. Moreover, we have observed that depending on the shear intensity applied during the dehydration of the sample, one may control the spatial gradient of concentration that builds up in a sample, which is sandwiched between two parallel disks and dries along the radial direction. As such, beyond providing an accurate method for bulk rheological measurements on drying samples, our work suggests a simple way for making solids with spatially modulated mechanical properties. Future work will be focused on the characterization of the local mechanical properties of such heterogeneous solids produced from the drying of colloidal suspensions under external shear.
Acknowledgements.
The authors kindly acknowledge M. Lenz, S. Manneville, B. Mao, G.H. McKinley, J.-B. Salmon and P. Snabre for fruitful discussions, and the support from the MIT-France program from the MIT International Science and Technology Initiative.Appendix A long-duration drying experiment on water
To complement the drying experiments performed on distilled water over a short duration of typically 30 min, we report here the case of a 10h-long experiment. The results, displayed in Fig. 7, show that the ZNF protocol allows us to measure accurately the viscosity of water, while the volume of the sample decreases by 60%.
Appendix B Impact of temperature on the drying rate
Here we show in Fig. 8 that the ZNF protocol allows to monitor accurately the viscosity of distilled water drying at different temperatures, ranging between 25∘C and 40∘C.
Appendix C Estimate of the linear gradient
We report in Fig. 9 the values of the model linear gradients for the experiments performed on water-glycerol mixtures [Fig. 9(a)] and suspensions of silica colloids [Fig. 9(b)]. We show that the concentration gradients due to the solvent evaporation are positive under oscillatory shear and continuous shear of moderate intensity ( s-1), whereas the gradient is negative under continuous shear of larger intensity ( s-1). We do not observe any gradient for a drying experiment performed on a suspension of silica particles under continuous shear ( s-1).
Appendix D Drying water-glycerol mixture under large continuous shear
We show in Fig.10 the viscosity measurement of a water glycerol mixture (initial content of 20% wt. in glycerol) under continuous shear ( s-1). Contrary to the case of s-1 that is reported in the main text in Fig. 3(e-h), one can see the formation of a positive gradient of concentration, i.e., water accumulates at the periphery of the shear cell. After h, one cane see the departure of the measured viscosity from the expected value for spatially homogeneous drying.
References
- Boger and Rama Murthy (1969) D. V. Boger and A. V. Rama Murthy, “Note: Normal stress measurement and evaporation effects on the weissenberg rheogoniometer,” Transactions of the Society of Rheology 13, 405–408 (1969).
- Macosko (1994) C. Macosko, Rheology. Principles, measurements, and applications. (Wiley - VCH, New York, 1994).
- Ewoldt, Johnston, and Caretta (2015) R. H. Ewoldt, M. T. Johnston, and L. M. Caretta, “Complex fluids in biological systems.” (2015) Chap. Experimental Challenges of Shear Rheology: How to Avoid Bad Data., pp. 207–241.
- Orafidiya (1989) L. O. Orafidiya, “Continuous shear rheometry of o/w emulsions; control of evaporation in cone/plate geometry,” J. Pharm. Pharmacol. 41, 341–342 (1989).
- Wee and Mackley (1998) W.-K. Wee and M. Mackley, “The rheology and processing of a concentrated cellulose acetate solution,” Chemical Engineering Science 53, 1131 – 1144 (1998).
- Sato and Breedveld (2005) J. Sato and V. Breedveld, “Evaporation blocker for cone-plate rheometry of volatile samples,” Appl. Rheol. 15, 390–397 (2005).
- Lee, Lu, and Shen (2006) C. H. Lee, Y. Lu, and A. Q. Shen, “Evaporation induced self assembly and rheology change during sol-gel coating,” Phys. Fluids 18, 052105 (2006).
- Prevo, Kuncicky, and Velev (2007) B. G. Prevo, D. M. Kuncicky, and O. D. Velev, “Engineered deposition of coatings from nano- and micro-particles: A brief review of convective assembly at high volume fraction,” Colloids and Surfaces A: Physicochemical and Engineering Aspects 311, 2 – 10 (2007), engineering Particle Technology.
- Leng et al. (2006) J. Leng, B. Lonetti, P. Tabeling, M. Joanicot, and A. Ajdari, “Microevaporators for kinetic exploration of phase diagrams,” Phys. Rev. Lett. 96, 084503 (2006).
- Merlin, Salmon, and Leng (2012) A. Merlin, J.-B. Salmon, and J. Leng, “Microfluidic-assisted growth of colloidal crystals,” Soft Matter 8, 3526–3537 (2012).
- Lidon and Salmon (2014) P. Lidon and J.-B. Salmon, “Dynamics of unidirectional drying of colloidal dispersions,” Soft Matter 10, 4151–4161 (2014).
- Piroird et al. (2016) K. Piroird, V. Lazarus, G. Gauthier, A. Lesaine, D. Bonamy, and C. L. Rountree, “Role of evaporation rate on the particle organization and crack patterns obtained by drying a colloidal layer,” Europhys. Lett. 113, 38002 (2016).
- Endruweit, Johnson, and Long (2006) A. Endruweit, M. S. Johnson, and A. C. Long, “Curing of composite components by ultraviolet radiation: A review,” Polym. Compos. 27, 119–128 (2006).
- Poth (2001) U. Poth, “Drying oils and related products,” in Ullmann’s Encyclopedia of Industrial Chemistry (American Cancer Society, 2001).
- Zhou et al. (2013) C. Zhou, X. Lu, Z. Xin, J. Liu, and Y. Zhang, “Hydrophobic benzoxazine-cured epoxy coatings for corrosion protection,” Prog. Org. Coat. 76, 1178–1183 (2013).
- Fudge et al. (2009) D. S. Fudge, T. Winegard, R. Ewoldt, D. Beriault, L. Szewciw, and G. McKinley, “From ultra-soft slime to hard -keratins: The many lives of intermediate filaments,” Integr. Comp. Biol. 49, 32–39 (2009).
- Miserez et al. (2008) A. Miserez, T. Schneberk, C. Sun, F. W. Zok, and J. H. Waite, “Dynamic light scattering at low rates of shear,” Science 319, 1816–1819 (2008).
- Zakharov and Scheffold (2010) P. Zakharov and F. Scheffold, “Monitoring spatially heterogeneous dynamics in a drying colloidal thin film,” Soft Materials 8, 102–113 (2010).
- Molenaar, Svanholm, and Toussaint (1997) F. Molenaar, T. Svanholm, and A. Toussaint, “Rheological behaviour of latexes in-can and during film drying,” Progress in Organic Coatings 30, 141 – 158 (1997).
- Figliuzzi et al. (2012) B. Figliuzzi, D. Jeulin, A. Lemaître, G. Fricout, J. J. Piezanowski, and P. Manneville, “Rheology of thin films from flow observations,” Exp. Fluids 53, 1289–1299 (2012).
- Bodiguel and Leng (2010) H. Bodiguel and J. Leng, “Imaging the drying of a colloidal suspension,” Soft Matter 6, 5451–5460 (2010).
- Kim et al. (2013) J. C. Kim, M. Seo, M. A. Hillmyer, and L. F. Francis, “Magnetic microrheology of block copolymer solutions,” ACS Appl. Mater. Interfaces 5, 11877–11883 (2013).
- Komoda, Leal, and Suires (2014) Y. Komoda, L. G. Leal, and T. M. Suires, “Local, real-time measurement of drying films of aqueous polymer solutions using active microrheology,” Langmuir 30, 5230–5237 (2014).
- Castro et al. (2017) D. J. Castro, J.-O. Song, R. K. Lade, and L. F. Francis, “Magnetic microrheology for characterization of viscosity in coatings,” in Protective Coatings: Film Formation and Properties, edited by M. Wen and K. Dušek (Springer International Publishing, Cham, 2017) pp. 115–136.
- Mao, Divoux, and Snabre (2016) B. Mao, T. Divoux, and P. Snabre, “Normal force controlled rheology applied to agar gelation,” J. Rheol. 60, 473–489 (2016).
- Mao et al. (2017) B. Mao, A. Bentaleb, F. Louerat, T. Divoux, and P. Snabre, “Heat-induced aging of agar solutions: Impact on the structural and mechanical properties of agar gels,” Food Hydrocolloids 64, 59–69 (2017).
- Beniazza et al. (2020) R. Beniazza, N. Bayo, D. Jardel, R. Rust, B. Mao, T. Divoux, M. Schmutz, F. Castet, G. Raffy, A. Del Guerzo, N. D. McClenaghan, T. Buffeteau, and J.-M. Vincent, “A fluorous sodium l-prolinate derivative as low molecular weight gelator for perfluorocarbons,” Chem. Commun. 56, 8655–8658 (2020).
- Loussert, Bouchaudy, and Salmon (2016) C. Loussert, A. Bouchaudy, and J.-B. Salmon, “Drying dynamics of a charged colloidal dispersion in a confined drop,” Phys. Rev. Fluids 1, 084201 (2016).
- Di Giuseppe et al. (2012) E. Di Giuseppe, A. Davaille, E. Mittelstaedt, and M. François, “Rheological and mechanical properties of silica colloids: from newtonian liquid to brittle behaviour,” Rheol. Acta 51, 451–465 (2012).
- Boulogne et al. (2014) F. Boulogne, L. Pauchard, F. Giorgiutti-Dauphiné, R. Botet, R. Schweins, M. Sztucki, J. Li, B. Cabane, and L. Goehring, “Structural anisotropy of directionally dried colloids,” Europhys. Lett. 105, 38005 (2014).
- Ziane and Salmon (2015) N. Ziane and J.-B. Salmon, “Solidification of a charged colloidal dispersion investigated using microfluidic pervaporation,” Langmuir 31, 7943–7952 (2015).
- Gatapova et al. (2014) E. Y. Gatapova, A. A. Semenov, D. V. Zaitsev, and O. A. Kabov, “Evaporation of a sessile water drop on a heated surface with controlled wettability,” Colloids Surf. A Physicochem. Eng. Asp. 441, 776–785 (2014).
- Kuznetsov et al. (2019) G. Kuznetsov, S. Kralinova, I. Voytkov, and A. Islamova, “Rates of high-temperature evaporation of promising fire-extinguishing liquid droplets,” Appl. Sci. 9, 5190 (2019).
- Sobac and Brutin (2012) B. Sobac and D. Brutin, “Thermal effects of the substrate on water droplet evaporation,” Phys. Rev. E 86, 021602 (2012).
- Cheng (2008) N.-S. Cheng, “Formula for the viscosity of a glycerol-water mixture,” Ind. Eng. Chem. Res. 47, 3285–3288 (2008).
- Daubersies and Salmon (2011) L. Daubersies and J.-B. Salmon, “Evaporation of solutions and colloidal dispersions in confined droplets,” Phys. Rev. E 84, 031406 (2011).
- Montgomery and Zhizhong (2006) T. S. Montgomery and Z. L. Zhizhong, “Single-point determination of nonlinear rheological data from parallel-plate torsional flow,” Appl. Rheol. 2, 70–79 (2006).
- Rusu et al. (1999) D. Rusu, D. Genoe, P. van Puyvelde, E. Peuvrel-Disdier, P. Navard, and G. Fuller, “Dynamic light scattering during shear: measurements of diffusion coefficients,” Polymer 40, 1353 – 1357 (1999).
- Cipelletti et al. (2002) L. Cipelletti, H. Bissig, V. Trappe, P. Ballesta, and S. Mazoyer, “Time-resolved correlation: a new tool for studying temporally heterogeneous dynamics,” J. Condens. Matter Phys. 15, S257–S262 (2002).
- Divoux, Mao, and Snabre (2015) T. Divoux, B. Mao, and P. Snabre, “Syneresis and delayed detachment in agar plates,” Soft Matter 11, 3677–3685 (2015).
- Quemada (1977) D. Quemada, “Rheology of concentrated disperse systems and minimum energy dissipation principle,” Rheol. Acta 16, 82–94 (1977).
- Sobac et al. (2020) B. Sobac, S. Dehaeck, A. Bouchaudy, and J.-B. Salmon, “Collective diffusion coefficient of a charged colloidal dispersion: interferometric measurements in a drying drop,” Soft Matter 16, 8213–8225 (2020).