Characterization of VUV4 SiPM for Liquid Argon Detector
Abstract
Particle detectors based on liquid argon are now recognised as an attractive technology for dark matter direct detection and coherent elastic neutrino-nucleus scattering measurement. A program using a dual-phase liquid argon detector with a fiducial mass of 200 kg to detect coherent elastic neutrino-nucleus scattering at Taishan Nuclear Power Plant has been proposed. SiPMs will be used as the photon sensor because of their high radio-purity and high photon detection efficiency. S13370-6050CN SiPM, made by Hamamatsu, is a candidate for the detector. In this paper, the characterisation of S13370-6050CN SiPM, including the cross talk and after pulse probabilities at liquid argon temperature and the temperature dependence of breakdown voltage, dark counting rate and relative quantum efficiency were presented.
keywords:
Coherent Elastic Neutrino-nucleus Scattering , Liquid Agron , SiPM1 Introduction
Coherent elastic neutrino-nucleus scattering (CENS), which was first theorised by Freedman in 1974 [1], is the dominant process for neutrinos with energies less than 100 MeV. The COHERENT collaboration achieved the first measurement of CENS by using a 14.6 kg CsI(Na) crystal detector to detect the neutrinos from the spallation neutron source at Oak Ridge National Laboratory (ORNL) in 2017 [2]. Recently, they reported the first detection of CENS on argon using the CENNS-10 liquid argon detector [3]. A dual-phase liquid argon time projection chamber (TPC) with 200 kg fiducial mass was proposed to measure -Ar CENS process in China [4]. The detector is expected to be adjacent to the JUNO-TAO experiment [5], which is about 35 m from a reactor core of Taishan Nuclear Power Plant. Since the energy of the recoil nucleus is concentrated in the sub-keV region and the event rate is very low, single photon detection ability and high detector radio-purity, including the target and detector components, are the basic detector requirements.
Silicon photo-multipliers (SiPM), which were originally developed in Russia in the mid-1980s [6], underwent rapid development in the past few years and are expected to be a possible replacement of conventional photo-multiplier tubes (PMT). Compared with PMTs, SiPMs have lower radioactive background and higher photon quantum efficiency, which make them very promising as the photon sensors for low background experiments. However, the gain of SiPM is usually 106, thus a suitable amplifier must be used to detect single photon. A set of SiPM and preamplifier which can be used at liquid argon temperature is crucial for our experiment.
The S13770-6050CN [7] SiPM examined in this paper is specially developed for cryogenic experiments by Hamamatsu and has been widely used in liquid xenon (LXe) detectors [8, 9]. However, liquid argon (LAr) detectors require a lower temperature of 87 K and its performance has not been studied in detail.
The main purpose of this work is to study the the possible use of the S13370-6050CN SiPM in our liquid argon detector. While our experiment is in the R&D phase, we consider DarkSide-20 [18] to be a useful term of comparison. According to Ref. [18], the SiPM used in a dual-phase liquid argon detector needs to meet at least the following two criteria:
A. The dark counting rate (DCR) should be less than 0.1 Hz/mm2 to keep pulse shape discrimination effective;
B. The total correlated noise probability, namely the sum of direct crosstalk (DiCT), delayed crosstalk (DeCT) and after pulse(AP), should be less than 60% for energy reconstruction of the S2 signal [18].
In addition to the measurement of DCR and correlated noises, the changes of break down voltage and relative quantum efficiency (QE) from 87 K up to room temperatures are also introduced in this paper.
2 Experimental Setup
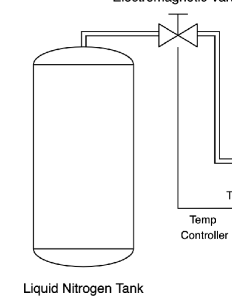
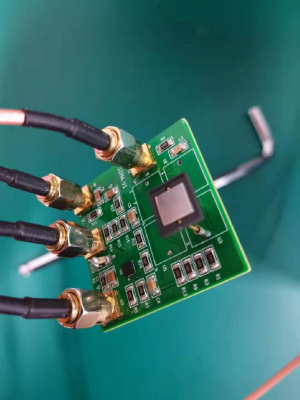
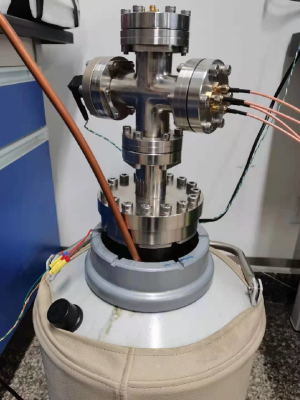
The scheme of the experimental setup is shown in Fig. 1. A 6 mm*6 mm SiPM (Fig. 2 left-side) chip is placed in a stainless steel (SST) chamber which is put in a dewar (Fig. 2 right-side). A liquid nitrogen tank is standing on the ground nearby for cooling the system by a copper tube. Two Pt100 temperature sensors have been used in this system as temperature detectors. One is located inside the SST chamber to monitor the temperature of the SiPM in real time, and the other is located in the inter-layer between the dewar and the SST chamber as the input signal of the temperature control system. It allows to intermittently inject liquid nitrogen by controlling the switch of the electromagnetic valve, so as to control the temperature. The accuracy of the temperature control system is 1 K and details can be found in Ref [10]. An LED with a peak wavelength of 425 nm is placed in the top of the SST chamber to be used as a light source. A silicon photocell (model LONGXINDA LXD44MQ) is placed next to the LED to monitor its stability [11]. The LED is driven by a pulse generator (Tektronix, AFG31102, 100M, 2CH). During the whole experiment, the LED and the silicon photocell rest at room temperature. Before being sent into the oscilloscope (LeCroy 610Zi, 250MHz sampling frequency) for pulses recording, signals from the SiPM are amplified by a LMH6629 preamplifier which worked at the same temperature as the SiPM and signals from the silicon photocell are amplified by a warm amplifier (model AD825 LF353). Two RAGOL DP831A DC power supplies provide 5 V working power for two amplifiers separately and a DH 1765-4 DC power supply (1 mV accuracy) serves as the bias source of the SiPM.
Four different kinds of DAQ setups have been used in the measurement.
(A) While measuring the breakdown voltage (Vbd), the LED is driven by the pulse generator with periodic square pulses of 1 kHz and the oscilloscope is triggered by synchronous pulses. Signals of the LED trigger and SiPM are recorded and the time window is set to 500 ns.
(B) While measuring the relative quantum efficiency (QE), the setups are basically the same as in case A except that the time window is set to 5 s and signals from the silicon photocell are also recorded.
(C) While measuring the correlated signal probabilities, the LED is off. Only the SiPM signals are recorded and the oscilloscope is in self-trigger mode. The time window is set to 500 s because we aim to analyze the correlated signals which follow the initial.
(D) While measuring DCR, the signals are directly sent to a LTD (CAEN, N844). The output of the LTD is sent to a scaler (CAEN, N145) for counting.
All the signals are recorded by the oscilloscope and the data sampling rate is set to 500 MS/s.
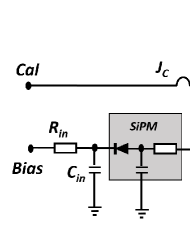
LMH6629 is a high-speed, ultra-low noise amplifier designed for the applications requiring wide bandwidth with high gain and low noise [12]. Although the data sheet claims that the amplifier works at 233 K to 398 K, the application reported in Ref. [13] shows that it can even work at 60 K. Therefore, in this work, LMH6629 is chosen to amplify the SiPM signals. The circuit diagram inherited from Ref. [13], is shown in Fig. 3 and the values of the components used in this work is presented in Tab. 1.
| Resistance | Rin | Rs | Rf | Rout | R- | R+ |
| Value | 10 k | 10 | 2 k | 50 | 2 k | 5 |
| capacitance | Cin | Cs | Cf | Cout | ||
| Value | 100 nf | 30 nf | 10 nf | 10 nf |
3 Stability test of LMH6629
The tests reported in Ref. [13] show that the amplifier LMH6629 can work at 60 K, but its cryogenic performance, especially the gain stability around 87 K, is not clear yet. Thus, before measuring the characterisation of the SiPM, the stability of LMH6629 amplifier needs to be estimated to guarantee the linearity of the SiPM outputs.
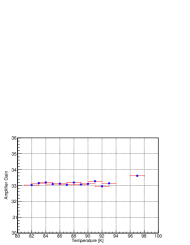
The circuit diagram shown in Fig. 3 is used in this measurement, but the SiPM is removed and junction Jc is connected. The input signals, which are periodic square pulses with 1 kHz frequency, are generated by the pulse generator mentioned in Sec. 2. The width of the input pulse is 100 ns and the amplitude is 2 mV. Two identical and synchronised signals are generated by a AFG31102 pulse generator from two output channels. One is directly sent to the oscilloscope for pulses recording, while the other is amplified before being sent to the oscilloscope. Ten thousands events were recorded in each temperature to calculate the charges of the input and output pulses. The charge ratio of the two signals is used to calculate the gain of the amplifier. Fig. 4 shows the gain variation with temperatures and the stability is within 2%, which is calculated according to (Maximum-Minimum)/Average. Systematic uncertainties from the temperature controller have been presented in the X-axis.
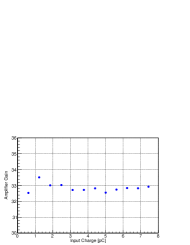
Besides temperatures, the input charge may also affect the amplifier gain. According to Ref. [7], the typical gain of S13370-6050CN SiPM is 5.8 106, thus one photoelectron (P.E.) corresponds to a charge of 0.9 pC. In the test of gain variation with the input charge, the width of the input pulse is set to 100 ns which is the typical width of the SiPM output signal, while the amplitude changes from 2 mV to 15 mV which is equivalent to the input charge from 0.5 pC to 7.5 pC. The result is shown in Fig. 5 and the variation is within 3%.
4 Data Analysis
4.1 Signal composition
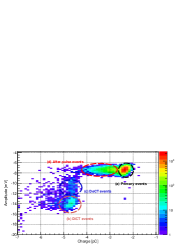
A custom data analysis program has been developed and a detailed analysis has been performed. For each event, the program calculates the amplitude and charge of the waveform. For simplicity, the amplitude of single photoelectron (SPE) is normalized to 1 P.E.A. and the charge of single photoelectron is normalized to 1 P.E.C.. Baseline has been subtracted while calculating the amplitude and charge. An example of a scatter distribution of charge and amplitude is shown in Fig. 6. The SiPM is operated at 87 K with 3 V over voltage (Vover), which is the difference between the supplying bias and the breakdown voltage. The events shown in Fig. 6 consist of the following four parts [15, 14, 16]:
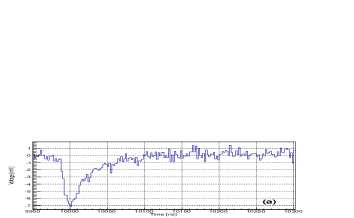
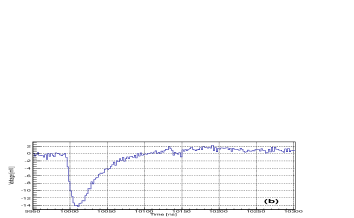
A. Dark noise : In the absence of light, dark noise, which is produced by carriers generated in the depletion region, constitutes the main part of the signal. The dark noise is SPE event thus has an amplitude centred at 1 P.E.A. and a charge centred at 1 P.E.C.. A sample pulse of dark noise is shown in Fig. 7-(a).
B. Direct crosstalk: Direct crosstalk (DiCT) is caused by a photon which is emitted by the movement of accelerated carriers in the strong field during the primary avalanche triggering a neighbouring pixel within an extremely short time interval. Thus, a DiCT signal has an amplitude centred at 2 P.E.A. and a charge centred at 2 P.E.C., which is just similar to a 2 P.E. event. A sample pulse of DiCT is shown in Fig. 7-(b).
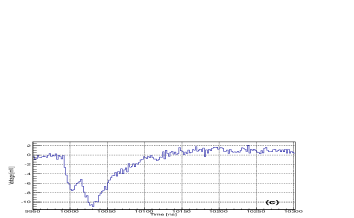
C. Delayed crosstalk: Delayed crosstalk (DeCT) occurs when the photons produced in the primary avalanche absorbed in the non-depleted region of a neighbouring cell. Before triggering a second avalanche, the carriers have to diffuse into the high-field region, thus the time difference between the two avalanches is around several nanosecond. Based on its mechanism, the amplitude of DeCT should be between 1 P.E.A. to 2 P.E.A. while the charge should be centred at 2 P.E.C.. An example pulse of DeCT is shown in Fig. 7-(c).
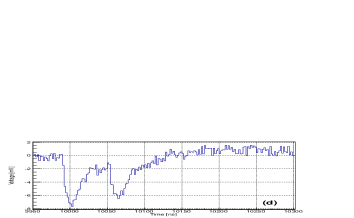
D. After pulse: After pulse (AP) is observed when a secondary electron is trapped by some sort of impurity during the primary avalanche. The trapped electron is then released after a characteristic time from nanosecond to microsecond and finally results a second avalanche. In principle, the time interval and energy distribution depend on the location of the trapped electron. The AP events should have an amplitude around 1 P.E.A. while its charge should be between 1 P.E.C. to 2 P.E.C. because the second avalanche discharge starts in the middle. The example pulse of AP is shown in Fig. 7-(d).
4.2 Pulse fitting
As described in Sec. 4.1, different kinds of signals can de identified with the charge and amplitude information. In order to better estimate the charge and time information of DeCT and AP events, a pulse fitting program has been developed.
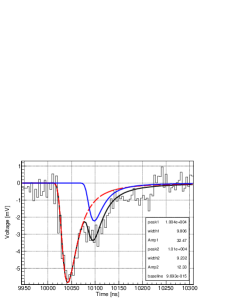
As can be seen from Fig. 7-(c) and Fig. 7-(d), the delayed pulse overlaps on the primary SPE pulse, thus the total waveform can be described according to Eq. 1, which is a superposition of two Landau Distributions [17] and a constant with seven parameters.
| (1) |
where A1, A2 represent the amplitudes, p1, p2 represent the locations and w1, w2 represent the widths of the two pulses, respectively, BL represents the baseline. The first term of Eq. 1 is for describing the primary pulse and the second term is for the delayed pulse. Fig. 8 shows an example of the fitting result of an AP event. DeCT event pulses have the same shape as AP events, thus Eq. 1 can be used to fit both kinds of signals.
5 Results
DCR and total correlated noise probability changes with the over voltage, therefore the breakdown voltage must be accurately measured.
5.1 Breakdown voltage
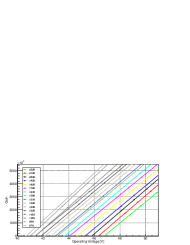
The breakdown voltage (Vbd) is the bias point at which the electric field strength generated in the depletion region is just sufficient to produce a Geiger discharge. When the bias is Vbd, the gain of a SiPM, which is defined as in Eq. 2, drops to exactly zero.
| (2) |
where G is the gain of the SiPM, Q is the charge of one avalanche, qe is the charge of an electron, I is the current, Vout is the output amplitude of the signal, Rload is the matching resistance of the oscilloscope, which is 50 , GAmp is the gain of the preamplifier, which is around 33 in this test.
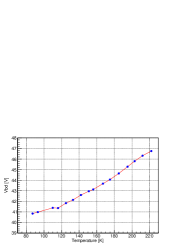
Vbd can be calculated as the intercept of linear fits with X-axis which is presented in Fig. 9. Fig. 10 shows the change of Vbd with temperature. Above 120 K, Vbd decreases linearly with temperature, which is about 0.5 V/10 K, while below 120 K the decrease tends to be slow.
5.2 Dark counting rate (DCR)
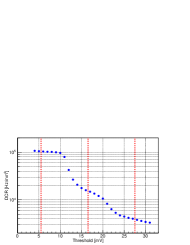
The dark current counting rate is due to thermally generated electrons that trigger an avalanche in the active volume. DCR can be measured with a counting system with a threshold of 0.5 P.E. level. The change of DCR with threshold is shown in Fig. 11 and the event rates at 0.5 P.E., 1.5 P.E., and 2.5 P.E. are indicated in the plot by the vertical dotted lines.
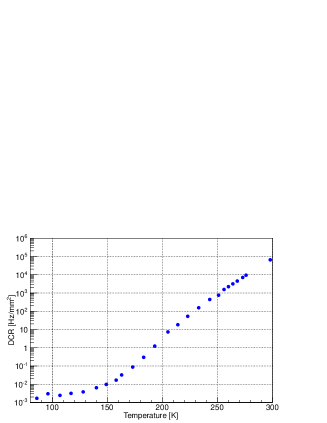
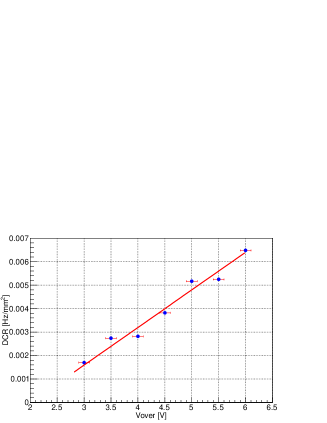
As discussed in Ref. [15, 16, 14], DCR depends on both temperature and Vover. The study of those dependences, shown in Fig. 12, indicate that the DCR of the tested SiPM is 0.003 Hz/mm2 at 87 K with an over voltage of 4 V.
5.3 Correlated signals
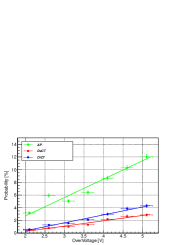
Correlated signals are the general term for DiCT, DeCT and AP, the definitions and characteristics of which are introduced in Sec. 4.1. Fig. 13 shows the changes of the probabilities of DiCT, DeCT and AP with different Vover. At 87K, the total correlated signal probability is 10% at Vover = 3 V, which could satisfy the requirements of using SiPM in a dual phase LAr detector [18].
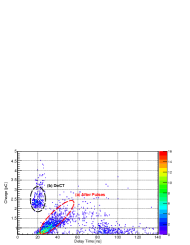
The time interval distribution between correlated pulses (DeCT and AP) and the primary DCR is shown in Fig. 14. X-axis is the time difference between the delayed pulse (p2) and the primary pulse(p1), which is calculated as p2-p1 of Eq. 1. Y-axis is the charge of the delayed pulse, which is the integral of the blue line shown in Fig. 8. The plot shows that there is a direct proportion between the delay time and the pulse energy for AP events, which possibly indicates that the further the electron is trapped from the anode (higher charge), the faster the electron is released from the impurity (shorter time interval).
5.4 Relative quantum efficiency
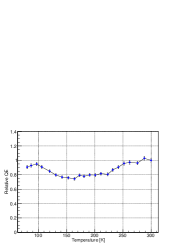
One of the advantages of S13370-6050CN SiPM is that it can directly detect the photons emitted by liquid argon, of which the wavelength is peaked at 128 nm. But the data sheet also claims that it has the largest quantum efficiency at 500 nm [7]. For liquid argon detectors, some [19, 20] prefer not to read the 128 nm photons directly, one reason is that the photon sensors have very low quantum efficiency at 128 nm and another reason is that the wavelength shifter, 1,1,4, 4-tetraphenyl-1,3-butadiene (TPB) [21], has more than 100% photon conversion efficiency [22], which means that more than one 420 nm photons will be emitted when one 128 nm photon is absorbed. According to our current experimental scheme, TPB will also be used. In Ref. [7], the quantum efficiency is measured at 298 K, while according to Ref. [23], the quantum efficiency at room temperatures and liquid argon temperature may be very different. In this work, a 425 nm LED is used to measure the relative quantum efficiency with an over voltage of 3 V. The result, plotted in Fig. 15, indicates that the quantum efficiency difference of S13370-6050CN SiPM between 300 K and 87 K is 10%.
6 Summary
A program of using liquid argon to detect -Ar CENS at Taishan Nuclear Power Plant has been proposed and SiPM will be used as the photon sensors. In order to study the possibility of using S13370-6050CN SiPM in our LAr detector, a cryogenic system has been developed and the temperature dependences of Vbd, DCR, correlated noises and relative QE has been measured in detail. Our results show that the DCR is below 0.003 Hz/mm2 and the total correlated noise is less than 10% at 87 K with 3 V over voltage, which indicate that the S13370-6050CN SiPM made by Hamamatsu is a good candidate for our liquid argon detector.
7 Acknowledgements
This work is supported by National Key R&D Program of China (Grant No. 2016YFA0400304) and National Natural Science Foundation of China (Grant No. 12020101004).
The authors would like to thank Alessandro Razeto, Paolo Musico and Gemma Testera of INFN for their help during the design of the readout system.
References
- [1] D.Z. Freedman, Coherent effects of a weak neutral current, Phys. Rev. D 9, 1389 (1974).
- [2] COHERENT collaboration, Observation of Coherent Elastic Neutrino-Nucleus Scattering, Science 357, 1123-1126 (2017).
- [3] COHERENT collaboration, First Detection of Coherent Elastic Neutrino-Nucleus Scattering on Argon, arXiv:2003.10630v6.
- [4] Yu-Ting Wei, Meng-Yun Guan, Jin-Chang Liu, Ze-Yuan Yu, Chang-Gen Yang, Cong Guo, Wei-Xing Xiong, You-Yu Gan, Qin Zhao, Jia-Jun Li, Prospects of detecting the reactor -Ar coherent elastic scattering with a low threshold dual-phase argon time projection chamber at Taishan, arXiv:2012.00966v3.
- [5] JUNO collaboration, TAO Conceptual Design Report: A Precision Measurement of the Reactor Antineutrino Spectrum with Sub-percent Energy Resolution, arXiv:2005.08745v1.
- [6] D. Renker, Geiger-mode avalanche photodiodes, history, properties and problems, NIM A 567 (2006) 48-56.
- [7] VUV MPPC datasheet, http://www.hamamatsu.com.cn.
- [8] G. Gallina et al., Characterization of the Hamamatsu VUV4 MPPCs for nEXO, NIM A 940 (2019) 371-379.
- [9] P. Nakarmi et al., Reflectivity and PDE of VUV4 Hamamatsu SiPMs in liquid xenon, JINST 15 (2020) P01019.
- [10] C. Guo, M.Y. Guan, X.L. Sun, W.X. Xiong, P. Zhang, C.G. Yang, Y.T. Wei, Y.Y. Gan, Q. Zhao, The liquid argon detector and measurement of SiPM array at liquid argon temperature, NIM A 980 (2020) 164488.
- [11] H. Yang, Z.F. Xu, J. Tang and Y. Zhang, Spin coating of TPB film on acrylic substrate and measurement of its wavelength shifting efficiency, NUCL SCI TECH 31 (2020) 28, arXiv:1911.08897.
- [12] LMH6629 datasheet, https://www.ti.com.
- [13] Marco D’Incecco, Cristiano Galbiati, Graham K. Giovanetti, George Korga, Xinran Li, Andrea Mandarano, Alessandro Razeto, Davide Sablone, and Claudio Savarese, Development of a Very Low-Noise Cryogenic Preamplifier for Large-Area SiPM Devices, IEEE Transactions on Nuclear Science 65 (2018) 1005-1011, doi: 10.1109/TNS.2018.2799325.
- [14] The DarkSide Collaboration, Cryogenic Characterization of FBK RGB-HD SiPMs, JINST 12 (2017) 9030.
- [15] An Introduction to the Silicon photomultiplier - SensL, https://www.sensl.com.
- [16] Patrick Eckert, Hans-Christian Schultz-Coulon, Wei Shen, Rainer Stamen, Alexander Tadday, Characterisation studies of silicon photomultipliers, NIM A 620 (2010) 217-226.
- [17] H. Fanchiotti, C. A. Garcia Canal and M. Marucho, The Landau distribution for charged particles traversing thin films, Int. J. Mod. Phys. C 17 (2006), 1461-1476, doi:10.1142/S0129183106009928.
- [18] The DarkSide Collaboration, DarkSide-20k: A 20 tonne two-phase LAr TPC for direct dark matter detection at LNGS, Eur. Phys. J. Plus 133 (2018) 131, https://doi.org/10.1140/epjp/i2018-11973-4.
- [19] The DarkSide collaboration, The DarkSide project, JINST 11 (2016) C02051, doi:10.1088/1748-0221/11/02/C02051.
- [20] The DEAP collaboration, Constraints on dark matter-nucleon effective couplings in the presence of kinematically distinct halo substructures using the DEAP-3600 detector, Phys. Rev. D 102 (2020) 082001, doi:10.1103/PhysRevD.102.082001.
- [21] W.M. Burton, B.A. Powell, Fluorescence of tetraphenyl-butadiene in the vacuum ultraviolet, Appl. Opt. 12 (1973) 87-89, doi: 10.1364/AO.12.000087.
- [22] V.M. Gehman, S.R. Seibert, K. Rielage, A. Hime, Y. Sun, D.-M. Mei, J. Maassen, D. Moore, Fluorescence efficiency and visible re-emission spectrum of tetraphenyl butadiene films at extreme ultraviolet wavelengths, NIM A 654 (2011) 116-121.
- [23] A. Lyashenko, T. Nguyen, A. Snyder, H. Wanga and K. Arisaka, Measurement of the absolute Quantum Efficiency of Hamamatsu model R11410-10 photomultiplier tubes at low temperatures down to liquid xenon boiling point, JINST 9 (2014) P11021.