The MicroBooNE Collaboration ††thanks: microboone_info@fnal.gov
Measurement of the Flux-Averaged Inclusive Charged-Current Electron Neutrino and Antineutrino Cross Section on Argon using the NuMI Beam and the MicroBooNE Detector
Abstract
We present a measurement of the combined + flux-averaged charged-current inclusive cross section on argon using data from the MicroBooNE liquid argon time projection chamber (LArTPC) at Fermilab. Using the off-axis flux from the NuMI beam, MicroBooNE has reconstructed 214 candidate + interactions with an estimated exposure of 2.4 protons on target. Given the estimated purity of 38.6%, this implies the observation of 80 + events in argon, the largest such sample to date. The analysis includes the first demonstration of a fully automated application of a dE/dx-based particle discrimination technique of electron and photon induced showers in a LArTPC neutrino detector. We measure the flux-averaged charged-current total cross section to be , for neutrino energies above 250 MeV and an average neutrino flux energy of 905 MeV when this threshold is applied. The measurement is sensitive to neutrino events where the final state electron momentum is above 48 MeV/c, includes the entire angular phase space of the electron, and is in agreement with the theoretical predictions from GENIE and NuWro. This measurement is also the first demonstration of electron neutrino reconstruction in a surface LArTPC in the presence of cosmic ray backgrounds, which will be a crucial task for surface experiments like those that comprise the Short-Baseline Neutrino (SBN) Program at Fermilab.
I Introduction
The measurement of electron neutrinos () appearing in a muon-neutrino beam is the cornerstone of current and future accelerator-based neutrino oscillation experiments. The appearance oscillation channel allows long-baseline experiments to determine the neutrino mass ordering Acero et al. (2018) and to search for CP violation in the neutrino sector Abi et al. (2020a); Abe et al. (2018). It further allows short-baseline experiments to shed light on the possible existence of sterile neutrinos Antonello et al. (2015). The success of these experiments relies on a precise understanding of electron-neutrino interactions with the detector target. LArTPCs are being employed to perform all of the above-mentioned measurements. MicroBooNE Acciarri et al. (2017a) and ICARUS Antonello et al. (2015) are already running, while SBND Antonello et al. (2015) and DUNE Abi et al. (2020b) are under construction. However, only ArgoNeuT Acciarri et al. (2020) has made a measurement of electron-neutrino interactions on argon which included a sample of 13 selected events. In addition, only a handful of measurements of electron-neutrino interactions on other nuclei in the hundred MeV to GeV range are available Blietschau et al. (1978); Abe et al. (2014); Wolcott et al. (2016).
The lack of precise electron-neutrino cross section measurements has been mitigated in short-baseline oscillation measurements by using interactions to constrain the oscillated flux and cross section models Aguilar-Arevalo et al. (2009, 2018). In such an approach, any uncertainty on the / cross section ratio would reduce the strength of the constraint that the can provide to a measurement. These differences, predicted to be on the order of 10%, arise from the different final state lepton mass, radiative corrections, and modifications to the pseudo-scalar form factor Day and McFarland (2012). The last of these effects can be difficult to calculate. Similarly, recent theoretical calculations of the charged-current (CC) to CC cross section ratios Nikolakopoulos et al. (2019) predict differences of as much as 25% between the and cross sections, particularly for forward-going leptons in the sub-GeV range. The uncertainty on the electron neutrino and antineutrino interaction model can be responsible for the majority of the uncertainty of the oscillation measurement Abe et al. (2020). Independent direct measurements of electron-neutrino cross sections are therefore crucial to further inform our understanding of different flavor neutrino interactions. Performing these measurements with high precision requires suppression of backgrounds consisting of photon showers. This can be done using the amount of energy deposited per unit length at the origin of the shower, usually referred to as dE/dx, combined with the distance of the shower from the interaction vertex. Both of these methods are strengths of LArTPC detectors and their use is demonstrated in this work.
In this paper, we present the first measurement of the electron neutrino and antineutrino charged-current cross section on argon using the MicroBooNE Acciarri et al. (2017a) detector at Fermilab. We employ neutrinos from the Neutrinos from the Main Injector (NuMI) neutrino beam Adamson et al. (2016) running in its “forward horn current” mode which selects neutrinos over anti-neutrinos for the on-axis component of the flux. The measurement is performed for + energies above 250 MeV and an average neutrino flux energy at MicroBooNE of 905 MeV with this threshold. We select an inclusive sample of interactions defined in Section IV.2.1 requiring at least one reconstructed electromagnetic shower inside of the fiducial volume.
While in principle, the L/E of the NuMI beam with MicroBooNE is similar to that of the Booster Neutrino Beam (BNB), an analogous oscillation search using the NuMI beam is not practical given its significantly larger intrinsic electron neutrino content and flux uncertainties.
This paper is structured as follows: first, we briefly describe the MicroBooNE experiment (Section II) and the main features of the NuMI neutrino beam at the MicroBooNE detector. We then describe the simulation and reconstruction chain (Section III), the event selection criteria, and their performance (Section IV). We report the measured cross section (Section V) and conclude with a discussion of systematic uncertainties (Section VI).

II The MicroBooNE Experiment
The MicroBooNE experiment is a LArTPC with an 85 tonne active mass, housed inside of a stainless-steel cryostat. The TPC has dimensions of 2.56 m (width, ), 2.30 m (height, ), and 10.37 m (length, ). Figure 1 shows a diagram of the LArTPC together with the coordinate system used in this analysis. Here, we only focus on the elements of the detector crucial to this analysis. A more in-depth description of the MicroBooNE experiment is given in Ref. Acciarri et al. (2017a).
Charged particles traversing the liquid argon ionize and excite the argon atoms and generate free electrons and scintillation light along their path. This scintillation light is detected by 32 photomultiplier tubes (PMTs) located behind the anode. A section of the full PMT system is depicted in Fig. 1. Each PMT gives a signal response within nanoseconds of the neutrino interaction which is significantly before the charge ionization signal is observed. To record a neutrino event, the MicroBooNE detector NuMI online trigger requires a scintillation light signal above 9.5 photo-electrons (PE) to be in-time with the accelerator beam spill window.
An electric field produced by a 70 kV drop over the 2.56 m drift distance attracts the free electrons towards an anode consisting of three planes of sensing wires. The free electrons induce a signal on the inner two wire planes (induction planes, with wires oriented at 60∘ from vertical) before being collected on the outer wire plane (collection plane, with wires oriented vertically). The signal on the wires provides position and calorimetric information for charged particles traversing the detector. Combining the information from the anode wire planes with timing obtained from scintillation light enables reconstruction of these interactions in 3D.
A candidate electron-neutrino interaction in the MicroBooNE detector recorded by the collection plane wires can be seen in Fig. 2. The time needed for electrons to drift from the cathode to the anode is approximately 2.2 ms. In this time frame, multiple cosmic ray tracks cross the argon volume and can potentially contribute to the backgrounds of any neutrino analysis. Cosmic ray tracks can be seen in Fig. 2 alongside the candidate electron-neutrino interaction.
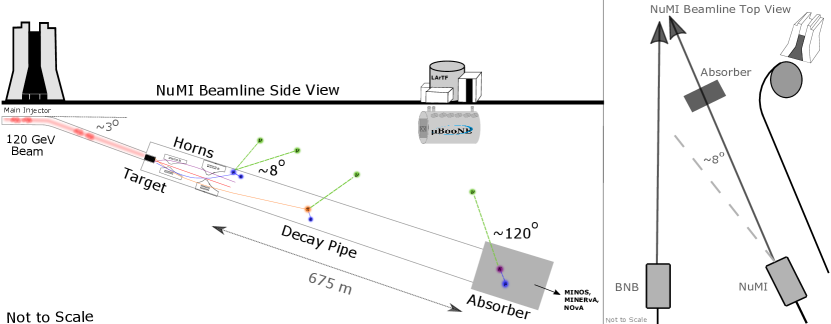
MicroBooNE can detect neutrinos from the two neutrino beams produced at Fermilab. The detector is exposed to an on-axis flux from the BNB Aguilar-Arevalo et al. (2009), and an off-axis flux of neutrinos from the NuMI beam Adamson et al. (2016). The NuMI beam is created from collisions of protons accelerated to an energy of 120 GeV with a graphite target. These collisions start a particle cascade resulting in particles such as pions and kaons that can produce a neutrino from their decay. Particles of a particular electric charge from this cascade are focused by magnetic horns where the sign of the particles being focused depends on the direction of the electrical current applied to the horns. This analysis uses data from the NuMI beam in forward horn current mode which uses a horn current of +200 kA. This mode selects positively charged mesons and results in the on-axis flux being dominated by neutrinos. The majority of NuMI neutrinos interacting in MicroBooNE in the energy range used in this analysis originate at the beam target and arrive at the detector at an angle close to 8∘ relative to the NuMI beamline direction. The position of the MicroBooNE detector relative to the NuMI target is shown in Fig. 3. Due to the energy of the protons generating the beam and the position of MicroBooNE relative to the NuMI beamline, the NuMI neutrino flux at MicroBooNE has a composition of roughly 96% and 4% for energies above 250 MeV. The component is a factor of 10 larger than in the BNB making it an excellent source of electron neutrinos.
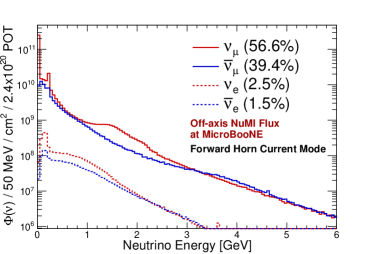
The NuMI beam neutrino flux at MicroBooNE for each neutrino flavor is shown in Fig. 4. Each NuMI accelerator beam spill delivers protons on target (POT) over a duration of 9.6 s. Each accelerator spill consists of six proton batches. To increase the neutrino intensity the accelerator complex can be run in slip-stacking mode, doubling the proton intensity in some batches Brown et al. (2013). Between October 2015 and July 2016, in the course of its first year of data-taking, MicroBooNE collected POT of NuMI beam data while the NuMI beam operated in forward horn current mode. The majority of these data was collected with the NuMI beam in a 4+6 slip-stacking configuration which means the first four out of the six proton batches have double the usual intensity. A smaller fraction of the NuMI data taken during this period also contain 5+6 and 6+6 slip-stacked data. The NuMI simulation used by MicroBooNE consistently assumes 6 batches (i.e. no slip-stacking). Due to the low neutrino interaction rate at MicroBooNE, multiple interactions in one spill are rare. We thus scale the simulated events to match the integrated data exposure, neglecting the sub-percent effects of pile-up.
III Simulation and Reconstruction
The simulation and reconstruction of neutrino events from the NuMI beam in MicroBooNE is a complex set of steps that needs to account for both neutrinos and cosmic rays interacting within the detector. The proton interactions at the NuMI target, the meson re-interactions in the NuMI beamline, and the resulting flux of neutrinos are simulated using a custom simulation package, FLUGG, developed by the MINOS collaboration. This package combines FLUKA Fasso et al. (1993) to model the particle interactions and Geant4 Agostinelli et al. (2003) to model the beamline geometry Campanella et al. (1998). The flux prediction additionally uses the PPFX software Aliaga Soplin (2016) which is also used by the NOA and MINERA experiments. PPFX uses data from fixed-target experiments to constrain the hadron production in the NuMI beamline. To constrain the NuMI flux at MicroBooNE we use the PPFX thin target (targets of few interaction lengths) constraints. More details can be found in Ref. Aliaga Soplin (2016). The neutrino flux is provided as input to the GENIE Andreopoulos et al. neutrino event generator 111GENIE v2.12.2 was used in this analysis. GENIE simulates the neutrino-argon interactions inside the MicroBooNE cryostat volume. In parallel with the neutrino generation, a spectrum of cosmic ray particles is simulated using the CORSIKA Heck et al. (1998) software package 222CORSIKA version v7.4003 with constant mass composition model is used. The resulting Monte Carlo simulated (MC) events are processed using the LArSoft Snider, E.L. and Petrillo, G. (2017) software framework. LArSoft is an event-based toolkit to perform simulation, analysis and reconstruction of LArTPC events. In the simulation chain the neutrino interaction products and cosmic rays are propagated through the detector using Geant4, taking into account field inhomogeneities caused by space charge accumulation Abratenko et al. (2020). This is then fed into a detector simulation resulting in realistic waveforms on the anode sense-wires and PMTs. The version of the MicroBooNE simulation software used in this analysis does not include the effects of drift charge producing signals on neighbouring wires, known as dynamically induced charge Adams et al. (2018a, b). This can impact the selection efficiency and backgrounds; its systematic effect is discussed in Section VI.
The data acquired by the detector are reconstructed using the same reconstruction chain as the MC generated interactions. The sense-wire waveform signals are deconvolved in one dimension with the electronics response measured for each wire plane, resulting in waveforms with charge deposits having a uni-polar signature on all wire planes. These charge deposits are then reconstructed as “hits” and fed into the Pandora generic pattern-matching reconstruction framework Acciarri et al. (2018), which uses topological and calorimetric information to reconstruct and classify charged particles as three-dimensional objects. Pandora separates these objects into “tracks” (muon, proton and pion candidates) and “showers” (electron and photon candidates), which are assembled into particle hierarchies based mainly on proximity and shared vertices. Pandora also identifies the candidate neutrino interaction point as the neutrino “vertex”. Calorimetric information is associated with the reconstructed 3D tracks and showers in the form of dE/dx: the amount of energy deposited per unit length.
The scintillation light signals acquired by the PMTs are also reconstructed. Light arriving at each PMT is translated into photo-electrons and assembled into optical hits. Optical hits from different PMTs are combined into “flashes”, which represent the total amount of light recorded from a single neutrino interaction or a cosmic ray. Flashes are characterized by position, given by the PE-weighted positions of the included PMTs, and time. The scintillation light is used to determine the time of each interaction reconstructed in the TPC.
The POT dataset used in this analysis corresponds to 6,361,077 NuMI accelerator beam triggers with 734,221 of these passing the NuMI online trigger. We refer to these events as beam-on data. We compare these to a sample of 728,500 GENIE generated , , , interactions inside the cryostat of MicroBooNE corresponding to POT. Each of these events also contains CORSIKA generated cosmic rays. Neutrinos that interact within and outside the cryostat walls of the MicroBooNE detector can produce daughter particles which can travel inside the cryostat and produce enough light to pass the NuMI online trigger. These are known as out-of-cryostat interactions. We utilize a sample of 407,926 GENIE , , , interactions generated within and outside the MicroBooNE cryostat walls (with daughter particles that travel inside the cryostat) to estimate this beam-induced background. Each out-of-cryostat interaction is combined with CORSIKA generated cosmic rays in the MicroBooNE cryostat. The out-of-cryostat sample corresponds to POT. All the MC samples generated are normalized to the total POT of the beam-on data sample.
Not all accelerator spills result in a neutrino interaction in MicroBooNE. In many cases, the detector reads out exclusively cosmic rays in-time with the beam window. To characterize these readout triggers when no neutrino is present, a dedicated sample of 6,264,334 triggers was collected explicitly when the beam was off. This sample is normalized to the number of triggers for the beam-on data.
IV Selection of Inclusive Charged-Current -like Interactions
IV.1 Event Classification
| Selection stage | Data | Signal | Beam Bgd. | Cosmic MC Bgd. | Beam-Off Bgd. | Efficiency [%] | Purity [%] |
|---|---|---|---|---|---|---|---|
| (1) Pre-selection | 70691 | 632.1 | 7629.6 | 7736.4 | 52838.4 | 69.4 | 0.9 |
| (2) Flash matching | 11135 | 417.5 | 2160.8 | 613.7 | 6642.8 | 45.1 | 4.2 |
| (3) Vertex reconstruction quality | 7704 | 329.9 | 1462.4 | 457.3 | 4708.4 | 36.0 | 4.7 |
| (4) Shower hit threshold | 1889 | 276.9 | 509.5 | 82.6 | 725.0 | 29.9 | 17.4 |
| (5) Electron-like shower | 453 | 139.5 | 105.5 | 15.6 | 156.4 | 15.0 | 33.5 |
| (6) Final selection | 214 | 83.8 | 41.5 | 9.3 | 82.3 | 9.1 | 38.6 |
We define our signal as a CC or interaction inside a fiducial volume in the MicroBooNE detector above an (anti-)neutrino energy threshold of 250 MeV. This analysis is optimised towards high energies and therefore we set this threshold to exclude a region where the efficiency begins to rapidly decrease. Our signal events are identified by the presence of an electron or positron shower in the final state, regardless of the presence of additional particles. Because MicroBooNE is not able to differentiate electrons from positrons and, therefore, versus , the resulting selection contains both particles. As a consequence, we calculate the final cross section for a combination of and .
A pure selection containing and CC interactions requires the use of several variables to remove any cosmic rays and other beam-induced backgrounds which are mis-reconstructed as showers. Due to the variety of interaction modes and detector effects, some interactions may be incorrectly classified, merged with other particles, partially reconstructed, or entirely unreconstructed. In order to study the signal efficiency and various background contributions, we classify events in the MC simulation as follows:
CC: or interactions with an energy above 250 MeV with the primary interaction vertex inside the fiducial volume. This is our signal classification.
CC Out-FV: or CC interactions whose primary interaction vertex is reconstructed inside the fiducial volume, while the true simulated vertex is located outside the fiducial volume but inside the MicroBooNE cryostat. As such, these are classified as background.
Cosmic: MC cosmic ray particles generated by CORSIKA Heck et al. (1998) which are selected as the neutrino candidate.
CC: MC generated particles originating from or CC interactions. This background category includes all interaction topologies.
NC: MC generated particles from a neutrino neutral current (NC) interaction, including all topologies except those including in the final state.
NC : MC generated particles for a NC interaction with one or multiple in the final state. We classify these separately as the photons originating from decays can closely mimic electron showers.
Out-of-Cryostat: This category contains neutrino candidates originating from simulated neutrino interactions within and outside the cryostat walls.
Beam-Off Data: Any neutrino candidates originating from the sample of data collected when the beam was off fall under this background category. It contains exclusively cosmogenically produced activity.
IV.2 NuMI + Selection
We combine information from the NuMI beam extraction with the scintillation light recorded by the MicroBooNE PMTs and with TPC pattern recognition techniques. The selection does not target a specific part of the electromagnetic (EM) shower phase space, neither in angle nor energy. In order to reject beam and cosmic ray interactions that could mimic our signal, we apply a selection divided into six stages. These are listed in Table 1, together with the number of signal and background events surviving each stage.
The selection efficiency shown in Table 1 is defined as the number of selected CC interactions with an energy above 250 MeV in the fiducial volume divided by the number of simulated CC interactions with the same energy threshold in the fiducial volume before any selection is applied. The selection purity is defined as the number of selected CC interactions in the fiducial volume with an energy above 250 MeV divided by the total number of selected neutrino candidates (signal and background).
IV.2.1 Pre-selection
The goal of the first stage of the analysis is to identify events where a neutrino interaction happened inside a volume where they can be reliably reconstructed and has a flash coincident with the beam window.
Pandora classifies each region of activity in the TPC as either a track or a shower. Our selection requires at least one reconstructed shower associated to the Pandora neutrino candidate. The leading shower in the event is defined as the reconstructed shower object with the most charge deposition associated with it.
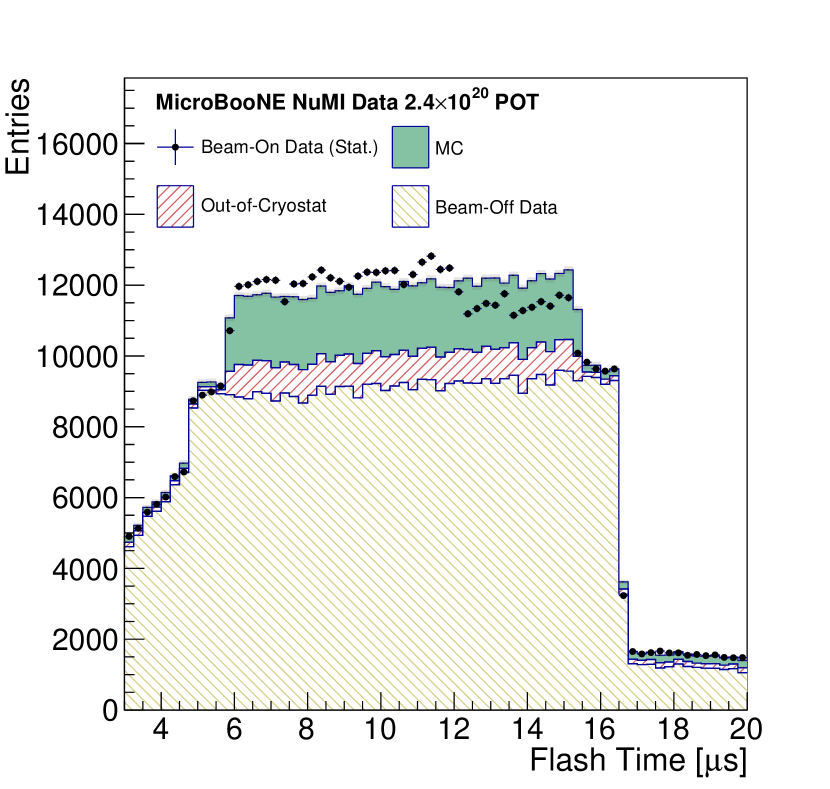
The distribution of the reconstructed flash time is shown in Fig. 5 for data versus the stacked prediction of MC + NuMI beam-off data. The NuMI beam spill window occurs between 5.5 to 16.0 s. We reject flashes reconstructed outside of this window. The shoulder of the flash distribution on either side of the beam window is due to the NuMI online trigger gate being slightly wider than the NuMI beam spill window. This region is dominated by the beam-off data and is well-modeled. The shape between 3 and 4.5 s is driven by flashes induced by cosmic activity that happen before the NuMI online trigger which have late scintillation light arriving inside the NuMI online trigger window. Flashes between 17 and 19 s are generated mainly by argon late-light scintillation from interactions that happened during the beam window. The abrupt change in the number of flashes for beam-on data around 12 to 15 s is a result of the 4+6 slip-stacking configuration of the NuMI beam. The MC is generated uniformly across the beam window such that the integral is equivalent to the integral of the beam-on data. This has no impact on normalization of the prediction to beam-on data because we normalize to the total POT delivered.
A large fraction of cosmogenic activity is caused by low energy neutrons and photons which deposit less energy on average than neutrinos. We therefore reject neutrino candidates where the total light signal observed by the PMTs is less than 50 PE. This is a highly efficient method of removing a significant number () cosmic ray backgrounds of which most are low energy.
We define a fiducial volume in which we exclude 20 cm uniformly from all sides of the TPC, giving a total fiducial volume of m3 (and a fiducial mass of 57.6 tonnes). Any neutrino interaction candidate with a reconstructed vertex outside of this volume is removed. This reduces the amount of selected out-of-cryostat and cosmic-ray interactions, and minimizes the impact of non-uniform electric field on the reconstructed tracks and showers near the cathode due to space charge accumulation Abratenko et al. (2020).
The efficiency for the pre-selection is 69.4%. This large initial loss in efficiency is primarily driven by the shower reconstruction performance, where the electron from the CC interaction is either mis-reconstructed or not reconstructed at all. At this stage, the purity is 0.9%, as the selection is dominated by the cosmic ray background.
IV.2.2 Flash Matching
A powerful method to reject cosmic ray backgrounds is to combine the TPC and light information. This is known as “flash matching”. In this analysis we calculate the distance from the position of the largest flash (i.e. the flash with the most PE) occurring inside of the beam window to the reconstructed Pandora vertices in 2D ( plane). We assume that the largest flash in the beam window was produced by the neutrino interaction. The distance, , is constructed as:
| (1) |
where and are the reconstructed center of the largest flash and and are the reconstructed neutrino candidate vertex coordinates.
Compared to neutrino interactions, cosmic-induced backgrounds (beam-off and CORSIKA MC) tend to have larger match distances when compared with the largest optical flash registered during the beam window. We select events using the 2D match distance taking into account the relative positions of the flash and the TPC interaction vertices in the coordinate. Since the neutrino interactions are usually forward going, the flash center should be downstream of the neutrino interaction. This motivates a tighter selection if the reconstructed TPC vertex is downstream of the flash position:
| (2) |
IV.2.3 Vertex Reconstruction Quality
To mitigate backgrounds resulting from mis-reconstruction or incorrect particle hierarchy associations, we examine the distance of showers and tracks from the vertex, which is a metric of reconstruction quality. This also removes background events where the leading shower originates from a photon. For example, in NC events, the decays to two photons which pair convert after travelling some distance resulting in both showers being displaced from the vertex.
We remove any neutrino candidates where the leading shower is reconstructed with a start point further than 4 cm from the neutrino vertex. This requirement applies only to the leading shower to ensure an inclusive selection of CC topologies which produce showers distant from the neutrino interaction (e.g. CC production). If the neutrino candidate event includes reconstructed tracks, we additionally require that at least one track must start within 4 cm of the reconstructed neutrino vertex; this additional selection removes events with associated cosmic activity, while allowing for some mis-recontruction effects due to unresponsive wires. After applying these vertex quality variables, the purity increases to almost 5%, see Table 1.
IV.2.4 Shower Hit Threshold
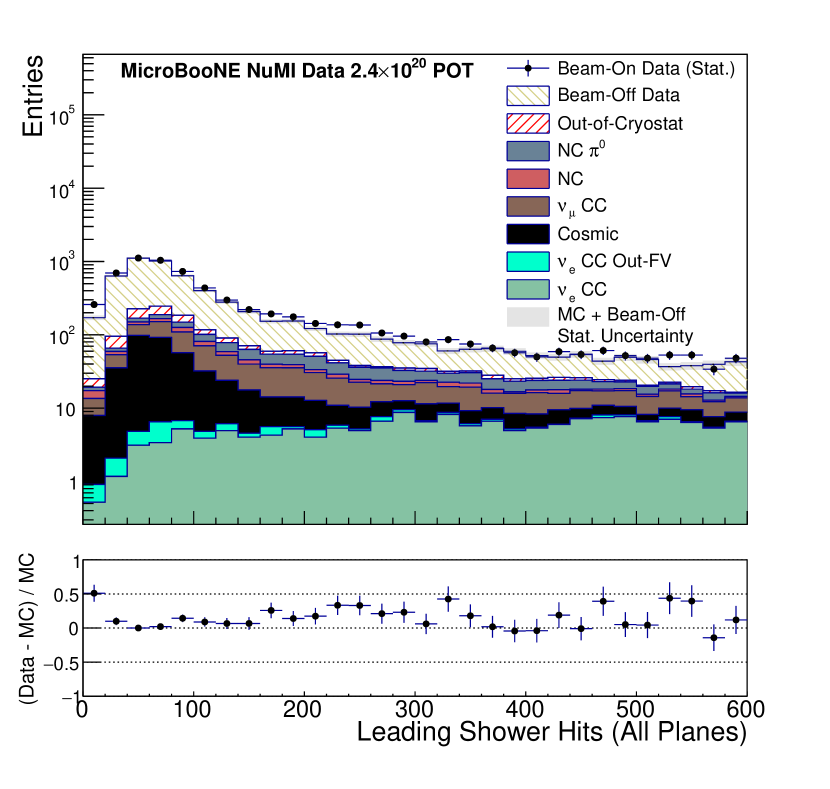
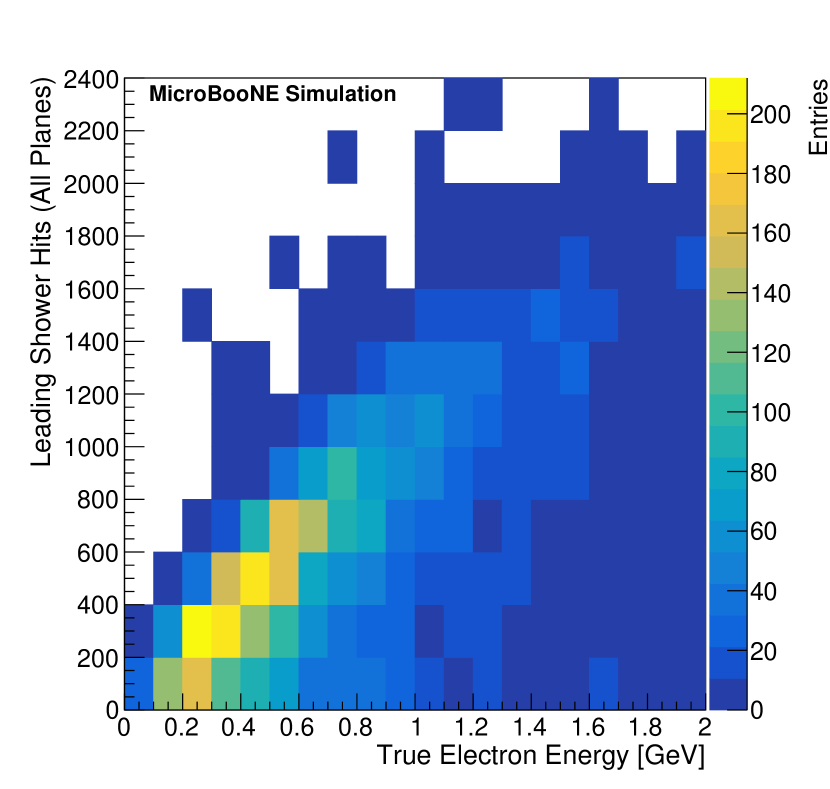
The more hits that are associated to a shower, the easier it becomes to reconstruct its properties. Conversely, showers with very small numbers of hits are difficult to reconstruct precisely and are more likely to be affected by spurious charge depositions. We integrate the number of hits for the leading shower across the three wire planes; the resulting distribution is shown in Fig. 6. The majority of the backgrounds cluster at values below 200 total hits in the leading shower, mainly due to mis-reconstructed muon tracks or the reconstruction splitting larger showers into sets of smaller showers. Requiring greater than 200 hits for the leading shower is effective at removing these mis-reconstructed showers, however, it impacts low energy neutrinos as well as background events. Figure 7 shows the relationship between the simulated electron energy and the leading shower hits. While the total number of hits correlates with the energy of the shower, this correlation is non-trivial. We observe that this selection requirement removes events in a bin of electron energy just above 0.2 GeV, but a large population of such events are maintained.
We also utilize the number of hits in the collection plane, which is typically the best-performing plane for reconstruction due to its high signal-to-noise ratio and is the plane used to calculate dE/dx at the start of the shower. Showers with few hits in this plane can lead to sizable uncertainties in the dE/dx measurement. Therefore, we require there to be at least 80 hits on the collection plane for the leading shower.
IV.2.5 Electron-like shower
The presence of an electron shower is the identifying characteristic for determining whether an event was induced by an electron neutrino interaction. To isolate such events, we employ the key feature of LArTPCs: the ability to distinguish photon-induced showers from electron-induced showers using a combination of calorimetric and topological information (i.e. the measurement of dE/dx and the distance between the shower and interaction vertex). The initial dE/dx for showers induced by an electron correspond to the minimum ionizing particle (MIP) value. Showers induced from photons will instead register higher values of initial dE/dx corresponding to double MIP ionization. This is due to the electron-positron pair from photon pair production, which is the dominant interaction mode for photons at the energies of interest. Before the pair production occurs, a photon does not ionize the argon. This can lead to an identifiable gap from the vertex which becomes another clear signature of background EM-showers.
Where the previous selection variables address mainly the backgrounds from cosmic rays and shower quality, requirements on the leading shower opening angle and the shower dE/dx further remove tracks that are mis-reconstructed as showers (mostly beam-off data and CC interactions) and limit the contamination from photon-induced showers originating from NC and CC interactions.
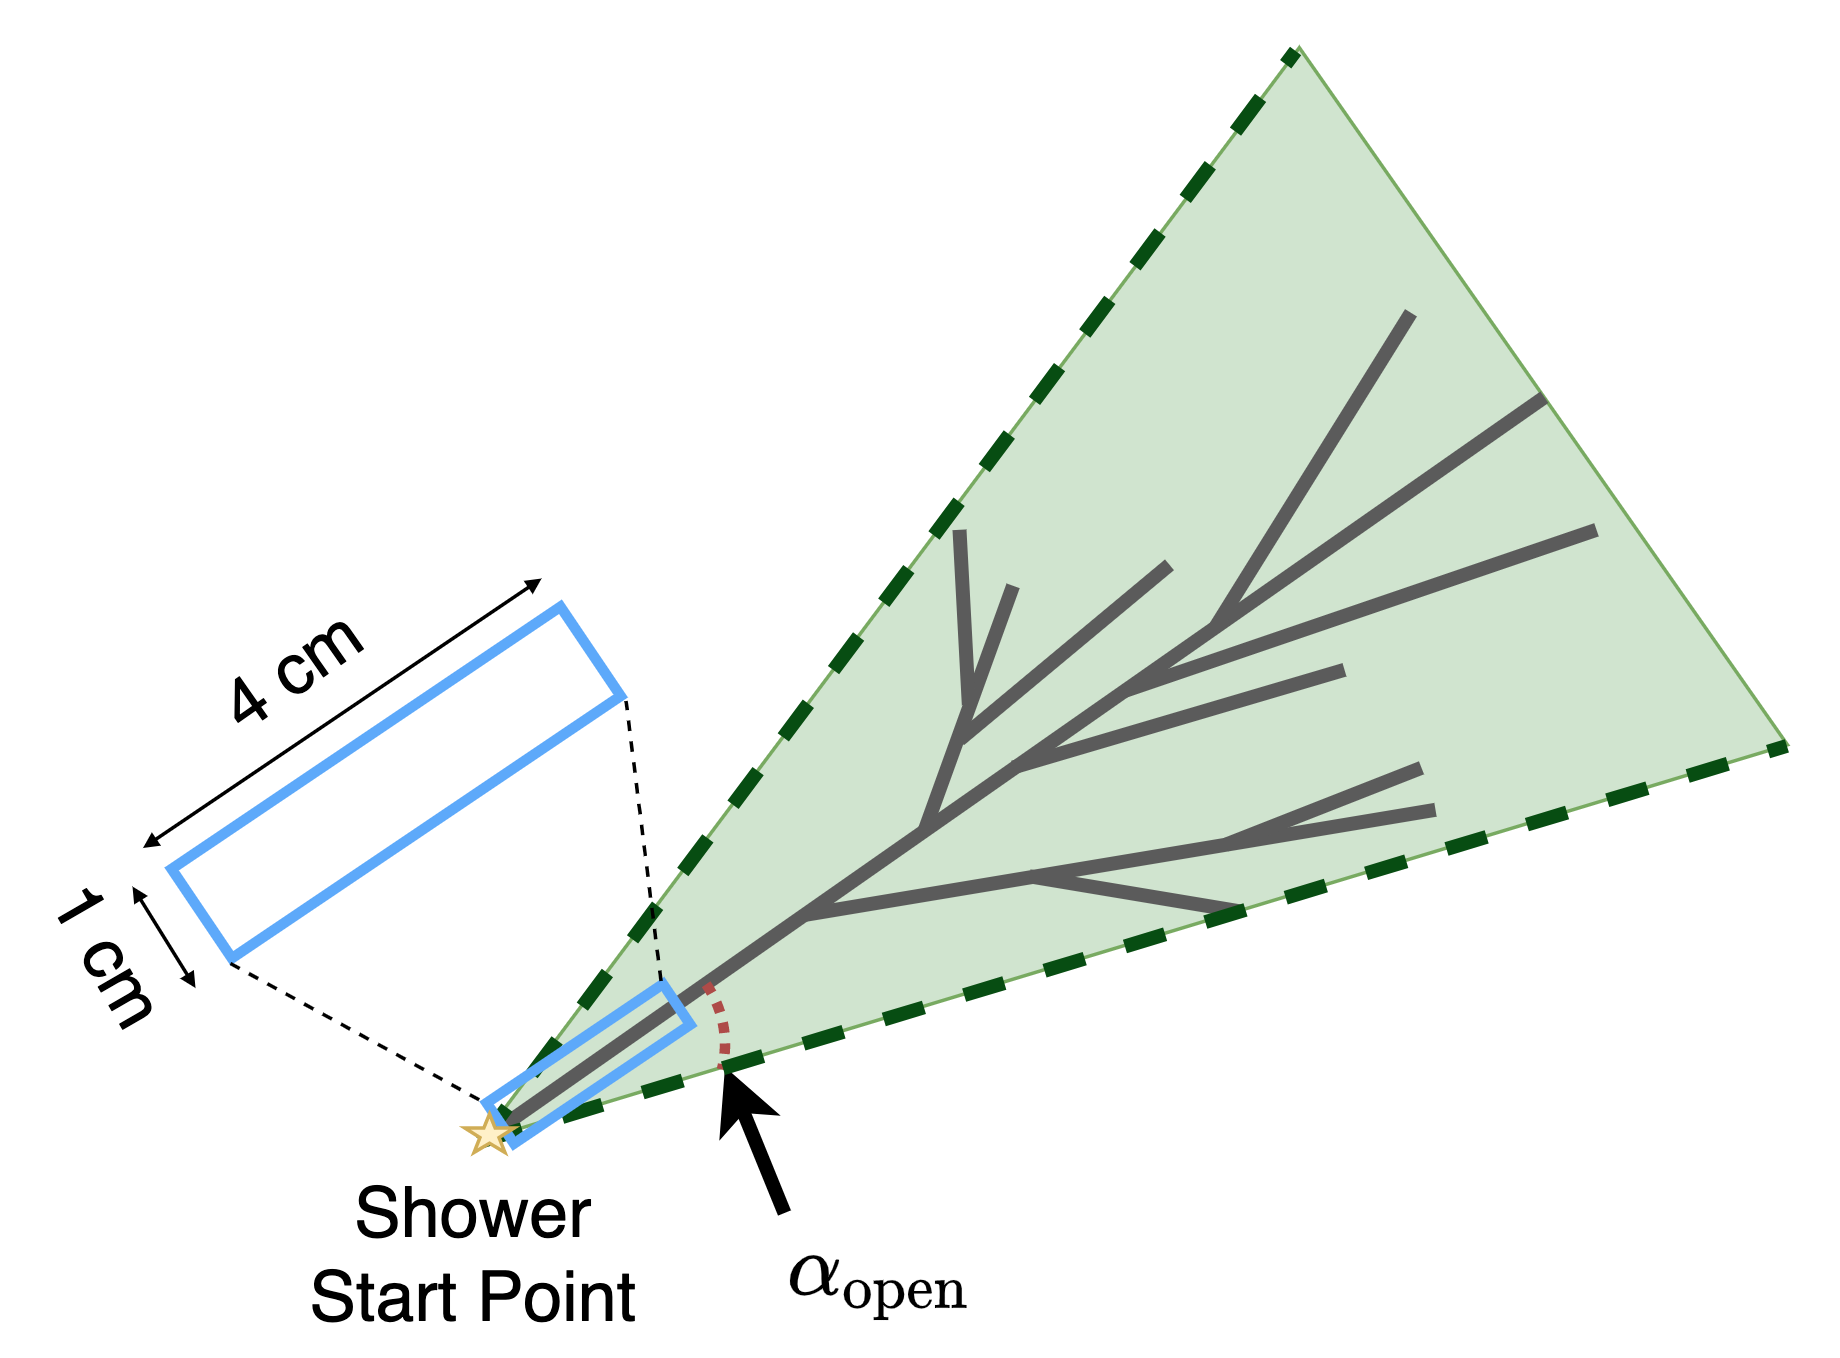
The shower opening angle, , is calculated using a principal component analysis (PCA) of the 3D hit positions of the reconstructed shower and is given by the equation:
| (3) |
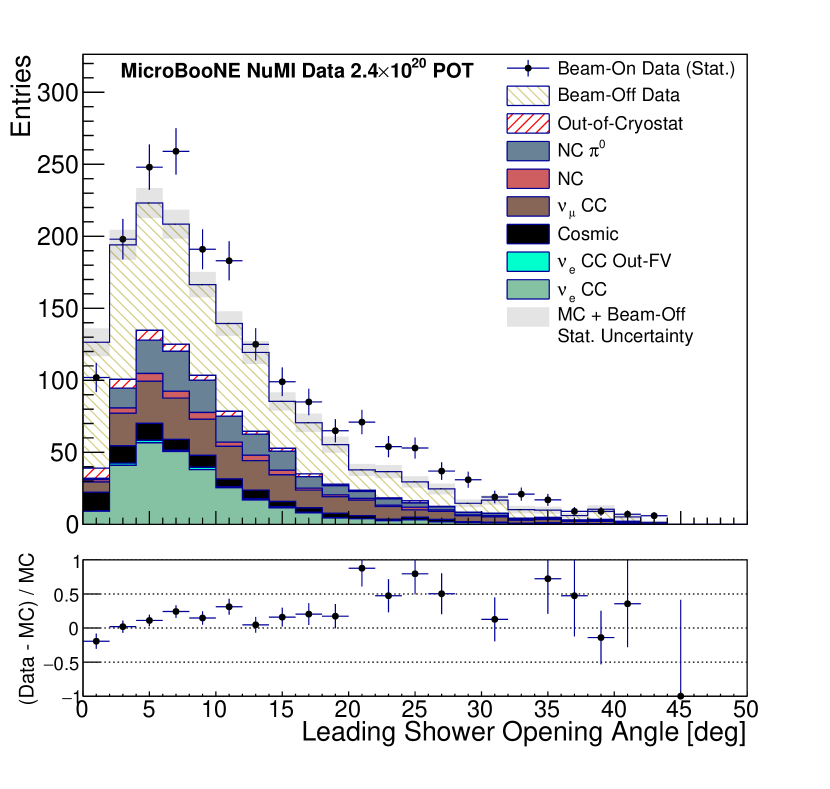
where and are the lengths of the principal and secondary eigenvectors. Figure 8 gives an intuitive view of this angle on a schematic of a reconstructed shower. The opening angle is a powerful discriminator for cases where tracks have been mis-reconstructed as showers. For example, cosmic rays with broken tracks near the neutrino interaction can be mis-reconstructed as the leading shower resulting in a large opening angle. We select neutrino candidates where . In order to remove neutrino candidates with a topology which is more track-like than shower-like, we require a minimum opening angle of . Figure 9 shows the data versus MC prediction for shower opening angle before this requirement is made.
One of the most powerful features of LArTPC technology is that its entire volume is an active calorimeter. This means that the energy loss of a particle can be calculated along its trajectory, enabling the use of dE/dx for particle identification. Using the dE/dx in the first few centimeters of a shower is a powerful tool to distinguish electron-induced from photon-induced showers, as was demonstrated by ArgoNeuT Acciarri et al. (2017b). Selecting the median dE/dx value as a truer representation of the shower’s deposition profile rather than the arithmetic mean mitigates effects from single outlier hits which could result from Landau fluctuations as well as mis-configured electronics, detector effects, or mis-reconstruction.
The calculation of the median dE/dx is performed by constructing a cm2 box starting at the reconstructed shower start point, shown in Fig. 8 and calculating the dE/dx for the collection plane single charge deposits along the start of the shower. The charge deposits are converted to an energy using the Modified Box model Acciarri et al. (2013).
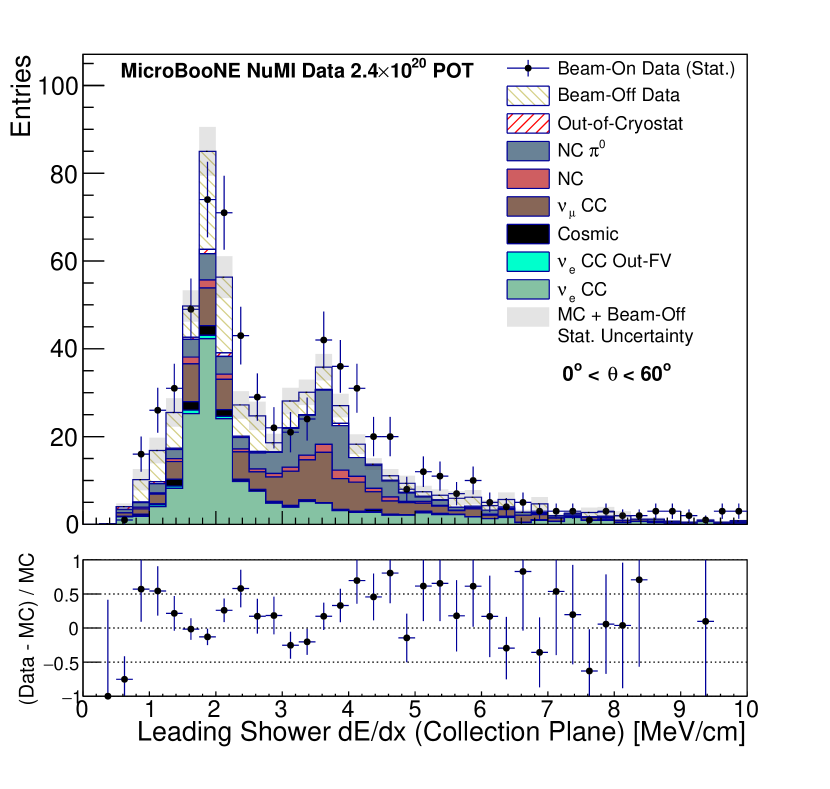
Figure 10 shows the distribution of the calculated dE/dx on the collection plane wires for the leading shower using this method. The signal distribution peaks in the 2 MeV/cm region and large fractions of background lie to either side of the peak. Selecting those neutrino candidates whose dE/dx lies between 1.4 MeV/cm and 3 MeV/cm greatly increases the purity of the sample. As expected, the neutrino candidates containing photon-producing processes are centered around 4 MeV/cm.
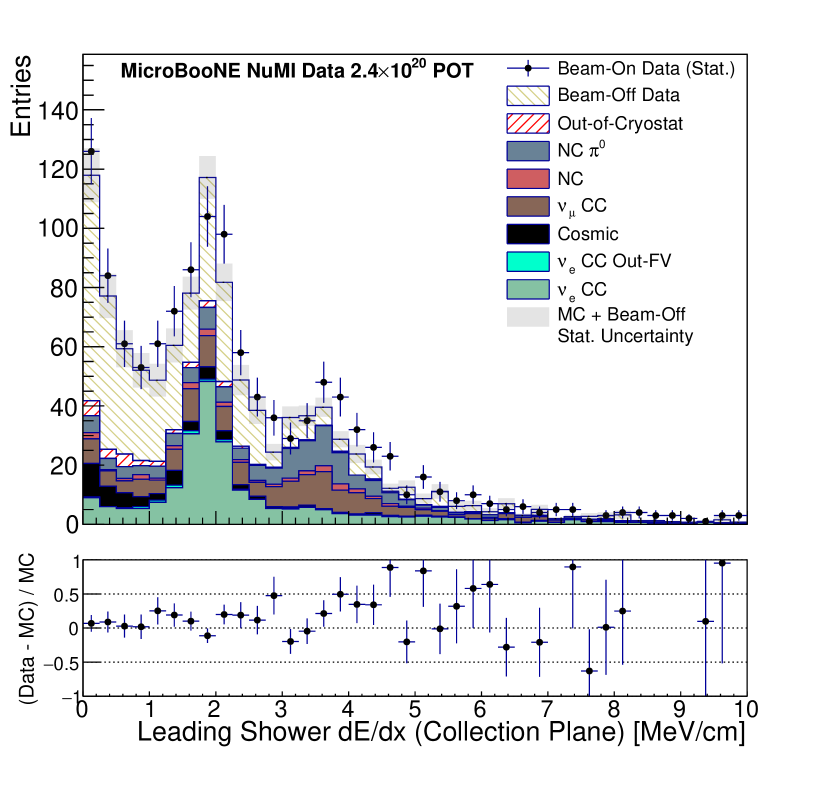
A notable feature in Fig. 10 is the large population of leading showers with a dE/dx of nearly 0 MeV/cm. This population is caused by tracks and showers that are nearly perpendicular to the beam direction () where it is challenging to measure dE/dx. In future analyses, this effect can be mitigated with the use of all three wire planes to measure dE/dx enabled by using methods such as 2D deconvolution as laid out in Refs. Adams et al. (2018a, b).
Figure 11 shows the stacked data versus MC prediction where is between 0∘ and 60∘. This slice of is the most populated region and has considerably higher purity than the rest of the phase space. As the dE/dx distribution at this angular slice includes showers running roughly perpendicular to the collection plane wires, a very small fraction of showers have an unphysically low dE/dx, which demonstrates the angular dependence of the dE/dx calculation in this analysis.
For values of between 60∘ and 120∘, where the dE/dx is not well reconstructed, both the neutrino interactions and the considerable cosmic ray background are peaked at dE/dx values closer to 0 MeV/cm. In the range of between 120∘ and 180∘, we expect relatively few electron-neutrinos and a high contamination of cosmic rays. However, in this sample, the majority of the leading showers have well reconstructed dE/dx close to 2 MeV/cm.
Given that the reconstructed leading shower direction can affect the calculation of dE/dx, using it may introduce an angular bias to the selection. However, it is an extremely powerful tool for removing cosmic and beam-induced backgrounds which dominate at low dE/dx, as well as photon backgrounds at higher dE/dx values. Future analyses can mitigate the angular dependence of dE/dx by using three plane calorimetry.
This selection stage is successful in removing a large fraction of photon-induced shower backgrounds. Given the importance of removing these backgrounds in electron-neutrino analyses we explore the performance of photon-rejection variables further in Section IV.3.
IV.2.6 Final Selection
Mis-reconstruction of the neutrino candidate can lead to associating physically uncorrelated showers with the interaction. To remove these cases, we require the distance between the sub-leading showers and the neutrino candidate vertex to be less than 22 cm. The scope of this selection requirement is to mitigate mis-reconstructed showers while retaining a sizable fraction of CC interactions ( 44% relative to the previous selection stage).
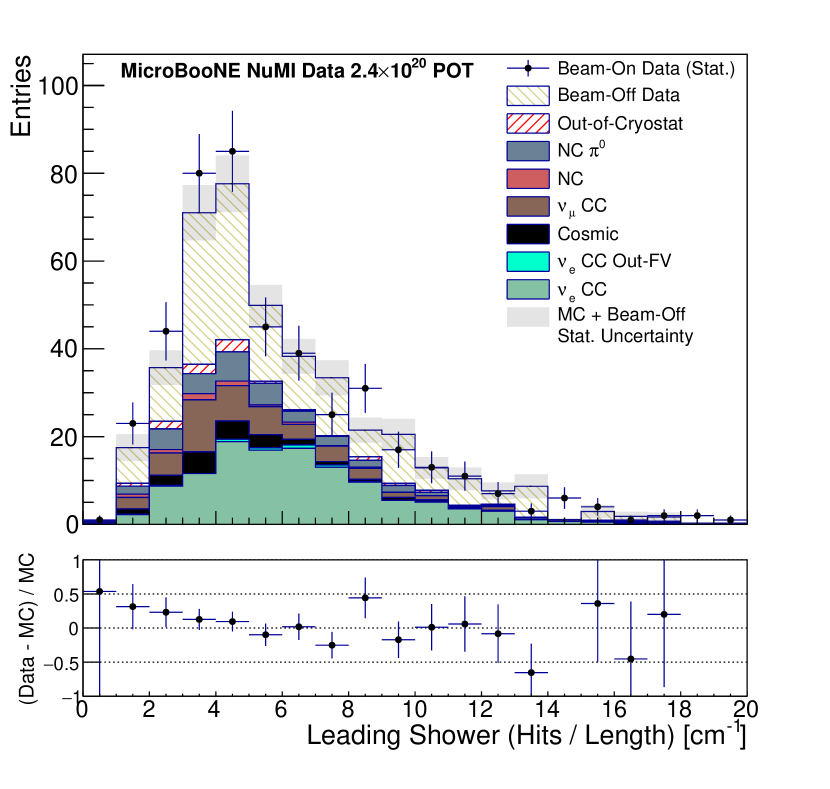
Further differentiating between shower and track objects is necessary in order to remove the cosmic ray interactions which dominate the currently selected sample. The object hit density is calculated by summing the number of hits associated to the leading shower and dividing by its length. The hit density for the leading shower is shown in Fig. 12, the cosmic rays largely populate the lower values of hit density. The effectiveness of this selection is particularly sensitive to the reconstruction of the transverse component of the shower; poorly reconstructed shower objects are removed by a selection on this variable. Placing a higher threshold on the hit density improves the selection purity, however the selection efficiency especially in the low energy signal region is impacted. A conservative threshold is placed at a hit density of 3 hits per cm.
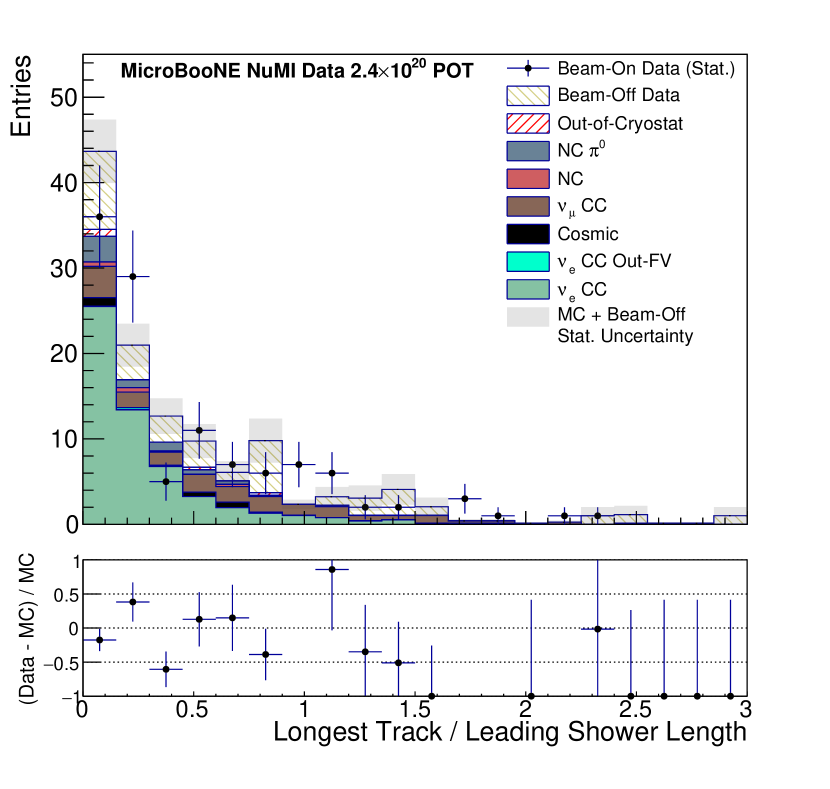
The relationship between the length of the longest track and leading shower can be used to discriminate between and interactions. For instance, a CC interaction typically contains a rather long muon track and any showers associated to the interaction are typically much shorter in length. Contrast this to a CC interaction, where the tracks produced are often of comparable length, or shorter than the leading shower length even in the presence of charged pions. Selecting on such a variable also removes cases where Michel electrons are produced by muon decays. The parameter shown in Fig. 13 is defined as the length of the longest track in the neutrino candidate event divided by the leading shower length. We select neutrino candidates whose ratio is below 1.0.
To increase the purity of shower + track topologies, we require that both the reconstructed start and end of the track are contained inside the fiducial volume. This requirement is particularly effective at rejecting long cosmic rays or muons which cross the fiducial volume and are associated to a shower inside the fiducial volume. This has a small impact on the signal selection and results roughly in a 3% increase in purity.
The final number of neutrino candidates remaining after each selection stage is shown in Table 1.
IV.3 Electron-Photon Separation
A key requirement of any analysis searching for electron neutrinos is the ability to differentiate electrons originating from CC interactions from photons originating from any backgrounds. The two main features that separate interactions containing electrons from those with photons are the dE/dx at the start of the shower and the distance between the shower and the interaction vertex. The latter is only well-defined when another charged particle is present at the interaction vertex. Electron-photon separation in a LArTPC has previously been demonstrated using a semi-automated reconstruction chain Acciarri et al. (2017b) and only leveraging the dE/dx. In this measurement, we demonstrate for the first time both of the electron-photon separation techniques that the LArTPC technology offers using a fully automated analysis chain.
To examine the performance of the electron-photon separation variables, we isolate the dE/dx and shower vertex distance selection steps on the leading shower by moving them to the end of the analysis chain; this ensures that the upstream part of the selection chain identifies neutrino interactions with a well-defined leading shower. For this study, we additionally require the leading shower to be between 0∘ and 60∘. This focuses on the topologies unaffected by the absence of dynamically induced charge in our simulation chain and with dE/dx best reconstructed on the collection plane wires. The very good agreement between the data and MC samples allows us to utilize the MC sample, which provides true information about the nature of the leading shower, to determine the power of the two separation methods.
After applying the CC selection without the dE/dx and shower vertex distance selection steps, we obtain a sample of 1995 simulated neutrino events. In this sample, the true particle responsible for the leading shower is an electron in 48% of cases, a photon in 39% of cases with 13% remaining for other particles. We then examine the individual and combined effect of applying the dE/dx and the shower to vertex distance selection requirements on these three groups. The value of dE/dx is required to be between 1.4 and 3 MeV/cm and the distance between the shower and the vertex to be less than 4 cm apart. The combination of these two requirements selects 59% of electron neutrino events and rejects 81% of photon backgrounds and over 61% of other backgrounds. When applying the requirements individually, the dE/dx is the significantly more powerful method of rejecting events with photons removing 73% of those backgrounds by itself compared to 28% for the shower distance to vertex. It is also responsible for the bigger drop in our efficiency to select electrons: 35% compared to 11%. We also investigate the effect of the shower to vertex distance selection requirement on a subset of events with at least one candidate track present. For this sample, the selection requirement has an improved performance in rejecting photon backgrounds with 47% rejected compared to 28% for events where we do not require the presence of a reconstructed track. The summary of the performance for each selection requirement applied individually and combined can be found in Table 2.
| Selection stage | Electrons | Photons | Other |
|---|---|---|---|
| EM Shower Selection | 951 | 771 | 273 |
| dE/dx (only) | 65% | 27% | 52% |
| Shower-Vertex Dist. (only) | 89% | 72% | 73% |
| Combined | 59% | 19% | 39% |
| Shower-Vertex Dist. | 89% | 53% | 64% |
| (only, 1 track) |
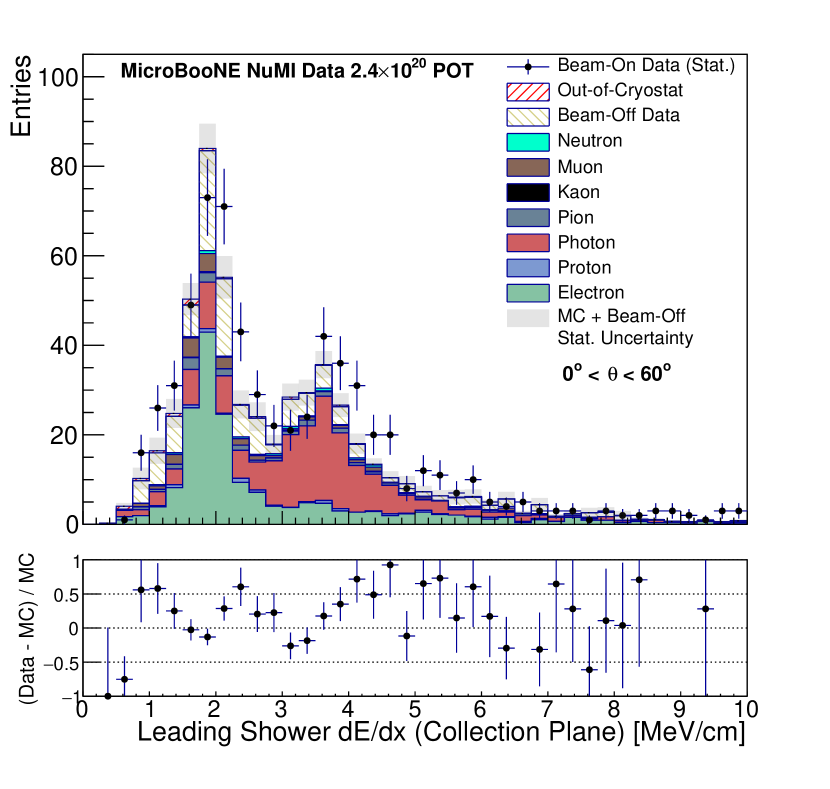
We find that the dE/dx variable is more effective in removing photon-induced backgrounds. Figure 14 illustrates its separation power in rejecting the photon-like events which dominate around the 4 MeV/cm peak in the dE/dx distribution.
IV.4 Selection Performance
Many of the selection requirements focus on removing cosmic ray interactions reconstructed as showers. The overall decrease in the cosmic ray contamination is a factor of compared to the initial Pandora reconstruction stage which can have many reconstructed cosmic rays in a readout window. This ultimately brings the cosmic ray contamination to roughly the same size as the number of selected electron neutrino and antineutrino interactions. The remaining non-cosmic backgrounds contribute to approximately 19% of the selected neutrino candidates. This demonstrates the selection’s ability to reliably remove beam-induced backgrounds such as CC and interactions. We find that the selection is sensitive to neutrino events where the final state electron momentum is higher than 48 MeV/c, and includes the entire angular phase space of the electron.
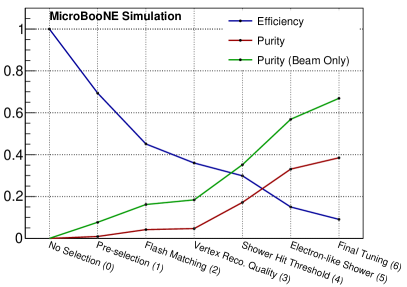
A summary of the purity and efficiency at different stages of the selection can be seen in Fig. 15. The steepest decrease in the efficiency, once the basic pre-selection is applied, occurs with the application of the shower opening angle and dE/dx selection requirements which are both included in the electron-like shower category. For the latter the decrease occurs because of the difficulty in calculating the dE/dx for the shower direction of certain signal events. This is also the step with the largest increase in purity. With improvements to calculating dE/dx for all shower directions, this variable is expected to become even more powerful. The beam-only purity (in green) is shown in Fig. 15 and has a final value above 60%. This is calculated by considering only beam-induced backgrounds which would be the ideal case if all cosmic ray backgrounds in this analysis could be completely removed. In future analyses with improved cosmic rejection tools such as using the cosmic ray tagger system installed around MicroBooNE, contamination from cosmic ray backgrounds should significantly decrease which will enable much higher purities and improved selection performance. The final selection efficiency is for the + sample, which can be divided into and for and respectively.
V Flux-Averaged Inclusive CC Total Cross Section
We employ the standard formula to extract the cross section :
| (4) |
where is the total number of selected neutrino candidates, the number of selected background events, the selection efficiency, the number of target nucleons, and the integrated POT-scaled flux. The number of target nucleons in the fiducial volume defined in this analysis is . The number of selected signal neutrinos, (), in data is calculated to be where and (see Table 1). The mean of the and fluxes is 905 MeV, which is calculated by integrating the flux from 250 MeV.
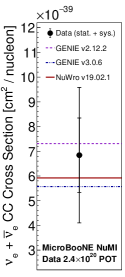
The cross section, , is in agreement with the GENIE and NuWro Golan et al. (2012) predicted values as seen in Fig. 16. The term is the leading contribution to the 22% statistical uncertainty on the extracted cross section. We find similar agreement with GENIE v2.12.2 as ArgoNeuT does with GENIE v2.12.10c Acciarri et al. (2020). The theory predictions for the flux-averaged cross section between these versions of GENIE are equivalent.
VI Systematic Uncertainties
The systematic uncertainties considered in the analysis arise from the simulation of neutrino interactions, propagation of secondary particles, detector response, and neutrino flux. The simulation of interactions on an argon nucleus is complex due to both the nature of the large nuclear target and the interplay of the different interaction modes in the 1 GeV energy region. GENIE is used to simulate the neutrino interactions with argon, using cross section models that depend on a number of parameters. Estimates of the uncertainties on these parameters are provided by GENIE. These parameters in GENIE are simultaneously sampled 1000 times within their adopted uncertainties and are used to modify the simulated event rates. This primarily modifies the background rates, though it does have a small impact on the signal efficiency. For each of the 1000 variations, the measured cross section is re-calculated and the uncertainty is calculated as the standard deviation of the 1000 modified cross sections, leading to an uncertainty of 5%.
The model parameter uncertainties provided by GENIE v2.12.2 are supplemented by considering alternative models within GENIE for charged-current quasi-elastic (CCQE) and meson exchange current (MEC) interactions - the dominant reaction mechanisms at MicroBooNE. For low 4-momentum transfers (low-), the collective behavior of nucleons in the nucleus can lead to a suppression of the CCQE cross section. This physics effect is not included in our default GENIE model set. MEC interactions are simulated using an empirical model which does not include any associated uncertainties. An alternative CCQE model which includes suppression at low- (calculated using the random phase approximation, or RPA) and a theory-driven MEC model for CC interactions Nieves et al. (2004); Gran et al. (2013); Nieves et al. (2011) are used to modify the default simulation. Again, the cross section is recalculated with this modified simulation. This alternative model set introduces a 9% change in the calculated cross section which is mostly driven by the effect of the alternative CCQE model on the efficiency (6%).
Uncertainties for proton and charged pion re-interactions in argon are estimated by recalculating the survival probability as a function of momentum after modifying their cross sections within their uncertainty (conservatively estimated to be 30%). The re-interaction cross sections for protons and charged pions are sampled simultaneously 250 times resulting in a new cross section in each case. Taking the standard deviation of these 250 modified cross sections results in an uncertainty of 2%.
Systematic uncertainties originating from the detector modeling are evaluated using independent modifications to the detector simulation. Individual parameters in the underlying detector model are varied and the events re-simulated. The measured cross section is recalculated using these modified simulations and the difference with respect to the central value is taken to be the uncertainty. The uncertainties from the various detector parameters are added in quadrature, resulting in a 23% uncertainty. The largest contribution to this uncertainty is the dynamically induced charge variation (16%) where we use a simulation sample with this effect included. This variation affects the reconstruction of showers and greatly improves the data to MC agreement in variables such as the shower multiplicity and momentum. Future iterations of this analysis will include this effect in the default simulation.
| Systematic Source | Relative Uncertainty [%] |
|---|---|
| Interaction | 10 |
| Detector Response | 23 |
| Beam Flux | 22 |
| POT Counting | 2 |
| Cosmic Simulation | 4 |
| Out-of-Cryostat Simulation | 6 |
| Total | 34 |
The uncertainty in the flux prediction arises primarily from the modeling of the particle cascade following the proton-target collision. An alternate beamline simulation compatible with PPFX was run and reweighted in neutrino energy and angle to the NuMI beamline to match the nominal flux prediction from FLUGG. This reweighted flux was then modified by PPFX according to the hadron production uncertainties from data. Each time the flux was modified, the cross section was recalculated, including background subtraction and efficiency correction, giving a total uncertainty on the measurement from the hadron production of 21%.
Additionally, we evaluate the uncertainties due to the modeling of the NuMI beamline by re-running the PPFX-compatible beamline simulation with parameters such as the target location, horn current, and beam spot size changed by their estimated uncertainties. The combination of beamline uncertainties added in quadrature lead to a 6% uncertainty on the measured cross section. An additional uncertainty of 2% is added to account for potential inaccuracies in the counting of POT from beamline monitors Pavlovic (2008); Aliaga Soplin (2016).
To estimate the uncertainty of the simulation of cosmic rays, we calculate the difference in selection rate of cosmic rays between a sample of simulated neutrino interactions overlaid on beam-off data and CORSIKA simulation. This difference is used to scale the selected CORSIKA cosmic rays in this analysis which varies the calculated cross section by 4%.
Simulation of out-of-cryostat interactions are dependent on many factors such as the geometry of the building around MicroBooNE, the density of various materials around the building and GENIE modeling of the neutrino interactions in these materials. Due to this large set of unknowns, the number of selected out-of-cryostat interactions is varied by 100% and the cross section is recalculated. This gives an uncertainty on the cross section of 6%.
Table 3 shows a summary of all the systematic uncertainties considered. We obtain a total uncertainty of 34% with the flux and detector modeling being the most dominant. The final value of the electron neutrino and antineutrino CC total cross section on argon is therefore,
This result is consistent with the GENIE prediction within statistical and systematic uncertainties as shown in Fig. 16.
VII Conclusions
We presented the measurement of the flux-averaged inclusive electron neutrino and antineutrino charged-current total cross section on argon using the MicroBooNE detector and the NuMI beam at Fermilab. For energies above 250 MeV and an average neutrino flux energy of 905 MeV calculated by applying this threshold, we find the cross section to be , which is in agreement with the predictions from GENIE and NuWro. This is the first such measurement performed in a large-scale LArTPC and the first one from a LArTPC placed on the surface. It is also the first measurement from an off-axis beam at MicroBooNE, with neutrinos arriving with a minimum angle of 8∘ relative to the NuMI neutrino beamline direction. Using the largest sample of electron-neutrino interactions on argon acquired to date, consisting of 214 selected and CC events with a purity of 38.6%, we demonstrate the electron-photon dE/dx separation power of LArTPCs using a fully-automated analysis chain. The measurement techniques presented here will be of immediate use for electron-neutrino appearance experiments such as the SBN program and DUNE.
VIII Acknowledgments
This document was prepared by the MicroBooNE collaboration using the resources of the Fermi National Accelerator Laboratory (Fermilab), a U.S. Department of Energy, Office of Science, HEP User Facility. Fermilab is managed by Fermi Research Alliance, LLC (FRA), acting under Contract No. DE-AC02-07CH11359. MicroBooNE is supported by the following: the U.S. Department of Energy, Office of Science, Offices of High Energy Physics and Nuclear Physics; the U.S. National Science Foundation; the Swiss National Science Foundation; the Science and Technology Facilities Council (STFC), part of the United Kingdom Research and Innovation; and The Royal Society (United Kingdom). Additional support for the laser calibration system and cosmic ray tagger was provided by the Albert Einstein Center for Fundamental Physics, Bern, Switzerland.
References
- Acero et al. (2018) M.A. Acero et al. (NOvA), “New constraints on oscillation parameters from appearance and disappearance in the NOvA experiment,” Phys. Rev. D 98, 032012 (2018), arXiv:1806.00096 [hep-ex] .
- Abi et al. (2020a) B. Abi et al., “Long-baseline Neutrino Oscillation Physics Potential of the DUNE Experiment,” (2020a), arXiv:2006.16043 [hep-ex] .
- Abe et al. (2018) K. Abe et al. (Hyper-Kamiokande), “Hyper-Kamiokande Design Report,” (2018), arXiv:1805.04163 [physics.ins-det] .
- Antonello et al. (2015) M. Antonello et al. (MicroBooNE, LAr1-ND, ICARUS-WA104), “A Proposal for a Three Detector Short-Baseline Neutrino Oscillation Program in the Fermilab Booster Neutrino Beam,” (2015), arXiv:1503.01520 [physics.ins-det] .
- Acciarri et al. (2017a) R. Acciarri et al., “Design and construction of the MicroBooNE detector,” Journal of Instrumentation 12, P02017 (2017a).
- Abi et al. (2020b) B. Abi et al., “Deep Underground Neutrino Experiment (DUNE), Far Detector Technical Design Report, Volume II: DUNE Physics,” (2020b), arXiv:2002.03005 [hep-ex] .
- Acciarri et al. (2020) R. Acciarri et al. (ArgoNeuT), “First measurement of electron neutrino scattering cross section on argon,” Phys. Rev. D 102, 011101 (2020), arXiv:2004.01956 [hep-ex] .
- Blietschau et al. (1978) J. Blietschau et al., “Total cross sections for and interactions and search for neutrino oscillations and decay,” Nuclear Physics B 133, 205 – 219 (1978).
- Abe et al. (2014) K. Abe et al. (T2K Collaboration), “Measurement of the Inclusive Electron Neutrino Charged Current Cross Section on Carbon with the T2K Near Detector,” Phys. Rev. Lett. 113, 241803 (2014).
- Wolcott et al. (2016) J. Wolcott et al. (MINERvA Collaboration), “Measurement of electron neutrino quasielastic and quasielasticlike scattering on hydrocarbon at ,” Phys. Rev. Lett. 116, 081802 (2016).
- Aguilar-Arevalo et al. (2009) Aguilar-Arevalo et al. (MiniBooNE Collaboration), “Neutrino Flux Prediction at MiniBooNE,” Phys. Rev. D 79, 072002 (2009).
- Aguilar-Arevalo et al. (2018) Aguilar-Arevalo et al. (MiniBooNE Collaboration), “Significant Excess of Electronlike Events in the MiniBooNE Short-Baseline Neutrino Experiment,” Phys. Rev. Lett. 121, 221801 (2018).
- Day and McFarland (2012) M. Day and K. S. McFarland, “Differences in Quasi-Elastic Cross-Sections of Muon and Electron Neutrinos,” Phys. Rev. D86, 053003 (2012), arXiv:1206.6745 [hep-ph] .
- Nikolakopoulos et al. (2019) A. Nikolakopoulos, N. Jachowicz, N. Van Dessel, K. Niewczas, R. González-Jiménez, J. M. Udías, and V. Pandey, “Electron versus Muon Neutrino Induced Cross Sections in Charged Current Quasielastic Processes,” Phys. Rev. Lett. 123, 052501 (2019).
- Abe et al. (2020) K. Abe et al. (T2K), “Constraint on the Matter-Antimatter Symmetry-Violating Phase in Neutrino Oscillations,” Nature 580, 339–344 (2020), arXiv:1910.03887 [hep-ex] .
- Adamson et al. (2016) P. Adamson et al., “The NuMI Neutrino Beam,” Nucl. Instrum. Meth. A806, 279–306 (2016), arXiv:1507.06690 [physics.acc-ph] .
- Brown et al. (2013) B. C. Brown et al., “The Fermilab Main Injector: high intensity operation and beam loss control,” Phys. Rev. ST Accel. Beams 16, 071001 (2013), arXiv:1307.2934 [physics.acc-ph] .
- Fasso et al. (1993) A. Fasso, A. Ferrari, J. Ranft, and P.R. Sala, “FLUKA: Present Status and Future Developments,” Conf. Proc. C 9309194, 493–502 (1993).
- Agostinelli et al. (2003) S. Agostinelli et al. (GEANT4), “GEANT4: A Simulation toolkit,” Nucl. Instrum. Meth. A 506, 250–303 (2003).
- Campanella et al. (1998) M Campanella, A Ferrari, P R Sala, and S Vanini, Reusing Code from FLUKA and GEANT4 Geometry, Tech. Rep. ATL-SOFT-98-039 (CERN, Geneva, 1998).
- Aliaga Soplin (2016) L. Aliaga Soplin, Neutrino Flux Prediction for the NuMI Beamline, Ph.D. thesis, William-Mary Coll. (2016).
- (22) C. Andreopoulos, C. Barry, S. Dytman, H. Gallagher, T. Golan, R. Hatcher, G. Perdue, and J. Yarba, “The GENIE Neutrino Monte Carlo Generator: Physics and User Manual,” arXiv:1510.05494 [hep-ph] .
- Note (1) GENIE v2.12.2 was used in this analysis.
- Heck et al. (1998) D. Heck, J. Knapp, J.N. Capdevielle, G. Schatz, and T. Thouw, “CORSIKA: A Monte Carlo Code to Simulate Extensive Air Showers,” Forschungszentrum Karlsruhe Report FZKA 6019 (1998).
- Note (2) CORSIKA version v7.4003 with constant mass composition model is used.
- Snider, E.L. and Petrillo, G. (2017) Snider, E.L. and Petrillo, G., “LArSoft: Toolkit for Simulation, Reconstruction and Analysis of Liquid Argon TPC Neutrino Detectors,” J. Phys. Conf. Ser. 898, 042057 (2017).
- Abratenko et al. (2020) P. Abratenko et al. (MicroBooNE), “Measurement of space charge effects in the MicroBooNE LArTPC using cosmic muons,” Journal of Instrumentation 15, P12037 (2020).
- Adams et al. (2018a) C. Adams et al., “Ionization Electron Signal Processing in Single Phase LArTPCs. Part I. Algorithm Description and Quantitative Evaluation with MicroBooNE Simulation,” Journal of Instrumentation 13, P07006 (2018a).
- Adams et al. (2018b) C. Adams et al., “Ionization Electron Signal Processing in Single Phase LArTPCs. Part II. Data/Simulation Comparison and Performance in MicroBooNE,” Journal of Instrumentation 13, P07007 (2018b).
- Acciarri et al. (2018) R. Acciarri et al., “The Pandora Multi-Algorithm Approach to Automated Pattern Recognition of Cosmic-Ray Muon and Neutrino Events in the MicroBooNE Detector,” The European Physical Journal C volume 78 (2018).
- Acciarri et al. (2017b) R. Acciarri et al. (ArgoNeuT), “First Observation of Low Energy Electron Neutrinos in a Liquid Argon Time Projection Chamber,” Phys. Rev. D 95, 072005 (2017b), arXiv:1610.04102 [hep-ex] .
- Acciarri et al. (2013) R. Acciarri et al. (ArgoNeuT), “A Study of Electron Recombination Using Highly Ionizing Particles in the ArgoNeuT Liquid Argon TPC,” JINST 8, P08005 (2013), arXiv:1306.1712 [physics.ins-det] .
- Golan et al. (2012) T. Golan, J.T. Sobczyk, and J. Zmuda, “NuWro: the Wroclaw Monte Carlo Generator of Neutrino Interactions,” Nucl. Phys. B Proc. Suppl. 229-232, 499–499 (2012).
- Nieves et al. (2004) J. Nieves, J. E. Amaro, and M. Valverde, “Inclusive quasielastic charged-current neutrino-nucleus reactions,” Phys. Rev. C 70, 055503 (2004).
- Gran et al. (2013) R. Gran, J. Nieves, F. Sanchez, and M. J. Vicente Vacas, “Neutrino-Nucleus Quasi-Elastic and 2p2h Interactions up to 10 GeV,” Phys. Rev. D 88, 113007 (2013).
- Nieves et al. (2011) J. Nieves, I. Ruiz Simo, and M. J. Vicente Vacas, “Inclusive Charged-Current Neutrino-Nucleus Reactions,” Phys. Rev. C 83, 045501 (2011).
- Pavlovic (2008) Z. Pavlovic, Observation of disappearance of muon neutrinos in the NuMI beam, Ph.D. thesis, The University of Texas at Austin (2008).