Current address: ]CrystMat Company, CH-8037 Zurich, Switzerland
Field-angle dependent vortex lattice phase diagram in MgB2
Abstract
Using small-angle neutron scattering we have studied the superconducting vortex lattice (VL) phase diagram in MgB2 as the applied magnetic field is rotated away from the axis and towards the basal plane. The field rotation gradually suppresses the intermediate VL phase which exists between end states aligned with two high symmetry directions in the hexagonal basal plane for . Above a critical angle, the intermediate state disappears, and the previously continuous transition becomes discontinuous. The evolution towards the discontinuous transition can be parametrized by a vanishing twelvefold anisotropy term in the VL free energy.
I Introduction
Vortex matter in type-II superconductors is highly sensitive to the environment provided by the host material. An example is the vortex lattice (VL) symmetry and orientation, which is governed by anisotropies in the screening current plane perpendicular to the applied field and the associated nonlocal vortex interactions.Kogan (1981); Kogan et al. (1997) Such anisotropies may arise from the Fermi surface or, in non- wave superconductors, from nodes in the superconducting gap. A rich VL phase diagram often arises when this anisotropy is incommensurate with an equilateral triangular VL, as seen in Nb with the applied field along the [100] crystalline direction.Laver et al. (2006, 2009); Mühlbauer et al. (2009) However, structural transitions between different VL configurations can also arise when the field is applied perpendicular to a sixfold symmetric crystal plane. In such cases higher-order contributions to the screening current plane anisotropy become relevant, affecting the orientation of the triangular VL relative to the crystalline axes as seen in UPt3Gannon et al. (2015); Avers et al. (2020) and MgB2.Cubitt et al. (2003); Das et al. (2012)
In the hexagonal superconductor MgB2, three different triangular VL phases (labeled F, L and I) were observed for , distinguished by their orientation relative to the crystalline axes.Das et al. (2012) The multiple phases arise from a competition between the superconducting - and -bands which have opposite in-plane anisotropies,Hirano et al. (2013) and are shown in the field-temperature () plane of Fig. 1(a).
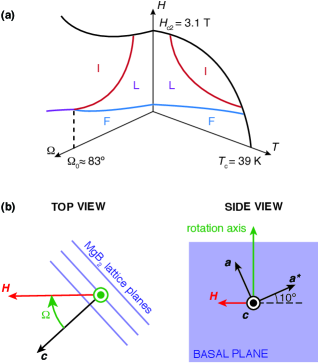
For low fields, the band anisotropy causes the VL to align with the crystal axis, producing the F phase. At high fields, where superconductivity on the -band is suppressed,Eskildsen et al. (2002); Cubitt et al. (2003) the band anisotropy aligns the VL with the crystal axis, producing the I phase. At intermediate fields, the VL undergoes a continuous rotation transition between the two extremes in the L phase. Since clockwise and counterclockwise rotations are degenerate, the VL fractures into oppositely rotated domains. This domain formation leads to robust metastable states which inhibit transitions between the three phases and demonstrate activated behavior.Das et al. (2012); Rastovski et al. (2013); Louden et al. (2019a, b)
Due to the hexagonal crystal structure of MgB2 and the -wave pairing, the VL free energy for can be expanded in term with anisotropies that are multiples of six.Zhitomirsky and Dao (2004) Moreover, the continuous rotation in the L phase implies that at least the six- and twelvefold terms are sufficiently strong to influence the VL orientation, as the transition would otherwise be discontinuous. Here, we have sought to explore the evolution of the VL phase diagram as the twelvefold anisotropy is suppressed by rotating the applied field away from the axis. We find that the twelvefold anisotropy decreases linearly as the rotation angle is increased, reducing the size of the L phase until it disappears entirely from the phase diagram at a critical value. Above the critical angle, the VL undergoes a first order phase transition directly from the F to I phase.
II Experimental Details
The VL was studied using small-angle neutron scattering (SANS) Mühlbauer et al. (2019). The SANS measurements were performed at the Bilby instrumentSokolova et al. (2019) at the Australian Nuclear Science and Technology Organization. Preliminary SANS measurements were carried out at the NG7 beam lineGlinka et al. (1998) at the National Institute of Standards and Technology Center for Neutron Research.
The experimental geometry used for the SANS measurements is shown in Fig. 1(b). Here the magnetic field is applied along the horizontal neutron beam direction, and at an angle relative to the crystalline axis achieved by rotating the sample about the vertical axis in situ. The SANS measurements used a neutron wavelength nm and bandwidth . All measurements were performed at 2 K.
Measurements were performed on a 200 g single crystal of MgB2 grown using a high pressure cubic anvil technique.Karpinski et al. (2003) The crystal has a platelet geometry, roughly 1 mm 1 mm wide and 50 m thick along the axis, and is isotopically enriched with 11B to reduce neutron absorption. The superconducting critical temperature of the sample is K, and the upper critical field increases from T to T as the field is rotated from the axis () to the basal plane ().Karpinski et al. (2003)
III Results
Figure 2(a) shows a VL diffraction pattern obtained for , with all six Bragg peaks lying on a circle of radius where T nm2 is the flux quantum.
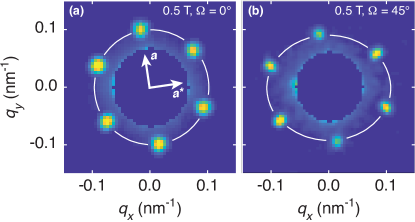
Here, the field and crystal have been rotated together through the Bragg condition of all six VL peaks. The crystal was deliberately mounted with the axis roughly 10∘ from the vertical to investigate whether the degeneracy of the two VL domain orientations in the L phase can be lifted by rotating the applied field away from the axis. The field rotation introduces a distortion of the VL due to the different penetration depth within the basal plane vs perpendicular to it.Campbell et al. (1988) This is seen in the SANS diffraction patterns in Fig. 2(b) as a relocation of the six Bragg peaks such that they lie on an ellipse with the minor axis parallel to the axis of rotation. We note that the diffraction patterns in Fig. 2 were obtained following a field cooling, which for left the VL in a metastable F phase.Das et al. (2012)
To test the effect of the field rotation on the VL phase diagram, measurements were made with , and and fields between 0.3 T and 1.2 T. Prior to each measurement, the magnitude of the applied field was cycled through a damped oscillation about the desired value with large enough amplitude (+5 mT, -4 mT, +3 mT, -2 mT, +1 mT) to overcome the activated behavior in MgB2 and ensure an equilibrium VL configuration. For , this produces an equilibrium L phase configuration at 0.5 T shown in Fig. 3(a) as opposed to the metastable F phase configuration shown in Fig. 2(a).Levett et al. (2002); Das et al. (2012); Louden et al. (2019a) As seen in Figs. 3(a)-3(d), the elliptical distortion increases with .
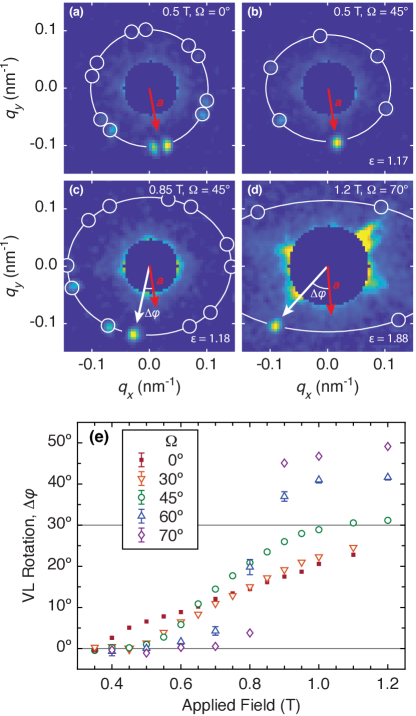
It is useful to quantify this distortion by the geometric anisotropy of the ellipse , defined as the ratio of its major and minor axes. At , is expected to reach the penetration depth anisotropy Campbell et al. (1988). To conserve beam time not all VL peaks were rocked through the Bragg condition for all measurements; however, their location can be determined from symmetry and the analysis discussed below, and are indicated by open circles in Figs. 3(a)-3(d). Within the L phase, split Bragg peaks corresponding to the two degenerate VL orientations are observed as seen in Figs. 3(a) and 3(c).
The angular rotation of the VL Bragg peak as a function of field and is summarized in Fig. 3(e). At each the rotation is measured relative to the peak position in the F phase at 0.3 T, corresponding to the projection of the axis onto the scattering plane, as shown in Figs. 3(c) and 3(d) and given by . For , we observe the same VL rotation reported earlier,Das et al. (2012) associated with the progression through the L phase. In the L phase, where the VL Bragg peaks are split, we show the orientation of the clockwise rotating domain. As is increased, the VL distortion allows the rotation of peaks which start near the minor axis to exceed the range for the F to I transition when . This is seen most clearly at , where the VL rotation approaches at 1.2 T.
The location of the VL peak positions in the SANS data are governed by two separate effects: the VL rotation transition within the L phase, and the geometric distortion due to the penetration depth anisotropy discussed above. To analyze the progression of the rotation transition it is useful to first remove the effect of the geometric distortion, which corresponds to mapping the VL Bragg peaks positions from lying on an ellipse back onto a circle. Due to flux quantization, the area of the circle in reciprocal space must be the same as the original ellipse, and the transformation can treated as a squeeze mapping of all points in the circle to all points in the ellipse:
| (1) |
Converting to polar coordinates and , and solving for yields a transcendental equation that can be solved numerically given any point on the ellipse:
| (2) |
Values of and are determined from 2D Gaussian fits to VL Bragg peaks on the SANS detector, and is determined from the measurement performed at the same applied field with = 0. Once is determined, the re-scaled VL orientation is given by
| (3) |
Finally, the rescaled VL rotations can be calculated by subtracting the VL orientation at 0.3 T,
| (4) |
and are shown in Fig. 4(a).
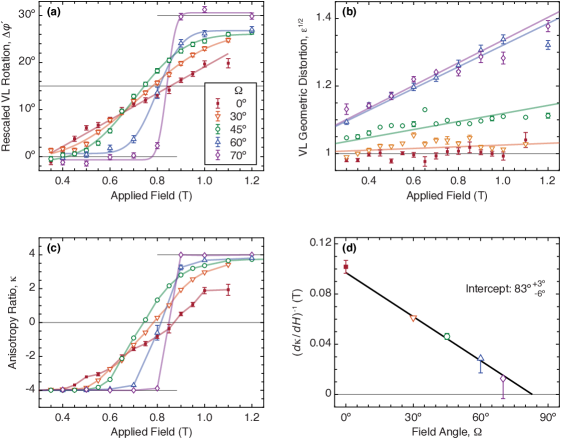
The transformation rescales the VL rotation so that the phase transition always occurs in the range to for all , consistent with the L phase behavior for .
From Fig. 4(a) it is clear that the VL phase diagram changes dramatically with increasing . Firstly, the onset of the rotation transition moves to higher fields, indicating that the F phase () is expanding. Secondly, once the rotation does begin, it occurs more rapidly at high . Thirdly, the L phase () either becomes very narrow or vanishes entirely for . This would correspond to a discontinuous phase transition directly from the F to the I phase (). The increasingly abrupt rotation transition is also evident in Figs. 4(b), which shows an abrupt jump in the slope of versus field for . Here, we note that the field dependence of at constant is due to the gradual suppression of superconductivity on the -band.Cubitt et al. (2003) This rise in with respect to field is similar to phenomena observed in V3Si,Christen et al. (1985) 2-NbSe2,Gammel et al. (1994) and Sr2RuO4.Kuhn et al. (2017)
IV Discussion
The VL phase diagram in MgB2 can be modeled by a free energy
| (5) |
containing six- and twelve-fold anisotropy terms. This form of the free energy was originally proposed for where ,Zhitomirsky and Dao (2004); Das et al. (2012); Olszewski et al. (2020) but here it is generalized to non-zero . In this model is positive, and the continuous rotation transition in the L phase occurs when the anisotropy ratio is varied between and 4. Note that if was negative, the VL would undergo a discontinuous reorientation transition between the F and I phases when changes sign. For each measurement it is possible to calculate the anisotropy ratio
| (6) |
obtained from a minimization of the free energy in Eq. (5). This is shown in Fig. 4(c), and is seen to mimic the behavior of the re-scaled rotation angle . We note that actual values of most likely extend outside the range allowed by Eq. (6). However, this does not affect the analysis below as it focuses on the region where is close to zero.
The increasingly abrupt transition seen in Figs. 4(a) and 4(c) suggests a reduction and possible sign change of as increases. It is possible to model the increasingly rapid reorientation transition by Taylor expanding to linear order around the field where , and thus , vanish:
| (7) |
Here, is an undetermined constant. The slope of with respect to field near the transition at is then an indirect measure of :
| (8) |
where we have taken to be field independent. Figure 4(d) shows the inverse slope measured near for each . The inverse slope depends linearly on , suggesting a functional form for :
| (9) |
Extrapolating to , we find an estimate for , where the error bars both represent one standard deviation. For values of , will be negative and the VL will undergo a first-order transition between the F and I phases. As a result, the L phase vanishes and becomes a critical field corresponding to an equal F and I phase energy (rather than simply the field where which is the case for ). We note that may already be above , as the uncertainly on at this angle extends to negative values. Behavior qualitatively similar to MgB2 has also been observed in YBCO,Yethiraj et al. (1993) where a triangular to square VL transition switches from second to first order at a critical angle of . The much smaller for YBCO is likely due to the highly two-dimensional nature of this material, making it relatively more susceptible to field rotations away from the axis.
Finally, we return to the question of whether rotating the applied field away from the axis will break the VL domain degeneracy within the L phase. Such an effect was previously observed in TmNi2B2C where the VL undergoes a triangular to square transition with a degenerate intermediate rhombic phase,Eskildsen et al. (1998) and where rotating the field away from the axis by is sufficient to suppress one of the two rhombic domains.Dewhurst In an ideal uniaxial superconductor with an isotropic basal plane, London theory predicts that the two-fold anisotropy introduced by field rotation will favor a VL orientation with Bragg peaks on the minor axis of the ellipse in reciprocal space.Campbell et al. (1988) However, any real material will exhibit some basal plane anisotropy which may compete with the uniaxial effect, and the relative strength of the two will determine the VL orientation. As an example, one can consider NbSe2, where the triangular VL is oriented in a manner corresponding to the maximal energy according to the London theory.Gammel et al. (1994)
In our SANS measurements the MgB2 crystal was mounted such that within the L phase Bragg peaks for one of the domains lie near the vertical axis, as seen in Fig. 3(a), and are thus favored by the uniaxial effect. However, peaks corresponding to both L phase domains were clearly observed at and 0.6 T and at and 0.9 T, indicating that the degeneracy is not readily lifted in MgB2. This suggests that at these values of the uniaxial anisotropy is weaker than , and that a suppression of the degeneracy will only occur just below . It is also consistent with the inability of the uniaxial effect to cause a VL reorientation in the F phases to have the Bragg peaks on the minor axis of the ellipse, since and are of the same order of magnitude except in the immediate vicinity of and . That said, the uniaxial anisotropy does appear to lower the free energy of the F phase relative to the I phase, causing to shift to higher fields in Figs. 4(a) and 4(c) as . This conclusion is supported by previous SANS measurements where the magnetic field was rotated about the .Pal et al. (2006) Here the L phase (rather than the F phase) is favored by the uniaxial anisotropy, and at 0.4 T the critical angle is shifted to a lower value .
V CONCLUSION
In summary, we have demonstrated how the continuous (second order) VL rotation transition observed in MgB2 for gradually evolves towards and finally becomes discontinuous (first order) as the applied magnetic field is rotated away from the axis by . For rotation angles below this critical value, domain formation in the intermediate L phase persists. We speculate that the long lived metastable VL phases, attributed to domain formation in the L phase, will thus no longer occur above the critical angle, and should be the subject of further SANS studies.
Acknowledgements
This work was supported in part by the U.S. Department of Energy, Office of Basic Energy Sciences, under Award No. DE-SC0005051 (A.W.D.L, M.R.E). We acknowledge the support of the National Institute of Standards and Technology, U.S. Department of Commerce, in providing the neutron research facilities used in this work. We acknowledge useful conversations with G. Longbons and A. Francisco in preparation for these experiments, as well as the assistance of J. Krzywon, A. Qiang, and C. Baldwin in completing them.
References
- Kogan (1981) V. G. Kogan, Phys. Rev. B 24, 1572 (1981).
- Kogan et al. (1997) V. G. Kogan, M. Bullock, B. Harmon, P. Miranovic, L. Dobrosavlevic-Grujic, P. L. Gammel, and D. J. Bishop, Phys. Rev. B 55, R8693 (1997).
- Laver et al. (2006) M. Laver, E. M. Forgan, S. P. Brown, D. Charalambous, D. Fort, C. Bowell, S. Ramos, R. J. Lycett, D. K. Christen, J. Kohlbrecher, C. D. Dewhurst, and R. Cubitt, Phys. Rev. Lett. 96, 167002 (2006).
- Laver et al. (2009) M. Laver, C. J. Bowell, E. M. Forgan, A. B. Abrahamsen, D. Fort, C. D. Dewhurst, S. Mühlbauer, D. K. Christen, J. Kohlbrecher, R. Cubitt, and S. Ramos, Phys. Rev. B 79, 014518 (2009).
- Mühlbauer et al. (2009) S. Mühlbauer, C. Pfleiderer, P. Böni, M. Laver, E. M. Forgan, D. Fort, U. Keiderling, and G. Behr, Phys. Rev. Lett. 102, 136408 (2009).
- Gannon et al. (2015) W. J. Gannon, W. P. Halperin, C. Rastovski, K. J. Schlesinger, J. Hlevyack, M. R. Eskildsen, A. B. Vorontsov, J. Gavilano, U. Gasser, and G. Nagy, New J. Phys. 17, 023041 (2015).
- Avers et al. (2020) K. E. Avers, W. J. Gannon, S. J. Kuhn, W. P. Halperin, J. A. Sauls, L. DeBeer-Schmitt, C. D. Dewhurst, J. Gavilano, G. Nagy, U. Gasser, and M. R. Eskildsen, Nat. Phys. 16, 531 (2020).
- Cubitt et al. (2003) R. Cubitt, M. R. Eskildsen, C. D. Dewhurst, J. Jun, S. M. Kazakov, and J. Karpinski, Phys. Rev. Lett. 91, 047002 (2003).
- Das et al. (2012) P. Das, C. Rastovski, T. R. O’Brien, K. J. Schlesinger, C. D. Dewhurst, L. DeBeer-Schmitt, N. D. Zhigadlo, J. Karpinski, and M. R. Eskildsen, Phys. Rev. Lett. 108, 167001 (2012).
- Hirano et al. (2013) T. Hirano, K. Takamori, M. Ichioka, and K. Machida, J. Phys. Soc. Japan 82, 063708 (2013).
- Eskildsen et al. (2002) M. R. Eskildsen, M. Kugler, S. Tanaka, J. Jun, S. M. Kazakov, J. Karpinski, and Ø. Fischer, Phys. Rev. Lett. 89, 187003 (2002).
- Rastovski et al. (2013) C. Rastovski, K. J. Schlesinger, W. J. Gannon, C. D. Dewhurst, L. DeBeer-Schmitt, N. D. Zhigadlo, J. Karpinski, and M. R. Eskildsen, Phys. Rev. Lett. 111, 107002 (2013).
- Louden et al. (2019a) E. R. Louden, C. Rastovski, S. J. Kuhn, A. W. D. Leishman, L. DeBeer-Schmitt, C. D. Dewhurst, N. D. Zhigadlo, and M. R. Eskildsen, Phys. Rev. B 99, 060502(R) (2019a).
- Louden et al. (2019b) E. R. Louden, C. Rastovski, L. DeBeer-Schmitt, C. D. Dewhurst, N. D. Zhigadlo, and M. R. Eskildsen, Phys. Rev. B 99, 144515 (2019b).
- Zhitomirsky and Dao (2004) M. E. Zhitomirsky and V. H. Dao, Phys. Rev. B 69, 054508 (2004).
- Mühlbauer et al. (2019) S. Mühlbauer, D. Honecker, È. A. Pèrigo, F. Bergner, S. Disch, A. Heinemann, S. Erokhin, D. Berkov, C. Leighton, M. R. Eskildsen, and A. Michels, Rev. Mod. Phys. 91, 015004 (2019).
- Sokolova et al. (2019) A. Sokolova, A. E. Whitten, L. de Campo, J. Christoforidis, A. Eltobaji, J. Barnes, F. Darmann, and A. Berry, J. Appl. Crystallogr. 52, 1 (2019).
- Glinka et al. (1998) C. J. Glinka, J. G. Barker, B. Hammouda, S. Krueger, J. J. Moyer, and W. J. Orts, J. Appl. Cryst. 31, 430 (1998).
- Karpinski et al. (2003) J. Karpinski, M. Angst, J. Jun, S. M. Kazakov, R. Puzniak, A. Wisniewski, J. Roos, H. Keller, A. Perucchi, L. Degiorgi, M. R. Eskildsen, P. Bordet, L. Vinnikov, and A. Mironov, Supercond. Sci. Technol. 16, 221 (2003).
- Campbell et al. (1988) L. J. Campbell, M. M. Doria, and V. G. Kogan, Phys. Rev. B 38, 2439 (1988).
- Levett et al. (2002) S. J. Levett, C. D. Dewhurst, and D. M. Paul, Phys. Rev. B 66, 014515 (2002).
- Christen et al. (1985) D. K. Christen, H. R. Kerchner, S. T. Sekula, and Y. K. Chang, Physica B 135, 369 (1985).
- Gammel et al. (1994) P. L. Gammel, D. A. Huse, R. N. Kleiman, B. Batlogg, C. S. Oglesby, E. Bucher, D. J. Bishop, T. E. Mason, and K. Mortensen, Phys. Rev. Lett. 72, 278 (1994).
- Kuhn et al. (2017) S. J. Kuhn, W. Morgenlander, E. R. Louden, C. Rastovski, W. J. Gannon, H. Takatsu, D. C. Peets, Y. Maeno, C. D. Dewhurst, J. Gavilano, and M. R. Eskildsen, Phys. Rev. B 96, 174507 (2017).
- Olszewski et al. (2020) M. W. Olszewski, M. R. Eskildsen, C. Reichhardt, and C. J. O. Reichhardt, Phys. Rev. B 101, 224504 (2020).
- Yethiraj et al. (1993) M. Yethiraj, H. A. Mook, G. D. Wignall, R. Cubitt, E. M. Forgan, S. L. Lee, D. M. Paul, and T. Armstrong, Phys. Rev. Lett. 71, 3019 (1993).
- Eskildsen et al. (1998) M. R. Eskildsen, K. Harada, P. L. Gammel, A. B. Abrahamsen, N. H. Andersen, G. Ernst, A. P. Ramirez, D. J. Bishop, K. Mortensen, D. G. Naugle, K. D. D. Rathnayaka, and P. C. Canfield, Nature 393, 242 (1998).
- (28) C. D. Dewhurst, private communication.
- Pal et al. (2006) D. Pal, L. DeBeer-Schmitt, T. Bera, R. Cubitt, C. D. Dewhurst, J. Jun, N. D. Zhigadlo, J. Karpinski, V. G. Kogan, and M. R. Eskildsen, Phys. Rev. B 73, 012513 (2006).