Universal interrelation between dynamics and thermodynamics and a dynamically-driven “c”-transition in fluids
Abstract
Our first very wide survey of the supercritical phase diagram and its key properties reveals a universal interrelation between dynamics and thermodynamics and an unambiguous transition between liquidlike and gaslike states. This is seen in the master plot showing a collapse of the data representing the dependence of specific heat on key dynamical parameters in the system for many different paths on the phase diagram. As a result, the observed transition is path-independent. We call it a “c”-transition due to the “c”-shaped curve parameterizing the dependence of the specific heat on key dynamical parameters. The “c”-transition has a fixed inversion point and provides a new structure to the phase diagram, operating deep in the supercritical state (up to at least 2000 times the critical pressure and 50 times the critical temperature). The data collapse and path independence as well as the existence of a special inversion point on the phase diagram are indicative of either of a sharp crossover or a new phase transition in the deeply supercritical state.
pacs:
65.20.De 65.20.JK 61.20Gy 61.20JaI Introduction
The basic phase diagram of matter charts the areas where solid, liquid and gas exist as physically distinct phases separated by transition lines. The three transition lines all emerge from the triple point, but two of three are finite in length. The sublimation line terminates at zero temperature or pressure, and the boiling line terminates at the critical point. The third line, the melting line, extends to arbitrary temperatures and pressures, so long as the system remains chemically unaltered. A large area of the phase diagram lies above the critical point, representing the supercritical state of matter.
Until fairly recently, there was no reason to survey the state of matter well above the critical point in any detail. This part of the phase diagram was thought to be physically homogeneous with no discernible differences between liquid-like and gas-like states landau ; deben . Not far above the critical point, persisting critical anomalies can continue to conditionally separate liquid-like and gas-like states. More recently, experiments and theory have given indications that the entire supercritical state may in fact be inhomonegenous and have states with qualitatively different properties.
Going deeply supercritical in the experiment is often unworkable and, when possible, is limiting in terms of measuring key system properties nist . We are much less limited in molecular dynamics (MD) simulations.
In this paper, we conduct the widest and most detailed survey of the supercritical phase diagram undertaken so far: we extend the parameter range from the melting point and up to 330 and 8000 ( and are critical temperature and pressure for Argon) and traverse it along different isobars, isochores and isotherms. We calculate key thermodynamic and dynamical properties along different paths on the phase diagram. We then show that all data collapse on a single dynamic-thermodynamic “c”-shaped master curve with a fixed inversion point. The “c”-transition provides an unambiguous separation of liquidlike and gaslike fluids, extending deep into the supercritical state and therefore challenging the existing view of this state as homogeneous and lacking qualitative transitions. The data collapse and the existence of a special inversion point on the phase diagram are consistent with either a sharp crossover or a new phase transition (perhaps of higher-order) operating in the supercritical state of matter.
II Simulation details
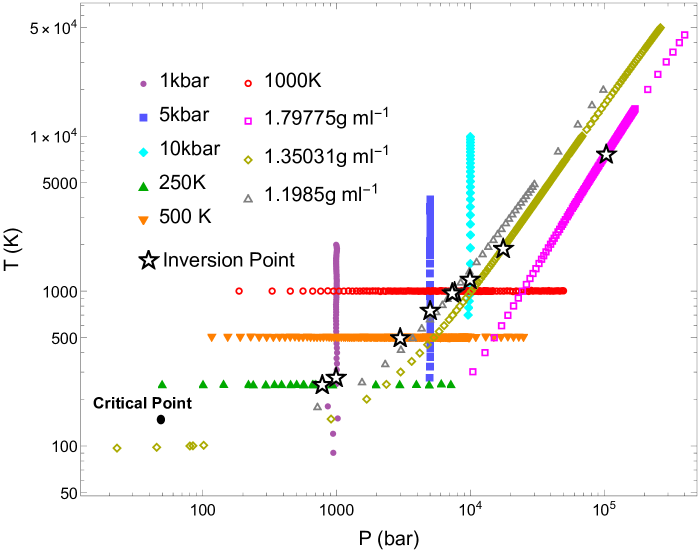
We simulate a commonly used and well-characterised Lennard-Jones system describing Argon (, eV) along three isobars, isotherms, and isochores in the deep supercritical state, plus an additional isobar near the critical point. The supercritical paths are plotted in Fig. 1. Our largest temperature and pressure, 330 and 8000 (about 50,000 K and 40 GPa) are below those where metallisation and ionization start in Ar. Within the simulated range of state points, the “c”-transition is seen up to 2000 times the critical pressure and 50 times the critical temperature.
Equilibration was performed in the NPT ensemble with the Langevin thermostat in order to generate the mean densities along the isobars and isotherms. System sizes of 500, 4000, and 108,000 atoms were used, with no discrepancy in calculated quantities or our results between these sized. Consistent with the earlier ascertained insensitivity of viscosity to system size viscositysize , we find that the viscosity (and the heat capacity) for larger systems of up to 108,000 atoms coincides with that of the smaller systems we simulated. We selected the timestep of 1 fs, which is under 100 times smaller than the fastest oscillations in any system, and conserved total energy under the Velocity-Verlet integrator in the NVE ensemble to one part in . Configurations at the target densities on all paths were then generated, which were then equilibrated with the NVT ensemble for 50 ps. Following this equilibration, we generated 20 independent initial conditions for each state point using seeded velocities, and each of these initial conditions were run for 1 ns in the NVE ensemble during which all properties were calculated. We calculated in the NVE ensemble as Frenkel2001 :
| (1) |
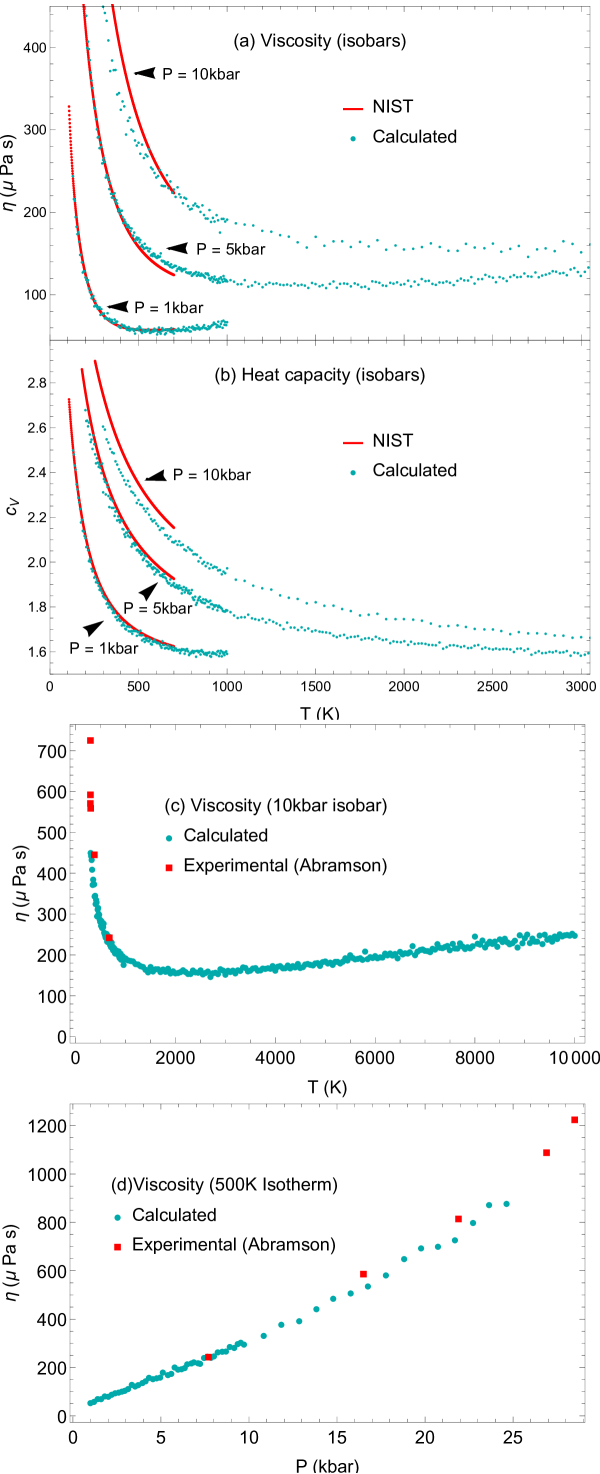
with the total kinetic energy. From here on out, we set . We plot the calculated heat capacities compared to NIST data (where available) nist in Fig. 2a-b, demonstrating good agreement. The high-frequency shear modulus and shear viscosity were calculated using the molecular stress autocorrelation function, from Green-Kubo theory Zwanzig1965 ; Balucani1994 :
| (2) |
| (3) |
with an off-diagonal component of the microscopic stress tensor. The integration of the long-time tails of autocorrelation functions is a well known issue with the practical implementation of Green-Kubo formulae Zhang2015 . The 20 independent initial conditions were used to address this, with the autocorrelation function being averaged over these initial conditions. The end result for viscosity was insensitive to adding more initial conditions and also whether the autocorrelation function was calculated in the NVT or NVE ensembles.
III Results and Discussion
We zero in on the relationship between thermodynamic and dynamical properties of the supercritical system. The specific heat is an informative choice for a thermodynamic property. The choice of a dynamical property is less obvious because there are several candidates. We first try viscosity, , because there is an obvious distinction between its behaviour in the liquid and gas phases. Indeed, decreases and increases with temperature in the liquidlike and gaslike regimes, respectively sciadv . In Fig. 2 we observe a good agreement between calculated and experimental viscosity. This includes good agreement with high-pressure data range abramson where the NIST data can be less reliable due to data interpolations used at high pressure.
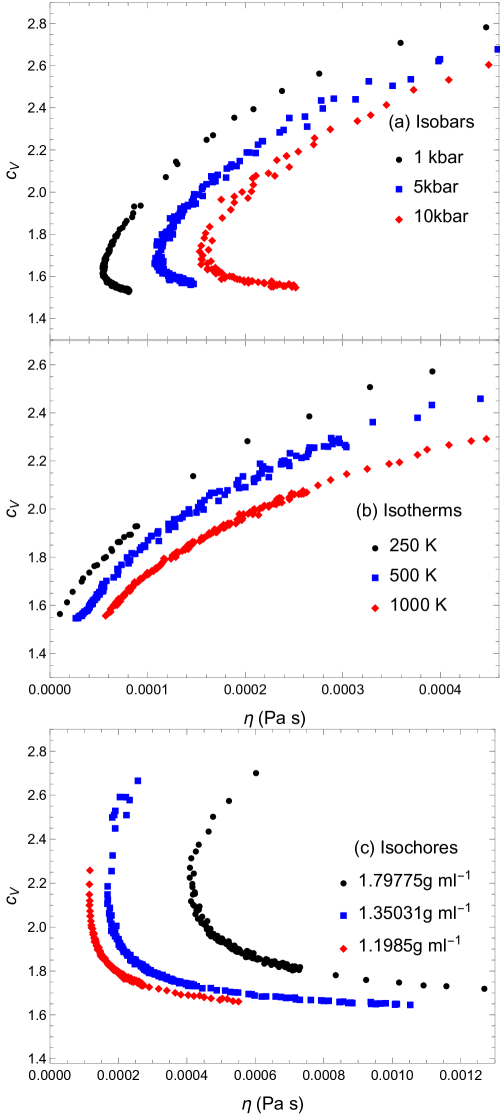
We plot the dependence of on for each of our supercritical phase diagram paths in Fig. 3. Along isobars and isochores, has clear turning points due to corresponding minima in , whereas no such minima exist along our isothermal paths. We observe strong path dependence in the interrelation between and , and will return to the issue of path dependence below. Here we note the earlier work excess relating viscosity to excess entropy calculated from the virial expansion at low density. This relation was discussed on empirical grounds and is unrelated to our approach where we discuss the system properties on the basis of excitations that the system possesses.
Our next important choice for the dynamical parameter is informed by the Maxwell-Frenkel viscoelastic theory maxwell ; frenkel where the combined elastic and viscous response of a liquid is represented as:
| (4) |
where is shear strain, is viscosity, is high-frequency shear modulus and is shear stress.
Using (4), Frenkel modified the Navier-Stokes equation to include the elastic response. A simplified form of the resulting equation reads ropp ; physrep :
| (5) |
where is the velocity component perpendicular to , is transverse wave velocity , is density and is the liquid relaxation time.
Seeking the solution of (5) as gives and . If , has neither a real part nor transverse propagating modes. For , , where . Here,
| (6) |
defines a gapped momentum state seen in several distinct areas of physics physrep . In liquids and supercritical fluids, is the important parameter governing the existence of solid-like transverse waves physrep ; prl .
It follows from the above discussion and Eq. (6) in particular that the solution to the Maxwell-Frenkel viscoelasticity importantly depends on the dynamical fluid elasticity length ropp . The physical meaning of this length is that it sets the range of propagation of solid-like transverse waves in the liquid because is the time during which the shear stress is relaxed. Hence, should uniquely depend on because (a) governs the propagation of transverse modes and (b) each mode carries the energy (in harmonic classical case). Therefore, we will use in our subsequent analysis.
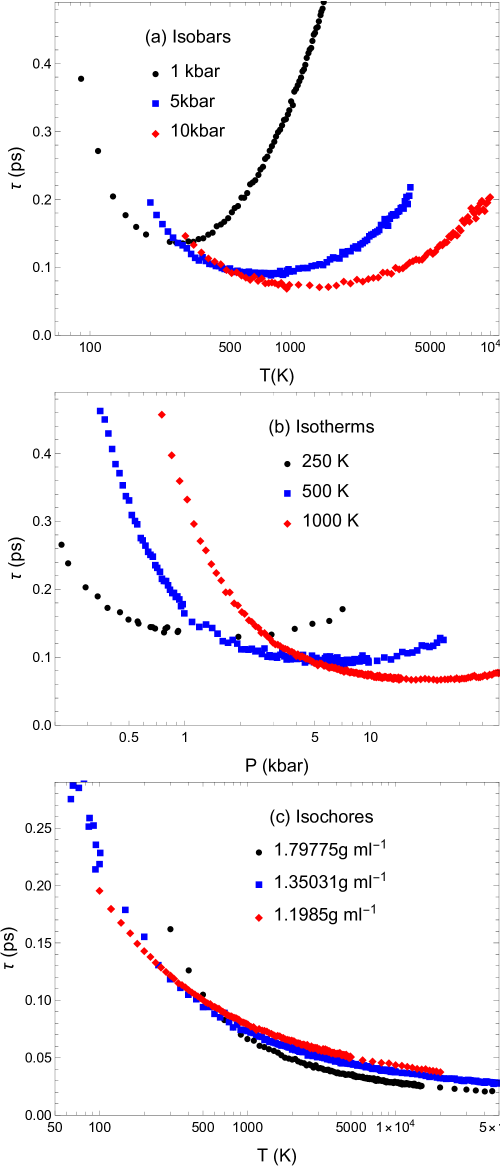
Before invoking , it is first instructive to look at and dependencies. We plot the calculated along our nine supercritical phase diagram paths in Fig. 4 and observe that has minima along isobars and isotherms and has no minima along isochores. To understand the minima, we recall that Frenkel’s theory relates to the average time between molecular rearrangements in the liquid frenkel . Backed by experiments and modelling jac ; iwa , this relation has since become an accepted view dyre . In the low-temperature liquid regime, decreases with temperature. In the high-temperature gaslike regime, shear momentum transfer takes place via the collisions of kinetic theory, and relaxation time is therefore interpreted as the mean time between collisions in this regime frenkel ; chapman . Then, the minima represent a crossover from a liquidlike relaxation time commanded by diffusion and oscillation events zaccone to a gaslike relaxation time commanded by collisions ropp . This same crossover takes place along isochores, but manifests differently in because can only decrease with temperature on an isochore. Indeed, in the gaslike regime, where and are the particle mean-free path and thermal velocity in the gaslike state and , where is particle density and is the particle cross-section area. Hence decreases with temperature at constant mostly because increases ( decreases with temperature weakly). We note that the minima of both and depend on the path taken on the phase diagram and path parameters.
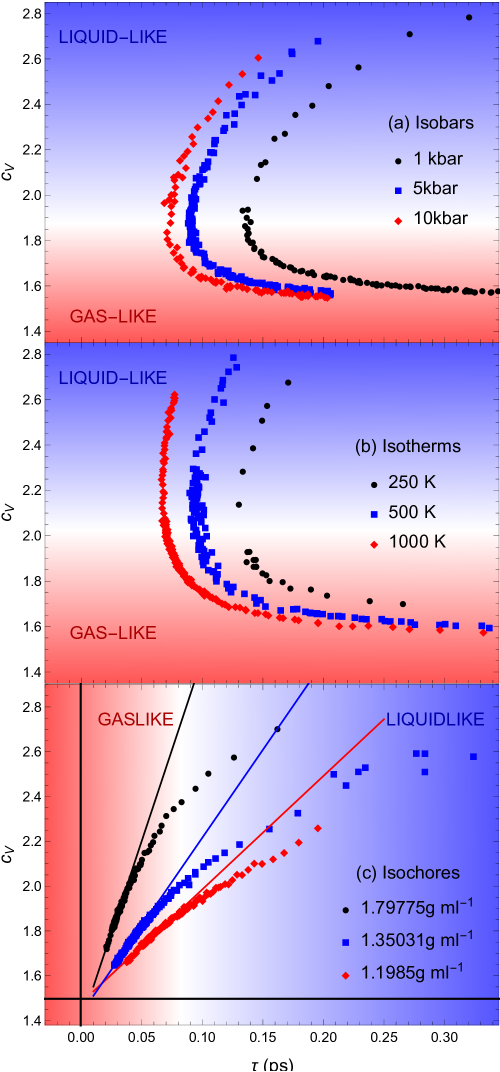
We next investigate the relationship between dynamics and thermodynamics by plotting as a function of along these nine paths in Fig. 5. Along isobars and isotherms, has clear turning points corresponding to the minima in . This turning point occurs close to , such that the crossover in from liquidlike to gaslike corresponds to the dynamical transition in . Along isochores, the situation is again more subtle. However, since the ideal gas limit as corresponds to both and , the function in its gaslike regime must approach as . Inspection of Fig. 5c reveals that this is indeed the case, and that settles into this limiting behaviour again close to .
Notably, Figures 3 and 5 show the significant path dependence of on and : depends differently on these parameters along isochoric, isobaric and isothermic paths as well as different conditions for each path. Moreover, switching the dependence of from to the related completely changes the shape of the curves.
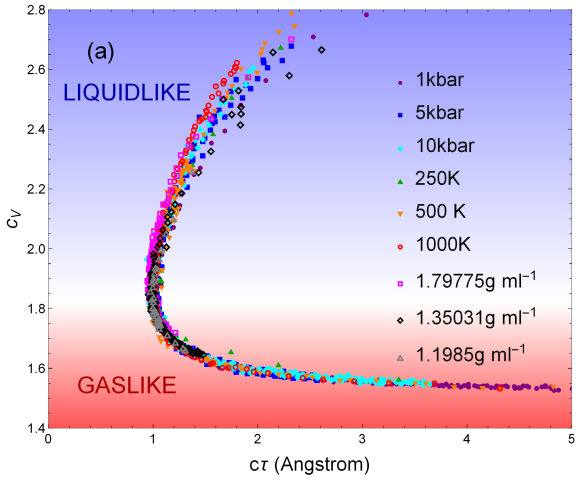
We now come to the pinnacle of these analyses. The minima of are path-dependent as mentioned earlier. Instead of plotting , we plot and as the function of the key parameter in the solution of Eq. (5) which we have called the dynamical length ( is calculated as as discussed below Eq. (5)). The physical reason for this dependence is provided by Eq. (6): governs the propagation of collective modes (phonons) in liquids and supercritical fluids. Since each phonon carries energy ( in the classical harmonic case), is governed by . Moreover, this dependence is predicted to be unique and path-independent, in contrast to the dependence of on or plotted earlier.
The result of this master plot in Fig. 6a is striking. Despite the clear difference among paths of the same and different type seen in Figs. 3, 4 and 5, the functions along all deeply supercritical paths converge into the same “c”-shaped curve in Fig. 6a.
 |
The values of and Å at the inversion point in Fig. 6a are physically significant. Brillouin was first to recognize the significance of bril . The solid energy can be written as the sum of energies of one longitudinal and two transverse modes as , where is the kinetic and potential energy component of each mode (the two components are equal according to the equipartition theorem), is the energy of one mode in the harmonic classical case and is the number of particles. Brillouin assumed that liquids do not support solid-like transverse modes, implying that the potential energy component of these modes, , becomes 0. This gives the energy and bril . Since this contradicted the experimental of liquids at the melting point, a proposition was made that liquids consist of crystallites with easy cleavage directions so that liquids have and can flow at the same time. We now understand that (a) liquids do, in fact, support solid-like transverse modes, albeit at high- only as in Eq. (6) (or at high-frequency for propagating modes ropp ; physrep ) and (b) these modes do disappear eventually, but only well above the melting point and at very high temperature where becomes comparable to Debye vibration period. At this point, in Eq. (6) becomes close to the largest wavevector set by the interatomic separation in the system (ultaviolet, or UV, cutoff), and all transverse waves disappear from the spectrum, resulting in . This disappearance of transverse modes and the condition correspond to the Frenkel line, which separates two dynamical regimes of particle motion: combined oscillatory and diffusive motion in the low-temperature “rigid” liquid (rigid in a sense of its ability to support solid-like transverse modes); and purely diffusive motion in the high-temperature non-rigid gaslike fluid ropp . The loss of the oscillatory component at the Frenkel line transition gives the second, dynamical, criterion of the line: the disappearance of the minima of the velocity autocorrelation function (VAF). The thermodynamic criterion and the dynamical VAF criterion give coinciding lines on the phase diagram vaf .
A change in dynamics implies and is implied by a change in structure ropp , and, stimulated by the Frenkel line idea, the transitions at the Frenkel line have been subsequently experimentally observed in supercritical Ne f1 , CH4 f2 , N2 f3 , C2H6 f4 and CO2 f5 using X-ray, neutron and Raman scattering techniques. A crossover in structure has been seen across the FL in simulated argon Wang2017 , using the same potential as in this work, however this crossover is subtle as compared to the transition presented here.
As mentioned earlier, corresponds to the purely harmonic case where the mode energy is . Anharmonicity can change this result by a relatively small amount ropp , and the disappearance of transverse modes corresponds to approximately. We also note that similarly to solids, plane waves decay in liquids. The decay mechanisms in solids include anharmonicity, defects and structural disorder present in, for example, glasses. Despite this decay, high-temperature specific heat in solids is governed by phonons. In liquids, the additional decay mechanism is related to atomic jumps ropp . Nevertheless, the propagation length of high-frequency excitations in liquids and supercritical fluids is on the order of nanometers, as evidenced by experiments and modelling hoso1 ; hoso2 ; hoso3 ; prl . This is similar to room-temperature solids where the lifetime of high-frequency phonons is on the order of picoseconds and the propagation range is on the order of nanometers Jain2016 and where disorder and/or defects reduce these values further. This is also similar to glasses which are structurally similar to liquids ruffle . Therefore, phonon excitations govern the specific heat in liquids and supercritical fluids to the same extent they do in solids.
The significance of the propagation range reaching about 1 Å at the inversion point in Fig. 6a is that it corresponds to the shortest distance in the system (UV cutoff), the interatomic separation on the order of Angstroms in condensed matter phases. This distance is fixed by fundamental physical constants in the form of the Bohr radius which, together with the Rydberg energy, sets the viscosity minimum sciadv . The UV cutoff puts the upper limit for -points for propagating waves in the system. Recall that in (6) sets the range of transverse waves. When becomes comparable to the largest, Debye, wavevector, all transverse modes disappear from the system spectrum. We have calculated the Debye wavevector landau , where is particle density, to be about 1.0 Å-1 at the inversion point. Equating it to in (6) gives 0.5 Å. This is consistent with about 1 Å at the inversion point in Fig. 6a, given the approximate nature of Debye model and that (6) applies to the linear part of the dispersion relation only but not to the range where flattens off close to the zone boundary at .
In the gaslike state, the quantity increases towards the ideal limit of in Fig. 6a. In the gaslike state, is related to the particle mean free path since the speed of sound is proportional to the thermal velocity and is related to the average time between particle collisions frenkel . The decrease of heat capacity from 2 to 3/2 in the gaslike regime of fluid dynamics can be explained in terms of longitudinal modes at short distance in the fluid vanishing as exceeds their wavelength ropp . The collapse of all curves in the gaslike regime in Fig. 6a implies that is the only parameter necessary to characterise the loss of these degrees of freedom in this regime.
We reiterate to make explicit the significance of this effect in Fig. 6a : paths in the supercritical region, separated by orders of magnitude in temperature and pressure, all sport the same vs curves. The heat capacity, usually defined as a function of both temperature and pressure, is here reduced to a near-universal function of the single dynamical fluid elasticity length which sets the range of propagation of solid-like transverse modes as discussed above. What’s more, the apex, or the inversion point, of this unified curve takes place at , close to the key value at the Frenkel line and to the UV cutoff length of the system.
We plot temperature and pressure points at which at the inversion point on all paths as stars in Fig. 1. We observe that the location of these points varies by orders of magnitude on the phase diagram, yet they all coincide on our master plot in Fig. 6a.
This curve therefore represents a dynamically driven transition between liquidlike and gaslike states which is present across the supercritical region and is path independent. We call this transition a “c”-transition due to the shape of Fig. 6a. The inversion point of all coinciding curves in Fig. 6a is well-defined and therefore serves as an unambiguous transition point between liquidlike and gaslike states in the supercritical region. The inversion point does not depend on a theory such as that underlying the thermodynamic criterion of the Frenkel line and the dynamical VAF criterion.
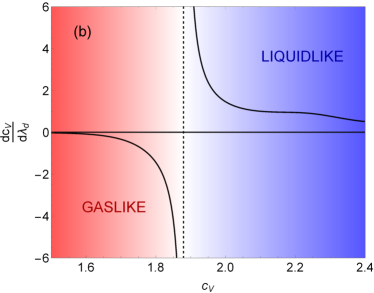
The transition is further illustrated in Fig. 6b: we fit the data in Fig. 6a, calculate the derivative and plot the derivative vs , observing the divergence at close to the key value at the Frenkel line.
An alternative way to collapse the data from different paths is informed by the theory of liquid thermodynamics. In this theory, the liquid energy at low temperatures, where transverse waves exist below the Frenkel line, depends on the ratio of in (6) and the Debye wavector : ropp ; prl ; jpcm (or, alternatively, on for propagating waves ropp , where and is Debye frequency). The physical picture here is that shorter at high temperature results in progressive disappearance of transverse waves from the system spectrum ropp (this theory has undergone a detailed and rigorous test fluids and explains the decrease of with temperature in Fig. 2 (b)). However, this disappearance of transverse modes can only proceed up to the largest -point, , set by the UV cutoff in the system as discussed earlier. As a result, enters the equation for the liquid energy. We calculate as landau and plot as a function of dimensionless product in Fig. 7. We observe that the curves from all paths collapse in the region of large down to about , showing that below the Frenkel line depends on the product only, as predicted theoretically. This is followed by the divergence of below in the gaslike state along different paths, presumably because the solid-like concepts underlying become progressively less relevant in the gaslike state at high temperature.
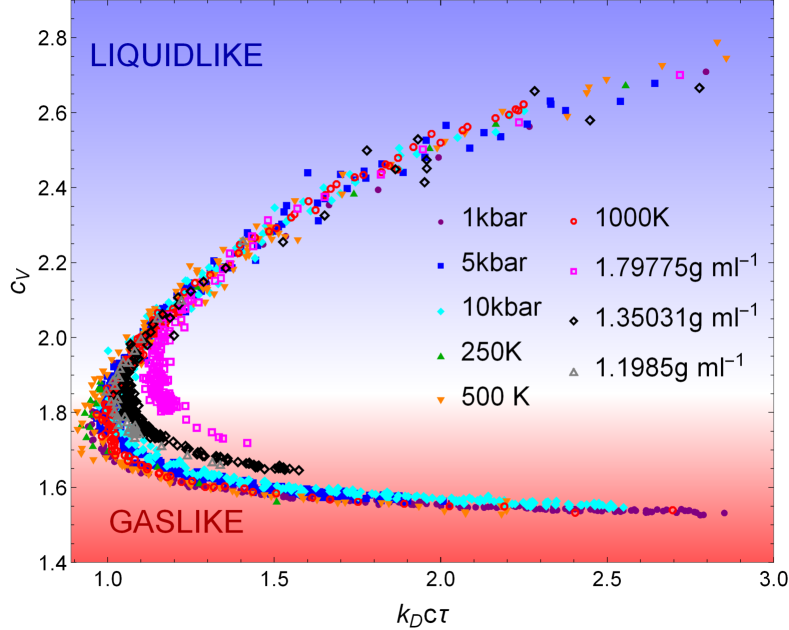
The key result of this work is visible in both scaling graphs in Figs. 6a and 7: the data collapse in either large or small-value range of ; the curves diverge from each other in the other range; and this divergence takes place near the key value .
As mentioned earlier, the dynamical VAF criterion of the Frenkel line corresponds to the disappearance of the oscillatory component of particle motion. In Fig. 8, we plot the line calculated using the VAF criterion, together with the “c”-transition line determined by (,) at the inversion point where in Fig. 6. We also plot the critical isochore for comparison. The Frenkel line from the VAF criterion and the inversion point are close and run parallel to each other. This serves as self-consistency check for our theory and implies that the inversion point can serve as a hallmark and a definition of the supercritical transition between the liquidlike and gaslike states at the FL. As mentioned earlier, the inversion point is unambiguously defined in Fig. 6 and does not depend on a theory such as that underlying the thermodynamic criterion and the dynamical VAF criterion.

We note that near the critical point, such as along the 100 bar isobar, the dynamical and thermodynamical properties are strongly affected by near-critical anomalies deben ; stanley , and the function is affected as a result. The function calculated along this path does not collapse onto the inversion point. On the other hand, our master curve in Fig. 6 is deeply supercritical and is therefore free of the near-critical anomalies.
The collapse of all curves up to the key value of about and divergence of curves along different paths beyond this value has two further implications. First, it suggests that the inversion point is a special point on the phase diagram. Second, if a thermodynamic property has a wide crossover, the behavior of different properties strongly depends on the path taken on the phase diagram. On the other hand, the observed collapse of all paths at the special inversion point close to and Å indicates either a sharp crossover or a dynamically driven phase transition related to the “c”-transition between liquidlike and gaslike states. By sharp we mean more abrupt that previous transitions observed over the FL (see, e.g., Ref. f1 ), possibly involving discontinuities in higher-order thermodynamic derivatives. Within the uncertainty set by fluctuations in our simulations, we do not observe an anomaly of in Fig. 2b at temperatures and pressures corresponding to the inversion point (our simulations put an upper boundary of about 0.05 on the value of a possible anomaly of ). This does not exclude a weak thermodynamic phase transition, similar to a percolation transition, or a higher-order phase transition seen in higher derivatives of thermodynamic functions.
In summary, we have discovered a universal, striking, and demonstrative inter-relation between dynamics and thermodynamics using the specific heat and the dynamical parameter of the fluid elasticity length, . This connection provides a clear and path-independent transition between liquidlike and gaslike supercritical states, which we call a “c”-transition. Our “c”-shaped master curve provides an unambiguous and path-independent criterion for the separation of liquidlike and gaslike states, calculated from accessible quantities in molecular dynamics simulations. The collapse onto this master curve occurs in the supercritical state up to and , meaning the transition, and the distinct states it separates, exist over a far larger range of temperatures and pressures than the boiling line which separates subcritical liquids and gases. The collapse is indicative of either a sharp crossover or a new phase transition operating in the supercritical state.
IV Acknowledgements
We are grateful to EPSRC and Queen Mary University of London for support and J. C. Dyre for discussions. This research utilized Queen Mary’s MidPlus computational facilities, supported by QMUL Research-IT.
References
- (1) L. D. Landau and E. M. Lifshitz, Statistical Physics (Pergamon Press, 1969).
- (2) E. Kiran, P. G. Debenedetti and C. J. Peters, Supercritical Fluids: Fundamentals and Applications (NATO Science Series E: Applied Sciences vol 366) (Boston: Kluwer, 2000).
- (3) National Institute of Standards and Technology database, see https://webbook.nist.gov/chemistry/fluid.
- (4) I.-C. Yeh and G. Hummer, J. Phys. Chem. 108, 15873-15879 (2004)
- (5) D. Frenkel and B. Smit, Understanding Molecular Simulation:From Algorithms to Applications, Academic Press, San Diego, San Francisco, (2001).
- (6) U. Balucani and M. Zoppi, Dynamics of the Liquid State, Clarendon, Oxford (1994).
- (7) R. Zwanzig and R. D. Mountain, J. Chem. Phys. 43, 4464 (1965).
- (8) Y. Zhang, A. Otani, E. J. Maginn, J. Chem. Theory Comput. 11, 3537 (2015).
- (9) K. Trachenko and V. V. Brazhkin, Science Adv. 6, eaba3747 (2020).
- (10) E. H. Abramson, High Press. Res. 31, 544-548 (2011).
- (11) I. H. Bell, R. Messerly, M. Thol, L. Costigliola and J. C. Dyre, J. Phys. Chem. B 123, 6345 (2019).
- (12) J. C. Maxwell, Philos. Trans. R. Soc. London 157, 49 (1867).
- (13) J. Frenkel, Kinetic Theory of Liquids, (New York: Dover, 1955).
- (14) K. Trachenko and V. V. Brazhkin, Rep. Prog. Phys. 79, 016502 (2016).
- (15) M. Baggioli, M. Vasin, V. V. Brazhkin and K. Trachenko, Physics Rep. 865, 1 (2020).
- (16) C. Yang, M. T. Dove, V. V. Brazhkin, K. Trachenko, Phys. Rev. Lett. 118, 215502 (2017).
- (17) B. Jakobsen, T. Hecksher, T. Christensen, N. Boye Olsen, J. C. Dyre, K. Niss, J. Chem. Phys. 136, 081102 (2012).
- (18) T. Iwashita, D. M. Nicholson, T. Egami, Phys. Rev. Lett. 110, 205504 (2013).
- (19) S. Chapman and T. G. Cowling, The mathematical theory of non-uniform gases (Cambridge University Press, 1990).
- (20) A. Zaccone, J. Phys.: Condens. Matter 32, 203001 (2020).
- (21) J. C. Dyre, Rev. Mod. Phys. 78, 953 (2006).
- (22) L. Brillouin, Tensors in Mechanics and Elasticity (Academic, New York, 1964).
- (23) C. Prescher, Y. D. Fomin, V. B. Prakapenka, J. Stefanski, K. Trachenko, V. V. Brazhkin, Phys. Rev. B 95, 134114 (2017).
- (24) D. Smith, M. A. Hakeem, P Parisiades, H. E. Maynard-Casely, D. Foster, D. Eden, D. J. Bull, A. R. L. Marshall, A. M. Adawi, R. Howie, A. Sapelkin, V. V. Brazhkin, J. E. Proctor, Phys. Rev. E 96, 052113 (2017).
- (25) J. Proctor, C. G. Pruteanu, I. Morrison, I. F. Crowe, and J. S. Loveday, J. Phys. Chem. Lett. 10, 6584 (2019).
- (26) J. Proctor, M. Bailey, I. Morrison, M. A. Hakeem, I. F. Crowe, J. Phys. Chem. B 122, 10172 (2018).
- (27) C. J. Cockrell, O. Dicks, L. Wang, K. Trachenko, A. K. Soper, V. V. Brazhkin, S. Marinakis, Phys. Rev. E 101, 052109 (2020).
- (28) L. Wang, C. Yang, M. T. Dove, Y. D. Fomin, V. V. Brazhkin, K. Trachenko, Phys. Rev. E. 95, 032116 (2017).
- (29) Y. Fomin et al, J. Phys.: Condens. Matt. 30, 134003 (2018).
- (30) S. Hosokawa et al, Phys. Rev. Lett. 102, 105502 (2009).
- (31) S. Hosokawa et al, J. Phys. Condens. Matt. 25, 112101 (2013).
- (32) S. Hosokawa et al, J. Phys. Condens. Matt. 27, 194104 (2015).
- (33) A. Jain and A. J. H. McGaughey, Phys. Rev. B 93, 081206 (2016).
- (34) B. Rufflé, G. Guimbretieŕe, E. Courtens, R. Vacher and G. Monaco, Phys. Rev. Lett. 96, 045502 (2006).
- (35) J. Proctor, Physics of Fluids, 32, 107105 (2020).
- (36) L. Xu et al, PNAS 102, 16558 (2005).
- (37) V. V. Brazhkin, Yu. D. Fomin, A. G. Lyapin, V. N. Ryzhov, E. N. Tsiok and K. Trachenko, Phys. Rev. Lett. 111, 145901 (2013).