Four decades of advances from MSDP to S4I and SLED imaging spectrometers
keywords:
instrumentation; imaging spectroscopy; polarimetry; chromosphere; prominence; corona1 Introduction
S-Introduction
The study of active phenomena in the solar atmosphere, including sunspots, filaments, prominences, flares or Coronal Mass Ejections (CME) require high precision measurements of MHD parameters as velocities and magnetic fields at various altitudes. In many cases, a large field of view (FOV) and a high temporal resolution are necessary to investigate dynamic events. Most instruments use either tunable filters (Lyot or Fabry-Pérot) or thin slit spectrographs, or both, such as the Solar Optical Telescope (SOT) onboard Hinode (Tsuneta et al., 2008). Until 2016, the SOT/NFI filter allowed the scanning of line profiles (with only a few points), which in combination with polarimetry (FeI 6302 Å, NaI D1 5896 Å, MgI b1 6173 Å) provided the evolution of the line of sight (LOS) magnetic field. The SOT spectro-polarimeter (SP) records the full Stokes parameters at high spectral resolution (30 mÅ) to measure photospheric vector magnetic fields in FeI 6301/6302 Å, at low cadence because the slit must scan the solar surface. The Helioseismic and Magnetic Imager (HMI, Scherrer et al. (2012)) onboard Solar Dynamics Observatory (SDO) scans the FeI 6173 Å line with five points, in order to produce high cadence Dopplergrams and LOS magnetograms of the photosphere. The Interface Region Imaging Spectrograph (IRIS, De Pontieu et al. (2014)) provides profiles of MgII h and k chromospheric lines. Space-borne instruments are well suited for line scans by tunable filters (no seeing effects); adaptive optics is necessary for ground based telescopes, although residual effects may affect the profiles.
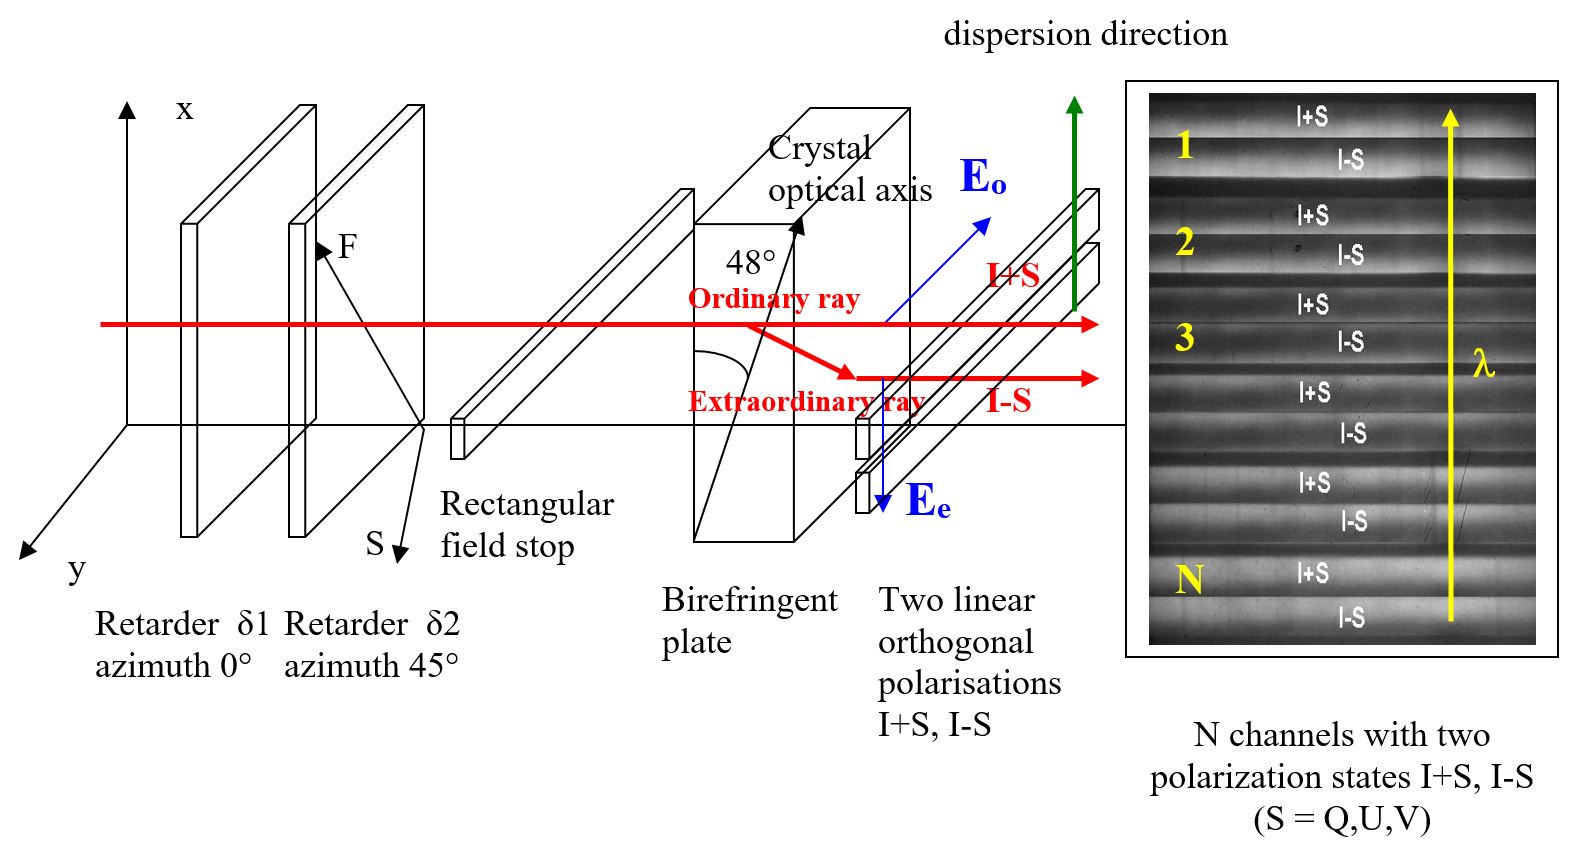
The principle of the MSDP technique (developed by P. Mein since 1977) is the following: light from a 2D window is dispersed by a first pass in the spectrograph; a beam splitter-shifter selects N channels in the spectrum, and a second pass on the grating subtracts the dispersion in order to form N spectra-images. They are not monochromatic, because wavelength varies linearly in the x-direction inside each channel, and by constant step between two consecutive channels. It has the advantages of both filters (2D FOV and time resolution) and spectroscopy (high spectral resolution). As the slit is replaced by a rectangular window, spatial smoothing does not exist. The MSDP provides data cubes (x, y, ) where points along the three coordinates are strictly simultaneous. It delivers a large FOV at high spatial resolution and fast cadence observations; this favours dynamic studies and magnetic field measurements (with polarimetry) using broad chromospheric lines, and now weaker photospheric lines with S4I. It is fully compatible with adaptive optics and allows short exposure times. Doppler shifts and LOS magnetic fields can be easily obtained at several altitudes using the bisector method in line core and wings (as the core forms higher), but more sophisticated inversion techniques have also been applied to full line profiles.
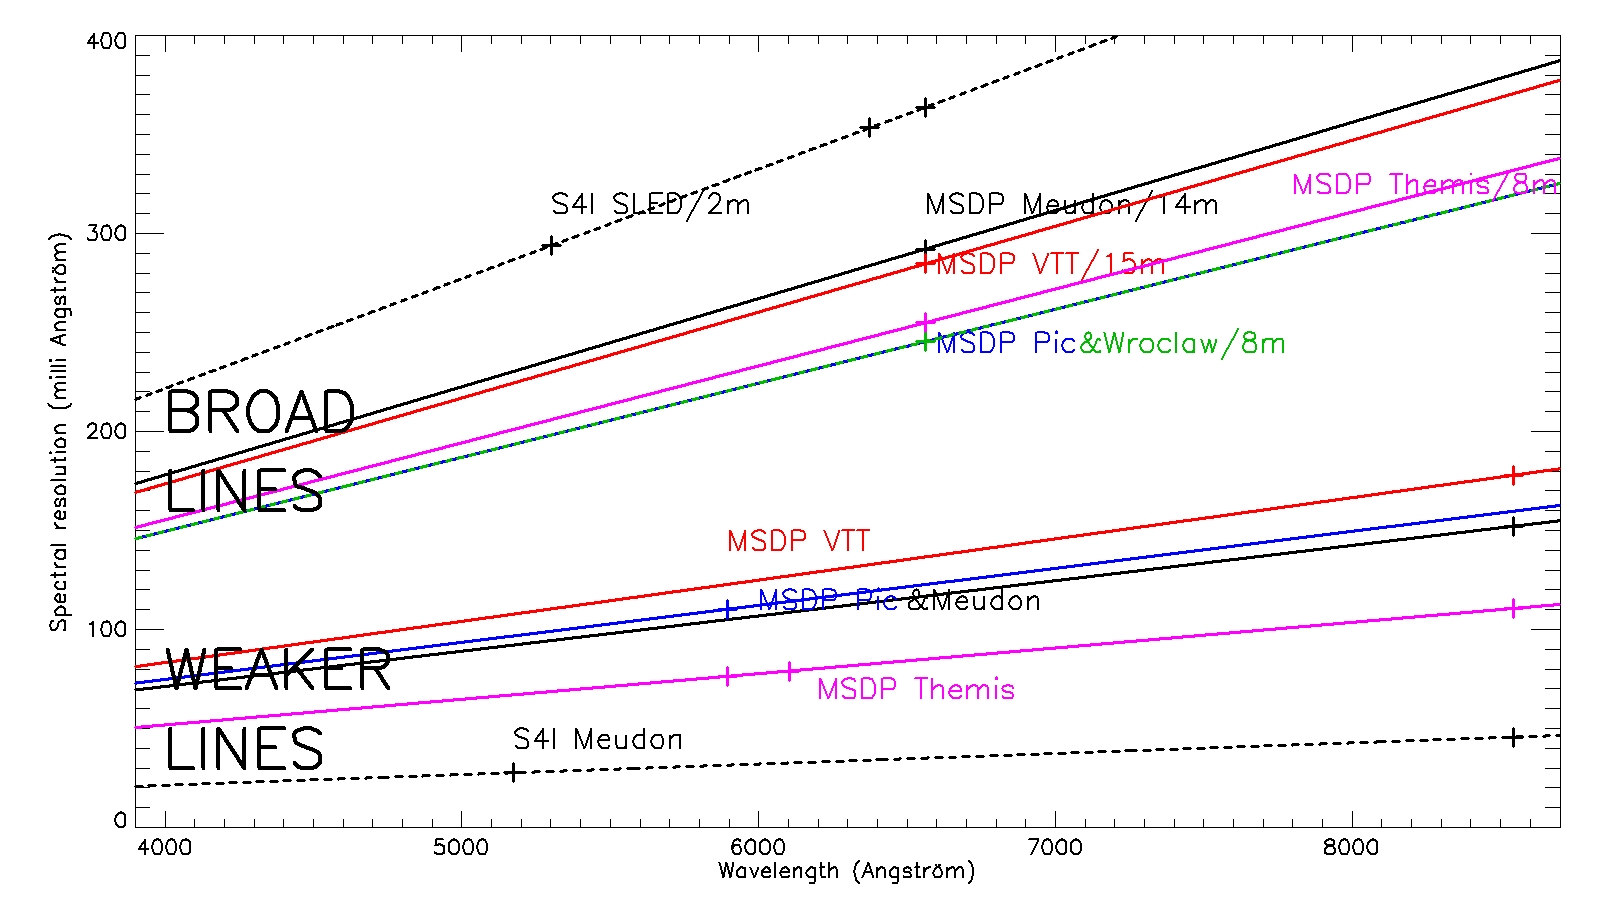
The first MSDP instruments used prism-based beam-shifters (Meudon, Pic du Midi, Wrocław, VTT, THEMIS) and three subsequent generations of instruments were produced with increasing performances (spectral resolution from 300 mÅ down to 80 mÅ). Our lastest generation beam-shifter (S4I) is now mirror-based in order to improve the spectral resolution for photospheric lines (34 mÅ) and the number of channels for a better compromise between spectral and FOV coverage.
Section 2 presents the historical background summarizing the evolutions of previous MSDP spectrographs with prism beam-shifters. In Section 3 we describe the S4I instrument using new generation mirror slicers and associated polarimetric developments, together with some preliminary results. Section 4 presents the derived compact version designed for coronal forbidden lines (SLED). In Section 5, we give, in the case of large telescopes, a short comparison between new generation MSDP proposed for the European Solar Telescope (EST) and instruments of the Daniel K. Inouye Solar Telescope (DKIST). Section 6 is devoted to the discussion and conclusions. A full MSDP bibliography is provided as on-line supplement material.
2 Historical Background of MSDP Spectrographs
S-Historical-Context
2.1 Meudon Solar Tower: fast imaging spectroscopy of broad lines (H)
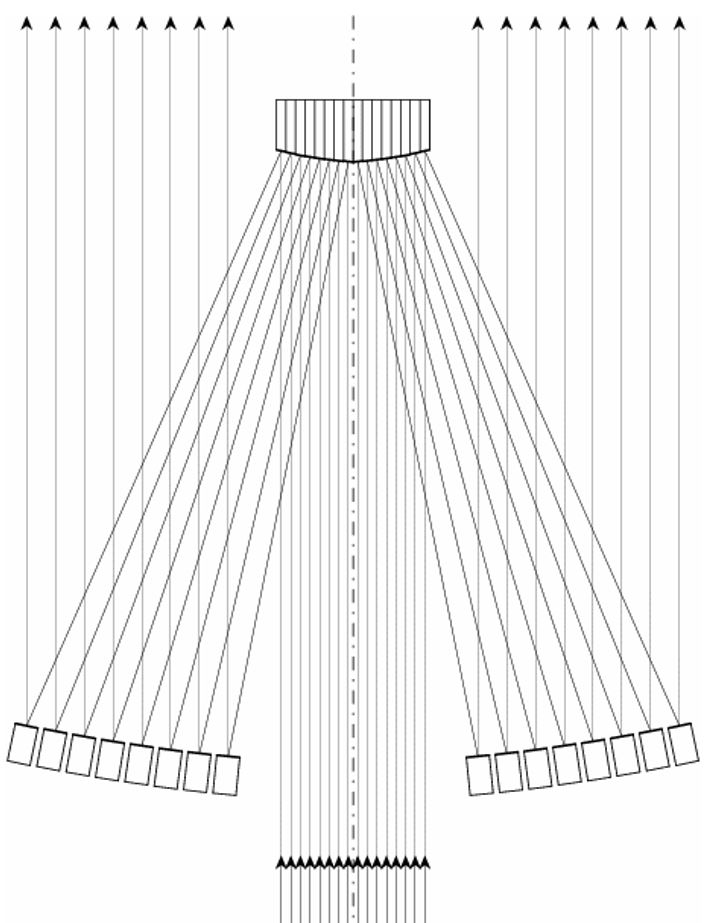
The first MSDP was installed in the Meudon Solar Tower (Mein, 1977). At the telescope focus, a rectangular window (length and width in the dispersion direction) replaces the usual slit. After the first pass in the spectrograph (14 m focal length), slits select wavelengths for each solar point, creating images after the subtractive second pass. The step between two slits is equal to 2.5 mm, leading to the spectral resolution close to 0.30 Å for the H line, where (mm/Å) is the dispersion (Figure \irefprincipe).
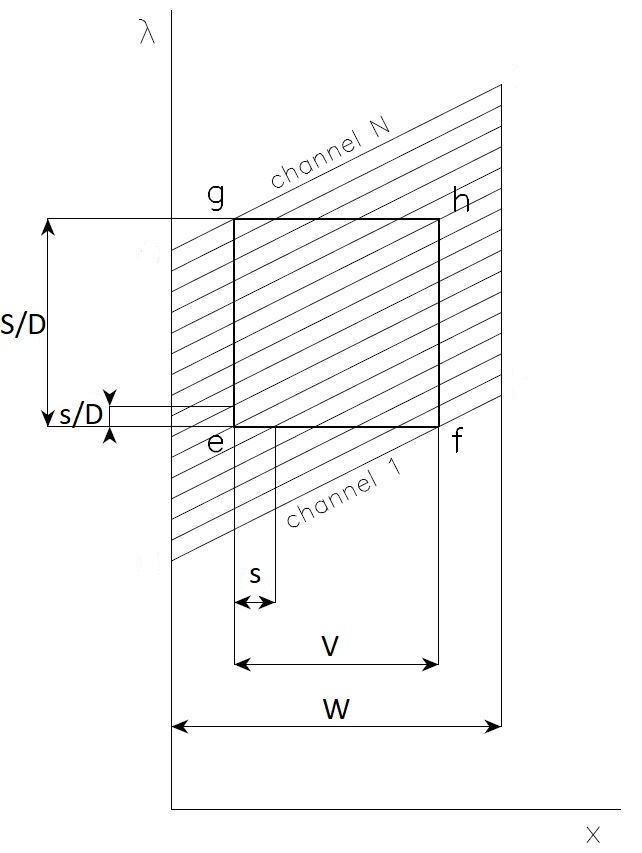
Behind the slits, prisms shift the beams without focus modification, in order to produce spatial distances between output channels larger than the width of the entrance window = 6 mm (Figure \irefboitesa and Table 2). The number of channels, initially 7, became = 9 in a 1979 version of the instrument. The total width of the multiple slit is .
We now determine the maximum spectral range that can be recorded across the full width of the window (Mein, 1991). The intervals between slits can be divided into two parts and (rectangle “efgh” in Figure \irefprincipe), corresponding respectively to the spectral range (Å) and to the width of the FOV (in the dispersion direction), so that:
To get a field of view equal to or larger than we need:
= 6 mm / 2.5 mm = 2.4
With = 3, we obtain = 5 and = 2.5 5 = 12.5 mm corresponding to 0.30 5 = 1.50 Å (or 0.75 Å from line centre) for H profiles.
When CCD detectors replaced photographic films, it was easy to record about 120 pixels in the width of each channel. Taking into account the Meudon seeing, it was reasonable to use only 2 pixels per arcsec, and to place two lenses before the spectrograph entrance to reduce the telescope focal length from 45 m to 22.5 m (Table 2) leading to a 54′′ field of view in the x-direction. At the same time, a rotating system of prisms was used in front of the entrance window to produce directly a scan of 5 successive images (Mein, 2008). The total resulting FOV size is 270′′ in the dispersion direction (x). In the perpendicular direction (y), the value of 440′′ corresponds to a 50 mm length for the entrance window.
As shown in Table 2, the scanning system can repeat scans of 270′′ 440′′ FOV with a 30 s period. This is a very fast cadence for spectroscopy and explains the high number of coordinated campaigns which were organized between the Meudon MSDP and radio-astronomy instruments or space solar probes. The immediate availability of the Solar Tower for solar astronomers working in Meudon was also clearly a major component of the success.
Fast imaging spectroscopy of H is very well adapted to dynamical chromospheric structures. Many publications were devoted to oscillations of quiescent filaments (Malherbe, Schmieder, and Mein, 1981) and chromospheric ejections connected with Type III radio bursts (Mein and Avignon (1985), Chiuderi-Drago, Mein, and Pick (1986)). Differential cloud models were introduced to analyse the velocity fields of chromospheric ejecta (Mein and Mein, 1988).
Coordinated observing campaigns, starting with the Nançay Radio Heliograph, became increasingly frequent due to the space-borne telescopes launched between 1980 and 2020. Some examples of topics and publications resulting from these campaigns include:
-
•
Solar Maximum Mission/UVSP spectrometer: dynamics of filaments (Malherbe et al., 1987)
-
•
GOES, Yohkoh/SXT: surges and soft X-rays (Schmieder et al., 1995)
-
•
SOHO/SUMER and CDS UV spectrometers, SOHO/EIT (EUV imagery): dynamics of a slow “disparition brusque” of a filament (Schmieder et al., 2000)
-
•
TRACE (high resolution EUV imagery), SOHO/EIT: Magnetic helicity in emerging flux and flare (Chandra et al., 2009)
-
•
Hinode/SOT, SOHO/SUMER spectrometers: 2D model of a prominence (Berlicki et al., 2011)
-
•
SOHO/SUMER: dynamics of prominence fine structures (Gunár et al., 2012)
- •
-
•
IRIS (UV spectrometer): dynamics of a quiescent prominence (Ruan et al., 2018)
-
•
IRIS, SDO/AIA: bidirectional reconnection outflows (Ruan et al., 2019)
More references can be found in the full bibliography (supplement on line material).
2.2 Pic du Midi Jean Rösch Telescope: higher spatial and spectral resolutions, polarimetry
The high quality of the seeing at the Pic du Midi Observatory is well known. A second MSDP was installed in the 8 m spectrograph that Z. Mouradian attached to the J. Rösch telescope in the Turret Dome of Pic du Midi (Mein (1980), Mein et al. (1989)). Two beam-shifters were included, mainly for lines such as H and Na D1, with 11 channels, respective slit steps 1.2 mm and 0.6 mm and slit widths 0.8 mm and 0.3 mm (Table 2).
The Na D1 line allowed the observation of dynamical photospheric fine structures. Roudier et al. (2003) reached the 0.3′′ resolution for photospheric granulation, close to the theoretical limit of the 50 cm telescope aperture. A similar spatial resolution was obtained for circular polarization (Malherbe et al. (2004), Roudier et al. (2006)). Strong longitudinal magnetic fields could be associated with downward velocities. Spectro-polarimetry with liquid crystals (Malherbe et al., 2007) was used with high speed modulation between I+V and I-V signals together with a fast detector, running in burst mode and allowing image selection.
The H line was also observed in arch filament systems (Alissandrakis, Tsiropoula, and Mein, 1990). Physical parameters of the plasma were derived from a cloud model. Black and white mottles were also investigated with non-local thermodynamic equilibrium (NLTE) and cloud models with non-uniform source functions (Heinzel and Schmieder (1994), Tsiropoula, Madi, and Schmieder (1999)).
Coordinated observing campaigns were organized with:
2.3 Tenerife German Vacuum Tower Telescope: two possible simultaneaous lines
Thanks to J.P. Mehltretter from the Kiepenheuer Institute in Freiburg, we were able to attach a new MSDP to the 15 m spectrograph of the German Vacuum Tower Telescope (VTT) in Tenerife (Mein, 1991). Two prism beam-shifters with 9 and 11 channels (steps 2.5 mm and 0.6 mm) could be installed at the first focus of the spectrograph, to record simultaneously two spectral lines, for example H and CaII 8542 Å (Figure \irefboitesb). A cloud model with variable source function was used to analyze the dynamics of H arch filament systems (Figure \irefafs) reported by Mein et al. (1996). Umbral flashes of sunspots and running penumbral waves were observed simultaneously in both lines (Tziotziou et al., 2006).
Coordinated campaigns were organized with:
-
•
SOHO/MDI: 3-D magnetic support of prominences (Aulanier et al., 1998)
-
•
TRACE, THEMIS/MSDP: Hydrogen density in emerging flux loops (Mein et al., 2001)
-
•
TRACE, SVST (Swedish Vacuum Solar Telescope): Filament activation and magnetic reconnection (Deng et al., 2002)
-
•
SOHO/CDS and SUMER spectrometers: 3D structure of an EUV filament (Schwartz et al., 2004)
-
•
TRACE: Magnetic changes in formation of filaments (Schmieder et al., 2004)
-
•
SOHO/SUMER: Magnetic field orientation in a prominence (Schmieder et al., 2007)
2.4 Białków Large Coronagraph: high time resolution and 3D models
Within the framework of the French-Polish scientific cooperation, the first MSDP, which was installed initially in the Meudon Solar Tower (Mein, 1977), was relocated in 1993 to the Białków Observatory of the University of Wrocław, Poland (Rompolt et al., 1994). The MSDP was installed in the Coudé focus of the Large Coronagraph (Gnevyshev, Nikolsky, and Sazanov, 1967), a classical Lyot-type open-frame instrument having a 50.5 cm diameter main objective aperture and nearly 14.5 m effective focal length, replacing an original horizontal spectrograph of the Large Coronagraph, but utilizing its massive substructure as well as the collimator and camera mirrors. This instrument is mainly used for prominence and chromospheric observations as the observatory altitude is too low to observe the corona. If necessary, the entrance window of the MSDP can be also fed by the 15 cm Horizontal Telescope equipped with a 30 cm Jensch-type coelostat. The effective time resolution of the collected data is up to 30 MSDP images per second without spatial scanning; it takes about 23 s for a telescope scan of 15 adjacent spectra-images covering a large FOV (300′′ 500′′), as shown by Figure \irefsurge.
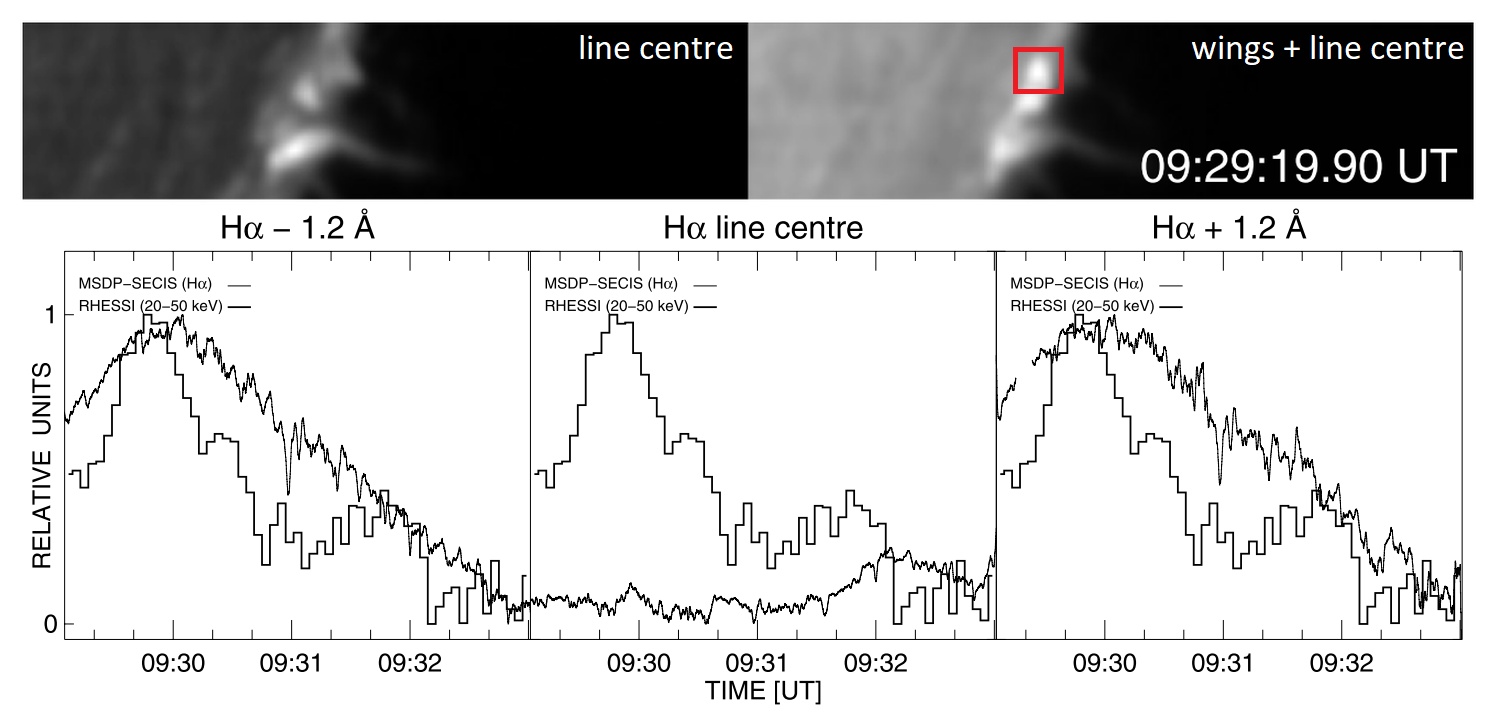
Various solar phenomena were observed in Białków. Fast changes of H emission in solar flares, correlated in time with variations in hard X-ray fluxes, were investigated by Radziszewski, Rudawy, and Phillips (2007) using high time resolution (0.04-0.075 s) MSDP observations of H bright flaring kernels. These authors reported very high correlations between variations of the X-ray flux and H emission from the selected bright flaring kernels (Figure \irefker). The calculated precipitation depths of the non-thermal electrons in the solar flares were validated using MSDP observations of fast variations of the H line profiles in flaring kernels (Falewicz et al., 2017). Three-dimensional trajectories of prominence knots were measured using data collected in the H line with a single telescope and without any assumption concerning the shape of the trajectories or the mass motion (Zapiór and Rudawy, 2010). Applying restored 3D trajectories of the plasma blobs, solar prominence magnetic fields were also estimated (Zapiór and Rudawy, 2012). The evolution and structure of numerous active regions and solar flares were also studied (Rudawy et al. (2001), Mandrini et al. (2002), Rudawy et al. (2002)).
2.5 Tenerife THEMIS telescope: two simultaneous lines, higher spectral resolution and vector magnetic field measurements
When the optical pattern of the THEMIS telescope was prepared by Jean Rayrole, he decided to include a large predisperser in the 8 m double spectrograph, in order to be able to select many lines simultaneously for detailed studies of the photospheric magnetic field. The Meudon group took this opportunity to use the predisperser as a first pass on the grating, and the main spectrograph as a second pass. Simultaneous observations with two lines became much easier, and in addition scattered light effects were strongly reduced. Several prism beam-shifters were built, with slit steps of 1.2 mm (broader lines) and 0.4 mm (weaker lines). Figure \irefboitesc shows the structure of the latter with 16 channels and 0.4 mm step. It provided a spectral resolution of around 80 mÅ for polarimetry with the CaI 6103 Å line (Mein, 2002). If (I, Q, U, V) is the Stokes vector, IS signals were observed simultaneously with S = Q, U, V alternately. As the separation (provided by the calcite analyser) between I+S and I-S was along the y-direction (orthogonal to the dispersion), it was necessary to use grid masking, so that the FOV was covered by a 3 or 4 step scan along y-direction. The beam exchange technique was available for deep polarimetry programmes.
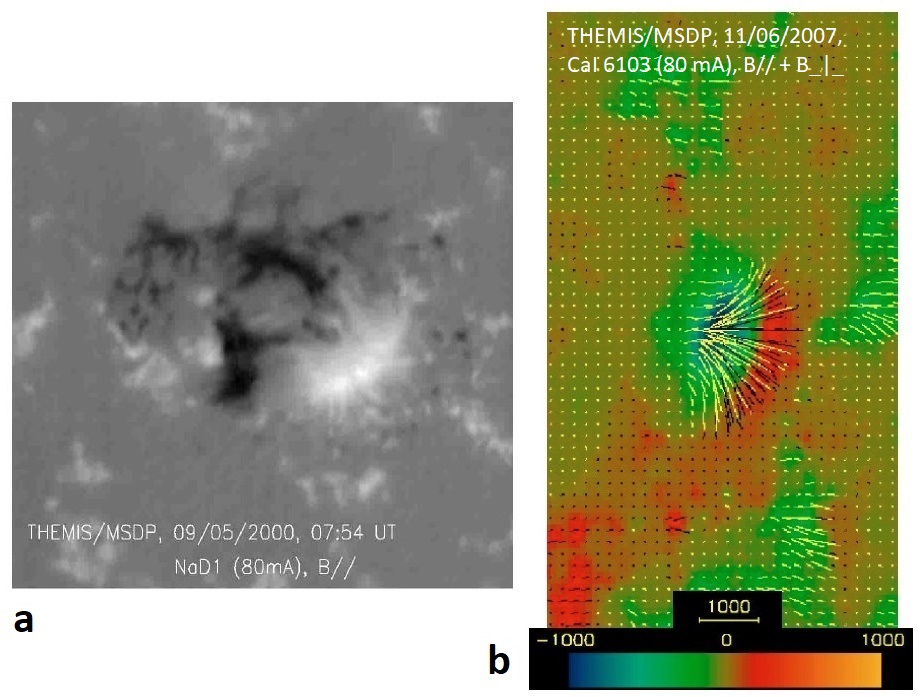
Sunspot oscillations were investigated with the CaII 8542 Å line (Tziotziou, Tsiropoula, and Mein, 2002). The vertical structure of spots, and the magnetic models of flux tubes, were examined with the NaI D1 line using two beam Stokes polarimetry with grid masking (LOS magnetic field, Figure \irefthemisa, Eibe et al. (2002), Mein et al. (2007)). Spectro-polarimetric observations were performed for fine structures of a filament in H, CaII 8542 Å and NaI D2 5890 Å (Zong et al., 2003). Fast vector magnetic maps (Figure \irefthemisb) have been obtained with CaI 6103 Å line (Mein, Mein, and Bommier, 2009).
Coordinated observations have been performed with:
3 The Spectral Sampling with Slicer for Solar Instrumentation (S4I)
S-S4I
3.1 The new slicer
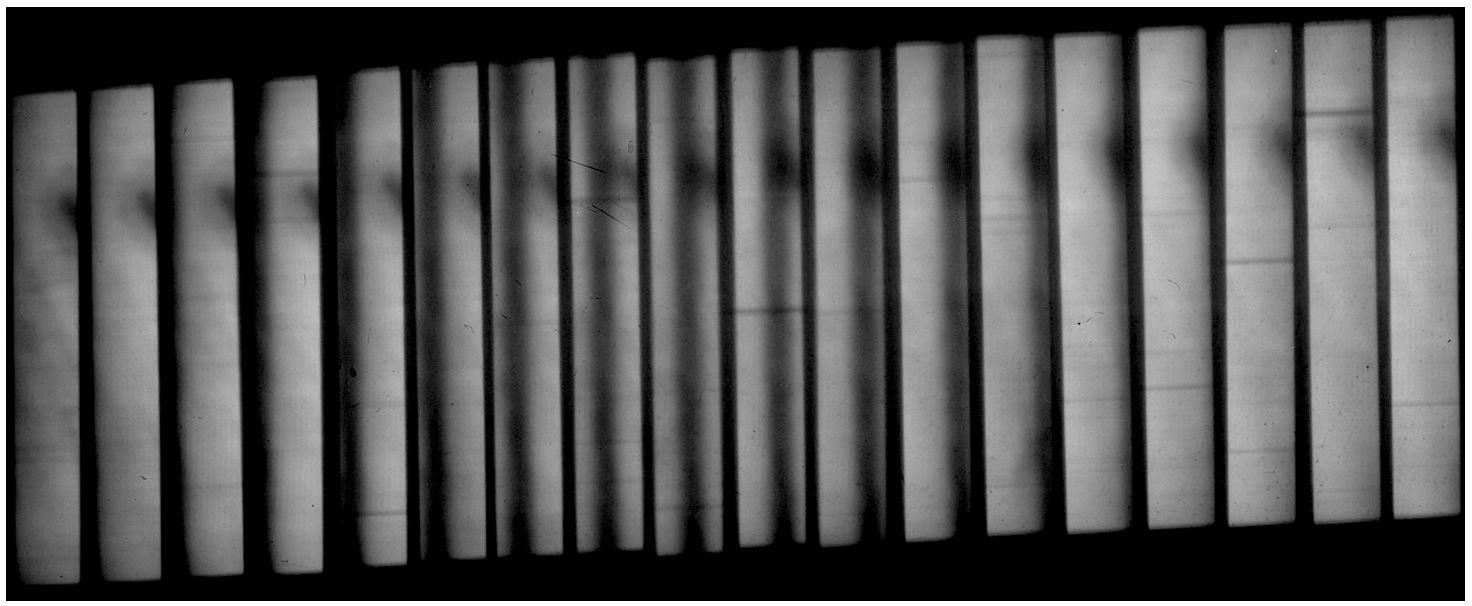
S4I is a prototype new slicer (Figure \irefslicer) incorporated into the 14 m spectrograph of the Meudon Solar Tower (Figure \irefS4Ileg). By contrast with previous devices using prisms, S4I is based on micro-mirrors. This new concept (Sayède et al., 2014) provides an improvement in the spectral sampling (34 mÅ) and the number of channels (18 at present, but easily expandable to 30 or more) for a better compromise between spectral () and spatial coverage (, see Figure \irefprincipe). S4I is designed for observations of broad chromospheric lines as well as weaker photospheric lines (Table 2). Figure \irefobser shows a typical raw S4I image. The 18 channels are co-spatial, but are not monochromatic, as wavelength varies linearly from the left to the right border (the x-direction of Figure \irefprincipe). The wavelength shift between two adjacent channels is constant. It corresponds to the spectral resolution (34 mÅ) and translates step by step the spectral line in x-direction. The elementary FOV is 15′′ 200′′. A scanning device (prismatic translator) allows the observation of a 20 times larger FOV (300′′ 200′′) with 25 adjacent images obtained in sequence (12′′ step). Using a slow scanner and an old CCD camera (0.5 frame/s) available at Meudon, the temporal resolution was only 160 s, but would be 10 times faster with modern sCMOS sensors and an optimized surface translator. The camera of the prototype samples data with a hardware resolution of 0.25′′, but S4I is fully compatible with high spatial resolution telescopes and adaptive optics.
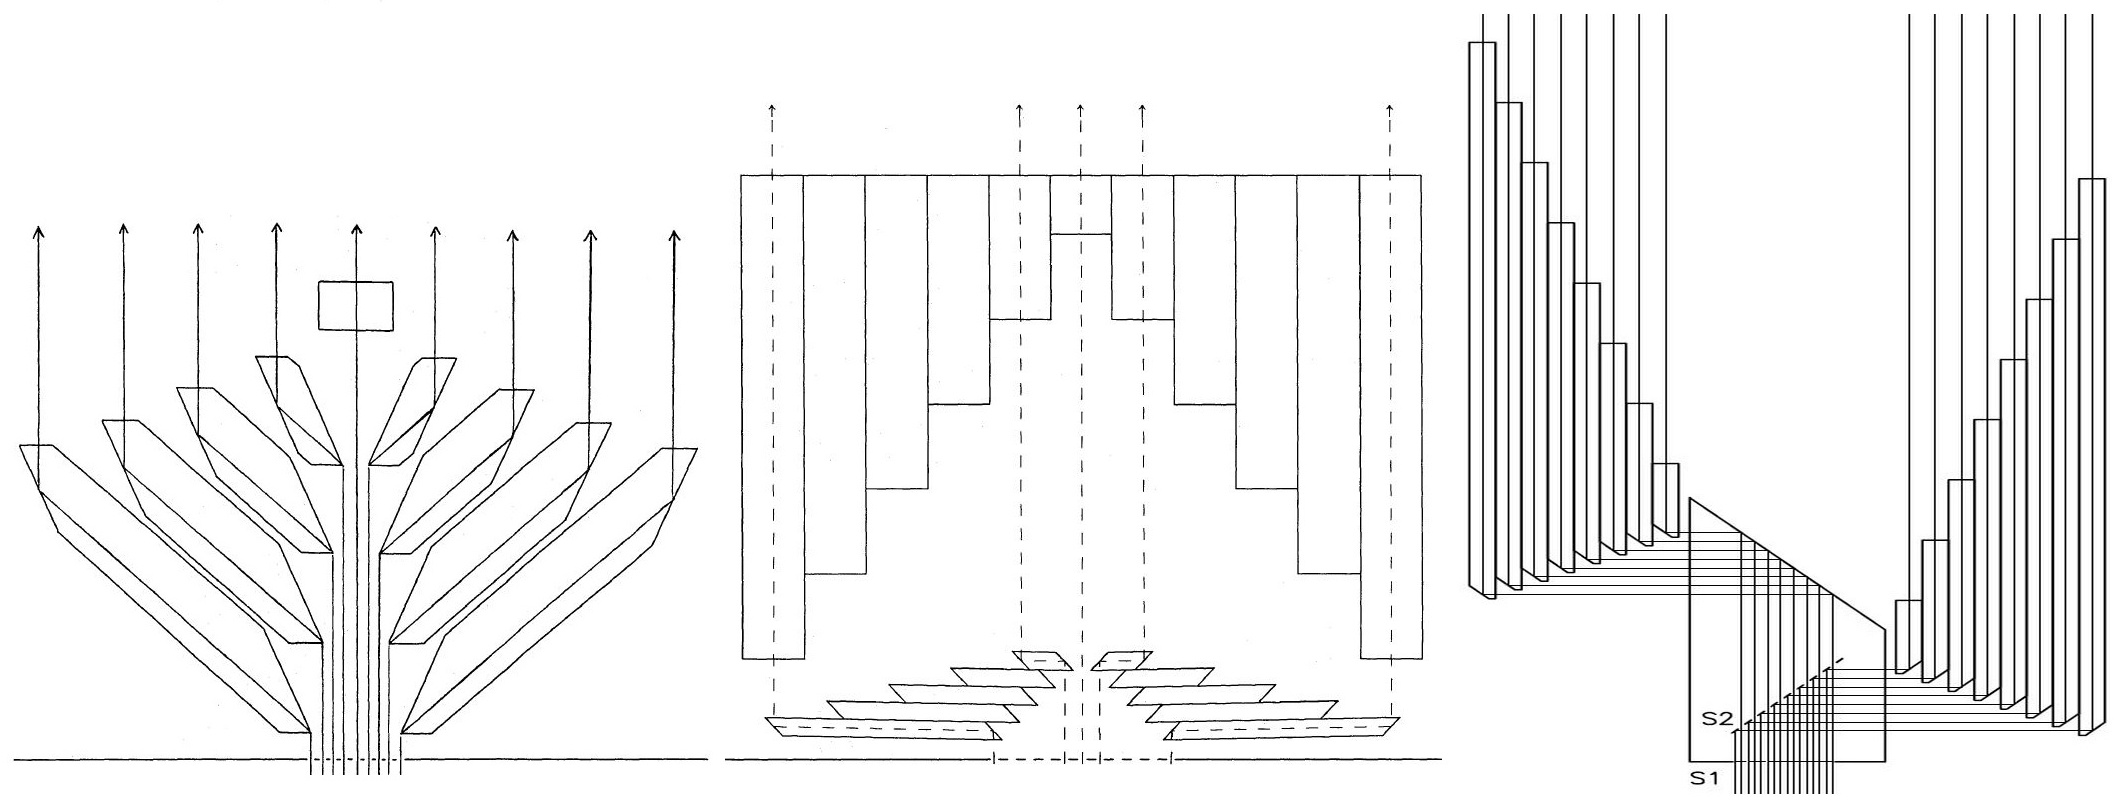
The slicer is the core of the new MSDP and is composed of two parts:
-
•
N micro-mirrors acting as a multi-slit beam-splitter to select 2D channels in the focal plane of the spectrograph after the first pass on the grating. These N mirrors can be manufactured on a single substrate.
-
•
N associated larger mirrors acting as a beam-shifter to form N spectra-images after subtraction of the dispersion by the second pass on the grating. These mirrors can be adjusted individually.
This new design provides a gain of a factor two in photon flux in comparison to prism beam-shifters. S4I is also compatible with larger aperture beams than previous image slicers (F/30 instead F/60) and can now be integrated into compact and large FOV spectrographs such as the SLED (see next section).
3.2 New polarimetry with S4I
A new method for polarimetric analysis was developed and optimized for S4I (Figure \irefpolar). The prototype polarimeter is located in the image plane of the telescope. Two light beams are produced by a calcite polarising beam-splitter (acting in the x-dispersion direction), which provides two cospatial, simultaneous, and orthogonally polarized sub-channels. These sub-channels are obtained by reducing the width of the entrance field stop from 15′′ to 7.5′′. It is a fast method which has the advantage of suppressing the y-scan (THEMIS polarimeter) and consequently distorsion in the y-direction due to varying seeing. For Stokes V analysis, a single retarder () is used, while for Stokes Q, U, V analysis, two plates of retardance and are necessary. The retarders are liquid crystals (manufactured by Meadowlark Optics Inc.) which are precisely adjusted to the wavelength of observations. The two signals:
-
•
-
•
are observed simultaneously. For instance, are obtained with , ; while beam exchange is easy with variable retarders, are provided by , . Combining beam exchange measurements may improve the polarimetric accuracy, in the event of stable seeing. Stokes V was observed using this method at Meudon, where U and Q are not reachable due to instrumental polarization.
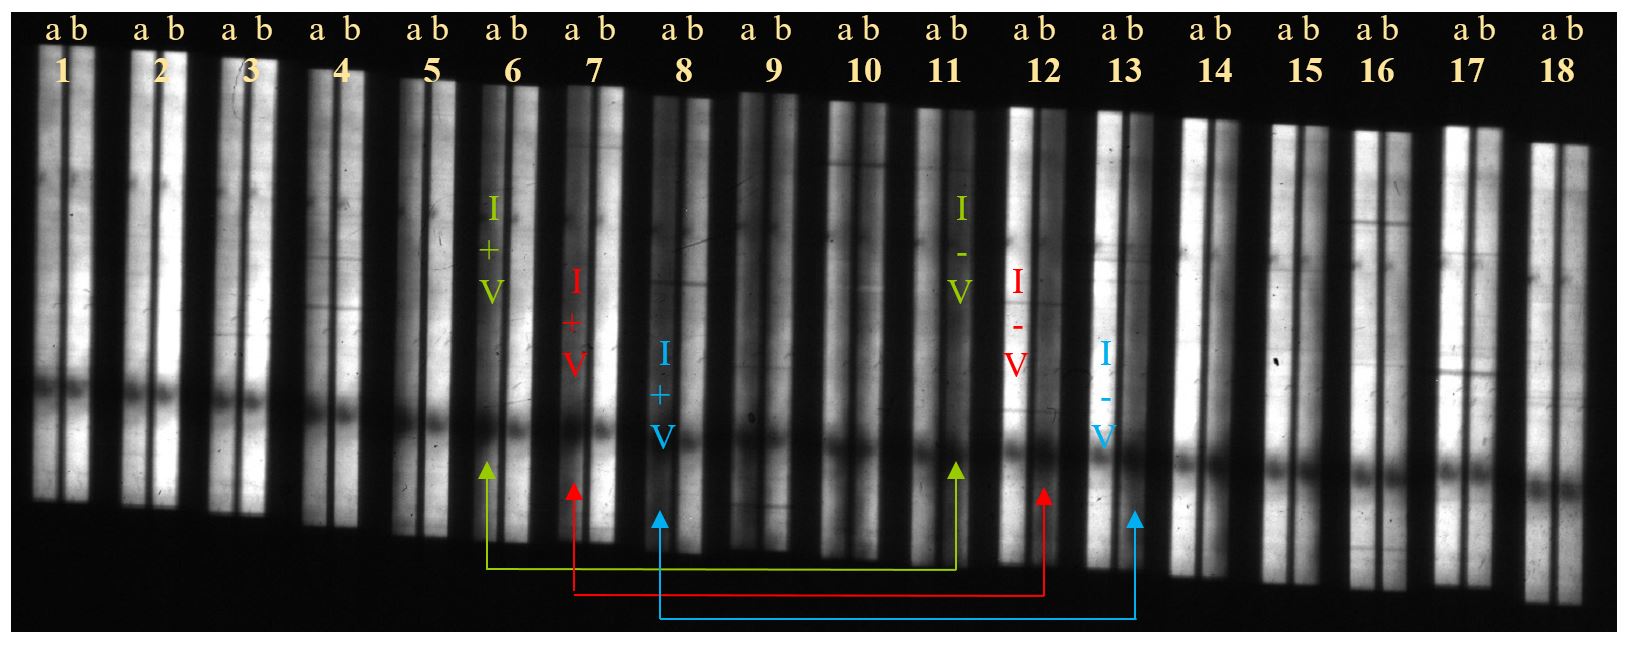
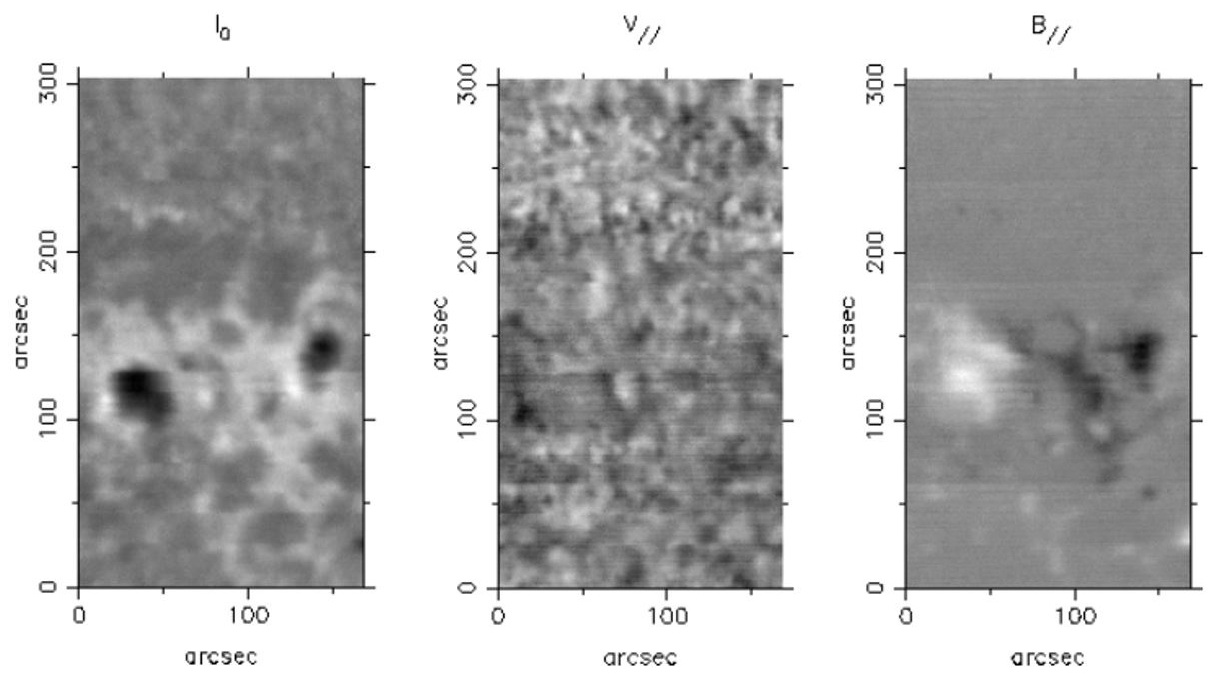
Polarimetric observations (Stokes V only) were tested at Meudon with Mgi 5173 Å line (Figure \irefimage and movie provided as supplementary material). The raw image includes 18 channels, each composed of two sub-channels (a, b); as wavelength varies along each channel in the dispersion direction, the right sub-channel (I-V) does not have the same wavelength as the left sub-channel (I+V), so that (I+V) and (I-V) at the same wavelengths appear in different channels (indicated by arrows). For instance, (I+V) of channel 6 corresponds to (I-V) of channel 11. Hence, the usable number of wavelengths to cover the spectral line is reduced from 18 to 13. For each pixel of the FOV, we derive, from line profile reconstruction, intensities, Doppler shifts (the sum of (I+V) and (I-V) shifts with respect to the quiet sun) and the LOS magnetic field (the difference between (I+V) and (I-V) shifts). Preliminary results are displayed in Figure \irefresults. A total of 50 successive images (taken at 6′′ steps) are necessary to cover the final 170′′ 300′′ FOV; it takes 320 s with the old Meudon scanning device and camera, but would be 10 times faster with modern hardware.
4 The SLED
S-SCD
The Solar Line Emission Dopplerometer (SLED) is a new instrument being developed by the Paris and Wrocław observatories plus Queen’s University Belfast. It is a compact version (2.0 m focal length, roughly five times shorter than predecessors) derived from S4I for fast imaging spectroscopy of broad emission lines of the hot corona, such as the iron forbidden lines FeXIV 5302 Å (T 1.6 K, “green” line) and FeX 6374 Å (T 1.2 K, “red” line). The green line emission dominates at temperatures above 1.3 K.
Monochromatic images in the green or red lines through interference filters are recorded frequently by coronagraphs or during total eclipse campaigns. The Wrocław and UK groups have organized several expeditions with the Solar Eclipse Coronal Imaging System SECIS (Phillips et al., 2000), with a pair of fast CCD cameras working at 70 frames/s. These lines have been also investigated by spectroscopic means (Singh et al., 1999) and low cadence spectroheliograms have been obtained (Singh et al., 2003). However, to our knowledge, the SLED will be the first instrument for fast imaging spectroscopy dedicated to the green and red coronal lines. Its scientific goal is to observe, through the Doppler effect, the dynamics of hot loops, oscillations and mass motions in the low corona at high temporal resolution. The SLED will search for high-frequency wave-like variations of plasma velocities in active region loops, which could be involved in coronal heating. In particular, high-frequency waves (a few Hz) are suspected by theory (Porter, Klimchuk, and Sturrock, 1994) to dissipate readily at typical coronal densities; the energy conveyed may (if the magnetic fields are moderate) balance the energy losses of the corona. Rudawy et al. (2004) and Rudawy et al. (2010) found, using SECIS images, slight evidence of intensity oscillatory power in the range 0.05-1 Hz; the SLED will produce fast cadence Dopplergrams to search for the signature of high frequency (up to 10 Hz) wave-like motions in the corona.
The SLED is fully complementary with the Atmospheric Imaging Assembly (AIA) onboard SDO, which provides continuously monochromatic images from 80000 K to 10 million K in the EUV range (94 - 335 Å) at 45 s cadence.
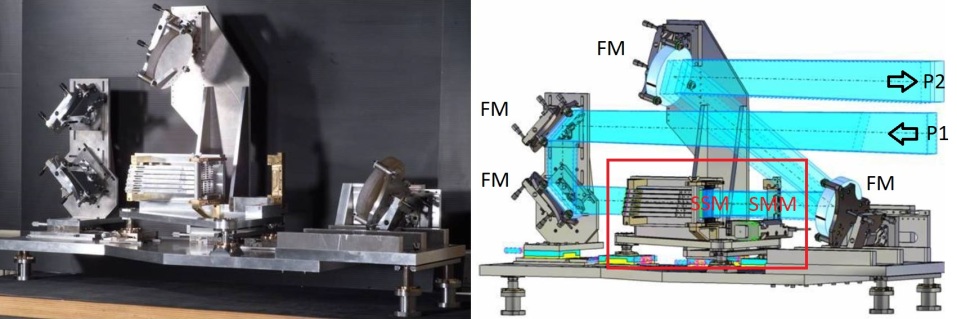
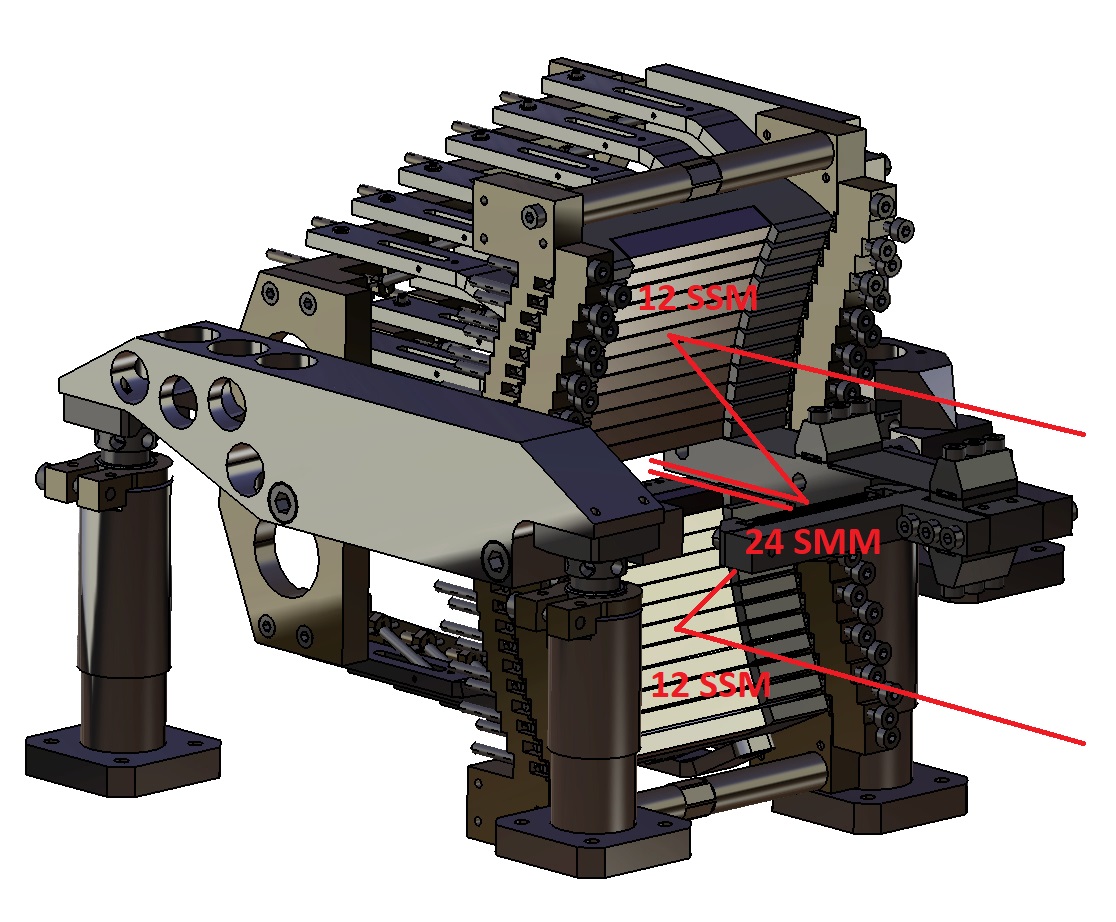
The slicer of the SLED (24 channels, Figure \irefslicerSCD and schematic view of Figure \irefslicer) accepts beams at F/30 and is now compatible with various existing telescopes. Hence, it is envisaged to become a permanent instrument for the large Białków coronagraph (prominence observations) or another high-altitude coronagraph, such as the Lomnicky Solar Observatory (LSO) coronagraph (for hot lines), but it will also be used for future total eclipse campaigns, as it is fully portable. The SLED will be fed at F/30, at least by:
-
•
the 3.0 m focal length / 0.15 m aperture telescope (4.50 m equivalent length with Barlow 1.5 ) for eclipse missions and heliostat, providing a 200′′ 1220′′ FOV with 2.8′′ pixel sampling
-
•
the 3.0 m focal length / 0.2 m aperture coronagraph (6.0 m equivalent length with Barlow 2.0 ) of the high altitude LSO, for coronal observations (hot plasma), 150′′ 1000′′ FOV with 2.1′′ pixel sampling
-
•
the 14.5 m focal length coronagraph (0.50 m aperture) at Białków providing a 70′′ 220′′ FOV (possibly larger with focus and entrance pupil reduction), for prominence observations (cold plasma)
The optical concept of SLED is shown in figure \irefdesign and the main characteristics are summarized in Table 2 for observations of the hot corona. The spectral resolution (0.28-0.34 Å) and spectral coverage (24 channels, up to 6 Å) is adapted to coronal line widths (typically 0.9 Å) and possibly high Doppler shifts (50 km s-1 1 Å). The large FOV (150′′ 1000′′ with the LSO telescope, or more with the eclipse instrument) is compatible with the size of coronal structures ( km or more). Its expected cadence is in the range 10-30 frames/s with a fast sCMOS detector (depending on exposure time). The slicer is built by Paris observatory; the spectrograph design, prepared in Paris, will be assembled and tested by Wrocław in the coming few years.
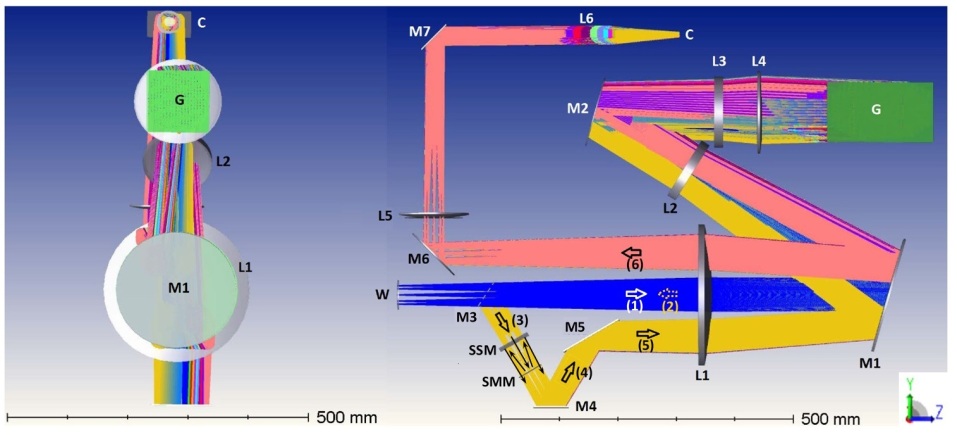
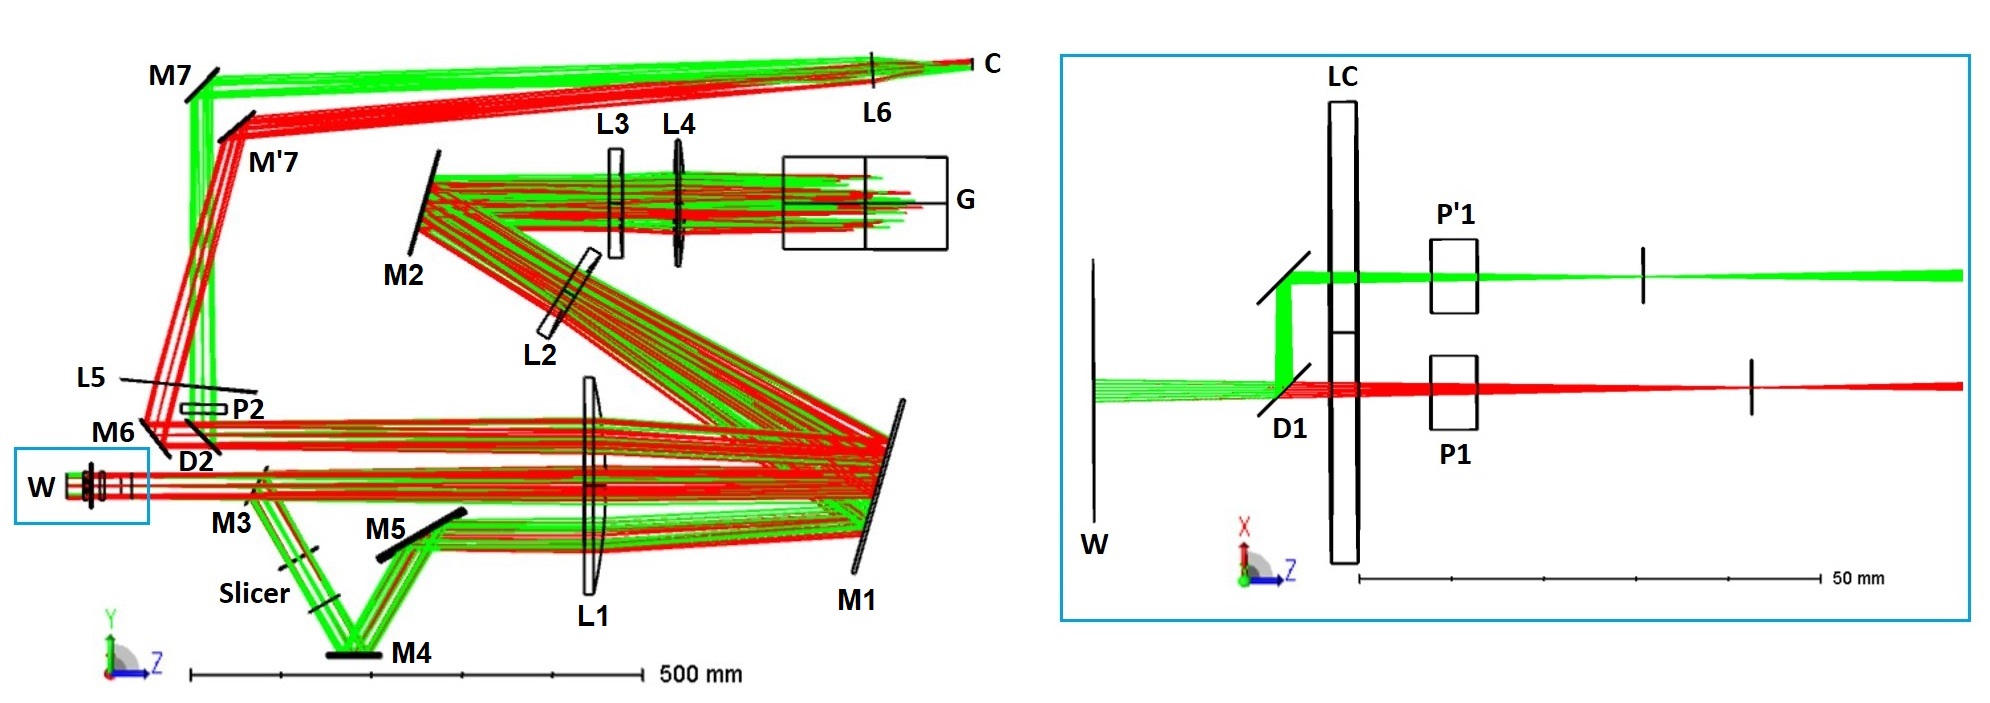
The optical path of the SLED is enclosed in a 1.0 0.7 0.3 m3 box and is indicated (for the green line at 530 nm) by the arrows of figure \irefdesign (L = lenses or objectives, M = flat mirrors):
-
•
W = rectangular entrance window (image plane, 4.4 mm 29.0 mm)
-
•
First pass (dispersion): W, L1, M1, L2, M2, L3, L4, G (grating in pupil plane), L4, L3, M2, L2, M1, L1, M3, SMM (slicer part 1)
-
•
SMM/SSM = 24 channels slicer located in the spectrum (Figure \irefslicerSCD). It is composed of two parts: 24 Slicer beam-splitting Micro-Mirrors (SMM) and 24 associated Slicer beam-Shifting Mirrors (SSM)
-
•
Second pass (subtractive dispersion): SSM (slicer part 2), M4, M5, L1, M1, L2, M2, L3, L4, G (grating), L4, L3, M2, L2, M1, L1
-
•
Transfer optics to the detector: M6, L5 (field lens, 600 mm focal length), M7, L6 (100 mm focal length objective, 0.2 magnification, mounted on the camera)
-
•
C = Andor Zyla camera (5.5 Mpixels sCMOS detector, 2560 2160, 6.5 micron square pixels, USB3, Peltier + air cooled), recording 24 channels spectra-images at 30 frames/s
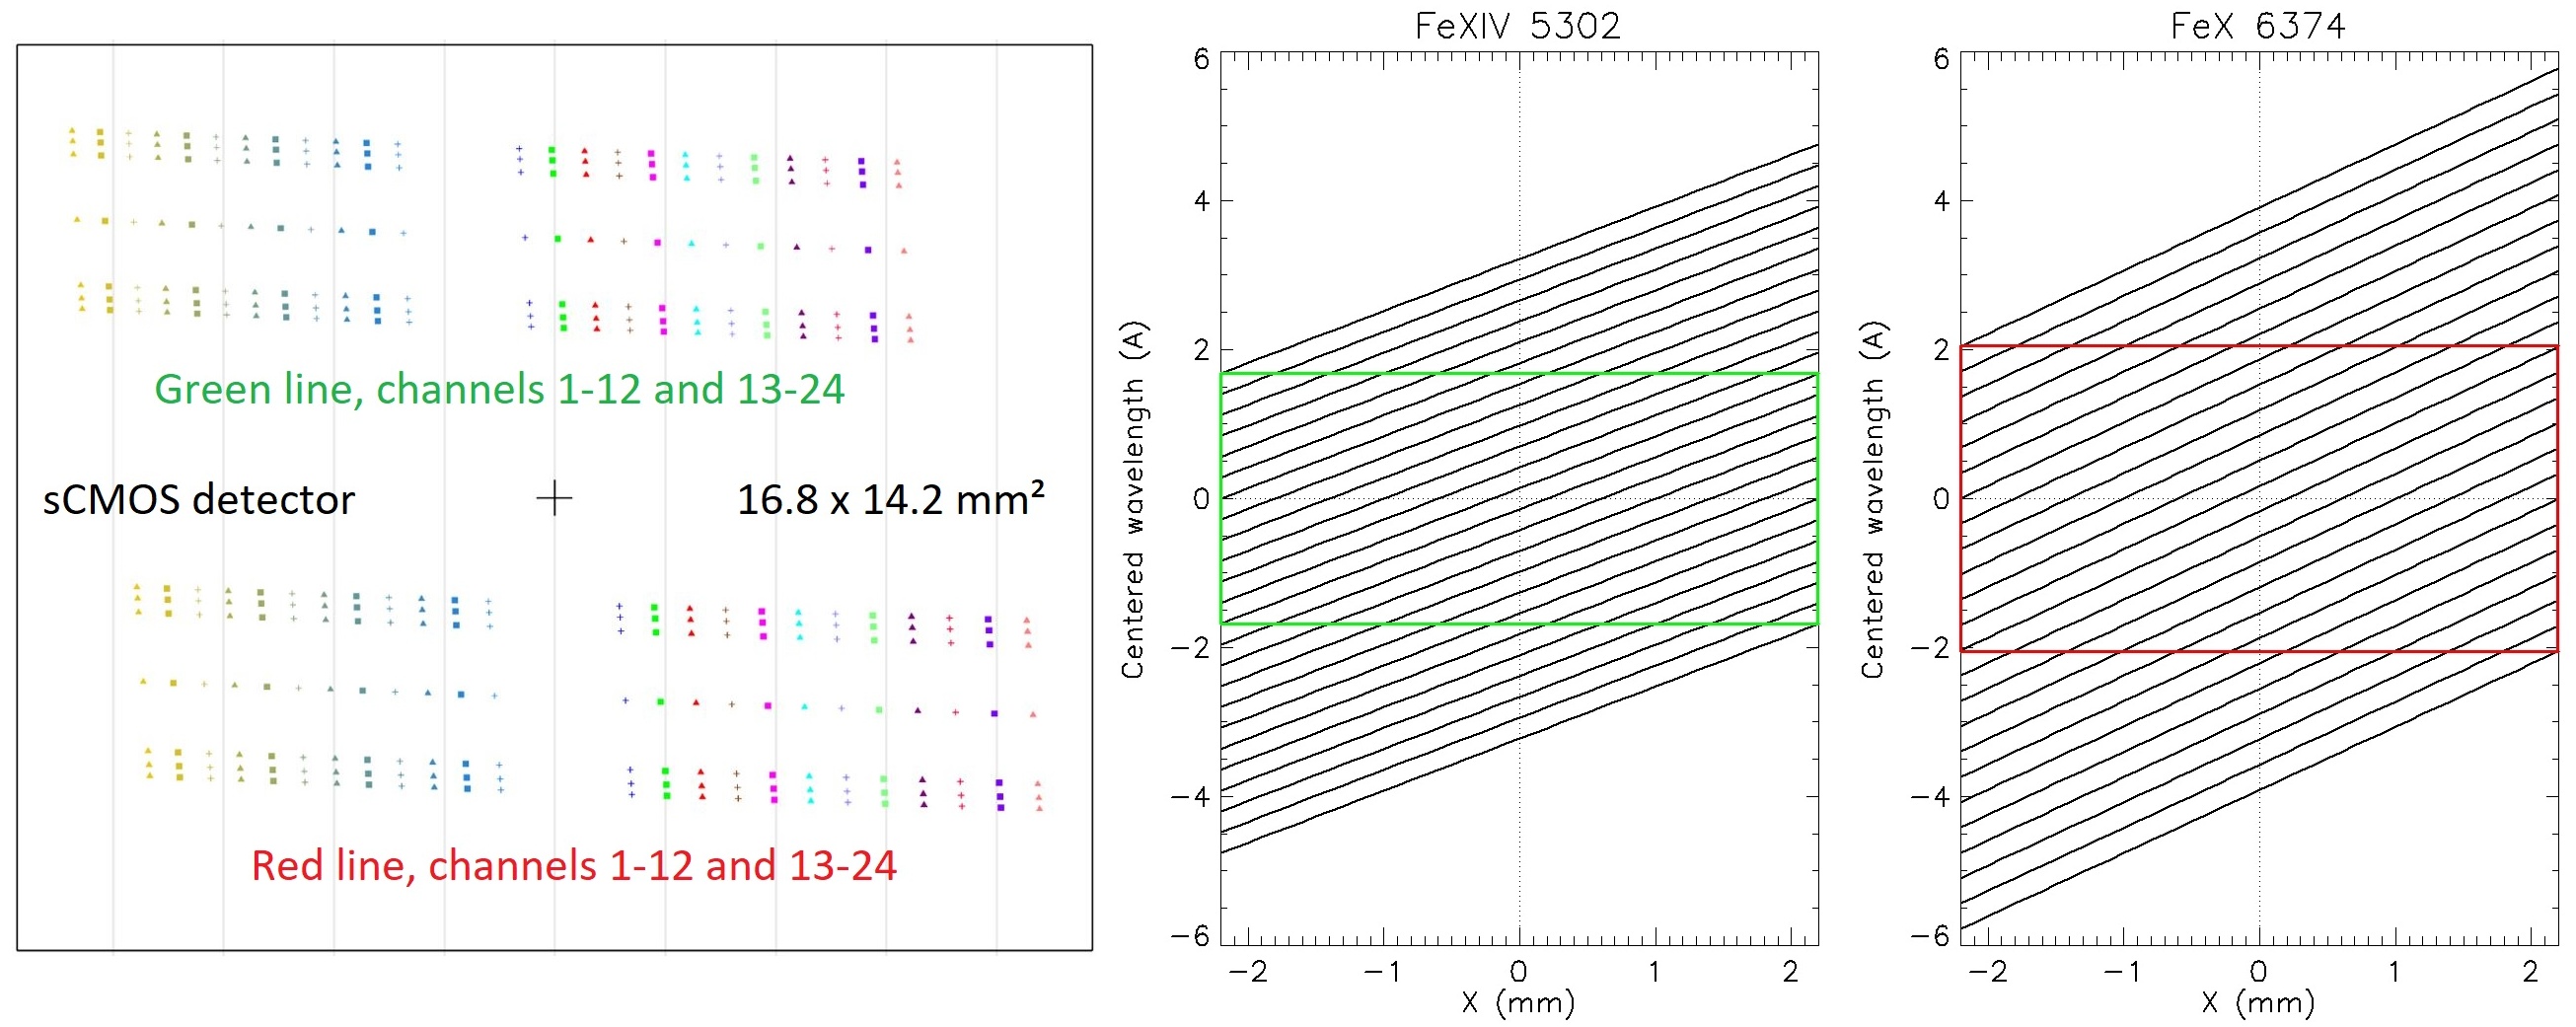
The optical combination of lenses (L1, L2, L3, L4) acts as collimator and chamber objectives (2.0 m equivalent focal length) with folding mirrors (M1, M2). The grating (G, 100 210 mm2) is blazed and 79 grooves/mm ruled, and the second pass on the grating subtracts the dispersion after selection of = 24 channels by the slicer. Interference filters (not represented) select the order (35 and 42 respectively for the red and green coronal lines). L1, L2, L3 and L4 are the optical system acting as a collimator in directions 1 (first pass) or 5 (second pass), and as a chamber in direction 2 (first pass) or 6 (second pass). The slicer (beam splitter SMM and shifter SSM) is shown by Figure \irefslicer, and the step of the SMM is = 0.4 mm corresponding to = 0.34 Å (R = 22000) and 0.28 Å (R = 19000) spectral resolution, respectively for FeX 6374 Å and FeXIV 5302 Å lines ( = dispersion, respectively 1.18 and 1.43 mm/Å). In the case of an equivalent focal length of 6.0 m (LSO coronagraph with Barlow 2.0 ), the width of the FOV is 150′′, corresponding to = 4.4 mm (width of entrance window), with 2.1′′ pixel sampling. We need to dedicate = 11 channels to the FOV (Figure \irefprincipe). As a consequence, 13 channels remain available for line profiles. This corresponds to spectral ranges = 4.1 Å and 3.4 Å, respectively, for the red and green line (Figure \irefcanaux), allowing the determination of large Doppler velocities. Both lines are observed simultaneously on the detector (2 groups of 24 channels, Figure \irefcanaux). Overall transmittance of the SLED is 0.25, and the expected number of photons is proportional to the Coronal Emission Coefficient (CE); for the green line, it is in the range 5-60, according to the phase of the solar cycle. We estimate that errors on Doppler shift measurements, for 0.1 s exposure time (10 frames/s), will be 0.9 km/s for CE = 10 and 0.4 km/s for CE = 50.
Figure \irefdesigngr shows how the SLED is designed to observe simultaneously two coronal lines. At the spectrograph entrance W, the dichroic mirror D1 splits the green and red parts of the spectrum. LC is a field lens. P1 and P’1 are compensation plates, which can rotate around X axis to focus the spectrum on the slicer. At the exit of the spectrograph, D2 is a second dichroic mirror to combine properly on the same detector the FeX and FeXIV spectral images. P2 is a plate for differential focusing on the camera.
Forbidden coronal lines can be observed at LSO. However, the SLED can observe in H (order 34) or He D3 5876 Å (order 38) lines to study at high cadence (30 frames/s) the dynamics of prominences in the corona (respectively 0.35 Å and 0.31 Å spectral resolution). With the 14.5 m focal length of the Białków coronagraph, the width of the FOV will be 70′′ but could be increased to 140′′ or more with focal reduction by a two lenses Galilean system (reducing the image size without any translation, as at Meudon Solar Tower). It would improve considerably the capabilities of the MSDP already operating in Białków by suppressing the surface scan.
5 New generation MSDP compared to IFU spectrometers and Fabry-Pérot filters for large telescopes
S-Comparison
We take advantage of the four decades of MSDP advances to discuss a brief comparison with capabilities of new MSDP/S4I, Integral Field Unit (IFU) spectrometers and Fabry-Pérot filters in the case of four meters solar telescopes. We refer here to the MSDP project proposed for EST (Sayède et al., 2014) and compare it to the DKIST instruments (Rimmele et al., 2020) as the Diffraction Limited Near Infrared SpectroPolarimeter (DL-NIRSP, https://nso.edu/telescopes/dkist/instruments/dl-nirsp/) and the Visible Tunable Filter (VTF, https://nso.edu/telescopes/dkist/instruments/vtf/). Main capabilities are listed in Table 1. Although all instruments are able to perform polarimetry, we do not detail the corresponding parameters. For MSDP, the spectrometer focal length is 8 meters with aperture F/40. Widths of slicer mirrors are between 0.180 and 0.500 mm, and 56 channels are produced for each line. Filling factors are commonly 90%, but it must be noticed that the FOV and the spatial sampling are quite dependent on the size of available detectors, assumed to be 2 K 4 K pixel format.
| DL-NIRSP | VTF | MSDP/S4I | |
| (IFU spectrometer) | (Fabry Pérot filters) | (New generation) | |
| FOV (′′) for | 2.4 1.8 (pixel 0.030) | 120 8 (pixel 0.065) | |
| instantaneous | 6.2 4.6 (pixel 0.077) | ||
| line profiles | 27.8 18.6 (pixel 0.464) | ||
| cadence (ms) | 33 | 33 | |
| Scanned FOV (′′) | 120 120 (pixel 0.464) | 120 120 (pixel 0.065) | |
| cadence (ms) | 50 between positions | 50 between positions | |
| FOV (′′) for scanned lines | 60 60 (pixel 0.0146) | ||
| cadence (s) | 3.5 for 50 wavelengths | ||
| Spectral coverage (nm) | 3 lines in the bands | Sequential line scans | 3 line profiles |
| 500-900, 900-1350, 1350-1800 | 520-870 | UV to IR | |
| Spectral resolution | 125000 at 900 nm | 100000 at 600 nm | 45000-150000 |
To get high spatial resolution and fast imaging spectroscopy on small solar targets, the IFU spectrometer with all simultaneous wavelengths is very efficient. For larger FOV with high temporal resolution, VTF observations are also excellent, although observed wavelengths are not simultaneous so that differential seeing effects must be considered. MSDP data cubes offer a good compromise between FOV, cadence and spectral sampling optimized for each line. The spatial resolution takes advantage of simultaneous wavelengths, without smoothing due to any slit width. New generation MSDP observes line profiles in the large FOV 120′′ 8′′ with small pixels of 0.065′′. Larger FOV can be obtained by surface scans (8′′ steps), with line profiles always observed simultaneously in each position.
6 Discussion and conclusion
S-Conclusion
Table 2 and Figure \irefresol summarize the capabilities of the six instruments which were produced from 1977 to the present. The core of imaging spectroscopy is the beam splitter-shifter (or slicer); the first generation (MSDP type in the table) was based on multi-slits and prisms, providing convenient spectral resolution for Fraunhofer lines. By contrast, the new generation of instruments uses micro-mirrors (S4I type in the table), which are more compact, improving the spectral coverage (24 channels or more) together with the spectral resolution (up to 34 mÅ, convenient for a large number of photospheric lines, Figure \irefresol). With a native 2D FOV, the technique provides, in comparison to classical spectroscopy, a higher temporal resolution. This is particularly well adapted to dynamic events of solar activity, or short duration structures such as granulation. It is also compatible with adaptive optics (high spatial resolution) and polarimetric analysis. While THEMIS MSDP polarimetry used a grid, masking half of the FOV in the y-direction orthogonal to the dispersion, we developed for S4I a new and faster system avoiding masking. The calcite beam-splitter separation (2.2 mm) operates now in the dispersion direction (x). While three-step scans in y-direction were necessary at THEMIS to compensate grid masking, this is no longer necessary with S4I. Observations of a large FOV requires always x-direction scans, but with big steps (typically 10′′), either done by the telescope or a motorized optical device near the image plane.
Some MSDP instruments have been decommissioned (Pic du Midi, VTT), although THEMIS MSDP could be reactivated with adaptive optics. Currently, instruments in operation are located in Wrocław and Meudon (both MSDP and S4I). SLED should commence operations in the next few years. The Meudon data treatment software (Fortran) is being revisited and will be available on-line, together with documentation, at http://bass2000.obspm.fr. An IDL/Fortran version exists at Wrocław, available upon request (to P. Rudawy). Meudon CCD observations will be freely available soon at the BASS2000 solar database. Other or older data (Pic du Midi, VTT, THEMIS) are archived on magnetic supports or photographic films.
| Type | MSDP | MSDP | MSDP | MSDP | MSDP | S4I | S4I |
| Instrument | Meudon | Pic Midi | VTT | Wrocław | THEMIS | Meudon | SLED |
| Slicer | Prisms | Prisms | Prisms | Prisms | Prisms | Mirrors | Mirrors |
| Publication dates | 1977 | 1986 | 1991 | 1994 | 2000 | 2012 | 2021 |
| (from/to) | 2019 | 2006 | 2007 | - | 2014 | - | - |
| [m] | 22.5 (0) | 33-66 (1) | 45 | 14.5 | 60 | 22.5 (0) | 6.0 (2) |
| CCD sampling [′′] | 0.5 | 0.26-0.13 | 0.24 | 0.56 | 0.2 | 0.5 | 2.1 |
| [m] | 14.0 | 8.0 | 15.0 | 8.0 | 7.7 | 14.0 | 2.0 |
| Storage (3) | F,CCD | F,CCD | F,CCD | CCD | CCD | CCD | sCMOS |
| Broad lines | |||||||
| Example [ (Å)] | 6563 | 6563 | 6563 | 6563 | 6563 | 5303 | |
| Channels | 9 | 11 | 9 | 9 | 9 | 24 | |
| Slicer step [mm] | 2.5 | 1.2 | 2.5 | 1.2 | 1.2 | 0.4 | |
| Spectral step [Å] | 0.30 | 0.26 | 0.28 | 0.40 | 0.27 | 0.28 | |
| Without polar | |||||||
| x-scan step [′′] | 54 | 25 | 15 (4) | 20 | 12 | ||
| x-value number | 5 | 6 | 6 (4) | 15 | 40 | ||
| xy FOV [′′] (5) | 270440 | 150240 | 90120 | 300500 | 480150 | 1501000 | |
| Cadence [s] | 30 | 30 | 72 (4) | 25 (6) | 140 | 0.04 (7) | |
| Weaker lines | |||||||
| Example [ (Å)] | 5896 | 5896 | 8542 | 6103 | 5173 | 6374 | |
| Channels | 9 | 11 | 11 | 16 | 18 | 24 | |
| Slicer step [mm] | 1.0 | 0.6 | 0.6 | 0.4 | 0.3 | 0.4 | |
| Spectral step [Å] | 0.10 | 0.144 | 0.09 | 0.08 | 0.034 | 0.34 | |
| Without polar | |||||||
| x-scan step [′′] | 14 | 5 | 12 | ||||
| x-value number | 12 | 26 | 25 | ||||
| xy FOV [′′] (5) | 1490 | 168180 | 130160 | 300190 | 1501000 | ||
| Cadence [s] | 0.2 (7) | 60 | 90 | 160 | 0.04 (7) | ||
| With polar | V (8) | VQU (9) | V (10) | ||||
| Beam number | 1 | 2 | 2 | ||||
| Channels | 11 | 16 | 218 | ||||
| y-scan step [′′] | grid | ||||||
| y-value number | 4 | ||||||
| x-scan step [′′] | 5 | 6 | |||||
| x-value number | 26 | 50 | |||||
| xy FOV [′′] (5) | 1490 | 130160 | 300190 | ||||
| Cadence [s] | 0.4 (7) | 700 | 320 | ||||
| Simult. lines | 1 | 1 | 1-2 | 1 | 1-2 | 1 | 2 |
Forty years of advances in imaging MSDP spectrometers have produced more than 200 papers (full bibliography available as online supplement material of the present paper). With a native 2D FOV, previous MSDP (prism beam-shifters) and new S4I (mirror slicers) technologies have many advantages, in comparison to single slit spectroscopy, including both spatial (no slit smoothing) and temporal resolution (a large FOV is covered by a small amount of adjacent observations). Short exposure times (tens of ms), eventually in association with adaptive optics (THEMIS), favour image quality, which can be similar to that obtained through monochromatic or tunable filters. Alternatively, fast cameras using sCMOS detectors can be used to restore images by phase diversity reconstruction from high speed bursts. The initial versions of MSDP had spectral resolutions (typically 80-300 mÅ) adapted to chromospheric lines. However, the new S4I design provides improved spectral sampling (typically 30-40 mÅ) which allows observations of weaker lines of the photosphere with long focal length spectrographs (typically 10 m). A fast polarimetry technique was also developed. The S4I prototype of Meudon is now miniaturized, with new perspectives of much more compact and transportable spectrographs (2 m) for either total eclipse campaigns, equipment of high altitude coronagraphs (optical lines), or space missions (UV lines). Hence, the SLED will be the first compact instrument dedicated to coronal plasma dynamics, and will cover the hot green and red forbidden lines, or cold prominence lines, when utilized with coronagraphs in the next few years. The SLED design can work at UV wavelengths as short as 1500 Å, so that a space-borne version for observing the CIV line of the transition region is under study.
Acknowledgments
We thank the referee for helpful comments and suggestions. We are indebted to Ch. Coutard, R. Hellier, A. Miguel for the achievement of MSDP instruments, and to Dr B. Schmieder and Dr N. Mein for organizing and carrying out many observing campaigns. We thank also D. Crussaire and R. Lecocguen for their technical assistance, and the Pôle Instrumental of the GEPI department (Observatoire de Paris). We are grateful for financial support to the Institut National des Sciences de l’Univers (INSU/CNRS), the Programme National Soleil Terre (INSU/PNST), the University of Wrocław, the UK Science and Technology Facilities Council (STFC) and Queen’s University Belfast.
Disclosure of Potential Conflicts of Interest
The authors declare that they have no conflicts of interest.
Electronic Supplemental Material.
- i)
-
Movie (MPEG 4 format): a typical sequence of a solar scan with S4I in polarimetric mode (25 successive images using a beam shifter are recorded for a final 300′′ 150′′ FOV; each image presents 18 couples of sub-channels I+V, I-V. Each sub-channel covers 300′′ 7.5′′). First part of the movie: Mgi 5173 Å line; second part: Caii 8542 Å line.
- ii)
-
MSDP full bibliography from 1977 to now (PDF format, including URLs of the cited papers).
References
- Alissandrakis, Tsiropoula, and Mein (1990) Alissandrakis, C.E., Tsiropoula, G., Mein, P.: 1990, Physical parameters of solar H-alpha absorption features derived with the cloud model. A&A 230(1), 200. ADS.
- Aulanier et al. (1998) Aulanier, G., Demoulin, P., van Driel-Gesztelyi, L., Mein, P., Deforest, C.: 1998, 3-D magnetic configurations supporting prominences. II. The lateral feet as a perturbation of a twisted flux-tube. A&A 335, 309. ADS.
- Berlicki, Mein, and Schmieder (2006) Berlicki, A., Mein, P., Schmieder, B.: 2006, THEMIS/MSDP magnetic field measurements. A&A 445(3), 1127. DOI. ADS.
- Berlicki et al. (2011) Berlicki, A., Gunar, S., Heinzel, P., Schmieder, B., Schwartz, P.: 2011, 2D radiative-magnetohydrostatic model of a prominence observed by Hinode, SoHO/SUMER and Meudon/MSDP. A&A 530, A143. DOI. ADS.
- Chandra et al. (2009) Chandra, R., Schmieder, B., Aulanier, G., Malherbe, J.M.: 2009, Evidence of Magnetic Helicity in Emerging Flux and Associated Flare. Sol. Phys. 258(1), 53. DOI. ADS.
- Chiuderi-Drago, Mein, and Pick (1986) Chiuderi-Drago, F., Mein, N., Pick, M.: 1986, Unstable Chromospheric Dark Features and Type-Iii Bursts Association. Sol. Phys. 103(2), 235. DOI. ADS.
- De Pontieu et al. (2014) De Pontieu, B., Title, A.M., Lemen, J.R., Kushner, G.D., Akin, D.J., Allard, B., Berger, T., Boerner, P., Cheung, M., Chou, C., Drake, J.F., Duncan, D.W., Freeland, S., Heyman, G.F., Hoffman, C., Hurlburt, N.E., Lindgren, R.W., Mathur, D., Rehse, R., Sabolish, D., Seguin, R., Schrijver, C.J., Tarbell, T.D., Wülser, J.-P., Wolfson, C.J., Yanari, C., Mudge, J., Nguyen-Phuc, N., Timmons, R., van Bezooijen, R., Weingrod, I., Brookner, R., Butcher, G., Dougherty, B., Eder, J., Knagenhjelm, V., Larsen, S., Mansir, D., Phan, L., Boyle, P., Cheimets, P.N., DeLuca, E.E., Golub, L., Gates, R., Hertz, E., McKillop, S., Park, S., Perry, T., Podgorski, W.A., Reeves, K., Saar, S., Testa, P., Tian, H., Weber, M., Dunn, C., Eccles, S., Jaeggli, S.A., Kankelborg, C.C., Mashburn, K., Pust, N., Springer, L., Carvalho, R., Kleint, L., Marmie, J., Mazmanian, E., Pereira, T.M.D., Sawyer, S., Strong, J., Worden, S.P., Carlsson, M., Hansteen, V.H., Leenaarts, J., Wiesmann, M., Aloise, J., Chu, K.-C., Bush, R.I., Scherrer, P.H., Brekke, P., Martinez-Sykora, J., Lites, B.W., McIntosh, S.W., Uitenbroek, H., Okamoto, T.J., Gummin, M.A., Auker, G., Jerram, P., Pool, P., Waltham, N.: 2014, The Interface Region Imaging Spectrograph (IRIS). Sol. Phys. 289(7), 2733. DOI. ADS.
- Deng et al. (2002) Deng, Y., Lin, Y., Schmieder, B., Engvold, O.: 2002, Filament activation and magnetic reconnection. Sol. Phys. 209(1), 153. DOI. ADS.
- Eibe et al. (2002) Eibe, M.T., Aulanier, G., Faurobert, M., Mein, P., Malherbe, J.M.: 2002, Vertical structure of sunspots from THEMIS observations. A&A 381, 290. DOI. ADS.
- Falewicz et al. (2017) Falewicz, R., Radziszewski, K., Rudawy, P., Berlicki, A.: 2017, Time Variations of Observed H Line Profiles and Precipitation Depths of Nonthermal Electrons in a Solar Flare. ApJ 847(2), 84. DOI. ADS.
- Gnevyshev, Nikolsky, and Sazanov (1967) Gnevyshev, M.N., Nikolsky, G.M., Sazanov, A.A.: 1967, The Lyot-Coronagraph with 53 cm Objective. Sol. Phys. 2(2), 223. DOI. ADS.
- Gunár et al. (2012) Gunár, S., Mein, P., Schmieder, B., Heinzel, P., Mein, N.: 2012, Dynamics of quiescent prominence fine structures analyzed by 2D non-LTE modelling of the H line. A&A 543, A93. DOI. ADS.
- Heinzel and Schmieder (1994) Heinzel, P., Schmieder, B.: 1994, Chromospheric fine structure: Black & white mottles. A&A 282(3), 939. ADS.
- Heinzel, Schmieder, and Tziotziou (2001) Heinzel, P., Schmieder, B., Tziotziou, K.: 2001, Why Are Solar Filaments More Extended in Extreme-Ultraviolet Lines than in H? ApJ 561(2), L223. DOI. ADS.
- Malherbe, Schmieder, and Mein (1981) Malherbe, J.M., Schmieder, B., Mein, P.: 1981, Dynamics in the filaments. I - Oscillations in a quiescent filament. A&A 102(1), 124. ADS.
- Malherbe et al. (1987) Malherbe, J.M., Schmieder, B., Mein, P., Tand berg-Hanssen, E.: 1987, Dynamics of solar filaments. V - Oscillations in the H-alpha and 1548 A C IV lines. A&A 172(1-2), 316. ADS.
- Malherbe et al. (2004) Malherbe, J.-M., Roudier, T., Mein, P., Moity, J., Muller, R.: 2004, High resolution solar magnetometry with the spectrograph of the Pic du Midi Turret Dome. A&A 427, 745. DOI. ADS.
- Malherbe et al. (2007) Malherbe, J.-M., Roudier, T., Moity, J., Mein, P., Arnaud, J., Muller, R.: 2007, Spectro polarimetry with liquid crystals . Mem. Soc. Astron. Italiana 78, 203. ADS.
- Mandrini et al. (2002) Mandrini, C.H., Démoulin, P., Schmieder, B., Deng, Y.Y., Rudawy, P.: 2002, The role of magnetic bald patches in surges and arch filament systems. A&A 391, 317. DOI. ADS.
- Mein and Avignon (1985) Mein, N., Avignon, Y.: 1985, Ejection of Chromospheric Material Associated with Injection of Electrons in the Solar Corona. Sol. Phys. 95(2), 331. DOI. ADS.
- Mein et al. (1996) Mein, N., Mein, P., Heinzel, P., Vial, J.-C., Malherbe, J.M., Staiger, J.: 1996, Cloud model with variable source function for solar H structures. A&A 309, 275. ADS.
- Mein et al. (2001) Mein, N., Schmieder, B., DeLuca, E.E., Heinzel, P., Mein, P., Malherbe, J.M., Staiger, J.: 2001, A Study of Hydrogen Density in Emerging Flux Loops from a Coordinated Transition Region and Coronal Explorer and Canary Islands Observation Campaign. ApJ 556(1), 438. DOI. ADS.
- Mein (1977) Mein, P.: 1977, Multi-channel subtractive spectrograph and filament observations. Sol. Phys. 54(1), 45. DOI. ADS.
- Mein (1980) Mein, P.: 1980, Multi-Channel Subtractive Double Pass Spectrograph. In: Moriyama, F., Henoux, J.C. (eds.) Japan-France Seminar on Solar Physics, 285. ADS.
- Mein (1991) Mein, P.: 1991, Solar 2D spectroscopy - A new MSDP instrument. A&A 248(2), 669. ADS.
- Mein (2002) Mein, P.: 2002, The MSDP of THEMIS: Capabilities, first results and prospects. A&A 381, 271. DOI. ADS.
- Mein (2008) Mein, P.: 2008, Spectro-imagery at the solar tower of meudon. L’Astronomie 122(6), 16. ADS.
- Mein and Mein (1988) Mein, P., Mein, N.: 1988, Differential cloud models for solar velocity field measurements. A&A 203(1), 162. ADS.
- Mein, Mein, and Bommier (2009) Mein, P., Mein, N., Bommier, V.: 2009, Fast imaging spectroscopy with MSDP spectrometers. Vector magnetic maps with THEMIS/MSDP. A&A 507(1), 531. DOI. ADS.
- Mein et al. (1989) Mein, P., Roudier, T., Vigneau, J., Muller, R., Malherbe, J.M., Contard, C., Hellier, R.: 1989, Granulation velocity field: latest results from Pic-du-Midi - processing of MSDP data. In: von der Luehe, O. (ed.) High spatial resolution solar observations, 521. ADS.
- Mein et al. (2007) Mein, P., Mein, N., Faurobert, M., Aulanier, G., Malherbe, J.-M.: 2007, Magnetic flux tubes observed with THEMIS/MSDP. A&A 463(2), 727. DOI. ADS.
- Pariat et al. (2007) Pariat, E., Schmieder, B., Berlicki, A., Deng, Y., Mein, N., López Ariste, A., Wang, S.: 2007, Spectrophotometric analysis of Ellerman bombs in the Ca II, H, and UV range. A&A 473(1), 279. DOI. ADS.
- Phillips et al. (2000) Phillips, K.J.H., Read, P.D., Gallagher, P.T., Keenan, F.P., Rudawy, P., Rompolt, B., Berlicki, A., Buczylko, A., Diego, F., Barnsley, R., Smartt, R.N., Pasachoff, J.M., Babcock, B.A.: 2000, SECIS: The Solar Eclipse Coronal Eclipse Imaging System. Sol. Phys. 193, 259. DOI. ADS.
- Porter, Klimchuk, and Sturrock (1994) Porter, L.J., Klimchuk, J.A., Sturrock, P.A.: 1994, The Possible Role of MHD Waves in Heating the Solar Corona. ApJ 435, 482. DOI. ADS.
- Radziszewski, Rudawy, and Phillips (2007) Radziszewski, K., Rudawy, P., Phillips, K.J.H.: 2007, High time resolution observations of solar H flares. I. A&A 461(1), 303. DOI. ADS.
- Rimmele et al. (2020) Rimmele, T.R., Warner, M., Keil, S.L., Goode, P.R., Knölker, M., Kuhn, J.R., Rosner, R.R., McMullin, J.P., Casini, R., Lin, H., Wöger, F., von der Lühe, O., Tritschler, A., Davey, A., de Wijn, A., Elmore, D.F., Fehlmann, A., Harrington, D.M., Jaeggli, S.A., Rast, M.P., Schad, T.A., Schmidt, W., Mathioudakis, M., Mickey, D.L., Anan, T., Beck, C., Marshall, H.K., Jeffers, P.F., Oschmann, J.M., Beard, A., Berst, D.C., Cowan, B.A., Craig, S.C., Cross, E., Cummings, B.K., Donnelly, C., de Vanssay, J.-B., Eigenbrot, A.D., Ferayorni, A., Foster, C., Galapon, C.A., Gedrites, C., Gonzales, K., Goodrich, B.D., Gregory, B.S., Guzman, S.S., Guzzo, S., Hegwer, S., Hubbard, R.P., Hubbard, J.R., Johansson, E.M., Johnson, L.C., Liang, C., Liang, M., McQuillen, I., Mayer, C., Newman, K., Onodera, B., Phelps, L., Puentes, M.M., Richards, C., Rimmele, L.M., Sekulic, P., Shimko, S.R., Simison, B.E., Smith, B., Starman, E., Sueoka, S.R., Summers, R.T., Szabo, A., Szabo, L., Wampler, S.B., Williams, T.R., White, C.: 2020, The Daniel K. Inouye Solar Telescope - Observatory Overview. Sol. Phys. 295(12), 172. DOI. ADS.
- Rompolt et al. (1994) Rompolt, B., Mein, P., Mein, N., Rudawy, P., Berlicki, A.: 1994, The MSDP Recently Installed at the Spectrograph of the Large Coronograph. JOSO Annual Report 93, 95.
- Roudier et al. (2003) Roudier, T., Malherbe, J.M., Mein, P., Muller, R., Coutard, C., Lafon, M., Grimaud, F.: 2003, High spatial resolution capabilities of Doppler measurements with the Pic du Midi MSDP spectrograph. A&A 409, 793. DOI. ADS.
- Roudier et al. (2006) Roudier, T., Malherbe, J.M., Moity, J., Rondi, S., Mein, P., Coutard, C.: 2006, Sub arcsec evolution of solar magnetic fields. A&A 455(3), 1091. DOI. ADS.
- Ruan et al. (2018) Ruan, G., Schmieder, B., Mein, P., Mein, N., Labrosse, N., Gunár, S., Chen, Y.: 2018, On the Dynamic Nature of a Quiescent Prominence Observed by IRIS and MSDP Spectrographs. ApJ 865(2), 123. DOI. ADS.
- Ruan et al. (2019) Ruan, G., Jejčič, S., Schmieder, B., Mein, P., Mein, N., Heinzel, P., Gunár, S., Chen, Y.: 2019, Diagnostics of the Prominence Plasma from H and Mg II Spectral Observations. ApJ 886(2), 134. DOI. ADS.
- Rudawy et al. (2001) Rudawy, P., Falewicz, R., Mandrini, C.H., Siarkowski, M.: 2001, X-type interactions of the loops in the flare of 25 September 1997 - Part II. A&A 372, 1030. DOI. ADS.
- Rudawy et al. (2002) Rudawy, P., Berlicki, A., Siarkowski, M., Kasiniak, K.: 2002, Ejection during the solar flare in NOAA 8739 active region on 26 October 1999. Advances in Space Research 30(3), 611. DOI. ADS.
- Rudawy et al. (2004) Rudawy, P., Phillips, K.J.H., Gallagher, P.T., Williams, D.R., Rompolt, B., Keenan, F.P.: 2004, Search for 1-10 Hz modulations in coronal emission with SECIS during the August 11, 1999 eclipse. A&A 416, 1179. DOI. ADS.
- Rudawy et al. (2010) Rudawy, P., Phillips, K.J.H., Buczylko, A., Williams, D.R., Keenan, F.P.: 2010, Search for Rapid Changes in the Visible-Light Corona during the 21 June 2001 Total Solar Eclipse. Sol. Phys. 267(2), 305. DOI. ADS.
- Sayède et al. (2014) Sayède, F., Mein, P., Malherbe, J.-M., Amans, J.-P., Crussaire, D., Lecocguen, R.: 2014, The S4I prototype, a beam-slicer dedicated to the new generation Multichannel Subtractive Double Pass for EST imaging spectropolarimetry. In: Proc. SPIE, Society of Photo-Optical Instrumentation Engineers (SPIE) Conference Series 9147, 91476F. DOI. ADS.
- Scherrer et al. (2012) Scherrer, P.H., Schou, J., Bush, R.I., Kosovichev, A.G., Bogart, R.S., Hoeksema, J.T., Liu, Y., Duvall, T.L., Zhao, J., Title, A.M., Schrijver, C.J., Tarbell, T.D., Tomczyk, S.: 2012, The Helioseismic and Magnetic Imager (HMI) Investigation for the Solar Dynamics Observatory (SDO). Sol. Phys. 275(1-2), 207. DOI. ADS.
- Schmieder, Fang, and Harra-Murnion (1998) Schmieder, B., Fang, C., Harra-Murnion, L.K.: 1998, Spectral Analysis of a Thermal Flare on 27 October 1993. Sol. Phys. 182(2), 447. DOI. ADS.
- Schmieder, Tziotziou, and Heinzel (2003) Schmieder, B., Tziotziou, K., Heinzel, P.: 2003, Spectroscopic diagnostics of an H and EUV filament observed with THEMIS and SOHO. A&A 401, 361. DOI. ADS.
- Schmieder et al. (1995) Schmieder, B., Shibata, K., van Driel-Gesztelyi, L., Freeland, S.: 1995, H surges and associated Soft X-ray loops. Sol. Phys. 156(2), 245. DOI. ADS.
- Schmieder et al. (2000) Schmieder, B., Delannée, C., Yong, D.Y., Vial, J.C., Madjarska, M.: 2000, Multi-wavelength study of the slow “disparition brusque” of a filament observed with SOHO. A&A 358, 728. ADS.
- Schmieder et al. (2004) Schmieder, B., Mein, N., Deng, Y., Dumitrache, C., Malherbe, J.-M., Staiger, J., Deluca, E.E.: 2004, Magnetic changes observed in the formation of two filaments in a complex active region: TRACE and MSDP observations. Sol. Phys. 223(1-2), 119. DOI. ADS.
- Schmieder et al. (2007) Schmieder, B., Gunár, S., Heinzel, P., Anzer, U.: 2007, Spectral Diagnostics of the Magnetic Field Orientation in a Prominence Observed with SOHO/SUMER. Sol. Phys. 241(1), 53. DOI. ADS.
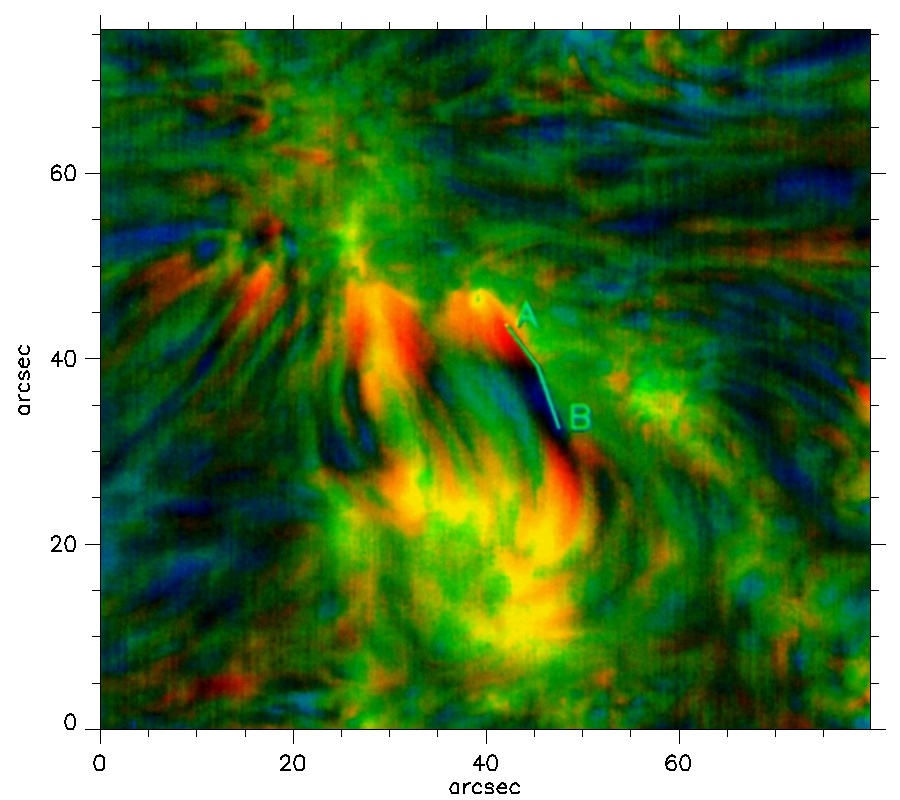
- Schmieder et al. (2017) Schmieder, B., Mein, P., Mein, N., Levens, P.J., Labrosse, N., Ofman, L.: 2017, H Doppler shifts in a tornado in the solar corona. A&A 597, A109. DOI. ADS.
- Schwartz et al. (2004) Schwartz, P., Heinzel, P., Anzer, U., Schmieder, B.: 2004, Determination of the 3D structure of an EUV-filament observed by SoHO/CDS, SoHO/SUMER and VTT/MSDP. A&A 421, 323. DOI. ADS.
- Singh et al. (1999) Singh, J., Ichimoto, K., Imai, H., Sakurai, T., Takeda, A.: 1999, Spectroscopic Studies of the Solar Corona I. Spatial Variations in Line Parameters of Green and Red Coronal Lines. PASJ 51, 269. DOI. ADS.
- Singh et al. (2003) Singh, J., Ichimoto, K., Sakurai, T., Muneer, S.: 2003, Spectroscopic Studies of the Solar Corona. IV. Physical Properties of Coronal Structure. ApJ 585(1), 516. DOI. ADS.
- Tsiropoula, Madi, and Schmieder (1999) Tsiropoula, G., Madi, C., Schmieder, B.: 1999, Derivation of physical parameters of chromospheric structures assuming a constant and a varying source function. Sol. Phys. 187(1), 11. DOI. ADS.
- Tsuneta et al. (2008) Tsuneta, S., Ichimoto, K., Katsukawa, Y., Nagata, S., Otsubo, M., Shimizu, T., Suematsu, Y., Nakagiri, M., Noguchi, M., Tarbell, T., Title, A., Shine, R., Rosenberg, W., Hoffmann, C., Jurcevich, B., Kushner, G., Levay, M., Lites, B., Elmore, D., Matsushita, T., Kawaguchi, N., Saito, H., Mikami, I., Hill, L.D., Owens, J.K.: 2008, The Solar Optical Telescope for the Hinode Mission: An Overview. Sol. Phys. 249(2), 167. DOI. ADS.
- Tziotziou, Tsiropoula, and Mein (2002) Tziotziou, K., Tsiropoula, G., Mein, P.: 2002, Ca II 8542 Å sunspot oscillations observed with THEMIS. A&A 381, 279. DOI. ADS.
- Tziotziou et al. (2006) Tziotziou, K., Tsiropoula, G., Mein, N., Mein, P.: 2006, Observational characteristics and association of umbral oscillations and running penumbral waves. A&A 456(2), 689. DOI. ADS.
- Zapiór and Rudawy (2010) Zapiór, M., Rudawy, P.: 2010, Determination of 3D Trajectories of Knots in Solar Prominences Using MSDP Data. Sol. Phys. 267(1), 95. DOI. ADS.
- Zapiór and Rudawy (2012) Zapiór, M., Rudawy, P.: 2012, Estimation of Solar Prominence Magnetic Fields Based on the Reconstructed 3D Trajectories of Prominence Knots. Sol. Phys. 280(2), 445. DOI. ADS.
- Zapiór et al. (2019) Zapiór, M., Schmieder, B., Mein, P., Mein, N., Labrosse, N., Luna, M.: 2019, Exploration of long-period oscillations in an H prominence. A&A 623, A144. DOI. ADS.
- Zong et al. (2003) Zong, W.G., Tang, Y.H., Fang, C., Mein, P., Mein, N., Xu, A.A.: 2003, Spectro-polarimetric observation of the fine structure of a quiescent filament. A&A 412, 267. DOI. ADS.