ALMA 1.3 mm Survey of Lensed Submillimeter Galaxies (SMGs) Selected by Herschel: 111Herschel is an ESA space observatory with science instruments provided by European-led Principal Investigator consortia and with important participation from NASA.
Discovery of Spatially Extended SMGs and Implications
Abstract
We present an ALMA 1.3 mm (Band 6) continuum survey of lensed submillimeter galaxies (SMGs) at with an angular resolution of . These galaxies were uncovered by the Herschel Lensing Survey (HLS), and feature exceptionally bright far-infrared continuum emission ( mJy) owing to their lensing magnification. We detect 29 sources in 20 fields of massive galaxy clusters with ALMA. Using both the Spitzer/IRAC (3.6/4.5 m) and ALMA data, we have successfully modeled the surface brightness profiles of 26 sources in the rest-frame near- and far-infrared. Similar to previous studies, we find the median dust-to-stellar continuum size ratio to be small (/ = 0.380.14) for the observed SMGs, indicating that star formation is centrally concentrated. This is, however, not the case for two spatially extended main-sequence SMGs with a low surface brightness at 1.3 mm ( ), in which the star formation is distributed over the entire galaxy (/ 1). As a whole, our SMG sample shows a tight anti-correlation between (/) and far-infrared surface brightness () over a factor of 1000 in . This indicates that SMGs with less vigorous star formation (i.e., lower ) lack central starburst and are likely to retain a broader spatial distribution of star formation over the whole galaxies (i.e., larger /). The same trend can be reproduced with cosmological simulations as a result of central starburst and potentially subsequent “inside-out” quenching, which likely accounts for the emergence of compact quiescent galaxies at .
tablenum \restoresymbolSIXtablenum
1 Introduction
As the most vigorous stellar nursery in the Universe, submillimeter galaxies (SMGs222Observed 1.3 mm flux density at mJy in this work. See discussion of definition in Hodge & da Cunha (2020).) are discovered in abundance at , contributing of the cosmic star formation rate density up to (e.g., Swinbank et al., 2014; Casey et al., 2014a). Due to the critical role played by dust grains in the interstellar medium (ISM), commonly produced by asymptotic giant branch (AGB) stars and supernovae (SNe), these galaxies are observed to be highly dust-obscured in the rest-frame UV/optical bands (e.g., Whitaker et al., 2017; Dudzevičiūtė et al., 2020). In the far-infrared (FIR), dust grains, heated up by the intense star formation, emit thermal continuum radiation accessible through submillimeter/millimeter observations. These galaxies are found to host massive gas reservoirs with relatively short gas depletion time scales ( Myr; e.g., Tacconi et al. 2008; Bothwell et al. 2013; Miettinen et al. 2017). After the truncation of sufficient gas supply, SMGs are believed to evolve towards compact quiescent galaxies (cQs) seen at lower redshift (e.g., Toft et al., 2014; Simpson et al., 2014), which will eventually become massive elliptical galaxies in the local Universe potentially through additional gas-poor mergers (e.g., van Dokkum, 2005; Oogi & Habe, 2013).
The trigger mechanism of SMGs remains a subject of debate. As the local analogs of SMGs, ultra-luminous infrared galaxies (ULIRGs) are observed to result from major mergers, with compact and prominent star-forming regions in their nuclei (e.g., Sanders et al., 1988). At , similar scenarios have been proposed by certain galaxy evolution theories (e.g., Narayanan et al., 2010; McAlpine et al., 2019), but minor mergers (e.g., Gómez-Guijarro et al., 2018) and secular starburst (e.g., Davé et al., 2010) are other possible physical explanations supported by either observational evidence or theoretical frameworks.
Most recently, powerful ground-based interferometers like ALMA have started to reveal the compact dust continua of SMGs by high-resolution imaging (e.g., Simpson et al., 2015; Hodge et al., 2016, 2019; Elbaz et al., 2018; Puglisi et al., 2019; Gullberg et al., 2019; Tadaki et al., 2020). With a typical half-light radius of 1–2 kpc, these intense star-forming regions are still larger than those in the local (U)LIRGs, while their sizes do match with cQs at slightly lower redshift (e.g., van Dokkum et al., 2008; van der Wel et al., 2014). In addition, the number density and clustering properties of SMGs also coincide with those of cQs, indicating an underlying evolutionary connection (Hickox et al., 2012; Simpson et al., 2014; An et al., 2019; Dudzevičiūtė et al., 2020). Therefore, understanding how star formation ceases in SMGs (i.e., quenching) holds important clues to connecting actively star-forming galaxies and their (possible) red and dead descendants.
Spatially resolved studies have suggested that the massive star-forming galaxies at exhibit a rising specific star-formation rate (sSFR; SFR per unit stellar mass) profile from their center to the outskirts, indicating that the fade-out of star formation commences from the galactic center (e.g., Tacchella et al., 2015, 2018; Nelson et al., 2016; Spilker et al., 2019). Such an “inside-out” process of quenching can also be reproduced within the context of cosmological simulation (Tacchella et al., 2016). Various physical mechanisms have been proposed to interpret the quenching process, including the gas consumption by star formation, gas outflows driven by stellar and supermassive black hole feedbacks (Dekel & Silk, 1986; Di Matteo et al., 2005), as well as suppression of exterior gas supply through shocking heating due to gravitationally infalling gas (Dekel & Birnboim, 2006, 2008).
Although emerging observational clues suggest an inside-out fashion of stellar mass assembly and gas depletion, it is yet to be confirmed as the standard process in the evolution of SMGs with compact and powerful star-forming regions. The morphological modeling of SFR and stellar mass profile requires high-resolution imaging of SFR tracers (e.g., H, UV/FIR continuum) and stellar component (the rest-frame optical/near-infrared continuum). However, the accuracy of measurements at shorter wavelength is clearly subject to the strong dust extinction in the center of SMGs (e.g., Simpson et al., 2017; Lang et al., 2019). Meanwhile, H-based SFR profile is also sensitive to the active galactic nuclei (AGN) contribution, since the AGN fraction is higher in compact star-forming galaxies compared to more extended ones at similar redshifts (Barro et al., 2013). In a nutshell, it is necessary to develop novel modeling techniques for stellar mass and SFR that are less sensitive to dust extinction and AGN contribution.
To address this issue, one possible solution is to observe at longer wavelength. Since most of the star formation in SMGs is obscured by dust, FIR surface luminosity can represent the surface SFR with a sufficient accuracy. In order to avoid the heavy dust obscuration of stellar continuum in SMGs, it is also better to sample the rest-frame near-infrared (NIR) bands rather than the optical ones (e.g., HST/WFC3-IR F160W samples the rest-frame band for galaxies). However, current sensitive mid-infrared imaging instrument (e.g., Spitzer/IRAC) cannot allow such a study with ALMA-like angular resolution as required.
In this regard, cluster-lensed SMGs (e.g., Smail et al., 1997; Swinbank et al., 2010) can be useful targets to provide the morphological evidence. Magnified by gravitational lensing provided by a foreground cluster, these targets are sufficiently bright at multiple wavelengths, and their angular sizes are also stretched significantly (note, however, that the lensing effect conserves surface brightness). Compared to galaxy-lensed SMGs with a bright lensing galaxy always in the front, cluster-lensed ones are often free from blending with foreground galaxies, ensuring simplicity of the morphological modeling on their stellar component. Strong magnification gradients on the kpc scales relevant for resolving galaxies are also much less a concern than in galaxy-lensed cases. During the course of our Herschel Lensing Survey (HLS, Egami et al. 2010; Egami et al., in prep.), we uncovered a substantial number of lensed SMGs with exceptionally bright FIR continuum (mJy). We then carried out observations of their dust continua in the ALMA Band 6 at 1.3 mm, as well as stellar continua with Spitzer/IRAC at 3.6/4.5 m. In this work, we present the observations and analyses of the stellar and dust components in cluster-lensed SMGs at both integrated and spatially resolved scales.
This paper is arranged as follows: Section 2 introduces all the obtained ALMA and Spitzer/IRAC data and corresponding data reduction techniques, with several ancillary data from various sources. Section 3 presents the fundamental analysis of our data, including detection, photometry and surface brightness profile modeling. In Section 4 we perform spectral energy distribution (SED) modeling and show the statistical results of galaxy properties from both the integrated and spatially-resolved analyses. We discuss the underlying physics and make necessary comparison with both observational evidence and theoretical predictions in Section 5. The conclusions and broader implication can be found in Section 6. Throughout this paper, we assume a flat CDM cosmology with and . The AB magnitude system (Oke & Gunn, 1983) is used to express source brightnesses in the optical and NIR.
2 Observations and Data
2.1 The Sample
To discover and study a significant sample of gravitationally lensed SMGs, we have conducted an extensive imaging survey of massive galaxy clusters in the FIR using the Herschel Space Observatory (Pilbratt et al., 2010), known as the HLS (Egami et al. 2010). The target clusters were selected mainly from the samples produced by the following three surveys: (1) the ROSAT All-Sky Survey (RASS) with the X-ray-luminous cluster sample tabulated by H. Ebeling (private communication), (2) the COnstrain Dark Energy with X-ray (CODEX) survey, which utilizes the combination of the RASS X-ray and Sloan Digital Sky Survey (SDSS) optical data (Finoguenov et al., 2020), and (3) the South Pole Telescope (SPT) survey, which selected clusters via the Sunyaev-Zel’dovich (SZ) effect (the SPT-SZ survey; Bleem et al. 2015). The full HLS cluster sample will be presented and described by the forthcoming survey paper (Egami et al., in prep.).
With a substantial number of SMG detections at , we specifically selected a subset of exceptionally bright sources and obtained ALMA follow-up observations. The selection criteria used were: (1) SPIRE color to ensure the selection of sources, (2) FIR continuum peak () brighter than 90 mJy if the source is within 1′ from the cluster center, (3) 150 mJy or with a spectroscopic redshift if the source is beyond 1′ from the cluster center, and (4) observable with ALMA (Dec. ). The second criterion is designed to select bright sources at at . The third criterion ensures that the resultant sample includes the brightest sources in the HLS data even if some of them may be boosted by a galaxy component on the line of sight. Due to the coarse resolution of SPIRE, the quoted here is the sum of all sub-mm sources within a radius of ′′. Multiple source systems will be decomposed later using the ALMA data, and these individual sources will not necessarily satisfy the same Herschel selection criteria.
We eventually constructed a sample of 20 sources based on the criteria listed above.333One source in the cluster field SPT J0345-6419 was observed with ALMA but was later identified as a low-redshift IR-bright galaxy rather than a SMG. We therefore removed it from our sample. There are also several other HLS sources satisfying the same brightness criteria, but we do not incorporate them here since they were not observed by ALMA or lie at different redshift range (; e.g., HLS0918, Combes et al. 2012, Rawle et al. 2014; HLS0257, Sun et al. in prep.; HLS2043, Zavala et al. 2015; Walth et al. in prep.).
2.2 Herschel
The HLS has performed far-infrared imaging observations of 581 massive galaxy clusters with a total observing time of 418.7 hours at two typical depths. The HLS-deep survey imaged 54 clusters deeply with PACS (Poglitsch et al., 2010) and SPIRE (Griffin et al., 2010) through an open-time key program (44 targets; PI: Egami; PID: KPOT_eegami_1) and an open-time Cycle 2 program (10 targets; PI: Egami; PID: OT2_eegami_5). Three of the clusters studied here (MACS J1115.8+0129, Abell 2813 and Abell 3088) were observed by HLS-deep, and therefore have a five-band coverage with both PACS (100/160 m) and SPIRE (250/350/500 m). All of the PACS 100 and 160 m observations consist of two orthogonal scan maps, each comprising 18–22 repetitions of 13 parallel 4-arcmin scan legs. The SPIRE observations for the two Abell clusters were performed with 20 repetitions in the large scan map mode, each with two 4′ scans and cross-scans (1.6 h scan for three bands simultaneously). MACS1115 was observed through 11-repetition small scan maps, and each repetition consisted of one scan and one cross-scan of 4′ length (0.4 h scan).
The HLS-snapshot survey obtained shallower SPIRE-only data for 527 clusters through two open-time programs during Cycle 1 and 2 (PI: Egami; PID: OT1_eegami_4, OT2_eegami_6), providing SPIRE data for the remaining 17 clusters studied here. With shallow observations ( min scan) in the small scan map mode, HLS-snapshot provides nearly confusion-limited images in all three SPIRE bands (typical RMS noise 10 at 250, 350 and 500 m, compared with the confusion noise levels of 5.8, 6.3 and 6.8 measured by Nguyen et al. 2010).
Our SPIRE images were produced via the standard reduction pipeline in HIPE v12.2 (Ott, 2010), and the processing routine was detailed in Rawle et al. (2016) for Herschel coverage of the HST Frontier Fields (HFF, Lotz et al. 2017). The observation ID (OBSID) and total scan time of each obtained Herschel/SPIRE observation are summarized in Table 1. HLS-deep PACS images were generated with UniMap (Piazzo et al., 2015) with a pixel scale of 10 at 100 m and 20 at 160 m, also detailed in Rawle et al. (2016).
2.3 ALMA
ALMA Band 6 observations were carried out through project 2015.1.01548, 2016.1.00372 and 2017.1.01658 (PI: Egami) between April 30, 2016 and September 30, 2018. Since four sources exhibit extended structures in the SPIRE images (FWHM20′′ at 250 m), we requested multi-pointing observations for these special cases. We observed all of our 20 targets in one of two spectral window settings. For 15 sources without previous spectroscopic redshift determination, we performed continuum-only observations with a central frequency at 233 GHz (corresponding to 1.287 mm). For 5 sources with prior spectroscopic redshift information, we acquired both dust continuum and at least one CO line spectrum, and thus the final effective frequencies of these continuum products range from 224 to 238 GHz. The diameter of the ALMA field of view (FoV) at the requested frequencies is 25′′. A brief summary of our ALMA observations is also presented in Table 1.
The data were taken in various weather conditions with a median precipitable water vapor (PWV) of 0.77 mm, with the 16th to 84th percentile ranging from 0.56 to 1.84 mm. A median angular resolution of 026 was achieved, and the median maximum recoverable scale was 17.
All the ALMA data were reduced with CASA (McMullin et al., 2007) with the pipelines v4.7.2 and v5.4.1 for observations obtained in different cycles. Before the formal reduction work, we first checked the combined continuum image and spectral cube of each target, delivered by the ALMA archive. If any obvious source was detected above a 4 significance, we would examine the spectral cubes, searching for possible spectral line features, and both line and continuum would be imaged in the natural/Briggs weighting and uv-tapered modes separately. If undetected, we would only produce the continuum images. We performed continuum imaging at four different levels of synthesized beam size: Briggs weighting (robust=0.5), natural weighting (robust=2), 1′′ uv-tapering and 2′′ uv-tapering. These settings were used for visualizing both compact and extended emission structures in the SMGs. Interactive cleaning was performed during each imaging process. The noise level of the final continuum products is with a 1′′-tapered beam, which we used to obtain photometry for most of the targets.
2.4 Spitzer/IRAC
We obtained Spitzer/IRAC Channel 1 (3.6 m) and Channel 2 (4.5 m) images through various programs. The majority of our data were from Program 12095 and 90218 (both PI: Egami), covering 13 of 20 clusters. We also included other data with public access on the Spitzer Heritage Archive444https://sha.ipac.caltech.edu/. This includes Programs 80168, 90213 (PI: Bouwens), 12005, 14281 (PI: Bradac), 60099, 80012 (PI: Brodwin), 60034 (PI: Egami), 30344 (PI: Jarvis), 80162, 90233 (PI: Lawrence), 70149 (PI: Menanteau), 80066 (PI: Rawle), 61061 (PI: Sheth), 12123 (PI: Soifer), 40370, 80096 (PI: Stanford), 14061, 60194 (PI: Vieira). These programs provide 3.6/4.5 m coverages for all the 20 clusters. All of these fields are observed with cycling sub-pixel dithering patterns with four or five dithering points at least.
We started our IRAC data processing from the archive-delivered level 1 (BCD) products. A standard and automatic MOPEX reduction routine was applied with an output pixel size of 06 pixel-1. We registered the output frames with the GAIA DR2 (Gaia Collaboration et al., 2018) using SExtractor (for catalog extraction; Bertin & Arnouts 1996) and SCAMP (for astrometric computation; Bertin 2006). This achieved a final astrometric error of with the produced IRAC images. The median point-source depth in each field, estimated from the variance of sky background, is presented in Table 1.
2.5 Other ancillary data
For a number of clusters, we also included other ancillary data to improve the quality of analysis, mainly for the optical SED fitting. This provides more accurate extinction and stellar mass estimates, compared with IRAC-only analyses:
MACS J0553.4-3342— this cluster was observed with the HST treasury program RELICS (Coe et al., 2019), and therefore we used its 7-band HST data for photometry and SED fitting (ACS/F435W, F606W, F814W and WFC3-IR/F110W, F125W, F140W, F160W).
MACS J1115.8+0129— this cluster was observed with the HST treasury program CLASH (Postman et al., 2012), and therefore its 9-band HST data were utilized (ACS/F435W, F606W, F775W, F814W, WFC3-IR/F105W, F110W, F125W, F140W, F160W). We directly used the processed data of MACSJ0553 and MACSJ1115 available on MAST555Mikulski Archive for Space Telescopes (MAST), https://archive.stsci.edu/.
RXC J2332.4-5358— this cluster was observed through the HST SNAP program 12884 (PI: Ebeling). The WFC3-IR/F110W and F140W images were obtained with an integration time of 706 s per filter. We reduced the data with Drizzlepac v2.1.17 (Gonzaga & et al., 2012) under the PyRAF environment with an output pixel size of 006 pixel-1.
Aperture photometry of SMGs in HST images is conducted with SExtractor. We do not obtain flux measurement of HLS0553-C (blended with a star brighter than the SMG in the F814W band) and HLS2332-C (blended with an irregular galaxy).
RXC J1314.3-2515— This cluster was observed with WFCAM on UKIRT in both the and bands (PI: Walth), and here we only use the NIR photometry of the lensed SMG in this cluster field.
No additional optical/NIR data was included for the analysis of remaining sources. The Herschel sources in RXC J1314.3-2515, MACS J0455.2+0657 and MACS J0600.1-2008 were observed with JCMT/SCUBA-2 at 850 m (Cheale et al., 2019), and here we quote the 850 m flux densities to improve the quality of far-IR SED modeling.
3 Results
3.1 ALMA detection and photometry
To obtain reliable and complete ( mJy) ALMA detections of lensed SMGs in all 20 observed cluster fields, we used SExtractor v2.19.5 (Bertin & Arnouts, 1996) to derive uniform source extraction in all ALMA continuum image products (without primary beam correction). Based on a quick visual inspection of natural-weighted image products without uv-tapering (median beam FWHM ), we found that all of the obvious sources detected in our data were spatially resolved. Since uv-tapering can increase the detectability of extended structures, though at the expense of resolution, we performed the source extraction with the 1′′-tapered image products.
We ran SExtractor for source detection and automatic photometry with Kron-like elliptical apertures (PHOT_AUTOPARAMS values of 1.8 and 2.5) in the primary-beam-uncorrected maps where the primary beam response is greater than 0.2. We estimated the photometric errors () based on aperture-to-beam size ratio () and continuum RMS () according to the following equation:
| (1) |
which is derived from a simulation of applying random apertures (enclosed area as ) on Gaussian-blurred (kernel area as ) Gaussian white noise maps. We also evaluated the photometric uncertainty by directly applying random apertures on source-free regions in ALMA primary-beam-uncorrected maps. We measured the standard deviation of flux densities enclosed within the apertures of identical size, and the results are consistent with the prediction by Equation 1. We then corrected the flux densities and their errors for the gain of primary beam.
Based on this method, we detected 77 sources at S/N3.0 in all ALMA images. Here the S/N is defined as the ratio between the aperture-photometry flux density and its uncertainty (). To eliminate possible false detections, we studied the false detection rate in Appendix A, and found that an S/N cut at 4.0 would ensure the total false detection number to be . We therefore detected 28 sources at S/N4.0 based on the 1′′-tapered images. All of the sources were detected in the area where the primary beam response is greater than 0.5, except for HLS2155-A.
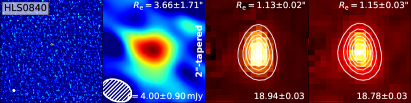
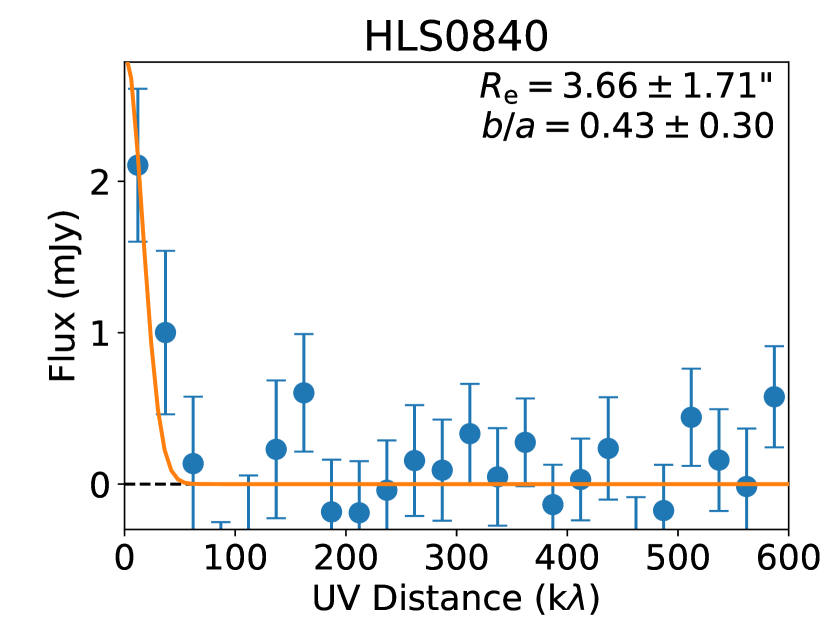
We also included another S/N4.0 detection in 2′′-tapered images, namely HLS0840. This source is exceptionally extended with an ALMA-measured 1.3 mm effective radius of with a relatively low surface brightness. It is split into multiple S/N3 components in our 1′′-tapered image but remains as a single S/N=4.5 source in the 2′′-tapered map. We also detected a point-like mJy source at its center in the 02-resolution image. This might represent the core of the galaxy, although it only contributes % of the total flux density in the 2′′-tapered map. We included this source because of the robustness of the detection in the 2′′-tapered images, and no other similar example was found in our data.
We also studied the completeness of our source extraction in Appendix A. We conclude that the completeness of point-like sources at S/N=5.0 in 1′′-tapered map (0.79 mJy, under the assumption of a median continuum RMS and a primary beam correction of ) is 804%.
In one cluster field, CODEX 52909, we did not detect any significant source. The SPIRE source in CODEX 52909 is extended, and it can be a composite of several ALMA sources at S/N3–3.5 with reddened IRAC counterparts. To avoid any confusion of fake sources in this mosaic ALMA FoV, we did not analyze this field any further.
Because of the noise fluctuation in the ALMA maps, the fluxes of sources at low S/N tend to be overestimated, known as flux boosting effect (e.g., Geach et al., 2017; Stach et al., 2019). We examined this effect for sources detected at relatively low S/N (HLS0546, HLS0840, HLS0043-B and HLS2155-A; Table 2). Assuming the surface brightness profiles measured in Section 3.3, we simulated the visibility data for these sources 10–15 times per each with CASA, and the RMS noise of mock data was controlled to match with that of our observations. We then applied the same imaging and source extraction routine, measured the median output flux densities and compared them with those of input models. Based on our simulations, no conspicuous flux boosting effect was identified.
3.2 Multi-wavelength photometry


3.2.1 Herschel
Herschel/PACS 100 and 160 m flux densities were measured with an aperture radius of 5′′, and the uncertainty was inferred from the variance of sky background. We adopted the aperture correction factors suggested in PACS data handbook. HLS1115 was observed to be 20.73.1 mJy at 100 m and 50.63.8 mJy at 160 m. HLS0307-28-A was observed to be 50.72.0 mJy at 100 m and 110.14.7 mJy at 160 m. HLS0307-28-B was blended with a low-redshift source and remained undetected in PACS images, and the two sources in A2813 fell outside of the PACS footprint.
We measured source flux densities using PSF photometry in Herschel/SPIRE 250, 350 and 500 m images. We assumed point-source models for the majority of ALMA-detected SMGs, except for two extended sources (), HLS0840 and HLS0546, which were fit with a 2D Gaussian model. PSF photometry was conducted using GALFIT (Peng et al., 2010). We used ALMA source coordinates as prior source positions in the SPIRE maps. For single-source cases, we floated the source position in the SPIRE images due to the coarse spatial sampling. If multiple sources exist in a field, the relative positions of their models are fixed. In several cluster fields, we also included other PACS (A2813, A3088) or WISE-detected (RXCJ2155) sources to optimize the fitting through multi-component decomposition.
28 out of 29 ALMA-detected sources were successfully extracted from all three SPIRE bands. HLS0043-B was undetected in the SPIRE 350 and 500 m images, and therefore we only present its upper limit (11 mJy).
3.2.2 Spitzer/IRAC
IRAC photometry was performed with two main methods. Since our targets are located in cluster fields, some of them may be blended with foreground cluster members, decreasing the accuracy of aperture photometry. We use GALFIT to model the source brightness and morphology of 24 cluster-lensed SMGs. The IRAC warm-mission PSFs released by Hora et al. (2012) for Channel 1 and 2 were used for model convolution. The orientation angle of spacecraft was also considered in our modeling routine.
Sérsic and PSF source models were assumed for different sources in IRAC maps. We adopted a Sérsic model for the majority of SMGs, and a range of Sérsic index () between 0.2 and 4.0 was allowed. If the best-fit is beyond this range, we fixed it at 0.2, 0.5 (as Gaussian), 1.0 (as exponential) or 1.5, depending on the goodness of fit. 15 sources have well constrained Sérsic indices in at least one IRAC band, and nine sources were fit with fixed . We also applied a 2D Gaussian model for all the SMGs. Due to the large PSF size (FWHM18) and relative small source size (the median half-light radius along the semi-major axis is ), the degree of freedom for GALFIT modeling was limited, and thus Gaussian fits do not show significant deviations in magnitude or source size from Sérsic fits, as also mentioned by Puglisi et al. (2019).
HLS0043-B and HLS0307-B were fit with PSF models, since their faintness ( 21 mag) and heavy blending with bright foreground sources ( 17 mag) led to a divergence in the Gaussian/Sérsic modeling. The upper limit of their is estimated by the minimum measurable deviation from PSF size (04). HLS1314 is observed as a lensed arc in the NIR images (UKIRT/WFCAM) and poorly modeled with a single Gaussian/Sérsic profile. Therefore, we performed aperture photometry of this source after subtracting nearby sources. Since three clumps were seen in HLS1314 in the 1′′-tapered ALMA map, we also modeled its morphology with triple Sérsic profiles at the positions of the ALMA clumps. When the photometric measurements of the three clumps were combined, the total magnitudes derived in the IRAC images were recovered.
Another five sources, namely HLS1124-A/B, HLS0455, HLS0505 and HLS0600, exhibited irregular morphologies in the ALMA continuum maps, revealing galaxy-lensed rings or multiple components at a resolution of . All of these sources are blended with nearby sources, and their morphologies cannot be well quantified through Gaussian or Sérsic models.
To perform reliable IRAC photometry on these five sources, we adopted their ALMA continuum images as their morphological models in the IRAC bands. We clipped their Briggs-weighted, native Band-6 continua at and then convolved them with the corresponding PSFs as the source models. Based on the -band optical images from the Pan-STARRS DR1 and DES DR1 (Flewelling et al., 2016; Abbott et al., 2018), we set up 2D Gaussian models for their nearby sources, which were also convolved with the IRAC PSFs. We then used an MCMC routine (emcee; Foreman-Mackey et al., 2013) to fit in the IRAC images the brightnesses of the ALMA sources, the effective radii and brightnesses of the optical sources, and the sky background. Photometry of the ALMA sources was then performed with the residual maps after the best-fit models for the nearby sources were subtracted. Figure 16 shows the ALMA images of the SMGs, optical images of nearby sources, and IRAC 3.6/4.5 m images, before and after this MCMC neighborhood subtraction routine.
3.3 Quantitative morphological modeling
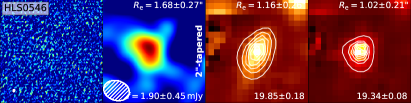
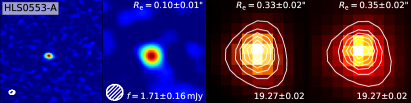
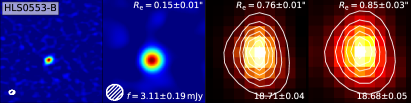
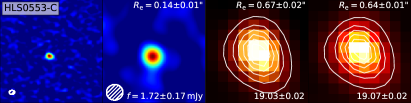
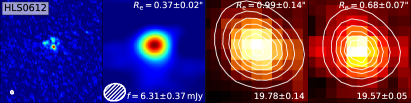
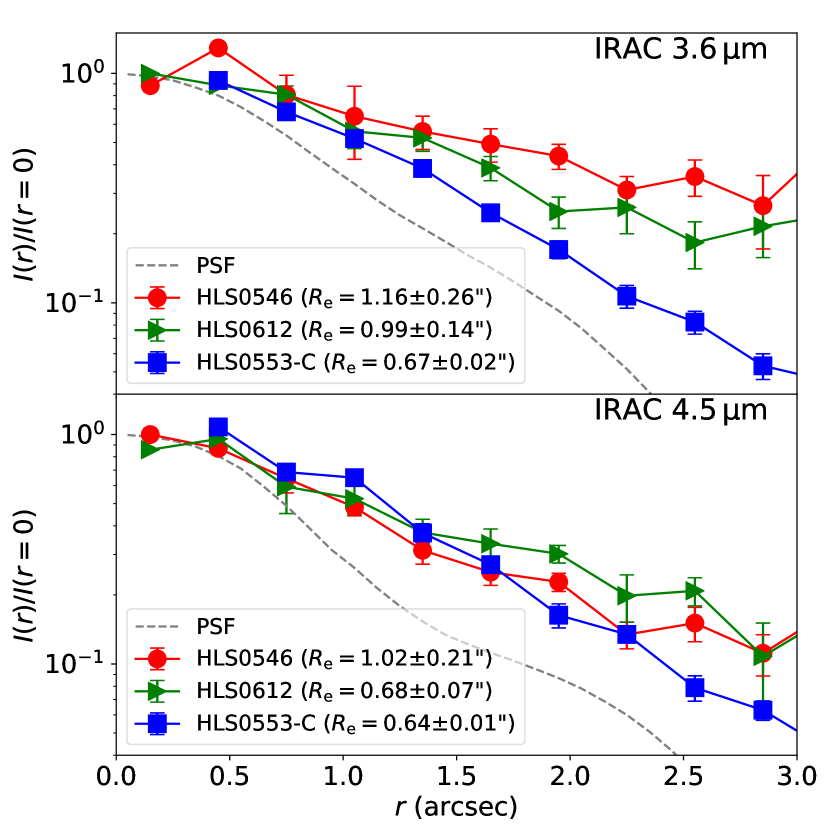
Morphological modeling of our sources in the IRAC images was performed along with photometry using GALFIT, as detailed in Section 3.2. For 24 of our sources with successful IRAC surface brightness profile modeling, we measured a median Sérsic index of 0.9 and 1.0 at 3.6 and 4.5 m, which is close to reported by Chen et al. (2015) for SMGs in the HST/WFC3-IR F160W band. Among the six sources which we display their postage stamp images in Figure 1, the IRAC 3.6/4.5 m radial surface brightness profiles of three representative sources are shown in Figure 2. The median IRAC effective radius is around , corresponding to 6.5 kpc at in physical scale before lensing correction. For the five sources with heavy blending and complex morphology (Figure 16), we did not measure their structural profiles in either the IRAC or ALMA images. Here, we concentrate on the modeling of structural profile of the remaining 24 lensed SMGs at 1.3 mm. As already described, we continue to decompose HLS1314 as three sources, so 26 sources are studied in this subsection.
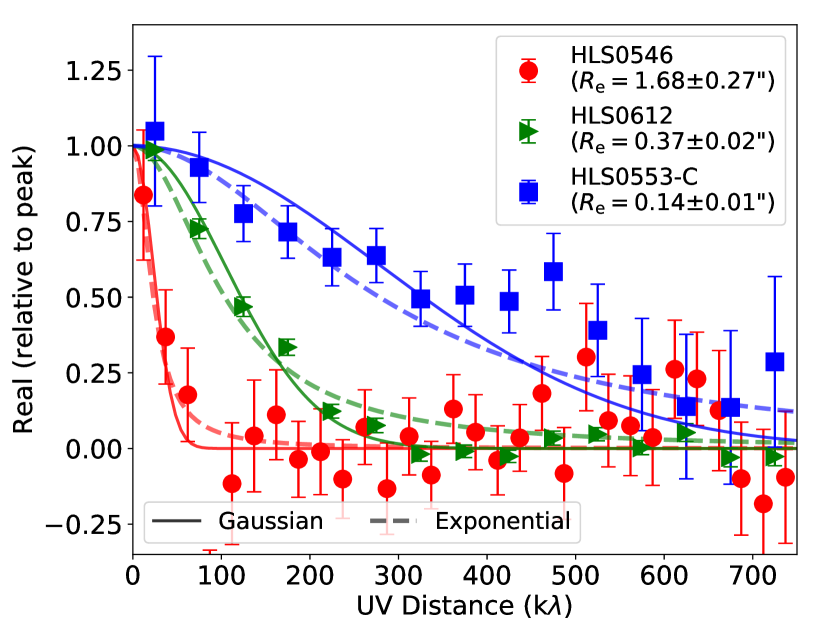
We obtained structural parameters of our sources in the ALMA data, modeling their visibility data using uvmodelfit (for single-source case) and uvmultifit (for multiple-source case; Martí-Vidal et al. 2014), both under CASA environment. We assumed Gaussian models for the surface brightness profile of all sources, consistent with the modeling procedure applied by Puglisi et al. (2019) and Tadaki et al. (2020). We note that Hodge et al. (2016) measured a median Sérsic index of for SMGs, and Gullberg et al. (2019) measured at 870 m. These Sérsic indices are closer to exponential disk profiles () rather than Gaussian ones (). Since the modeled by a Gaussian profile is smaller than exponential one by only dex in Hodge et al. (2016), less than the median uncertainty of in this work ( dex), we keep this Gaussian profile assumption for SMGs in the ALMA data. We used ALMA source positions, flux densities and morphological parameters, obtained through SExtractor photometry, as the initial guess of source models in the uv-plane. Figure 3 shows three representative visibility profiles of lensed SMGs with different values of (length of semi-major axis) shown in Figure 2. There is no clear difference between the of the best-fit circular Gaussian and exponential models for HLS0546 and HLS0553-C, and the Gaussian profile fits HLS0612 better.
There were two cases that required special attention for multiple-source modeling on the uv-plane. HLS0612 was observed to have two minor nearby components in the ALMA high-resolution image (Figure 1), while uvmultifit favored a single-source model. Therefore, we discarded the three-source fitting results. On the contrary, the goodness of a three-source fit with HLS1314 was better than that of a single-source one, so we continued to decompose it into HLS1314-A, B and C, consistent with the structural fitting in the IRAC bands.
The effective radii and their uncertainty of all the 26 sources (24 SMGs and HLS1314 with three components) are presented in Table 3. We also compared the IRAC (average of 3.6/4.5 m) and ALMA source centroids, and did not find any detectable offset (Appendix B).
All of our measured effective radii at 1.3 mm are smaller than their corresponding maximum recoverable angular scales for given ALMA antenna configurations, except for HLS0840 (Figure 4). As a result, the Re measurement of HLS0840 has a large error bar (17). To examine the quality of uv-profile modeling for sources with extended or at relatively low S/N, we also simulated and modeled the visibility data for the same sources as described in Section 3.1 for flux boosting evaluation. The median measured from the 10–15 sets of simulated visibility data for each source is consistent with that of the input model at the confidence level, demonstrating the overall validity of our source-size measurements with ALMA.
3.4 Summary of ALMA and IRAC counterparts
We successfully identified the IRAC counterparts of all the 29 sources discovered with ALMA at , indicating that our sample is free from the contamination by any false detection. Our Monte-Carlo simulation also suggests a low probability (%) of random association between ALMA and IRAC sources. We display all the ALMA and IRAC images of sources in our sample in Figure 1, 16 and 17. We notice that HLS0840 and HLS0546 are two spatially extended sources (′′) at 1.3 mm with exceptionally low surface brightness ( ) and only detectable in uv-tapered ALMA maps instead of those at native resolution (Figure 1). The visibility profiles of these two sources are displayed in Figure 3 and 4.
Although all of the sources were discovered in lensing cluster fields, we identified five sources that are subject to additional boosting by foreground galaxies, i.e., HLS1124-A/B, HLS0455, HLS0505 and HLS0600 as shown in Figure 16. Among the remaining cluster-lensed cases, HLS0553 and HLS2332 are two spectroscopically confirmed triply-imaged systems behind the cluster fields of MACSJ0553 and RXCJ2332, respectively. HLS0553-A/B/C have been reported at by Ebeling et al. (2017), and HLS2332-A/B/C were reported at by Greve et al. (2012). We do not find any other multiply-imaged SMGs in our sample.
For the sources with known spectroscopic redshifts (e.g., from a CO search with the IRAM 30-m telescope; Dessauges-Zavadsky et al., in prep.), our ALMA Band-6 observations also targeted CO lines when possible. We confirmed the redshifts of HLS0553 and HLS2332, and obtained/confirmed redshifts for additional seven sources (Sun et al., in prep): HLS0455 (; Zavala et al. 2015), HLS1314 (), HLS1124-A/B (), HLS0011-A/B () and HLS0600 (). We did not detect any spectral line feature in the ALMA data of the remaining 16 sources, and thus their redshifts remain unknown.
Among the full sample of 29 ALMA sources, we found 16 are potentially isolated sources with no detectable companion brighter than 0.6 mJy at 1.3 mm. We also identified six SMGs that exhibit close companions at similar redshifts, namely HLS1124 (observed as 4 components and grouped as 2 in Table 2; hereby noted as 4/2 and same later), HLS0111 (2/2), HLS0600 (2/1), HLS0612 (3/1), HLS1314 (3/1) and HLS2104 (2/2). Such grouping is determined by the angular separation and SExtractor deblending threshold (3′′) on 1′′-tapered maps. Source groups HLS0111, HLS0600, HLS1124 and HLS1314 are spectroscopically confirmed within a maximum velocity separation of 800 of each other.
4 Physical Properties of the Detected Lensed SMGs
4.1 SED fitting and photometric redshift
We perform SED modeling with the high- extension of magphys (da Cunha et al., 2008, 2015). We also use the photo- extension of magphys (Battisti et al., 2019) to estimate the photometric redshift () and physical properties simultaneously when the spectroscopic redshift () is unknown. magphys assumes a Chabrier IMF (Chabrier, 2003), a continuous delayed exponential star-formation history (SFH), a two-component dust absorption law (Charlot & Fall, 2000) and energy balance between dust absorption in the UV and re-emission in the infrared. Other key components of the model assumptions in magphys have been detailed in Martis et al. (2019).
We adopt our observed photometric measurements to feed the SED fitting routine without applying any lensing magnification correction. This is due to a lack of detailed lens models for several of the clusters in this study. Note, therefore, that all the derived physical quantities are those including the effects of lensing. We also assume that there is no differential magnification effect (i.e., effective magnification factors change as function of the source size and therefore as function of wavelength in general).
For the majority of our sample, their SEDs are modeled using six-band photometry from 3.6 m to 1.3 mm. We also utilize the ancillary data described in Section 2.5 to improve the fitting, especially to constrain the amount of rest-frame optical dust extinction and therefore stellar mass. All the individual best-fit SEDs are displayed in Figure 18, and a summary of the best-fit galaxy properties is presented in Table 4.
The 16–50–84th percentile of the redshift distribution for our sample is 1.23–1.93–2.73, and the highest and lowest photometric redshifts are (HLS1623) and 3.23 (HLS0043-B). Here the is the median of likelihood distribution of redshift for each source. We assess the uncertainty of photometric redshift estimate based on the likelihood distribution obtained with magphys. The typical uncertainty of derived is . HLS1115 exhibits a small of 0.03 because of the existence of 9-band HST data. We also evaluate the far-IR by matching with the LIRG templates in Rieke et al. (2009), and the derived redshifts are consistent with those by magphys within confidence interval.
We also study the dust temperature with far-IR data over a rest-frame wavelength of 50 m, following Greve et al. (2012). We fit the dust continua of all SMGs with modified black-body (MBB). The dust absorption coefficient is assumed to be in the unit of , where is the frequency in GHz in the rest-frame. We assume a fixed dust emissivity of , which is widely adopted in previous studies (e.g., Díaz-Santos et al., 2017; Dudzevičiūtė et al., 2020). We also incorporate the uncertainty of redshift in that of the dust temperature if the is unknown. The dust masses derived from this MBB fitting are consistent with those from magphys, listed in Table 4, with a dispersion of 0.08 dex.
HLS1623 was observed to be much fainter at 1.3 mm compared to the prediction from the SPIRE SED. This may indicate that the SPIRE fluxes are contributed by certain ALMA-undetected components in the same FoV. Here, we use its SPIRE-only SED to assess the dust temperature, but we only use its IRAC and ALMA flux densities for magphys SED fitting.
4.2 Multi-wavelength color and redshift
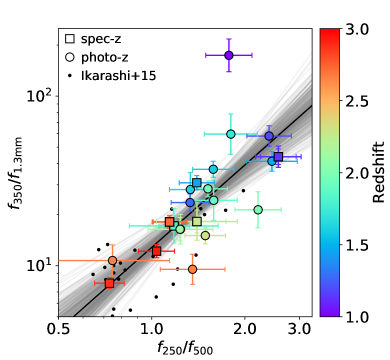
We first compare the FIR colors, namely and , of all galaxies detected in our survey (Figure 5; left). Here we do not use the color of or due to their narrow ranges of distributions. We find the majority of our galaxy exhibit a positive linear correlation between these two color indices. An MCMC fitting through emcee suggests the power-law relation as . This is consistent with the unlensed SMG sample presented in Ikarashi et al. (2015), for which we apply a conversion from 1.1 mm flux densities to 1.3 mm by a factor of 0.53. This indicates red and red colors will occur simultaneously, basically controlled by source redshift and dust temperature.
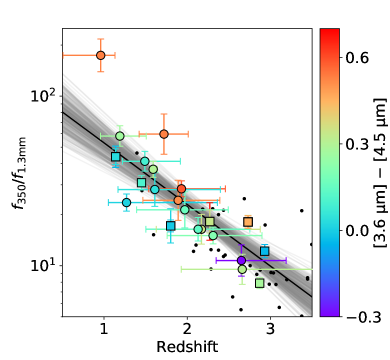
We then compare versus source redshifts, and an exponential relation can be identified against both the spectroscopic and photometric redshift samples (Figure 5; right). Similar MCMC routine implies an underlying relation as , with a standard dispersion of 0.16 dex for the measured ratio. This trend is also consistent with the unlensed sample in Ikarashi et al. (2015) at similar redshift range. Such a correlation suggests that the color of SMGs, at least in this study, is only weakly affected by dust temperature and mainly reflects the redshift.
On the other hand, the IRAC color of our SMG sample seems to show a larger dispersion at any given redshift (see the color coding in the right panel of Figure 5), and thus no substantial correlation can be derived between the IRAC color and redshift. This reflects the complexity of stellar age and dust absorption among our SMG sample. However, we find that at a given redshift, a red IRAC color is likely to occur simultaneously with a blue color. The red IRAC color can be a signature of high dust extinction, and thus a high dust column density and high IR surface brightness (). Since is observed to be correlated with dust temperature at various redshift ranges (e.g., Díaz-Santos et al., 2017; Spilker et al., 2016), this would result in a bluer color as we have shown.
Several galaxies were observed with a red IRAC color (0.5), namely HLS0307-28-A, HLS1623, which suggests high dust extinction in these systems () through magphys SED modeling. Such a high is not seen in AS2UDS sources with secure optical/NIR detection at m (but are founded in sources with IRAC-only detections; Dudzevičiūtė et al., 2020). Due to the lack of deep rest-frame UV and optical data, it is not clear whether the determination of such high values is reliable. In the case of HLS0553 and HLS2332, where HST photometry exists for two of the three triplet lensed images, the HST photometry obtained at m slightly reduces the estimated (by ) and thus the best-fit stellar mass (by dex; note that the median uncertainty is dex if HST data is excluded). This underscores the difficulty of deriving dust absorption in galaxies with only two-band IRAC observations of their stellar continua.
4.3 Star formation in lensed SMGs
The dust-obscured fraction of SFR in a galaxy has been claimed to be correlated with the stellar mass with no conspicuous evolution found with this correlation from redshift 2.5 to 0 (Whitaker et al., 2017). For a galaxy with , 80% of the total star formation is obscured, and for typical SMGs with a stellar mass of (e.g., Hainline et al. 2011; Dudzevičiūtė et al. 2020), this fraction is higher than 95%. Without appropriate lensing correction, we cannot accurately determine the intrinsic stellar mass of our lensed SMG sample. However, the median value is , still well above if a magnification factor correction is applied. Therefore, it is reasonable to assume that the majority of star formation in our sample is dust-obscured, and that the observed IR luminosity (and emitting regions) adequately represent the total SFR (and star-forming regions).
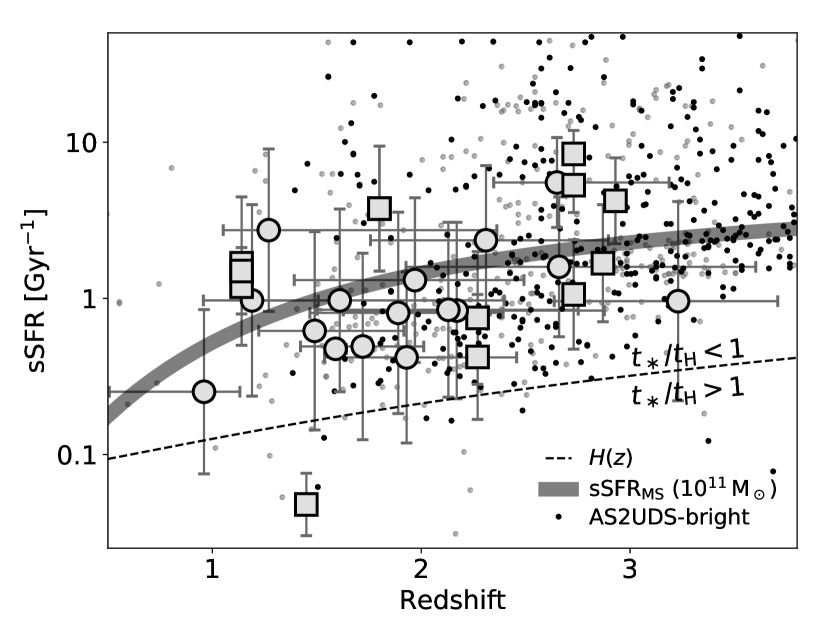
We measure a median total IR luminosity of and thus a median SFR of 55293 without lensing corrections through SED fitting. Figure 6 displays the sSFR versus redshift of all the sources in our sample. The distribution of sSFR in redshift space is consistent with those of galaxies on the so-called star-forming “main sequence” (MS) with a stellar mass of (Speagle et al., 2014), which have a median sSFR of 1.1 and a dispersion of 0.46 dex. If the differential magnification is negligible, sSFR will conserve by lensing, and hence the distribution of sSFR should be the same among lensed and unlensed SMGs.
We also compare the stellar mass doubling time scale (1/sSFR) with the Hubble time () at the redshifts of SMGs in this work. The ratio between these two quantities () can in principle act as an indicator of whether a galaxy is undergoing a significant star-formation event (e.g., Tacchella et al., 2018). We find a median ratio of 0.180.02, suggesting that the majority of our sample are vigorously star forming galaxies. This value is consistent with the median of AS2UDS SMGs at (Dudzevičiūtė et al., 2020), regardless of whether the unlensed SMG is brighter than the single-dish SCUBA-2 detection limit at 850 m (3.6 mJy) or not. Except for HLS1314 (the square point at the bottom of Figure 6), no other galaxy in this study shows .
4.4 Dust to stellar mass ratio

Similar to sSFR, the dust-to-stellar mass ratio (; also referred to as the specific dust mass) and dust temperature are key observables of the properties of star-forming galaxies that are conserved in lensing. Since dust is produced through the process of star formation, the ratio between dust and stellar mass should be closely related to the sSFR. Figure 7 plots the dust-to-stellar mass ratio versus sSFR in all 29 SMGs, color-coded with dust temperature. A positive linear relation can be found between these two quantities, although the normalization is subject to .
Although such a correlation is not a surprise, the wide range of the dust-to-stellar mass ratio and sSFR of this 29-SMG sample is remarkable. Distributed between and , the span of this sample is similar to that of low-redshift galaxies, whose SFRs are distributed between and (da Cunha et al., 2010). The upper end of our distribution matches with previous SMG literature (e.g., Santini et al., 2010; Dudzevičiūtė et al., 2020), while our sample does have a significant excess at . We perform a Kolmogorov–Smirnov (K-S) test of between our sample and AS2UDS SMGs in Dudzevičiūtė et al. (2020, 454 SMGs at ), and a null hypothesis that SMGs in these two samples share the same distribution can be rejected (-value less than 0.01). The lower end of our distribution matches with that of low-redshift dusty early-type galaxies (ETGs; Agius et al., 2013), while still higher than that of dust-poor early-type galaxies (Rowlands et al., 2012, 2015).
The number excess at the lower end of the distribution can actually be a signature of evolved systems with lower gas fraction and dust destruction in the post-starburst stage (e.g., Rowlands et al., 2015; Li et al., 2019). Applying a Scoville et al. (2016) conversion from luminosity at a rest frame of 850 m () to the molecular gas mass (), we find a low gas fraction () of for four sources at . We further discuss this issue of dust-to-mass ratio and its implication in Section 5.4.2.
Assuming a gas-to-dust ratio of 100, we calculate the gas depletion time scale () for our sample, and the median value with 1 dispersion is Myr. This is consistent with the median value of AS2UDS sample ( Myr) recomputed with similar method (Dudzevičiūtė et al., 2020).
4.5 Dust-to-stellar continuum size ratio
SMGs are generally found to host dust continua that are more compact than the stellar ones (e.g., Hodge et al., 2016, 2019; Lang et al., 2019; Gullberg et al., 2019). This can be interpreted as an evolutionary connection from SMGs to cQs at slightly lower redshift: after star formation ceases in a 1 kpc-scale region at the galaxy center, a cusp of stellar component will remain in this region, which can be observed to be compact and quiescent (e.g., Toft et al., 2014; Simpson et al., 2015; Barro et al., 2016a; Lang et al., 2019).
We adopt the half-light radii measured at 1.3 mm ALMA uv-plane () as the effective radius of dust continuum (noted as ) and thus the star-forming region. We note that this ignores any radial gradients of dust temperature or opacity that could alter the measured size of dust continuum. Based on the FIRE-2 simulation, Cochrane et al. (2019) predicted that the effective radius of dust emission goes up with the observed wavelength in the submillimeter/millimeter. This is because observations at longer wavelengths are more sensitive to the cooler gas and dust components in the outer region. With an effective rest-frame wavelength of m for our sample, the measured is not expect to vary by more than 10% due to the difference in the sampled wavelength.
With the IRAC data, we define the effective radius as the geometric mean of the effective radii measured at 3.6/4.5 m (). At , IRAC Channel 1/2 samples the rest-frame bands with a similar angular resolution. Adopting the Calzetti et al. (2000) extinction law, dust extinction in the rest-frame bands ( and ) will only be 0.3/0.2 of . For a median in this study, the dust extinction in the IRAC 3.6/4.5m bands is 0.9/0.6, which is only 8% of the extinction seen in HST bands for SMGs in Lang et al. (2019). Therefore, the intrinsic stellar distribution should be close to the light profile in the IRAC bands, without significant overestimate of the effective radius of stellar mass distribution due to the concentration of dust extinction at the galaxy center. We measure the effective radius ratio between 3.6 and 4.5 m as for our sample, and such a consistency between the radii seen in the two bands also suggests the weak influence of dust extinction on light profiles. Therefore, we directly adopt the as a representation of the effective radius of stellar mass (noted as ).
One caveat is that the measured does not account for the stars which are fully dust-obscured, and thus the derived from an energy-balanced SED fitting code does not necessarily represent the extinction to the full stellar mass component (e.g., Casey et al., 2014b). As pointed out in Lang et al. (2019), it is possible that a compact and obscured stellar component remains undetected at the ALMA/IRAC continuum centroid (e.g., Simpson et al., 2017), resulting in an even more compact configuration of stellar mass than the IRAC light profile.
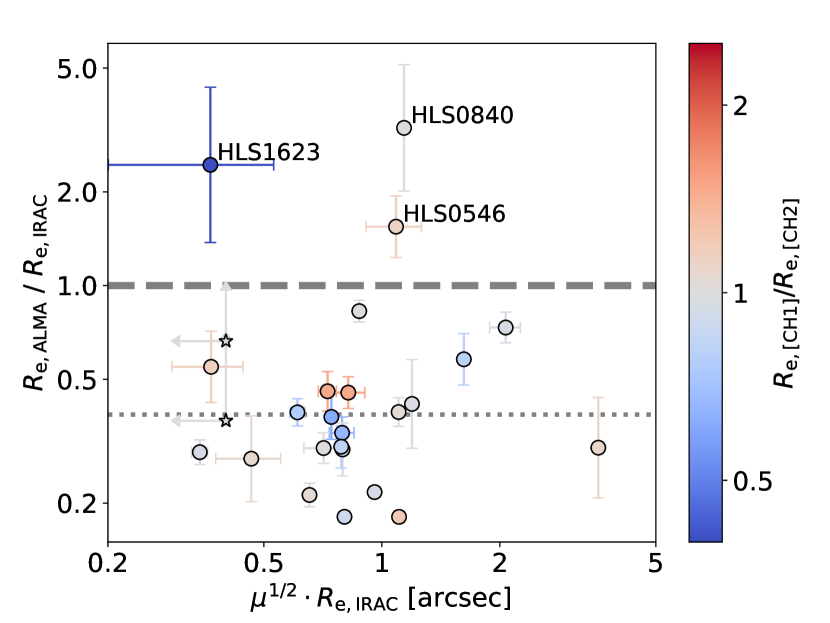
The comparison of the effective radii of dust and stellar continua is shown in Figure 8. Except for three sources (HLS1623, HLS0546 and HLS0840), 23 out of the 26 sources have more compact ALMA dust continua relative to their stellar components. The median dust-to-stellar continuum size ratio () is 0.38, with a 1 distribution from 0.28 to 0.73. Lang et al. (2019) presented a of , similar to our measurement. This is much smaller than the dust-to-stellar size ratio of local spiral galaxies (, e.g., Hunt et al. 2015).
4.6 IR surface luminosity and dust temperature
Since all of the 26 sources (except for heavily-blended galaxy-lensed cases) are resolved in the ALMA 1.3 mm maps, we are able to obtain the surface luminosity of their dust continua. This should also be a conserved quantity independent of lensing magnification. We hereby define the IR surface luminosity as , and thus is the average IR surface luminosity within a radius of . Note that at a rest-frame wavelength of 440 m, the is expected to trace the size of cold dust component and star-forming region better than the far-IR emission (e.g., 70 m continuum size used in Díaz-Santos et al., 2017). Due to the effect of radial gradient or dust optical depth, the at the wavelength of FIR SED peak would be smaller than the (e.g., Cochrane et al., 2019), and thus the might be underestimated. The conversion factor between IR and 1.3 mm surface brightness () is for sources in our sample, and the factor between surface SFR density and IR luminosity () is .
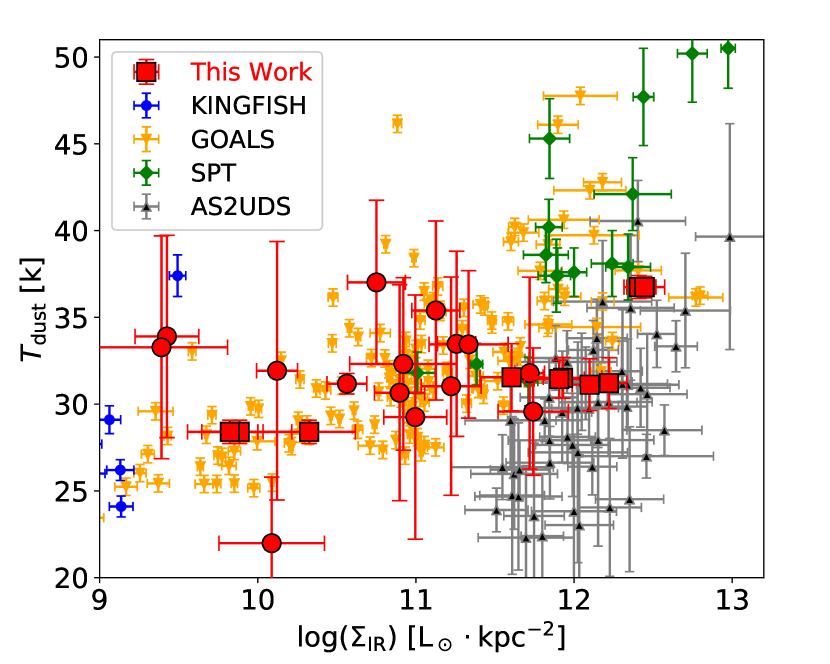
We plot the dust temperature versus IR surface luminosity in Figure 9, comparing the distribution with those of the GOALS (local LIRG/ULIRGs; Díaz-Santos et al. 2017), AS2UDS ( SMGs; Gullberg et al. 2019; Dudzevičiūtė et al. 2020), SPT ( SMGs; Spilker et al. 2016; Strandet et al. 2016) and KINGFISH (nearby galaxies; Skibba et al. 2011; Hunt et al. 2015) galaxies. Galaxies in this work exhibit a wide 3 dex range of from to . Such a range of does resemble that of the local (U)LIRGs in the GOALS sample.
We find that the dust temperature of SMGs in this work is barely correlated with the IR surface luminosity. At , the lensed SMGs exhibits comparable dust temperature as local LIRGs (Díaz-Santos et al., 2017, also assumed ). This indicates that the relation for LIRGs may not evolve with redshift up to . Symeonidis et al. (2013) analyzed Herschel-selected LIRGs at and suggested no significant evolution of dust temperature at a constant IR luminosity () across . However, ULIRGs () at are much cooler than their local analogs or more optically thick. Assuming that is well correlated with the intrinsic (reported at various redshifts, e.g., Rujopakarn et al., 2011; Lutz et al., 2016; Fujimoto et al., 2017), our result is consistent with Symeonidis et al. (2013) but extending out to .
At , the lensed SMGs in our sample seem to show lower dust temperature than both local ULIRGs and SPT sources (biased towards galaxy-lensed cases), but consistent with SMGs in AS2UDS sample ( based on 870 m continuum size; Gullberg et al. 2019; Dudzevičiūtė et al. 2020). However, such a comparison is limited to the sample size since only two independent sources in our sample (HLS0553 and HLS2332) are at .
4.7 Dust-to-stellar size ratio versus IR surface luminosity
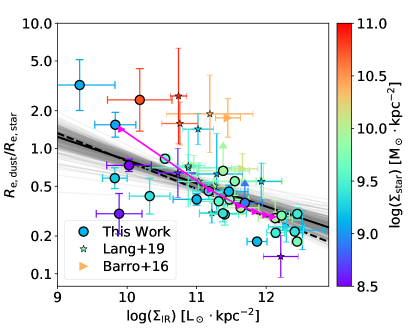
We then investigate how the dust-to-stellar continuum size ratio is correlated with other physical quantities. Similar to Lang et al. (2019), we do not find any obvious correlation between the size ratio and sSFR on integrated-galaxy scales. However, we do find that this continuum size ratio is well correlated with FIR surface luminosity, plotted in the left panel of Figure 10. We find that with the increase of , the dust-to-stellar continuum size ratio decreases slowly. We fit a linear relation through emcee, and the best-fit relation for our 26 sources is shown as follows:
| (2) |
where is in the unit of .
We also incorporate six compact star-forming galaxies (cSFGs) presented in Barro et al. (2016a) and 14 SMGs presented in Lang et al. (2019) into a combined dataset of 46 sources. All of these sources are around with accurate ALMA image-plane morphology modeling at 870 m. The of the six cSFGs in Barro et al. (2016a) was measured using HST/WFC3 F160W images without any correction for dust extinction ( is as low as ). of 14 SMGs in Lang et al. (2019) was also based on F160W imaging but corrected with a pixel-to-pixel map. A similar MCMC fitting to these 46 sources shows the following relation:
| (3) |
which is consistent with the fitting of 26 HLS sources within . Such a linear relation is relatively tight over the 3.1 dex range of distribution. We measure a standard deviation of the 46 sources from the best-fit correlation as 0.21 dex, and the typical uncertainty of effective radius ratio is dex.
We also fit the data with least-squares method and bootstrapping. The derived relation and its uncertainty are consistent with those by MCMC (slope is ). If and are (i) random variables with a narrow distribution and (ii) independent of distributed over a wide range, then one should expect to derive a linear relation between and with a slope of . We also generate mock dataset of , and that satisfies our selection criteria (i.e., above certain thresholds of and ) and matches our measurements with respect to the variance, and the resultant slope is . However, our fittings suggest that such a slope can be ruled out at a confidence of , indicating that the observed relation is physical and not a direct consequence of the relatively wider distribution range of .
4.8 Stellar surface density
One of the remarkable properties of compact quiescent galaxies (cQs) is their inferred ultra-high stellar surface density ( within effective radius; e.g., van Dokkum et al. 2008; van der Wel et al. 2014). Such a compact configuration of the stellar component indicates a previous star-formation history at a similarly compact scale. This could be achieved through a nuclear starburst, since galaxy interaction/merger and disk instability can cause gas inflows and thus trigger the central stellar density enhancement (e.g., Hopkins et al., 2008).
We define as the average stellar mass within , namely , similar to the definition of . The of our SMG sample ranges between and , with a median value of (unit: ), similar to that seen for SMGs by Hodge et al. (2016). Just like , is a conserved quantity with respect to gravitational lensing.
We first compare the of our sample with the general galaxy population in similar redshift and mass ranges. van der Wel et al. (2014) showed that for early- and late-type galaxies at with a stellar mass of , which is close to that of our SMG sample, the median should be and , respectively. Therefore, the majority of galaxies in our sample do match the stellar surface density of early-type galaxies rather than the late-type, although a test on the plane (e.g., Hodge et al., 2016) cannot be performed due to the incompleteness of lensing magnification.
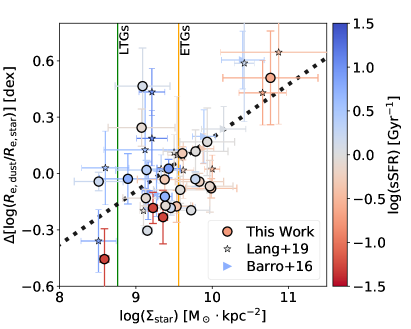
We then color-code the plot with as shown in the left panel of Figure 10. Although a tight linear relation can be found between the two quantities, we notice that the deviation of continuum size ratios from the best-fit relation seems to be correlated with . We then plot this residual of versus in the right panel of Figure 10. An MCMC linear fitting under the assumption of equal weighting of all data points suggests a positive relation between the two quantities as:
| (4) |
where is in the unit of .
This indicates that the relation shown as Equation 3 holds for the majority of SMGs with a stellar mass surface density of roughly . With the enhancement of the central stellar mass surface density above , SMGs will show larger ratio than the regular relation. This may reflect not only a newly-formed cuspy stellar profile in the galaxy center, but also potentially the quenching of concentrated star formation and dissipation of dust remnant through multiple physical process (e.g., stellar or SMBH feedback), which we discuss further in Section 5.3.3.
We also note that the vertical scatter in the right panel of Figure 10 is related with the sSFR at the galaxy-integrated scale, as color-coded in the diagram. At a given , the increase of galaxy-wide sSFR will lead to the growth of , which can be a trivial result of the fact that since sSFR is proportional to FIR luminosity and thus when conserves.
5 Discussion
5.1 Discovery of spatially extended SMGs with low surface brightness
One major discovery of this work is the existence of spatially extended SMGs with a low IR surface luminosity ( ), e.g., HLS0546 and HLS0840. These galaxies exhibit extended dust continua compared with the stellar ones, and their FIR surface luminosities are 1 dex lower than those of typical SMGs at ( ; e.g., Hodge et al. 2016; Gullberg et al. 2019 and this work).
A galaxy with a similar has been reported by the ALMA Frontier Fields Survey (e.g., A2744-ID05, ; González-López et al. 2017; Laporte et al. 2017). However, the dust continuum of this galaxy is relatively compact ( kpc) even compared with the size of stellar continuum measured with HST/WFC3-IR ( kpc). Such a small dust-to-stellar size ratio is different from the extended nature of the SMGs reported here. HLS0546 and HLS0840 are also different from the spatially extended SMG at , SMM J02399-0136 ( ; Genzel et al. 2003; Ivison et al. 2010) because of even lower and a lack of merger feature for our sample. Most recently, Tadaki et al. (2020) reported the discoveries of HST-selected massive ( ) star-forming galaxies at with kpc. The dust-to-stellar size ratio and IR surface luminosity of these sources are generally consistent with those of spatially extended SMGs reported here.
It should be noted that currently spatially extended SMGs with a low IR surface luminosity density ( ) can only be detected and resolved through ALMA observations with deep integration (e.g., pointed observations such as Tadaki et al. 2020; blank-field surveys such as 1.2 mm ASPECS, González-López et al. 2020; Aravena et al. 2020) or of lensing-cluster fields (this work or ALMA Cycle 6 large program ALCS, Kohno et al., in prep.). Previous ALMA Band-6 surveys in cosmological deep fields (e.g., HUDF, Dunlop et al. 2017; GOOD-S, Franco et al. 2018; Hatsukade et al. 2018) can only reach a 4 depth of at 1.3 mm, which is not sufficient to detect these low-surface-brightness galaxies ( ). Without lensing, these extended SMGs would remain barely resolved with a 1′′ beam, and therefore further uv-tapering of the data would hardly improve the detectability of these galaxies. Galaxy-lensing usually results in difficulty of source-plane reconstruction, especially in the rest-frame optical due to the existence of a bright foreground lensing galaxy, introducing large uncertainties into multi-wavelength comparison at spatially-resolved scales. In contrast, cluster-lensed SMGs, often with a magnification factor of and reduced contamination from foreground objects, are significantly stretched spatially (′′). Therefore, the detectability of cluster-lensed intrinsically extended SMGs can be substantially improved by uv-tapering (as shown in Figure 1) or high-sensitivity facilities with a larger beam size and recoverable angular scale.
5.2 Central starburst vs. galaxy-wide star formation
Qualitatively, one simple way to explain the observed correlation between and seen in Figures 10 (the left panel) is to assume a model in which a compact dust component ( kpc) with a varying surface luminosity ( ) is superposed on an extended component ( kpc, ). In this model, the former corresponds to central starburst while the latter corresponds to galaxy-wide star formation (e.g., a star-forming disk). Such a two-component model was also suggested by Gullberg et al. (2019) based on the morphological evidence from an SMG stacking analysis. In this model, as the compact component (i.e., the central starburst) increases its brightness, increases while decreases, and the trend will reverse when the compact component fades.
In the left panel of Figure 10, we overplot the behavior of this two-component model (the solid magenta line), using a set of representative values for various parameters. More specifically, the effective radii of the compact and extended dust components were fixed to 1 and 5 kpc. The infrared luminosity of the extended component was fixed to L☉ while that of the compact component was varied between 0 and L☉ to mimic the rise/decline of the central starburst. was then measured for the combined source. For the stellar component, and were assumed to be 3.5 kpc and M☉. As Figure 10 shows, this simple two-component model reproduces the observed trend well.
5.3 Structural evolution of SMGs
5.3.1 Main sequence offset
To evaluate the star-forming properties of the observed SMGs further, we calculate the offset between the observed SFR and that of the expected on the star-forming main sequence, which is a function of redshift and stellar mass (e.g., Speagle et al., 2014; Schreiber et al., 2015). This quantity is commonly referred as the main-sequence offset (), and here the SFR on the main sequence () is calculated using the formula given by Speagle et al. (2014). Following Aravena et al. (2020), we also define the boundaries of the main sequence as , and classify sources above/below the main sequence as starburst/passive galaxies.
The accurate derivation of requires the knowledge of intrinsic SFR and stellar mass and thus the magnification factor (). Based on published cluster mass models of MACS1115 and MACS0553 (Oguri, 2010; Zitrin et al., 2015; Ebeling et al., 2017), we derive a median magnification factor of for HLS1115 and HLS0553-A/B/C. Therefore, we assume a lensing magnification of for all the 26 sources uniformly with morphological measurements. We show that for a lensed SMGs with an intrinsic stellar mass of , an uncertainty of dex (i.e., a factor of ) with a lensing magnification factor would lead to an error of only 0.12 dex with . This is smaller than the uncertainty of observed, lensing-boosted and SFR. Therefore, is a relatively robust quantity against the uncertainty of magnification factor.
Figure 11 displays the distribution of main-sequence offsets and stellar masses for the joint 46-source sample. A general agreement between the lensed and unlensed sample is clear, justifying the use of as a representative magnification factor for the lensed sample. One may notice an anti-correlation between the and . However, this could be the consequence of a selection bias against relatively low-mass () galaxies without starburst.
Among the full sample, six (nine) sources can be classified as starburst (passive) galaxies. The remaining 31 sources are therefore galaxies on the main sequence. K-S tests suggest no significant difference among the redshift distribution of the three subsamples.
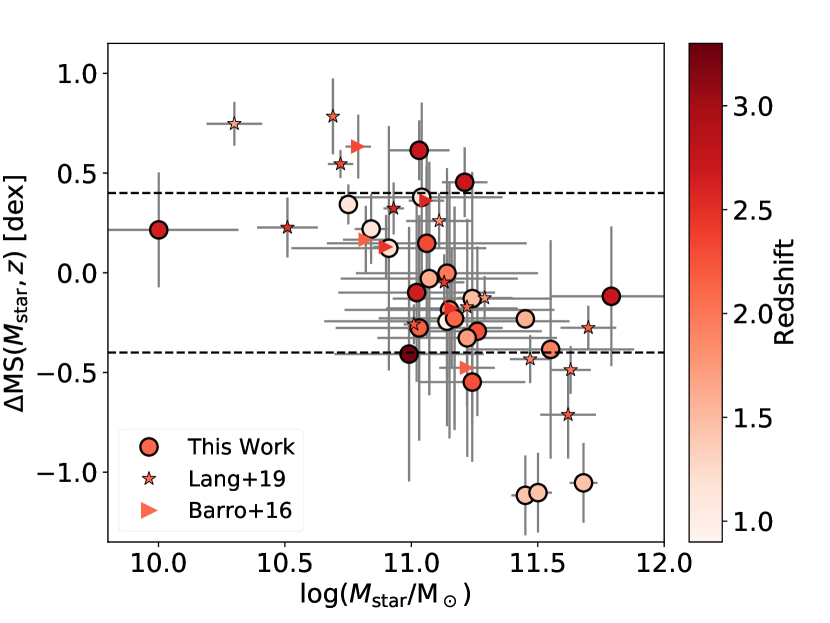
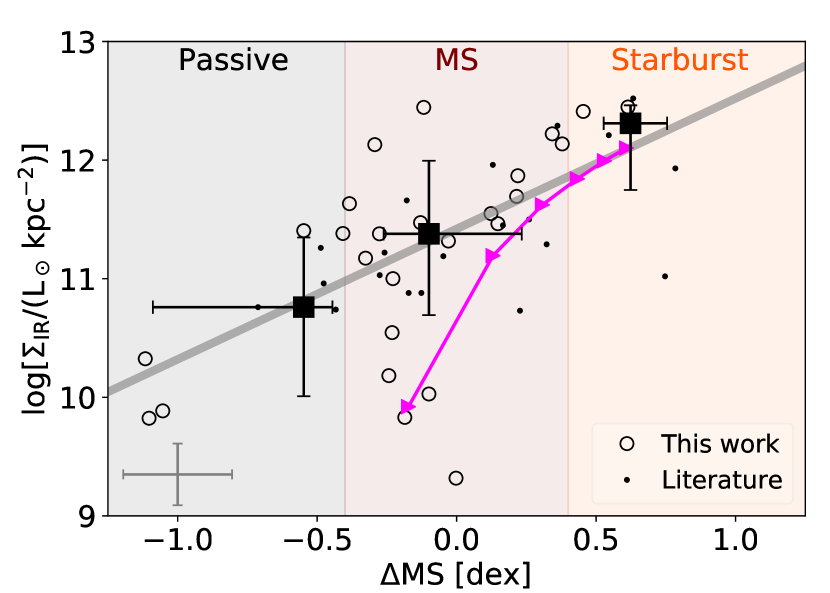
Figure 12 (the top panel) shows the relation between the IR surface brightness and main-sequence offset. There is a positive correlation between these two quantities, and an MCMC fitting to the joint 46-source sample suggests , although the dispersion is considerable (0.62 dex) for the measured IR surface luminosity. Such a large dispersion was also seen in Elbaz et al. (2018), indicating that central starbursts may or may not be present in galaxies which apparently fall near the main sequence. This relation demonstrates that sources with larger are generally galaxies with more vigorous central star-forming activities and thus higher surface density of IR luminosity. Note, however, that the spatially extended SMGs reported in Section 5.1 are on the star-forming MS, indicating that extended dust continua reflect active star formation over the whole galaxy.
5.3.2 MS offset versus dust-to-stellar size ratio
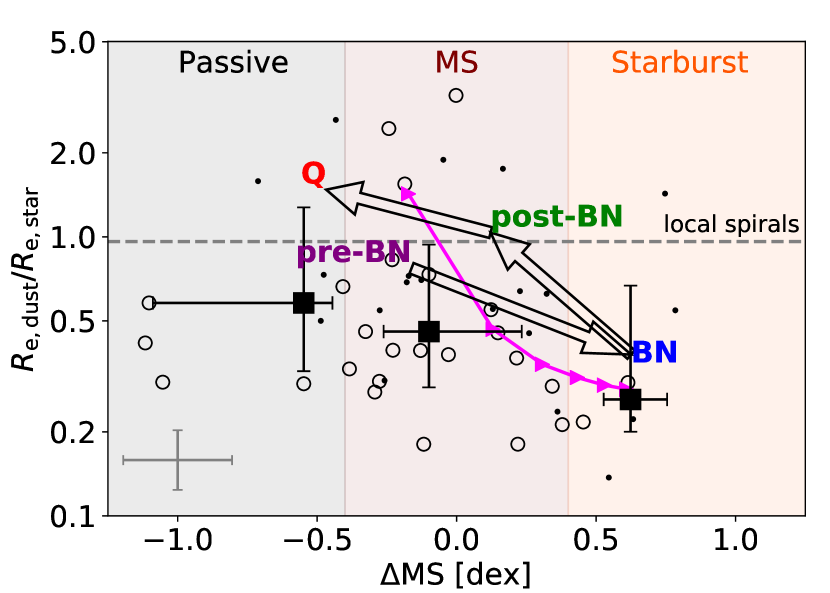
According to Figure 10 and Section 4.7, one should further expect an anti-correlation between the and . Figure 12 seems to show a weak anti-correlation between the dust-to-stellar size ratio and main-sequence offset. A least-squares linear fitting with bootstrapping suggests the slope is less than zero but only at a significance. Similar conclusion has been made in Lang et al. (2019) where the authors claimed no conspicuous relation was found between sSFR and .
In Figure 12, we also plot the two-component model discussed in Section 5.2 (the solid magenta line). Unlike the left panel of Figure 10, this simple model does not produce a good fit in either plot. This is because in these plots, the observed SMGs exhibit a large spread in and , reflecting the diversity of apparently main-sequence SMGs in the sense that some of them are dominated by central starburst while others are dominated by galaxy-wide star formation (as noted by Puglisi et al. 2019). Since the two-component model, as defined in Section 5.2, assumes a transition of SMGs from those dominated by central starburst to those dominated by galaxy-wide star formation as sSFR decreases from the starburst to main-sequence range, it fails to reproduce the main-sequence SMGs dominated by central starburst. In order to reproduce this population of compact main-sequence SMGs with this type of two-component model, it would be necessary to decrease the luminosity of galaxy-wide star formation further.
5.3.3 Comparison with theoretical evolutionary tracks
To better understand the observed trends and underlying properties of the observed SMGs, we further investigate the distribution of in the lower panel of Figure 12 by comparing with theoretical predictions from cosmological simulations. By stacking the simulated galaxy profiles of different evolutionary phases, Tacchella et al. (2016) suggested that the radial profile of sSFR declines from center to outskirts during the central starburst phase, resulting in a concentrated star-forming region with a smaller radius when compared with that of evolved stellar continuum. However, after the gas compaction and central enhancement of SFR, quenching then starts from the center as a combined effect of gas depletion due to star formation, feedback and truncation of further gas inflow. Compared with the galaxy center, the outskirts can still retain a ring-like star-forming region, increasing the ratio of .
Through this so-called compaction and “inside-out” quenching scenario, the main-sequence offset (and thus IR surface luminosity) of an SMG can increase and subsequently decline, and the dust-to-stellar size ratio will decline first and then rise. Such behaviors of a galaxy evolution model are generally consistent with the trends as we see in Figure 10 and 12.
To conduct a quantitative comparison with the theoretical predictions, we utilize the radial profiles of and for 26 simulated galaxies presented in Tacchella et al. (2016). The median stellar mass of these galaxies is at , and Tacchella et al. (2016) stacked the radial profiles into four evolutionary phases, namely pre-blue nugget (pre-BN), blue nugget (BN), post-blue nugget (post-BN), and quenching (Q) phase with increasing time. Here, the BN refers to a massive compact star-forming galaxy of high central density in stellar mass, following Zolotov et al. (2015), although the blue stellar population in our systems is heavily dust reddened and therefore would appear red, making “blue” nugget somewhat a misnomer. Using the stacked and profiles, we compute the main-sequence offset and the ratio between the effective radii of star-forming region and stellar component in these four phases, and overlay the evolutionary trend with arrows in the bottom panel of Figure 12. We assume the BN phase occurs at , i.e., the age of the universe at in the unit of Gyr. The remaining three phases are assumed to occur at , and Gyr, consistent with the time range reported in Tacchella et al. (2016).
We find that the observed distribution of and generally matches the theoretical evolutionary tracks. The slopes of these arrows are less than zero, consistent with the tentative negative slope reported in Section 5.3.2, and the vertical offset between the pre-BN BN and post-BNQ trend can also explain the large dispersion of seen around the main sequence.
We find that the five main-sequence SMGs with more extended dust continua (i.e., ; including the two extended SMGs reported in Section 5.1) hold a higher stellar mass surface density (mean ) than the 26 main-sequence compact sources at (mean ). This indicates that SMGs with more extended dust continua are likely at a later evolutionary phase than those compact ones.
One minor mismatch is that the compact/extended SMGs exhibit a even lower/higher than the theoretical predictions. This result is tentative because the SMG sample is biased to a higher stellar mass (median ). By dividing the simulated galaxies at into two mass bins, Tacchella et al. (2016) reported that galaxies with higher stellar masses show a more noticeable evolutionary pattern of the profile. This will likely result in a broader distribution of at various evolutionary phases. Therefore, we suggest that our observations are consistent with the theoretical evolutionary track of galaxies in a gas compaction and potentially subsequent “inside-out” quenching process, which can be the driver of the tight correlation seen in Figure 10.
5.3.4 Further test of the evolutionary sequence
Future observations of spatially extended SMGs may testify whether they are undergoing a starburst and subsequent quenching process. This can be performed through NIR spectroscopy by providing tighter constraints on instantaneous SFR (e.g., through H spectroscopy, sensitive to star formation in previous Myr; Kennicutt & Evans 2012; although this is subject to dust obscuration) and comparing with the dust-based one which traces the star formation at a longer duration ( Myr). If the properly dust-corrected H SFR is significantly smaller than the dust-based one, then it is very likely that the galaxy is in a quenching phase, since the H emission can also be contributed by AGN activity. In addition to this, NIR spectroscopy can also probe the stellar age (e.g., through 4000 break; Barro et al. 2016b; Newman et al. 2015, 2018) and thus the evolutionary stage of the galaxy (but only for the less obscured stellar populations).
Previous works also reported a stronger [N II] 6585 flux compared with that of H in a fast-quenching galaxy (Barro et al., 2016b) and cluster-lensed cQs (Newman et al., 2018). A high value of the [N II]/H ratio is typical of the LINER galaxies in the BPT diagram (Baldwin et al., 1981), suggesting a suppressed star formation, which has been observed in low-redshift red-sequence or post-starburst galaxies (e.g., Yan et al., 2006), although possible AGN contamination will be an issue with LINER-like spectra in general. For most of the targets in this work, such an analysis is inaccessible due to the general lack of -band photometry and spectroscopy, and thus the true SFH can only be determined accurately with more observational data.
5.4 The evolutionary picture of SMGs
5.4.1 Trigger mechanism of SMGs
Our ALMA observations suggest that late-phase wet-wet major merger could be the triggering mechanism for 27% (6 out of 22 cases) of the SMGs studied in this work because of the existence of companions (angular separation of in the image plane) at similar redshift (Section 3.4; e.g., Bournaud et al. 2011). Our derived major-merger pair ratio (27%) is consistent with Fujimoto et al. (2017, as 27%) and An et al. (2019, as 22%), but note that we do not have a uniform survey of companions due to the cluster lensing effect, and therefore our measurement should be a lower limit.
The remaining 16 sources in this work are potentially isolated SMGs with no companion brighter than mJy at 1.3 mm, a quarter of the median ALMA flux density we measured for the primary sources. Since a stellar mass ratio as between the major and minor components is widely adopted to distinguish major and minor merger (e.g., Lotz et al., 2011; Man et al., 2016), under the assumption that FIR flux ratio equals to stellar mass ratio for galaxies in a merging system, our observations suggest no evidence of major-merger companion for 73% of the SMGs in this lensed sample. Note that we cannot rule out the possibility that some SMGs are in the late phase of major merger (e.g., separation is kpc between various components), which should be further tested through high-resolution observations of gas kinematics (e.g., Litke et al., 2019; Neeleman et al., 2019).
Based on the companion search, the co-centered distribution of dust/stellar continua and the evolutionary trends presented in this work, we conclude that SMGs could be triggered by a variety of mechanisms including major merger, minor merger and secular burst, consistent with the conclusions in Fujimoto et al. (2017), Rujopakarn et al. (2019), Lang et al. (2019) and Jiménez-Andrade et al. (2020). Such a diversity of triggering mechanism is different from what we have seen in galaxies of comparable infrared luminosities in the local Universe, i.e., ULIRGs, in which the major merger is the prevalent mode of igniting a circumnuclear starburst (e.g., Sanders et al., 1988).
We find no clear difference of the central and total sSFR between the 27% SMGs with close FIR-bright companions and the rest of our sample. This suggests that other mechanisms like minor mergers (e.g., Gómez-Guijarro et al., 2018), mergers with gas-poor companions and secular inflow of gas (e.g., Dekel & Burkert, 2014) may trigger the star formation in the core of SMGs at comparable intensity as the major merger. However, we also stress that there are a number of caveats in our analysis of the merging fraction, most notably being the need for companions to be FIR-bright and to lie close enough in the source plane to suffer comparable amplification, which may weaken these conclusions.
5.4.2 The connection between SMGs and cQs
Previous studies have suggested that SMGs are linked to the cQs seen at slightly lower redshift. The evidence includes the matched number densities (e.g., Simpson et al., 2014; Dudzevičiūtė et al., 2020), clustering properties (e.g., Hickox et al., 2012; An et al., 2019) and size/mass similarities (e.g., Barro et al., 2016a; Lang et al., 2019). In this subsection, we discuss about the possible evolutionary connection between SMGs and cQs using those physical quantities that are independent of lensing effects.
We show that a subset of SMGs in our sample exhibits similar dust-to-stellar mass ratios (four at ) as early-type galaxies at low redshift (Figure 7). Such a low dust-to-stellar mass ratio is consistent with the stacked quiescent galaxies (Gobat et al., 2018). Assuming a gas-to-dust ratio of 100, these galaxies also match with the post-starburst (PSB) galaxies reported in Suess et al. (2017). One caveat is that the lack of NIR data may lead to an overestimate of dust extinction and thus stellar mass through an energy-balance approach in the SED fitting (e.g., HLS1623), but we show that for HLS1314 with accurate -band photometry, its is tightly constrained and thus its can be determined as , similar to the values for PSBs and early-type galaxies quoted above.
We also show that the stellar surface density () of SMGs in this work match better with early-type than late-type galaxies at similar redshift (van der Wel et al., 2014), in the right panel of Figure 10. Since the spatial distribution of star-forming regions in SMGs is typically more compact than those of stars, the ongoing intense star formation will lead to an even higher in later phases, increasing the difference from the typical value of late-type galaxies at that cosmic age. Such a comparison has been conducted by Barro et al. (2013), Hodge et al. (2016) and Lang et al. (2019) via HST imaging and interpreted as structural consistency between the stellar components of SMGs and quiescent galaxies, suggesting a possible evolutionary link after the cessation of star formation in SMGs.
We further show that the IR surface luminosity and spatial extent of extended SMGs in this work may match with SMGs in a transitional phase to quiescent galaxies. Gullberg et al. (2019) showed the existence of an extended dust component ( kpc) of typical SMGs through stacking 153 of them in the ALMA Band 7. Such an extended component is reported to contribute to of the total emission at 870 m, and the corresponding surface luminosity is , under the assumption of typical SED of an SMG at . Furthermore, in the sample of Gullberg et al. (2019), the FIR surface brightness of the compact dust component ( kpc) decreases with the declining of total while it remains the same for the extended component (Figure 13).
In this work, we do discover SMGs with an IR surface brightness comparable to the faint and extended component of SMGs reported by Gullberg et al. (2019), and such a comparison is presented in Figure 13. Taking HLS0546 ( ) as an example, assuming a reasonable lensing magnification of , the physical effective radius of the dust continuum will be kpc. Consider the radial gradient of dust temperature, this result could be consistent with the size of the extended dust continuum of a typical SMG observed at rest-frame 220 m (Gullberg et al., 2019). This magnification assumption will also lead to a de-magnified stellar mass of and kpc, within a 1 distribution of early-type galaxies seen at the given redshift (van der Wel et al., 2014). Therefore, it is possible that after the dissipation of central star formation on a compact physical scale ( kpc), SMGs will maintain a low-level IR surface brightness over a more extended galaxy structure ( kpc), as suggested by the evolutionary tracks in Section 5.3.3. At the same time, the previous concentrated star formation would lead to the formation of compact ( kpc) quiescent and spheroidal galaxies within a timescale of Myr. Therefore, spatially extended SMGs with large dust-to-stellar radii ratio in this study may provide possible evidence of evolutionary connection between typical SMGs and compact quiescent galaxies at slightly lower redshift.
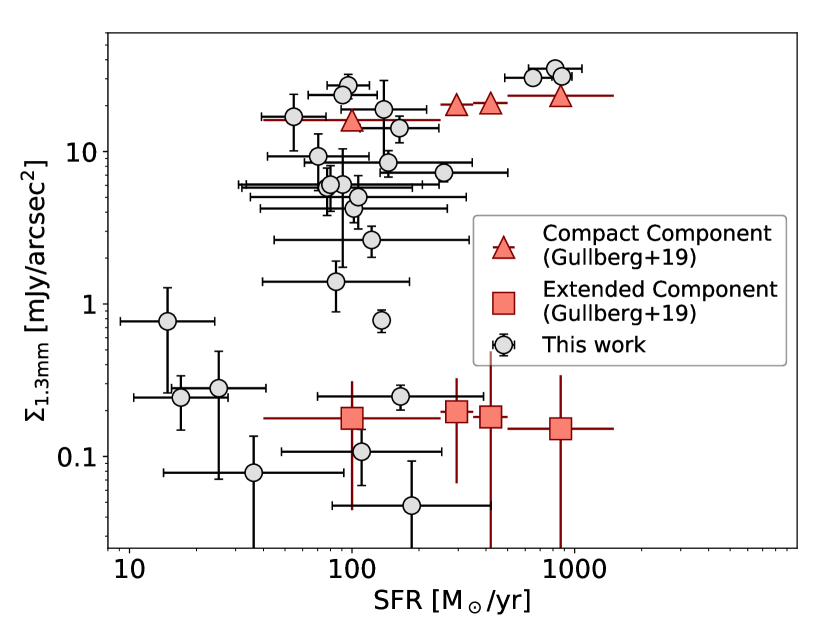
6 Summary
We have obtained and analysed ALMA 1.3 mm, Herschel/SPIRE 250/350/500 m and Spitzer/IRAC 3.6/4.5 m data of 29 lensed SMGs in 20 cluster fields. These SMGs were discovered by the Herschel Lensing Survey as exceptionally bright sources in the far infrared ( mJy). We have carried out modeling of their structural profiles in both the IRAC and ALMA bands, as well as their SEDs from NIR to millimeter wavelengths. Since accurate lens models are not yet available for many of the observed SMGs, we focus our discussion on quantities that are independent of lensing effects, such as surface brightness and size ratios. When necessary, we also assumed a canonical magnification factor of . The main results of this study are the following:
-
1.
29 sources were detected in our uv-tapered ALMA 1.3 mm maps at S/N4.0. Five sources are identified as galaxy-lensed or highly-blended cases, and their IRAC fluxes were successfully decomposed using ALMA and optical priors. The remaining 24 sources are cluster-lensed SMGs, and all of their dust continua were spatially resolved (HLS1314 is resolved as three components).
-
2.
Because of gravitational lensing, we were able to resolve the structural profile of stellar continuum in 24 out of 26 SMGs in Spitzer/IRAC bands. 88% of the SMGs in this study show smaller half-light radii in dust continua compared with the stellar ones. The medium was found to be 0.380.14. Two sources (HLS0840 and HLS0546) are discovered as spatially extended main-sequence SMGs with low surface brightness ( at 1.3 mm) and only detectable in uv-tapered ALMA maps.
-
3.
We fit the SED of all the observed SMGs with MAGPHYS, deriving their physical properties such as SFR and stellar/dust mass. The dust-to-stellar mass ratio of SMGs is correlated with sSFR (at galaxy scale; subjected to dust temperature ), and four of them exhibit , resembling dusty early-type galaxies rather than typical SMGs at .
-
4.
We find that the IR surface luminosity () of SMGs in our sample spans over a wide range of 3 dex, similar to that covered by local (U)LIRGs in the GOALS sample (Díaz-Santos et al., 2017). At a given below , our SMGs show consistent dust temperature as local LIRGs, indicating no significant evolution of relation for LIRG-like galaxies from to the present Universe. At , the of ULIRGs at are lower than those of the local ones as reported previously (e.g., Symeonidis et al., 2013; Dudzevičiūtė et al., 2020).
-
5.
We find that the IR surface luminosity of SMGs is anti-correlated with the dust-to-stellar source size ratio (). Compared with a simple analytic model and cosmological simulations (Tacchella et al., 2016), this relation could be interpreted by the morphological evolution of SMGs through central starburst and potentially subsequent inside-out quenching: the central starburst leads to an increase in and compaction of star formation (i.e, smaller ), and in a following quenching phase, SFR quickly declines from the center (smaller ) but retains a considerable level at the outskirts, resulting in a larger .
-
6.
The distribution of spatial offset between the dust and stellar continua in SMGs does not support any intrinsic offset rather than astrometric uncertainty. of the SMGs can be visually identified as late-stage wet-wet major-merger pair (consistent with Fujimoto et al., 2017; Lang et al., 2019). Therefore, it is possible that SMGs could be triggered through a variety of mechanisms, including major/minor merger and secular evolution, although lensed samples are not well suited to identify early-stage mergers due to the spatially varying magnification.
-
7.
Our observations are consistent with the hypothesis that SMGs are progenitors of the compact quiescent galaxies at slightly lower redshift. This is because (1) low-sSFR SMGs show dust-to-stellar mass ratios () comparable to those of compact early-type or post-starburst galaxies, (2) the high stellar surface densities of SMGs match those of early-type galaxies rather than late-type ones at similar redshift, and finally (3) spatially extended SMGs in this work exhibit low IR surface luminosity, matching some expected properties of SMGs in the transition phase to cQs.
The discovery of spatially extended SMGs in this study expands the population of submillimeter-selected galaxies to a lower FIR surface luminosity limit, and therefore provides direct observational constraints on the evolution of dusty starburst galaxies which may be in the quenching phase. Further studies of these (possibly) transitional systems will help to establish the evolutionary picture of massive galaxy at the epoch when the cosmic SFR density peaks (Madau & Dickinson, 2014).
Appendix A False detection rate and Completeness of ALMA Detections
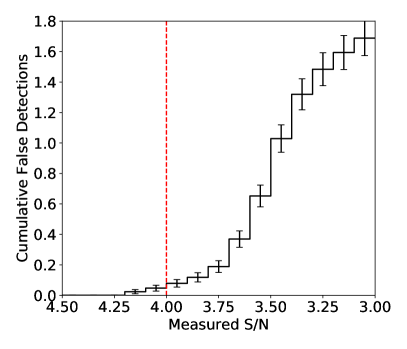
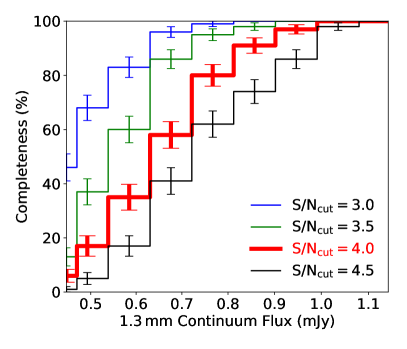
We investigated the false detection rate and completeness of our ALMA detections. We generated Gaussian white noise maps and smoothed them with a 2D Gaussian kernel to simulate the noise distribution of ALMA continuum images obtained with a 1′′ beam. We then run SExtractor on the mock noise maps with the same settings used for the scientific maps, and treated all the extracted sources as false detections. This experiment demonstrates that for a typical ALMA Band 6 single-pointing FoV at this uv-taper, we expect to detect fake sources at S/N3, fake sources at S/N3.5, but only at S/N4 (Figure 14, left). Therefore, for the purpose of eliminating false detections, we applied an S/N cut of our detections at S/N=4. This ensures the total false detection number to be in all of our ALMA maps.
We also studied the point-source detection completeness through similar simulation. We generate 100 sources with a given flux density on a Gaussian white noise map, comparable to the combined area of 20 single-pointing FoVs. We then blur the image with a 2D Gaussian kernel of FWHM=1′′, simulating the 1′′-tapered continuum images. This mock image was fed into the same SExtractor routine for source detection, and we counted the number of recovered detections. Such an experiment is repeated at various input source strength, and the completeness as a function of source flux density is shown in the right panel of Figure 14. Based on our simulations and a S/N cut of 4.0, our detection is complete for point sources at S/N=4.0, corresponding to a flux density of 0.63 mJy for median continuum RMS (0.105 mJy) and half-radius primary beam correction (). At S/N=5.0 (0.79 mJy for median continuum RMS), the point-source completeness is . Therefore, our ALMA survey is fairly complete for any point source brighter than 0.9 mJy.
Note that Franco et al. (2018) showed the completeness of ALMA detection decreases dramatically for larger galaxy sizes. With 06-tapering, their 1.1 mm observation is 94% complete for point sources at 1.2 mJy but only 9% for FWHM=06 sources. We notice that 7 out of 26 sources with our FIR morphology modeling exhibit effective radii . Assuming similar completeness curves as Franco et al. (2018) while scaled to 0.1 mJy continuum RMS and 1′′-tapering, our completeness can be lower than 50% at 1.4 mJy for these extended sources.
Appendix B Spatial offset between ALMA and IRAC counterparts
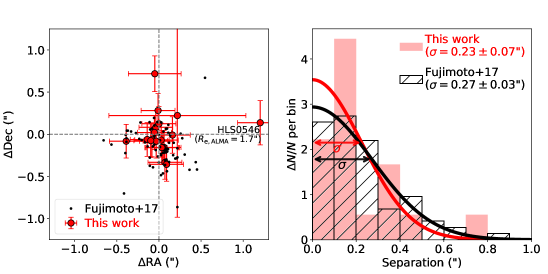
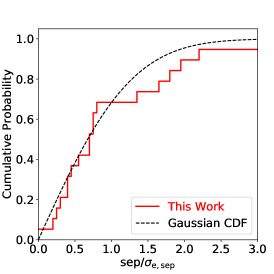
Through our IRAC morphological fitting in Section 3.2, the sky coordinates of 19 out of 26 ALMA sources were allowed to vary, so we compare these IRAC positions (average of 3.6/4.5 m) with ALMA positions obtained from the uv-plane fitting. We find that the mean offset between ALMA and IRAC sources is in RA and in DEC. Assuming an uncertainty of 02 with IRAC images (i.e., of PSF FWHM), the expected standard error of the dust/stellar offset is 005 if the stellar and dust continua are co-centrally distributed, matching our result.
We compare our lensed SMGs with unlensed sample compiled in Fujimoto et al. (2017). In their work, the authors conducted a large-sample analysis of 1 mm ALMA sources on the uv-plane, and a significant number of sources are also covered in the HST CANDELS fields (van der Wel et al., 2012), enabling precise measurements of the offset between the dust and stellar continua in SMGs at . We cross-matched these two catalogs and identified the HST counterparts of 73 SMGs with a maximum allowed separation of 1′′. The spatial offset between the dust and stellar continuum center in each source is plotted in the left panel of Figure 15. The histograms of the dust/stellar offsets in these two SMG samples are shown in the middle panel of Figure 15, and the Gaussian fittings of these histograms suggest a standard deviation between dust and stellar continuum centroids as in our lensed sample, and in the sample of Fujimoto et al. (2017).
Such a comparison suggests an intrinsically small spatial offset between the centroids of stellar/dust continua in lensed SMGs, since our offset measurements are amplified by lensing. Though HST has a higher angular resolution and thus a higher precision in determining the centroid of SMG in the optical/NIR bands, strong dust obscuration could affect the observed morphology of stellar continuum in HST (e.g., Hodge et al. 2016). Such an effect can probably bias the direct spatial mapping between observed stellar light in the near-infrared and the intrinsic stellar mass (also suggested by Lang et al., 2019), result in an underestimate of the uncertainty for stellar centroid determination in HST images (e.g., Chen et al., 2015).
The only SMG showing offset larger than 1′′ is HLS0546, which is an extended SMG () with high Sérsic index () for stellar component. These features may suggest that HLS0546 has already entered a late phase of SMG evolution, showing cuspy stellar component at its center and ongoing star formation at outskirts as discussed in Section 5.3.3. This can cause the observed offset if the star-forming regions are not symmetrically distributed in the galaxy disk plane.
We further show that such a distribution of dust/stellar offsets may be primarily due to astrometric errors through a K-S test. We keep the assumption of the stellar position uncertainty as 02 for IRAC images, and the uncertainties of dust continua are determined during the uv-plane fitting (median value is 004). We cannot rule out the null hypothesis that the sample of spatial offsets relative to astrometric errors are drawn from a Gaussian distribution (p-value as 0.909). Assuming a slightly lower IRAC astrometric error (e.g., 015) will not change the conclusion. Since the co-centered distribution of stellar and dust continuum will result in a Gaussian distribution of spatial offsets relative to their uncertainty, this K–S test demonstrates that we cannot rule out the co-centered distributing scenario between the ongoing star formation and the evolved stellar population in SMGs.
Appendix C ALMA, IRAC images and SED plots of all sources
Here we show the multi-wavelength images, i.e., ALMA 1.3 mm (native and tapered) and Spitzer/IRAC 3.6/4.5 m images, of five highly blended SMGs in Figure 16 and 20 cluster-lensed SMGs in Figure 17. We also present magphys best-fit SED of all sources in Figure 18.

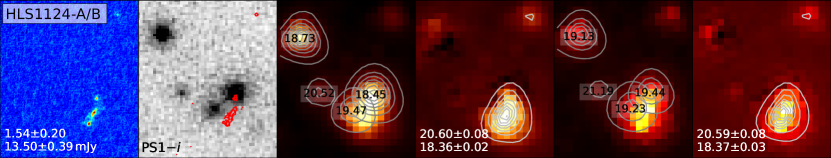
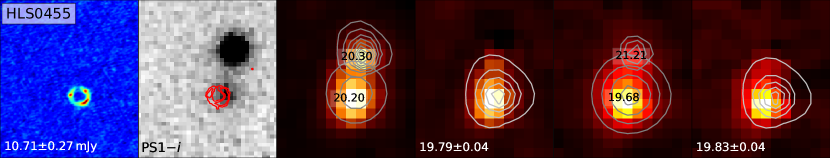
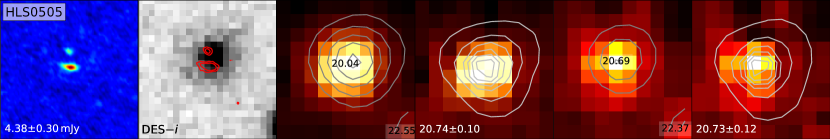
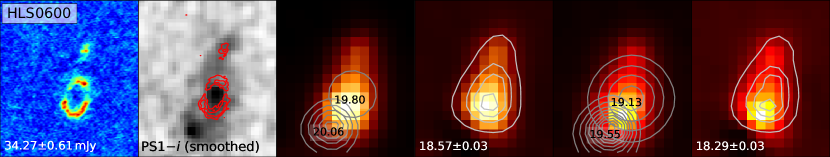


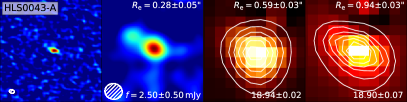
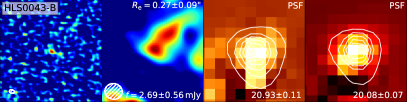
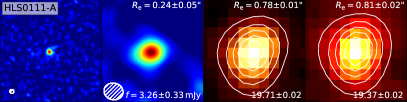
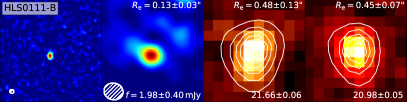
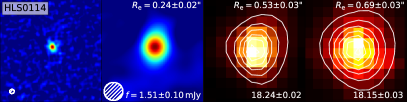
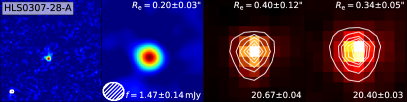
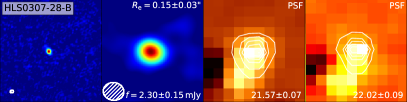
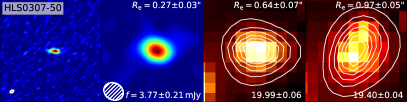
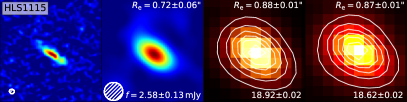
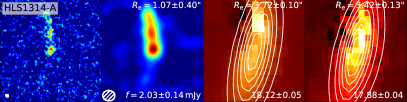
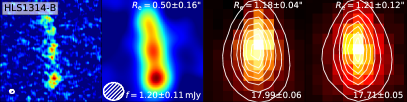
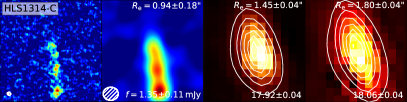
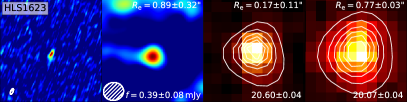
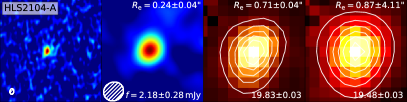
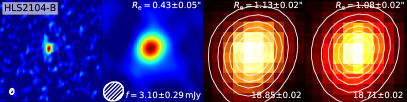
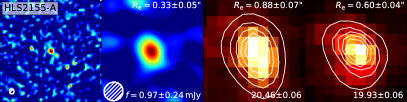
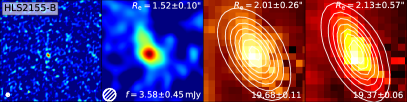
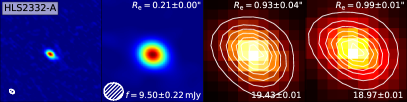
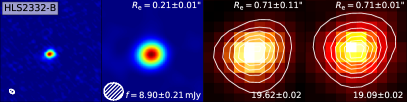
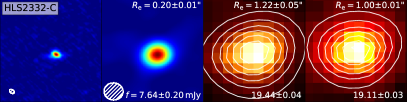
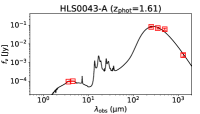
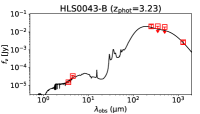
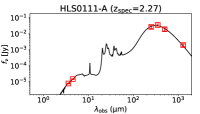

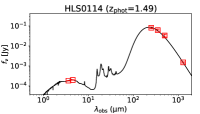
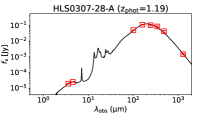
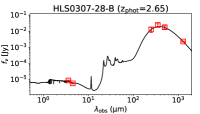
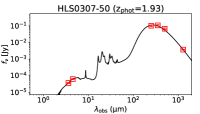
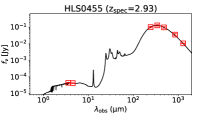
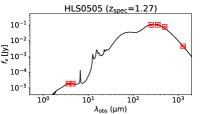
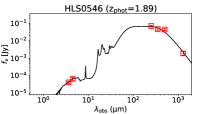
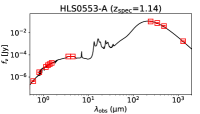
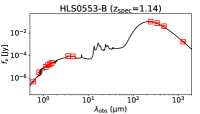
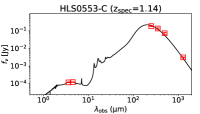
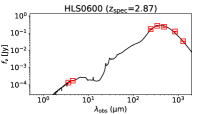
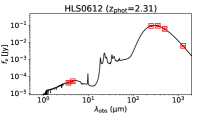
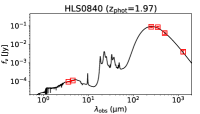
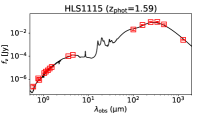
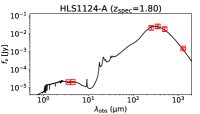
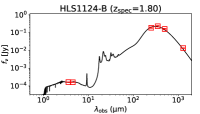
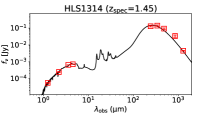
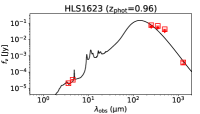
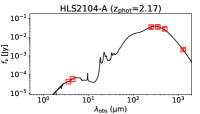
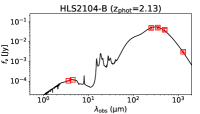
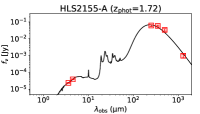
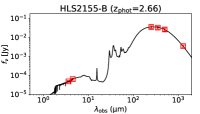
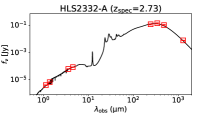
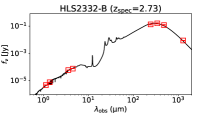
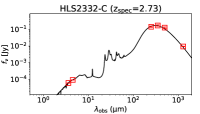
| Cluster Name | CoordinatesaaCoordinates of the ALMA pointing centers, not the exact positions of the ALMA-detected sources. | Herschel/SPIRE | ALMA Band 6 | Spitzer/IRAC | |||||
|---|---|---|---|---|---|---|---|---|---|
| RA | Dec | OBSID | bbTotal observation time. For the ALMA observations obtained in the “single” pointing mode, this is the full on-source integration time. For SPIRE and the ALMA multiple-pointing observation, this indicates the full scan time for the scientific targets. | PointingccMode of ALMA observations (single or multiple pointings). | bbTotal observation time. For the ALMA observations obtained in the “single” pointing mode, this is the full on-source integration time. For SPIRE and the ALMA multiple-pointing observation, this indicates the full scan time for the scientific targets. | RMSddContinuum RMS noise with a 1′′ uv-tapered beam. | Program ID | DeptheeMedian point-source depth in the final IRAC 3.6/4.5 m image products. | |
| (s) | (s) | () | (mag, mag) | ||||||
| SPT J0114–4123 | 1:14:39.38 | –41:24:03.1 | 1342247867 | 169 | single | 907 | 0.038 | 12095 | 22.27, 22.37 |
| SPT J0307–5042 | 3:07:49.38 | –50:41:39.1 | 1342240119 | 169 | single | 302 | 0.111 | 12095 | 22.28, 22.39 |
| SPT J0505–6145 | 5:05:33.14 | –61:43:55.0 | 1342229231 | 169 | single | 195 | 0.116 | 80162 | 21.23, 21.60 |
| SPT J0546–5345 | 5:46:39.76 | –53:45:18.2 | 1342240055 | 445 | single | 302 | 0.104 | 60099, 70149 | 22.78, 22.84 |
| SPT J0612–4317 | 6:12:03.68 | –43:17:10.8 | 1342240063 | 169 | single | 302 | 0.148 | 80012, 90233 | 21.42, 21.78 |
| Abell 2813 | 0:43:35.41 | –20:42:00.4 | 1342188582 | 5803 | single | 121 | 0.169 | 60034 | 23.62, 23.65 |
| Abell 3088 | 3:07:08.09 | –28:40:17.4 | 1342188659 | 5803 | single | 604 | 0.067 | 80066 | 22.69, 22.65 |
| CODEX 35646 | 16:23:46.51 | 26:34:11.7 | 1342239984 | 169 | single | 302 | 0.126 | 90218 | 22.28, 22.26 |
| CODEX 39326 | 11:24:02.22 | 24:04:38.4 | 1342256839 | 169 | single | 532 | 0.101 | 12095 | 22.25, 22.17 |
| CODEX 52909 | 11:53:20.37 | 07:56:00.3 | 1342247962 | 169 | multiple | 171 | 0.150 | 90218 | 22.38, 22.29 |
| MACS J0111.5+0855 | 1:11:27.73 | 08:55:28.6 | 1342237548 | 169 | single | 151 | 0.142 | 90218 | 22.39, 22.33 |
| MACS J0455.2+0657 | 4:55:17.97 | 07:01:02.6 | 1342229655 | 169 | single | 433 | 0.097 | 90218 | 22.24, 22.13 |
| MACS J0553.4–3342 | 5:53:27.79 | –33:42:35.1 | 1342227700 | 169 | multiple | 134 | 0.114 | 12005, 12123 | 23.14, 23.43 |
| 14281, 90218 | |||||||||
| MACS J0600.1–2008 | 6:00:23.90 | –20:06:38.0 | 1342230801 | 169 | single | 423 | 0.106 | 12005, 12123 | 23.10, 23.20 |
| 90218 | |||||||||
| RXC J0840.5+0544 | 8:40:32.09 | 05:45:01.1 | 1342230784 | 169 | single | 302 | 0.195 | 12095 | 22.21, 22.04 |
| MACS J1115.8+0129 | 11:15:50.76 | 01:30:41.1 | 1342256866 | 1580 | single | 866 | 0.042 | 80168, 90213 | 23.66, 23.56 |
| RXC J1314.3–2515 | 13:14:21.43 | –25:15:47.8 | 1342236193 | 169 | single | 1512 | 0.043 | 90218 | 22.24, 22.13 |
| RXC J2104.8+1401 | 21:04:54.78 | 14:01:43.6 | 1342211300 | 169 | single | 302 | 0.078 | 90218 | 22.40, 22.45 |
| RXC J2155.6+1231 | 21:55:41.33 | 12:31:50.8 | 1342211302 | 169 | multiple | 616 | 0.047 | 30344, 90218 | 22.18, 21.91 |
| RXC J2332.4–5358ffHere we distinguish two portions of ALMA observations of R2332 obtained at different modes with slightly different spectral window settings. The multiple-pointing observation contains all the three components of this lensed SMGs with CO(7-6) coverage, and the single-pointing one targets pure dust continua of only two components. | 23:32:26.46 | –53:58:41.2 | 1342234736 | 169 | multiple | 605 | 0.088 | 40370, 60099 | 22.64, 21.84 |
| 60194, 80096 | |||||||||
| RXC J2332.4–5358ffHere we distinguish two portions of ALMA observations of R2332 obtained at different modes with slightly different spectral window settings. The multiple-pointing observation contains all the three components of this lensed SMGs with CO(7-6) coverage, and the single-pointing one targets pure dust continua of only two components. | single | 141 | 0.064 | ||||||
| Galaxy ID | Short ID | CoordinatesaaALMA coordinates of detected source. | Spitzer/IRAC | Herschel/SPIRE | ALMA | |||||
|---|---|---|---|---|---|---|---|---|---|---|
| RA | Dec | [3.6 m] | [4.5 m] | S/NpeakbbDefined as the maximum signal-to-noise ratio of peak flux density () among the four-level continuum images (Section 2.3). | ||||||
| (deg) | (deg) | (mag) | (mag) | (mJy) | (mJy) | (mJy) | (mJy) | |||
| HLS J004335.3–204203 | HLS0043-A | 10.89702 | –20.70082 | 18.940.02 | 18.900.07 | 81.68.1 | 70.37.7 | 61.27.3 | 9.9 | 2.500.50 |
| HLS J004335.1–204159 | HLS0043-B | 10.89642 | –20.69959 | 20.930.11 | 20.080.07 | 20.75.0 | 11.0 | 11.0 | 4.7 | 2.690.56 |
| HLS J011127.9+085525 | HLS0111-A | 17.86606 | 8.92353 | 21.660.06 | 20.980.05 | 27.35.4 | 36.05.7 | 19.54.4 | 19.4 | 1.980.40 |
| HLS J011127.7+085529 | HLS0111-B | 17.86547 | 8.92467 | 19.710.02 | 19.370.02 | 45.16.3 | 59.47.1 | 32.25.3 | 19.1 | 3.260.33 |
| HLS J011439.3–412404 | HLS0114 | 18.66373 | –41.40105 | 18.240.02 | 18.150.03 | 81.58.1 | 62.37.2 | 33.35.3 | 26.5 | 1.510.10 |
| HLS J030707.7–284017 | HLS0307-28-A | 46.78209 | –28.67132 | 20.670.04 | 20.400.03 | 103.09.2 | 85.68.6 | 43.06.0 | 24.6 | 1.470.14 |
| HLS J030708.2–284027 | HLS0307-28-B | 46.78405 | –28.67422 | 21.570.07 | 22.020.09 | 13.34.7 | 24.75.0 | 17.84.2 | 36.2 | 2.300.15 |
| HLS J030749.6–504138 | HLS0307-50 | 46.95667 | –50.69391 | 19.990.06 | 19.400.04 | 102.19.1 | 107.19.9 | 67.27.7 | 28.7 | 3.770.21 |
| HLS J045518.1+070102 | HLS0455 | 73.82525 | 7.01721 | 19.790.04∙ | 19.830.04∙ | 102.49.1 | 130.511.3 | 98.79.9 | 58.1 | 10.710.27 |
| HLS J050532.9–614357 | HLS0505 | 76.38710 | –61.73249 | 20.740.10∙ | 20.730.12∙ | 101.59.1 | 103.39.7 | 76.38.3 | 32.1 | 4.380.30 |
| HLS J054639.2–534520 | HLS0546 | 86.66346 | –53.75560 | 19.850.18 | 19.340.08 | 69.87.5 | 46.36.3 | 44.06.1 | 7.0 | 1.910.45 |
| HLS J055327.8–334216 | HLS0553-A | 88.36579 | –33.70446 | 19.270.02 | 19.270.02 | 102.69.1 | 74.98.0 | 40.05.8 | 24.9 | 1.710.16 |
| HLS J055327.6–334244 | HLS0553-B | 88.36510 | –33.71220 | 19.030.02 | 19.070.02 | 103.79.2 | 75.78.0 | 40.45.8 | 23.2 | 1.720.17 |
| HLS J055327.8–334231 | HLS0553-C | 88.36602 | –33.70849 | 18.710.04 | 18.680.05 | 186.813.3 | 136.411.7 | 72.88.1 | 35.4 | 3.110.19 |
| HLS J060023.8–200638 | HLS0600 | 90.09901 | –20.11067 | 18.570.03∙ | 18.290.03∙ | 173.712.7 | 270.519.7 | 237.819.6 | 77.0 | 34.270.61 |
| HLS J061203.5–431712 | HLS0612 | 93.01468 | –43.28678 | 19.780.14 | 19.570.05 | 93.08.7 | 95.09.2 | 62.47.4 | 28.7 | 6.310.37 |
| HLS J084032.1+054503 | HLS0840 | 130.13366 | 5.75073 | 18.940.03 | 18.780.03 | 90.58.5 | 85.58.6 | 41.05.9 | 8.0 | 4.000.90 |
| HLS J111550.7+013036 | HLS1115 | 168.96117 | 1.50988 | 18.920.02 | 18.620.02 | 91.18.6 | 95.59.2 | 57.67.0 | 31.4 | 2.580.13 |
| HLS J112402.2+240447 | HLS1124-A | 171.00896 | 24.07963 | 20.600.08∙ | 20.590.08∙ | 21.85.1 | 26.55.1 | 18.54.3 | 10.9 | 1.540.20 |
| HLS J112402.3+240437 | HLS1124-B | 171.00967 | 24.07699 | 18.360.02∙ | 18.370.03∙ | 191.013.6 | 231.617.4 | 161.714.3 | 51.7 | 13.500.39 |
| HLS J131421.3–251546 | HLS1314ccCombination of all the three clumps (HLS1314-A/B/C) seen in the ALMA map. | 198.58876 | –25.26276 | 16.840.01 | 16.740.01 | 130.210.5 | 141.212.0 | 93.19.5 | 26.5 | 4.580.21 |
| HLS J162346.5+263412 | HLS1623 | 245.94394 | 26.57011 | 20.600.04 | 20.070.04 | 76.97.8 | 68.07.6 | 43.36.0 | 12.7 | 0.390.07 |
| HLS J210454.6+140149 | HLS2104-A | 316.22738 | 14.03040 | 19.830.03 | 19.480.03 | 34.85.7 | 35.75.6 | 28.15.0 | 15.6 | 2.180.28 |
| HLS J210454.7+140141 | HLS2104-B | 316.22777 | 14.02815 | 18.850.02 | 18.710.02 | 49.46.5 | 50.86.5 | 40.05.8 | 19.9 | 3.100.29 |
| HLS J215540.5+123208 | HLS2155-A | 328.91861 | 12.53547 | 20.460.06 | 19.930.06 | 61.17.1 | 58.17.0 | 33.95.4 | 5.9 | 0.970.24 |
| HLS J215540.8+123135 | HLS2155-B | 328.92018 | 12.52629 | 19.680.11 | 19.370.06 | 36.65.8 | 34.15.5 | 27.04.9 | 9.4 | 3.580.45 |
| HLS J233227.2–535844 | HLS2332-A | 353.11334 | –53.97895 | 19.440.04 | 19.110.03 | 116.89.8 | 138.411.8 | 102.210.2 | 73.6 | 7.640.20 |
| HLS J233225.5–535839 | HLS2332-B | 353.10645 | –53.97746 | 19.620.02 | 19.090.02 | 136.010.8 | 161.213.2 | 119.111.3 | 83.0 | 8.900.21 |
| HLS J233229.5–535840 | HLS2332-C | 353.12295 | –53.97767 | 19.430.01 | 18.970.01 | 145.211.3 | 172.013.8 | 127.111.9 | 83.1 | 9.500.22 |
| ID | ALMA Band 6 | IRAC 3.6 m | IRAC 4.5 m | Offset | ||||||
|---|---|---|---|---|---|---|---|---|---|---|
| RA | Dec | |||||||||
| (′′) | (′′) | (′′) | (′′) | (′′) | ||||||
| HLS0043-A | 0.280.05 | 0.280.10 | 0.590.03 | 0.920.07 | 1.20.3 | 0.940.03 | 0.140.06 | 0.70.1 | –0.14 | –0.02 |
| HLS0043-B | 0.270.09 | 0.410.25 | 0.40 | 0.40 | 0.01 | 0.01 | ||||
| HLS0111-A | 0.240.05 | 0.510.18 | 0.780.01 | 0.670.03 | [0.2] | 0.810.02 | 0.690.02 | 1.00.2 | 0.03 | –0.07 |
| HLS0111-B | 0.130.03 | 0.290.34 | 0.480.13 | [0.54] | [0.2] | 0.450.07 | 0.560.30 | [0.2] | 0.06 | –0.16 |
| HLS0114 | 0.240.02 | 0.440.08 | 0.530.03 | 0.360.06 | 1.50.4 | 0.690.03 | 0.820.05 | 1.00.3 | –0.04 | 0.08 |
| HLS0307-28-A | 0.200.03 | 0.650.23 | 0.400.12 | 0.320.72 | [0.5] | 0.340.05 | 0.890.24 | [0.5] | 0.07 | –0.33 |
| HLS0307-28-B | 0.150.03 | 0.091.37 | 0.40 | 0.40 | 0.10 | 0.01 | ||||
| HLS0307-50 | 0.270.03 | 0.300.06 | 0.640.07 | 0.350.21 | [0.2] | 0.970.05 | 0.390.07 | [0.2] | –0.14 | –0.06 |
| HLS0546 | 1.680.27 | 0.990.26 | 1.160.26 | 0.050.21 | 1.81.1 | 1.020.21 | 0.040.12 | 2.81.0 | 1.20 | 0.14 |
| HLS0553-A | 0.100.01 | 0.560.10 | 0.330.02 | 0.620.12 | [1.0] | 0.350.02 | 0.880.08 | [1.0] | 0.05 | –0.16 |
| HLS0553-B | 0.150.01 | 0.430.05 | 0.760.01 | 0.320.03 | [1.0] | 0.850.03 | 0.540.02 | [1.0] | 0.09 | –0.36 |
| HLS0553-C | 0.140.01 | 0.580.12 | 0.670.02 | 0.480.03 | [1.0] | 0.640.01 | 0.600.02 | [1.0] | 0.03 | –0.16 |
| HLS0612 | 0.370.02 | 0.830.08 | 0.990.14 | 0.620.07 | 1.70.9 | 0.680.07 | 0.810.10 | 1.00.6 | –0.01 | 0.28 |
| HLS0840 | 3.661.71 | 0.430.30 | 1.130.02 | 0.400.03 | [0.2] | 1.150.03 | 0.490.02 | 0.20.1 | 0.22 | 0.22 |
| HLS1115 | 0.720.06 | 0.210.03 | 0.880.01 | 0.320.01 | 1.00.1 | 0.870.01 | 0.440.01 | 0.80.0 | –0.08 | –0.07 |
| HLS1314-A | 1.070.40 | 0.270.07 | 3.720.10 | [0.16] | [0.2] | 3.420.13 | 0.140.01 | 0.20.1 | –0.10 | 0.08 |
| HLS1314-B | 0.500.16 | 0.500.17 | 1.180.04 | [0.17] | 1.20.2 | 1.210.12 | 0.180.02 | 1.10.2 | –0.30 | –0.03 |
| HLS1314-C | 0.940.18 | 0.220.18 | 1.450.04 | 0.210.03 | 0.90.1 | 1.800.04 | 0.210.02 | 0.80.1 | –0.12 | 0.32 |
| HLS1623 | 0.890.32 | 0.810.04 | 0.170.11 | [0.71] | [0.2] | 0.770.03 | 0.710.06 | [0.2] | –0.05 | 0.72 |
| HLS2104-A | 0.240.04 | 1.000.24 | 0.710.04 | 0.420.10 | [0.2] | 0.874.11 | 0.800.05 | 0.00.5 | –0.05 | 0.02 |
| HLS2104-B | 0.430.05 | 0.580.10 | 1.130.02 | 0.750.02 | 0.70.1 | 1.080.02 | 0.730.02 | [1.0] | –0.00 | 0.12 |
| HLS2155-A | 0.330.05 | 0.160.11 | 0.880.07 | [0.20] | [0.5] | 0.600.04 | [0.20] | [0.5] | 0.00 | –0.01 |
| HLS2155-B | 1.520.10 | 0.470.05 | 2.010.26 | 0.410.05 | [1.5] | 2.130.57 | 0.300.03 | 2.50.9 | 0.16 | –0.01 |
| HLS2332-A | 0.210.00 | 0.580.01 | 0.930.04 | 0.420.05 | 0.90.3 | 0.990.01 | 0.480.01 | [1.0] | –0.03 | –0.08 |
| HLS2332-B | 0.210.01 | 0.590.03 | 0.710.11 | 0.500.10 | 0.20.5 | 0.710.01 | 0.720.01 | [1.0] | –0.10 | –0.08 |
| HLS2332-C | 0.200.01 | 0.670.04 | 1.220.05 | 0.620.04 | [1.0] | 1.000.01 | 0.600.01 | [1.0] | –0.39 | –0.08 |
Note. — Values enclosed with square brackets are fixed during morphological fitting (Section 3.2). is the effective radius, is the ratio between semi-minor and semi-major axis and is the Sérsic index. Spatial offsets in the last two columns are measured between ALMA and IRAC (average of 3.6 and 4.5 m) centroids (see Appendix B).
| ID | RedshiftaaPhotometric redshifts are presented as the median of their likelihood distributions with 1 confidence range. | log()bbThese quantities are not corrected for lensing magnification. | log(SFR)bbThese quantities are not corrected for lensing magnification. | log(sSFR) | log()bbThese quantities are not corrected for lensing magnification.ccDefined as the total IR luminosity integrated from 8 to 1000 m. | log()bbThese quantities are not corrected for lensing magnification. | ddModeled with MBB spectrum with fixed dust emissivity at . | |
|---|---|---|---|---|---|---|---|---|
| () | () | () | () | () | (K) | (mag) | ||
| HLS0043-A | 1.61 | 11.770.35 | 2.730.48 | –0.010.58 | 12.870.39 | 9.300.39 | 29.37.0 | 2.31.0 |
| HLS0043-B | 3.23 | 11.690.29 | 2.660.43 | –0.020.64 | 12.780.23 | 9.010.23 | 32.35.0 | 2.20.7 |
| HLS0111-A | 2.27 | 11.940.21 | 2.550.23 | –0.380.40 | 12.780.10 | 8.960.10 | 31.51.9 | 5.50.5 |
| HLS0111-B | 2.27 | 11.960.26 | 2.840.19 | –0.120.42 | 12.980.10 | 9.200.10 | 31.51.2 | 2.90.5 |
| HLS0114 | 1.49 | 11.940.32 | 2.710.42 | –0.210.64 | 12.880.27 | 8.920.27 | 35.45.2 | 2.00.9 |
| HLS0307-28-A | 1.19 | 11.610.39 | 2.590.38 | –0.010.61 | 12.790.27 | 8.970.27 | 33.44.2 | 7.11.6 |
| HLS0307-28-B | 2.65 | 10.700.32 | 2.440.14 | 0.740.29 | 12.630.18 | 9.150.18 | 29.63.7 | 2.00.9 |
| HLS0307-50 | 1.93 | 12.250.33 | 2.860.38 | –0.380.55 | 13.130.25 | 9.340.25 | 33.55.3 | 5.00.9 |
| HLS0455 | 2.93 | 11.820.21 | 3.430.06 | 0.620.28 | 13.570.06 | 9.620.06 | 34.40.6 | 2.20.4 |
| HLS0505 | 1.27 | 11.310.44 | 2.610.41 | 0.440.52 | 12.740.40 | 9.620.40 | 24.67.1 | 5.11.6 |
| HLS0546 | 1.89 | 11.850.41 | 2.740.36 | –0.090.65 | 12.930.26 | 9.020.26 | 33.95.8 | 3.51.1 |
| HLS0553-A | 1.14 | 11.450.03 | 2.680.10 | 0.220.10 | 12.850.09 | 8.990.09 | 31.21.5 | 3.80.2 |
| HLS0553-B | 1.14 | 11.540.07 | 2.660.15 | 0.070.17 | 12.820.14 | 9.000.14 | 31.11.5 | 3.70.3 |
| HLS0553-C | 1.14 | 11.740.32 | 2.910.18 | 0.180.47 | 13.050.10 | 9.250.10 | 31.41.1 | 4.20.9 |
| HLS0600 | 2.87 | 12.510.27 | 3.720.12 | 0.220.38 | 13.840.07 | 10.290.07 | 29.80.3 | 2.70.5 |
| HLS0612 | 2.31 | 11.760.40 | 3.110.29 | 0.370.48 | 13.230.27 | 9.530.27 | 31.85.5 | 3.00.9 |
| HLS0840 | 1.97 | 11.840.36 | 2.970.36 | 0.120.53 | 13.090.30 | 9.260.30 | 33.36.4 | 2.20.9 |
| HLS1115 | 1.59 | 12.150.01 | 2.830.01 | –0.320.04 | 12.920.03 | 9.360.03 | 31.20.6 | 3.10.1 |
| HLS1124-A | 1.80 | 10.800.30 | 2.360.14 | 0.570.40 | 12.440.13 | 9.030.13 | 27.01.5 | 1.70.6 |
| HLS1124-B | 1.80 | 11.700.30 | 3.270.12 | 0.570.40 | 13.350.12 | 9.980.12 | 27.00.4 | 1.50.4 |
| HLS1314eeCombination of all the three clumps (HLS1314-A/B/C) seen in the ALMA map (See Section 4.1). | 1.45 | 12.730.06 | 2.440.21 | –1.320.20 | 12.940.07 | 9.500.07 | 28.40.7 | 2.30.1 |
| HLS1623 | 0.96 | 11.840.48 | 2.260.41 | –0.600.53 | 12.680.34 | 8.420.34 | 22.03.8 | 9.21.4 |
| HLS2104-A | 2.17 | 11.730.33 | 2.600.41 | –0.080.56 | 12.770.31 | 9.100.31 | 31.06.3 | 2.30.9 |
| HLS2104-B | 2.13 | 11.870.30 | 2.790.44 | –0.070.56 | 12.910.33 | 9.280.33 | 30.76.2 | 1.50.8 |
| HLS2155-A | 1.72 | 11.920.35 | 2.630.33 | –0.310.60 | 12.870.20 | 8.810.20 | 37.04.7 | 5.21.1 |
| HLS2155-B | 2.66 | 11.720.31 | 2.920.37 | 0.200.45 | 12.990.32 | 9.250.32 | 31.97.4 | 1.60.7 |
| HLS2332-A | 2.73 | 11.910.09 | 3.610.12 | 0.720.17 | 13.640.12 | 9.440.12 | 36.70.7 | 3.00.2 |
| HLS2332-B | 2.73 | 11.730.12 | 3.640.04 | 0.930.15 | 13.700.07 | 9.510.07 | 36.70.6 | 2.90.1 |
| HLS2332-C | 2.73 | 12.490.24 | 3.510.13 | 0.030.35 | 13.640.07 | 9.530.07 | 36.70.6 | 3.80.4 |
References
- Abbott et al. (2018) Abbott, T. M. C., Abdalla, F. B., Allam, S., et al. 2018, ApJS, 239, 18
- Agius et al. (2013) Agius, N. K., Sansom, A. E., Popescu, C. C., et al. 2013, MNRAS, 431, 1929
- An et al. (2019) An, F. X., Simpson, J. M., Smail, I., et al. 2019, ApJ, 886, 48
- Aravena et al. (2020) Aravena, M., Boogaard, L., Gónzalez-López, J., et al. 2020, arXiv e-prints, arXiv:2006.04284
- Astropy Collaboration et al. (2013) Astropy Collaboration, Robitaille, T. P., Tollerud, E. J., et al. 2013, A&A, 558, A33
- Baldwin et al. (1981) Baldwin, J. A., Phillips, M. M., & Terlevich, R. 1981, PASP, 93, 5
- Barro et al. (2013) Barro, G., Faber, S. M., Pérez-González, P. G., et al. 2013, ApJ, 765, 104
- Barro et al. (2016a) Barro, G., Kriek, M., Pérez-González, P. G., et al. 2016a, ApJ, 827, L32
- Barro et al. (2016b) Barro, G., Faber, S. M., Dekel, A., et al. 2016b, ApJ, 820, 120
- Battisti et al. (2019) Battisti, A. J., da Cunha, E., Grasha, K., et al. 2019, ApJ, 882, 61
- Bertin (2006) Bertin, E. 2006, in Astronomical Society of the Pacific Conference Series, Vol. 351, Astronomical Data Analysis Software and Systems XV, ed. C. Gabriel, C. Arviset, D. Ponz, & S. Enrique, 112
- Bertin & Arnouts (1996) Bertin, E., & Arnouts, S. 1996, A&AS, 117, 393
- Bleem et al. (2015) Bleem, L. E., Stalder, B., de Haan, T., et al. 2015, ApJS, 216, 27
- Bothwell et al. (2013) Bothwell, M. S., Smail, I., Chapman, S. C., et al. 2013, MNRAS, 429, 3047
- Bournaud et al. (2011) Bournaud, F., Chapon, D., Teyssier, R., et al. 2011, ApJ, 730, 4
- Calura et al. (2017) Calura, F., Pozzi, F., Cresci, G., et al. 2017, MNRAS, 465, 54
- Calzetti et al. (2000) Calzetti, D., Armus, L., Bohlin, R. C., et al. 2000, ApJ, 533, 682
- Casey et al. (2014a) Casey, C. M., Narayanan, D., & Cooray, A. 2014a, Phys. Rep., 541, 45
- Casey et al. (2014b) Casey, C. M., Scoville, N. Z., Sanders, D. B., et al. 2014b, ApJ, 796, 95
- Chabrier (2003) Chabrier, G. 2003, PASP, 115, 763
- Charlot & Fall (2000) Charlot, S., & Fall, S. M. 2000, ApJ, 539, 718
- Cheale et al. (2019) Cheale, R. A., Geach, J. E., Edge, A. C., et al. 2019, MNRAS, 484, 2757
- Chen et al. (2015) Chen, C.-C., Smail, I., Swinbank, A. M., et al. 2015, ApJ, 799, 194
- Cochrane et al. (2019) Cochrane, R. K., Hayward, C. C., Anglés-Alcázar, D., et al. 2019, MNRAS, 488, 1779
- Coe et al. (2019) Coe, D., Salmon, B., Bradač, M., et al. 2019, ApJ, 884, 85
- Combes et al. (2012) Combes, F., Rex, M., Rawle, T. D., et al. 2012, A&A, 538, L4
- da Cunha et al. (2008) da Cunha, E., Charlot, S., & Elbaz, D. 2008, MNRAS, 388, 1595
- da Cunha et al. (2010) da Cunha, E., Eminian, C., Charlot, S., & Blaizot, J. 2010, MNRAS, 403, 1894
- da Cunha et al. (2015) da Cunha, E., Walter, F., Smail, I. R., et al. 2015, ApJ, 806, 110
- Davé et al. (2010) Davé, R., Finlator, K., Oppenheimer, B. D., et al. 2010, MNRAS, 404, 1355
- Dekel & Birnboim (2006) Dekel, A., & Birnboim, Y. 2006, MNRAS, 368, 2
- Dekel & Birnboim (2008) —. 2008, MNRAS, 383, 119
- Dekel & Burkert (2014) Dekel, A., & Burkert, A. 2014, MNRAS, 438, 1870
- Dekel & Silk (1986) Dekel, A., & Silk, J. 1986, ApJ, 303, 39
- Di Matteo et al. (2005) Di Matteo, T., Springel, V., & Hernquist, L. 2005, Nature, 433, 604
- Díaz-Santos et al. (2017) Díaz-Santos, T., Armus, L., Charmandaris, V., et al. 2017, ApJ, 846, 32
- Dudzevičiūtė et al. (2020) Dudzevičiūtė, U., Smail, I., Swinbank, A. M., et al. 2020, MNRAS, 494, 3828
- Dunlop et al. (2017) Dunlop, J. S., McLure, R. J., Biggs, A. D., et al. 2017, MNRAS, 466, 861
- Ebeling et al. (2017) Ebeling, H., Qi, J., & Richard, J. 2017, MNRAS, 471, 3305
- Egami et al. (2010) Egami, E., Rex, M., Rawle, T. D., et al. 2010, A&A, 518, L12
- Elbaz et al. (2018) Elbaz, D., Leiton, R., Nagar, N., et al. 2018, A&A, 616, A110
- Finoguenov et al. (2020) Finoguenov, A., Rykoff, E., Clerc, N., et al. 2020, A&A, 638, A114
- Flewelling et al. (2016) Flewelling, H. A., Magnier, E. A., Chambers, K. C., et al. 2016, arXiv e-prints, arXiv:1612.05243
- Foreman-Mackey et al. (2013) Foreman-Mackey, D., Hogg, D. W., Lang, D., & Goodman, J. 2013, PASP, 125, 306
- Franco et al. (2018) Franco, M., Elbaz, D., Béthermin, M., et al. 2018, A&A, 620, A152
- Fujimoto et al. (2017) Fujimoto, S., Ouchi, M., Shibuya, T., & Nagai, H. 2017, ApJ, 850, 83
- Gaia Collaboration et al. (2018) Gaia Collaboration, Brown, A. G. A., Vallenari, A., et al. 2018, A&A, 616, A1
- Geach et al. (2017) Geach, J. E., Dunlop, J. S., Halpern, M., et al. 2017, MNRAS, 465, 1789
- Genzel et al. (2003) Genzel, R., Baker, A. J., Tacconi, L. J., et al. 2003, ApJ, 584, 633
- Gobat et al. (2018) Gobat, R., Daddi, E., Magdis, G., et al. 2018, Nature Astronomy, 2, 239
- Gómez-Guijarro et al. (2018) Gómez-Guijarro, C., Toft, S., Karim, A., et al. 2018, The Astrophysical Journal, 856, 121
- Gonzaga & et al. (2012) Gonzaga, S., & et al. 2012, The DrizzlePac Handbook
- González-López et al. (2017) González-López, J., Bauer, F. E., Romero-Cañizales, C., et al. 2017, A&A, 597, A41
- González-López et al. (2020) González-López, J., Novak, M., Decarli, R., et al. 2020, arXiv e-prints, arXiv:2002.07199
- Greve et al. (2012) Greve, T. R., Vieira, J. D., Weiß, A., et al. 2012, ApJ, 756, 101
- Griffin et al. (2010) Griffin, M. J., Abergel, A., Abreu, A., et al. 2010, A&A, 518, L3
- Gullberg et al. (2019) Gullberg, B., Smail, I., Swinbank, A. M., et al. 2019, MNRAS, 490, 4956
- Hainline et al. (2011) Hainline, L. J., Blain, A. W., Smail, I., et al. 2011, ApJ, 740, 96
- Hatsukade et al. (2018) Hatsukade, B., Kohno, K., Yamaguchi, Y., et al. 2018, PASJ, 70, 105
- Hickox et al. (2012) Hickox, R. C., Wardlow, J. L., Smail, I., et al. 2012, MNRAS, 421, 284
- Hodge & da Cunha (2020) Hodge, J. A., & da Cunha, E. 2020, arXiv e-prints, arXiv:2004.00934
- Hodge et al. (2016) Hodge, J. A., Swinbank, A. M., Simpson, J. M., et al. 2016, ApJ, 833, 103
- Hodge et al. (2019) Hodge, J. A., Smail, I., Walter, F., et al. 2019, ApJ, 876, 130
- Hopkins et al. (2008) Hopkins, P. F., Hernquist, L., Cox, T. J., & Kereš, D. 2008, ApJS, 175, 356
- Hora et al. (2012) Hora, J. L., Marengo, M., Park, R., et al. 2012, in Proc. SPIE, Vol. 8442, Space Telescopes and Instrumentation 2012: Optical, Infrared, and Millimeter Wave, 844239
- Hunt et al. (2015) Hunt, L. K., Draine, B. T., Bianchi, S., et al. 2015, A&A, 576, A33
- Ikarashi et al. (2015) Ikarashi, S., Ivison, R. J., Caputi, K. I., et al. 2015, ApJ, 810, 133
- Ivison et al. (2010) Ivison, R. J., Smail, I., Papadopoulos, P. P., et al. 2010, MNRAS, 404, 198
- Jiménez-Andrade et al. (2020) Jiménez-Andrade, E. F., Zavala, J. A., Magnelli, B., et al. 2020, ApJ, 890, 171
- Kennicutt & Evans (2012) Kennicutt, R. C., & Evans, N. J. 2012, ARA&A, 50, 531
- Lang et al. (2019) Lang, P., Schinnerer, E., Smail, I., et al. 2019, ApJ, 879, 54
- Laporte et al. (2017) Laporte, N., Bauer, F. E., Troncoso-Iribarren, P., et al. 2017, A&A, 604, A132
- Li et al. (2019) Li, Z., French, K. D., Zabludoff, A. I., & Ho, L. C. 2019, ApJ, 879, 131
- Litke et al. (2019) Litke, K. C., Marrone, D. P., Spilker, J. S., et al. 2019, ApJ, 870, 80
- Lotz et al. (2011) Lotz, J. M., Jonsson, P., Cox, T. J., et al. 2011, ApJ, 742, 103
- Lotz et al. (2017) Lotz, J. M., Koekemoer, A., Coe, D., et al. 2017, ApJ, 837, 97
- Lutz et al. (2016) Lutz, D., Berta, S., Contursi, A., et al. 2016, A&A, 591, A136
- Madau & Dickinson (2014) Madau, P., & Dickinson, M. 2014, ARA&A, 52, 415
- Man et al. (2016) Man, A. W. S., Zirm, A. W., & Toft, S. 2016, ApJ, 830, 89
- Martí-Vidal et al. (2014) Martí-Vidal, I., Vlemmings, W. H. T., Muller, S., & Casey, S. 2014, A&A, 563, A136
- Martis et al. (2019) Martis, N. S., Marchesini, D. M., Muzzin, A., et al. 2019, arXiv e-prints, arXiv:1907.08152
- McAlpine et al. (2019) McAlpine, S., Smail, I., Bower, R. G., et al. 2019, MNRAS, 488, 2440
- McMullin et al. (2007) McMullin, J. P., Waters, B., Schiebel, D., Young, W., & Golap, K. 2007, in Astronomical Society of the Pacific Conference Series, Vol. 376, Astronomical Data Analysis Software and Systems XVI, ed. R. A. Shaw, F. Hill, & D. J. Bell, 127
- Miettinen et al. (2017) Miettinen, O., Delvecchio, I., Smolčić, V., et al. 2017, A&A, 606, A17
- Narayanan et al. (2010) Narayanan, D., Dey, A., Hayward, C. C., et al. 2010, MNRAS, 407, 1701
- Neeleman et al. (2019) Neeleman, M., Bañados, E., Walter, F., et al. 2019, ApJ, 882, 10
- Nelson et al. (2016) Nelson, E. J., van Dokkum, P. G., Förster Schreiber, N. M., et al. 2016, ApJ, 828, 27
- Newman et al. (2015) Newman, A. B., Belli, S., & Ellis, R. S. 2015, ApJ, 813, L7
- Newman et al. (2018) Newman, A. B., Belli, S., Ellis, R. S., & Patel, S. G. 2018, ApJ, 862, 125
- Nguyen et al. (2010) Nguyen, H. T., Schulz, B., Levenson, L., et al. 2010, A&A, 518, L5
- Oguri (2010) Oguri, M. 2010, PASJ, 62, 1017
- Oke & Gunn (1983) Oke, J. B., & Gunn, J. E. 1983, ApJ, 266, 713
- Oogi & Habe (2013) Oogi, T., & Habe, A. 2013, MNRAS, 428, 641
- Ott (2010) Ott, S. 2010, in Astronomical Society of the Pacific Conference Series, Vol. 434, Astronomical Data Analysis Software and Systems XIX, ed. Y. Mizumoto, K.-I. Morita, & M. Ohishi, 139
- Peng et al. (2010) Peng, C. Y., Ho, L. C., Impey, C. D., & Rix, H.-W. 2010, AJ, 139, 2097
- Piazzo et al. (2015) Piazzo, L., Calzoletti, L., Faustini, F., et al. 2015, MNRAS, 447, 1471
- Pilbratt et al. (2010) Pilbratt, G. L., Riedinger, J. R., Passvogel, T., et al. 2010, A&A, 518, L1
- Poglitsch et al. (2010) Poglitsch, A., Waelkens, C., Geis, N., et al. 2010, A&A, 518, L2
- Postman et al. (2012) Postman, M., Coe, D., Benítez, N., et al. 2012, ApJS, 199, 25
- Price-Whelan et al. (2018) Price-Whelan, A. M., Sipőcz, B. M., Günther, H. M., et al. 2018, AJ, 156, 123
- Puglisi et al. (2019) Puglisi, A., Daddi, E., Liu, D., et al. 2019, ApJ, 877, L23
- Rawle et al. (2014) Rawle, T. D., Egami, E., Bussmann, R. S., et al. 2014, ApJ, 783, 59
- Rawle et al. (2016) Rawle, T. D., Altieri, B., Egami, E., et al. 2016, MNRAS, 459, 1626
- Rieke et al. (2009) Rieke, G. H., Alonso-Herrero, A., Weiner, B. J., et al. 2009, ApJ, 692, 556
- Rowlands et al. (2015) Rowlands, K., Wild, V., Nesvadba, N., et al. 2015, MNRAS, 448, 258
- Rowlands et al. (2012) Rowlands, K., Dunne, L., Maddox, S., et al. 2012, MNRAS, 419, 2545
- Rujopakarn et al. (2011) Rujopakarn, W., Rieke, G. H., Eisenstein, D. J., & Juneau, S. 2011, ApJ, 726, 93
- Rujopakarn et al. (2019) Rujopakarn, W., Daddi, E., Rieke, G. H., et al. 2019, ApJ, 882, 107
- Sanders et al. (1988) Sanders, D. B., Soifer, B. T., Elias, J. H., et al. 1988, ApJ, 325, 74
- Santini et al. (2010) Santini, P., Maiolino, R., Magnelli, B., et al. 2010, A&A, 518, L154
- Schreiber et al. (2015) Schreiber, C., Pannella, M., Elbaz, D., et al. 2015, A&A, 575, A74
- Scoville et al. (2016) Scoville, N., Sheth, K., Aussel, H., et al. 2016, ApJ, 820, 83
- Simpson et al. (2014) Simpson, J. M., Swinbank, A. M., Smail, I., et al. 2014, ApJ, 788, 125
- Simpson et al. (2015) Simpson, J. M., Smail, I., Swinbank, A. M., et al. 2015, ApJ, 799, 81
- Simpson et al. (2017) —. 2017, ApJ, 839, 58
- Skibba et al. (2011) Skibba, R. A., Engelbracht, C. W., Dale, D., et al. 2011, ApJ, 738, 89
- Smail et al. (1997) Smail, I., Ivison, R. J., & Blain, A. W. 1997, ApJ, 490, L5
- Speagle et al. (2014) Speagle, J. S., Steinhardt, C. L., Capak, P. L., & Silverman, J. D. 2014, ApJS, 214, 15
- Spilker et al. (2019) Spilker, J. S., Bezanson, R., Weiner, B. J., Whitaker, K. E., & Williams, C. C. 2019, ApJ, 883, 81
- Spilker et al. (2016) Spilker, J. S., Marrone, D. P., Aravena, M., et al. 2016, ApJ, 826, 112
- Stach et al. (2019) Stach, S. M., Dudzevičiūtė, U., Smail, I., et al. 2019, MNRAS, 487, 4648
- Strandet et al. (2016) Strandet, M. L., Weiss, A., Vieira, J. D., et al. 2016, ApJ, 822, 80
- Suess et al. (2017) Suess, K. A., Bezanson, R., Spilker, J. S., et al. 2017, ApJ, 846, L14
- Swinbank et al. (2010) Swinbank, A. M., Smail, I., Longmore, S., et al. 2010, Nature, 464, 733
- Swinbank et al. (2014) Swinbank, A. M., Simpson, J. M., Smail, I., et al. 2014, MNRAS, 438, 1267
- Symeonidis et al. (2013) Symeonidis, M., Vaccari, M., Berta, S., et al. 2013, MNRAS, 431, 2317
- Tacchella et al. (2016) Tacchella, S., Dekel, A., Carollo, C. M., et al. 2016, MNRAS, 458, 242
- Tacchella et al. (2015) Tacchella, S., Carollo, C. M., Renzini, A., et al. 2015, Science, 348, 314
- Tacchella et al. (2018) Tacchella, S., Carollo, C. M., Förster Schreiber, N. M., et al. 2018, ApJ, 859, 56
- Tacconi et al. (2008) Tacconi, L. J., Genzel, R., Smail, I., et al. 2008, ApJ, 680, 246
- Tadaki et al. (2020) Tadaki, K.-i., Belli, S., Burkert, A., et al. 2020, arXiv e-prints, arXiv:2009.01976
- Toft et al. (2014) Toft, S., Smolčić, V., Magnelli, B., et al. 2014, ApJ, 782, 68
- van der Wel et al. (2012) van der Wel, A., Bell, E. F., Häussler, B., et al. 2012, ApJS, 203, 24
- van der Wel et al. (2014) van der Wel, A., Franx, M., van Dokkum, P. G., et al. 2014, ApJ, 788, 28
- van Dokkum (2005) van Dokkum, P. G. 2005, AJ, 130, 2647
- van Dokkum et al. (2008) van Dokkum, P. G., Franx, M., Kriek, M., et al. 2008, ApJ, 677, L5
- Whitaker et al. (2017) Whitaker, K. E., Pope, A., Cybulski, R., et al. 2017, ApJ, 850, 208
- Yan et al. (2006) Yan, R., Newman, J. A., Faber, S. M., et al. 2006, ApJ, 648, 281
- Zavala et al. (2015) Zavala, J. A., Yun, M. S., Aretxaga, I., et al. 2015, MNRAS, 452, 1140
- Zitrin et al. (2015) Zitrin, A., Fabris, A., Merten, J., et al. 2015, ApJ, 801, 44
- Zolotov et al. (2015) Zolotov, A., Dekel, A., Mandelker, N., et al. 2015, MNRAS, 450, 2327