Distinction of groups of gamma-ray bursts in the BATSE catalog through fuzzy clustering
Soumita Modak∗
Department of Statistics, Basanti Devi College
affiliated with
University of Calcutta
147B, Rash Behari Ave, Kolkata- 700029, India
email: soumitamodak2013@gmail.com
Abstract
In search for the possible astrophysical sources behind origination of the diverse gamma-ray bursts, cluster analyses are performed to find homogeneous groups, which discover an intermediate group other than the conventional short and long bursts. However, very recently, few studies indicate a possibility of the existence of more than three (namely five) groups. Therefore, in this paper, fuzzy clustering is conducted on the gamma-ray bursts from the final ‘Burst and Transient Source Experiment’ catalog to cross-check the significance of these new groups. Meticulous study on individual bursts based on their memberships in the fuzzy clusters confirms the previously well-known three groups against the newly found five.
keywords: Statistical machine learning; Data analysis; Gamma ray bursts; Fuzzy clustering.
Introduction
In the search for astrophysical sources behind origination of the diverse gamma-ray bursts (GRBs), scientists have been trying to find the homogeneous classes existing in these most luminous explosions in the Universe through cluster analysis. It is an evident fact that distinct clustering methods applied to different variables on GRBs change individual membership of the bursts which fall in the overlapping regions among the clusters. However, we attempt to reach the robust classes which can expose the inherent clustering nature of the GRBs. Early studies of Venera GRB data collected through KONUS experiment find two different groups of short and long bursts (see, Mazets et al. 1981; Norris et al. 1984). The Burst and Transient Source Experiment (BATSE) on board the COMPTON Gamma-Ray Observatory (CGRO) operating between the years 1991 and 2000 has presently the largest data set on 2702 GRBs (Meegan et al. 1992; Fishman et al. 1994; Meegan et al. 1996; Paciesas et al. 1999; Horváth 2002), which are our working data. Based on the duration distribution, Kouveliotou et al. (1993) classify the bursts into short ( s) and long ( s) groups ( is a duration variable representing the time of a burst’s 90% flux arrival in seconds, abbreviated to s). Despite significant duration overlap between the two groups (Toth et al. 2019), the short group is hard and the long one is soft by means of their spectral hardness ratios; moreover, their physical differentiation is supported by information on prompt-emission (Kouveliotou et al. 1993; Gehrels et al. 2009; Zhang et al. 2012), afterglows, host galaxies and redshift distributions (Zhang et al. 2009; Berger 2011, 2014; Levan et al. 2016). Short bursts are generally believed to have compact binary mergers, like merger of two neutron stars or merger of a neutron star with a black hole, as their progenitors (Paczyński 1986; Usov 1992; Bloom et al. 2006; Nakar 2007; Berger 2014); whereas massive stellar collapse is believed to generate the long bursts (Woosley 1993; Paczyński 1998; Woosley & Bloom 2006; Blanchard et al. 2016). Automatic statistical cluster analyses (Horváth 1998, 2002) hints at possibility of more than two classes with short ( s), intermediate ( s) and long ( s) groups. These classes are subsequently confirmed by bivariate clustering based on duration and hardness variables, where the intermediate group is found to be the softest along with conventional short–hard and long–soft groups (Horváth et al. 2004, 2006). Later on, multivariate studies incorporating more variables confirm the existence of a third group; where the hard–short class of dimmer bursts with the lowest mean fluence reveal to possess an average duration of s, and the traditional soft–long bursts with average s are divided into intermediate duration faint bursts with low fluence and long duration bright bursts with high fluence (Mukherjee et al. 1998; Balastegui et al. 2001). The intermediate group is later witnessed to have a larger average duration, i.e. s (Chattopadhyay et al. 2007; Modak et al. 2018). Over the past few decades, BATSE GRBs of various sizes with differently chosen variables have been classified using efficient statistical methods: be it parametric classical model-based approaches like Gaussian-mixture, Dirichlet process (Horváth 1998; Horváth et al. 2006; Chattopadhyay et al. 2007), nonparametric data-mining techniques like k-means, hierarchical clustering (Mukherjee et al. 1998; Balastegui et al. 2001; Chattopadhyay et al. 2007; Modak et al. 2018), or advanced machine learning algorithms like neural network clustering, kernel principal component analysis (Balastegui et al. 2001; Modak et al. 2018), which conclude three statistically significant clusters of GRBs.
In this regard, it is worth mentioning that cluster analyses of GRB data sets collected by other satellites also disclose an intermediate class supporting the presence of three groups, e.g. Beppo–SAX bursts (Horváth 2009), Swift/BAT data (Horváth et al. 2008, 2010; Veres et al. 2010; Koen & Bere 2012; Tsutsui & Shigeyama 2014; Horváth & Tóth 2016), RHESSI data set (Řípa et al. 2009; Řípa & Mészáros 2016) and Fermi/GBM data (Horváth et al. 2018). This intermediate group might have emerged from merger of a massive white dwarf with a neutron star (Chattopadhyay et al. 2007; King et al. 2007; Modak et al. 2018). However, some authors doubt that this class of GRBs might be caused by instrumental and sampling biases (Hakkila et al. 2000; 2003; Rajaniemi & Mähönen 2002); whereas some think of this group as a possible composition of the short and the long bursts which violate their predominantly believed correspondence to merger and collapse models respectively (Bromberg et al. 2013; Zitouni et al. 2015). Amid the rising concern that not all GRBs can be classified as either short bursts generated by merger model or long bursts originated by collapse model (Horváth et al. 2018; Toth et al. 2019), astrophysical sources behind the intermediate group are yet to be confirmed.
Recently, Chattopadhyay & Maitra (2017, 2018) study the BASTE catalog and state that there may be five clusters in the GRBs, although astrophysical distinction among the groups is not yet established. On the other hand, Toth et al. (2019) dismiss these five groups as insignificant caused just by further division of the three established classes. Also, Acuner & Ryde (2018) find five clusters in the Fermi/GBM catalog using model-based clustering, which after interpretation with respect to external variables boil down to two major clusters of photospheric origin and synchrotron origin. However, Chattopadhyay & Maitra (2017) perform multivariate cluster analysis using Gaussian-mixture model and discover five distinct classes of GRBs in terms of the Bayes’ Information Criterion (BIC, Schwarz 1978). Again, in Chattopadhyay & Maitra (2018), multivariate clustering based on mixture model results in five clusters as indicated by BIC. Nonetheless, Toth et al. (2019) point out that these new groups arise due to mere numerical separation of the peak flux variable; and they conclude that it is unlikely to have new sources behind the additional clusters caused by model-based clustering methods relying on a finite mixture of probability distributions with each distribution corresponding to a cluster. Data when fail to satisfy such parametric distributional assumptions can produce considerably misleading results. Hence, robust nonparametric methods are often opted for a better solution in analyzing the challenging astronomical data sets (Feigelson & Babu 2013; Bandyopadhyay & Modak 2018; Modak & Bandyopadhyay 2019; Modak et al. 2020). In Modak et al. (2018), means clustering (Hartigan & Wong 1979) based on the relevant kernel principal components (Schölkopf & Smola 2002; Hofmann et al. 2008; Ishida & Souza 2013), extracted through a novel kernel (Modak et al. 2017), rules out the possibility of five clusters provoked by noisy data and finally provides three significant clusters of GRBs in terms of the Dunn index (Dunn 1974).
Now, instead of exploring the clusters indicated by some automatic cluster validity index, in this study our objective is shifted to solution of the recently raised burning conflict between the five new clusters and the three well-known groups. Therefore, we explore both three and five clusters of the BATSE catalog in detail through nonparametric fuzzy clustering. Here, instead of hard clustering where each GRB is assigned to only one particular cluster, we give them membership values which explain how likely a GRB is to belong to any of the clusters. In contrast to explanation of the cluster-wise average properties using subjective expertise (Toth et al. 2019), we perform extensive investigation of individual GRBs objectively in terms of their memberships in the fuzzy clusters. We apply the efficient statistical machine learning algorithm ‘FANNY’ (Kaufman & Rousseeuw 2005), which does not assume any model assumption and hence can robustly reveal the inherent clusters present in the GRBs. It statistically confirms the previously well-known three groups while explaining the new five classes as insignificant division of the old three, which supports the claim of Toth et al. (2019).
The paper is organized as follows. Section 2 outlines the data set and Section 3 discusses the methods. Section 4 explains the results with Section 5 concluding.
Data set
The current BATSE Gamma-Ray Burst Catalog111https://gammaray.nsstc.nasa.gov/batse/grb/catalog/current/ (Meegan et al. 1992; Fishman et al. 1994; Meegan et al. 1996; Paciesas et al. 1999; Horváth 2002; Toth et al. 2019) provides information for the following observed variables of GRBs. Fluence variables: are time-integrated fluences in , , and keV spectral channels respectively; flux variables: are peak fluxes measured in and ms bins respectively; duration variables: are times within which and of the flux arrive. Unit of fluence: ergs per square centimeter (ergs cm-2); unit of peak flux: count per square centimeter per second (cm-2 s-1); and unit of time: second (s). We compute total fluence: and spectral hardness ratios: . Distributions of many variables are significantly correlated and largely skewed, hence we relevantly choose our study variables: and (Mukherjee et al. 1998; Hakkila et al. 2000; Chattopadhyay et al. 2007, Chattopadhyay and Maitra 2017; Toth et al. 2019). The present analysis include 1956 GRBs possessing finite values on these six variables (Horváth et al. 2006.)
Fuzzy clustering
In clustering the GRBs, we look for meaningful homogeneous groups, where GRBs falling in the existing overlapping clusters can share properties significantly among the groups. In this context, fuzzy clustering methods are quite useful in measuring the extent of how much a GRB is inheriting characteristics from a particular group in terms of membership values, called membership coefficients or we simply refer to them as memberships.
Here we are trying to cluster number of GRBs into fuzzy clusters using FANNY algorithm (Kaufman & Rousseeuw 2005). It is a nonparametric distance-based machine learning algorithm which is flexible enough to accommodate any distance measure (not necessarily a metric) according to the data. The distance between GRB and GRB is denoted by for and . In our study, the Euclidean norm is used. Fuzzy clustering provides us with a measure ‘membership’ analogous to probability which describes the degree of certainty that an individual GRB is part of a cluster. Let give the membership of GRB to cluster , then (1) for and ; and (2) for each . Therefore, we can define the membership matrix associated with clustering of GRBs into fuzzy clusters.
FANNY algorithm is designed to minimize the following objective function:
| (1) |
where is a parameter controlling the extent of fuzziness allowed in the algorithm. The value of is chosen by the analyst depending upon the data, wherein its value needs to be greater than 1 for convergence of the algorithm. In our study, is required to carry out fuzzy clustering for and .
In hard clustering, where each GRB is assigned to only one particular cluster, when GRB belongs to cluster , otherwise . This explains for given , or for all result in hard clustering, whereas for all lead to completely fuzzy clustering. FANNY algorithm also produces the closest hard clustering by placing each GRB to its nearest fuzzy cluster, i.e. the fuzzy class with the highest membership for the burst, wherein larger value of this membership indicates greater certainty in such hard clustering. Proximity between a fuzzy clustering and its nearest hard clustering can be evaluated by the following normalized version of the Dunn’s partition coefficient (Dunn 1976; Roubens 1982):
| (2) |
which takes a maximum value of 1 for hard clusters and has a minimum value of 0 for a complete fuzzy clustering.
We also plot the non-degenerate principal components (PCs) of the memberships of GRBs in three fuzzy clusters obtained through FANNY algorithm (Rousseeuw et al. 1989), wherein the number of non-degenerate PCs are two since for each . Here principal component analysis is performed on the membership matrix after each column is standardized (i.e. column-wise mean and standard deviation ) so that memberships of the GRBs in three fuzzy clusters are dealt with equal importance (however, non-standardized version also leads to the similar answer).
Results and interpretation
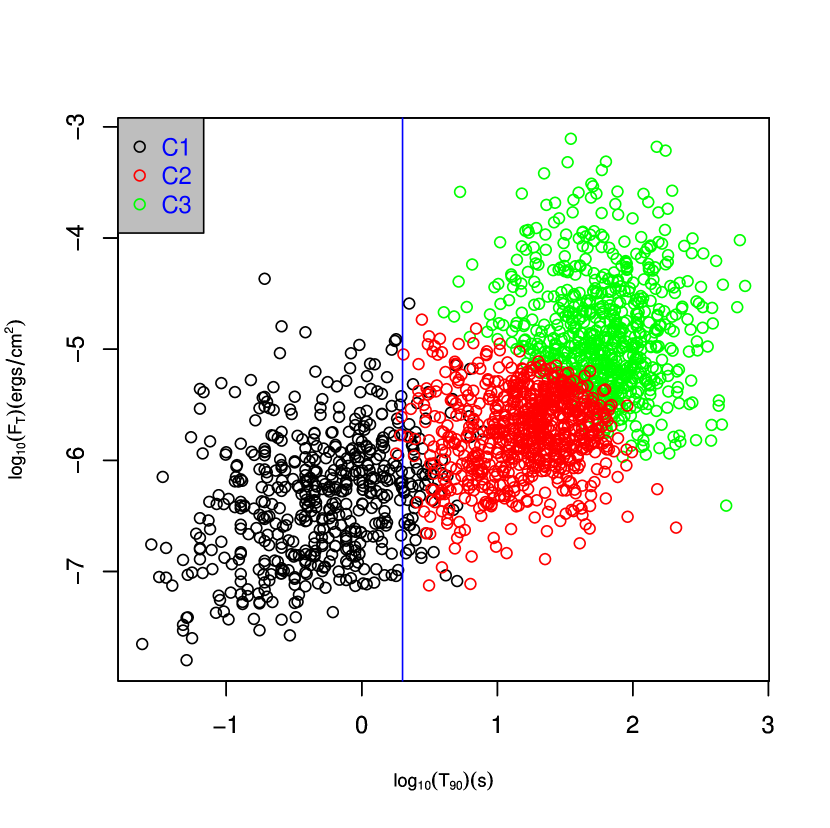
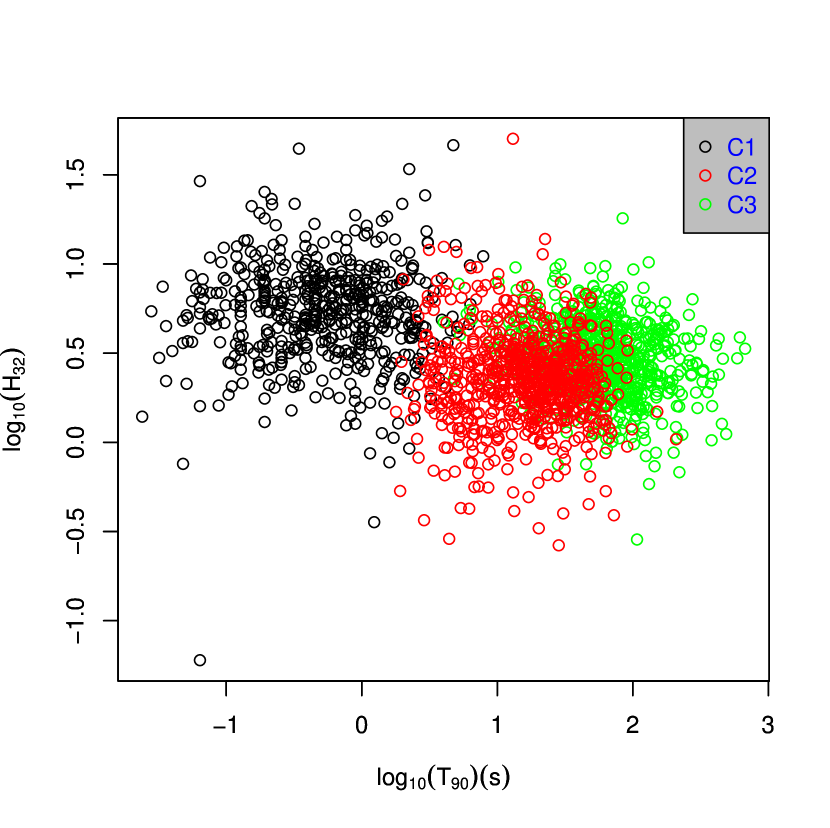
We carry out fuzzy clustering analysis on the largest GRB data set using FANNY algorithm where we try to distribute the GRBs over three and five clusters, whose closet hard clustering properties are displayed respectively in Tables 1 and 2. Table 1 prominently exhibits three previously established groups (Mukherjee et al. 1998; Balastegui et al. 2001; Chattopadhyay et al. 2007; Modak et al. 2018), where cluster contains the short, dim, hard and lowest–fluence GRBs; represents the intermediate, dimmer, soft bursts having lower fluence; whereas cluster have the long, brighter, soft bursts with high fluence (see, Figs. 1 and 2).
Merely based on the average duration (Table 2), in the same fashion as Chattopadhyay & Maitra (2017, 2018) and Toth et al. (2019), the bursts of five clusters can be relatively classified as short, intermediate, intermediate, long and long, respectively. However, in our study, a detailed investigation of the individual GRBs with respect to the well-known three groups describes a different scenario. Table 3 reveals clusters and are built of short and intermediate bursts, respectively; whereas consists of the long bursts. Cluster is also dominated by and hence corresponds to a group of mainly long bursts but is a combination of the short and the intermediate GRBs.
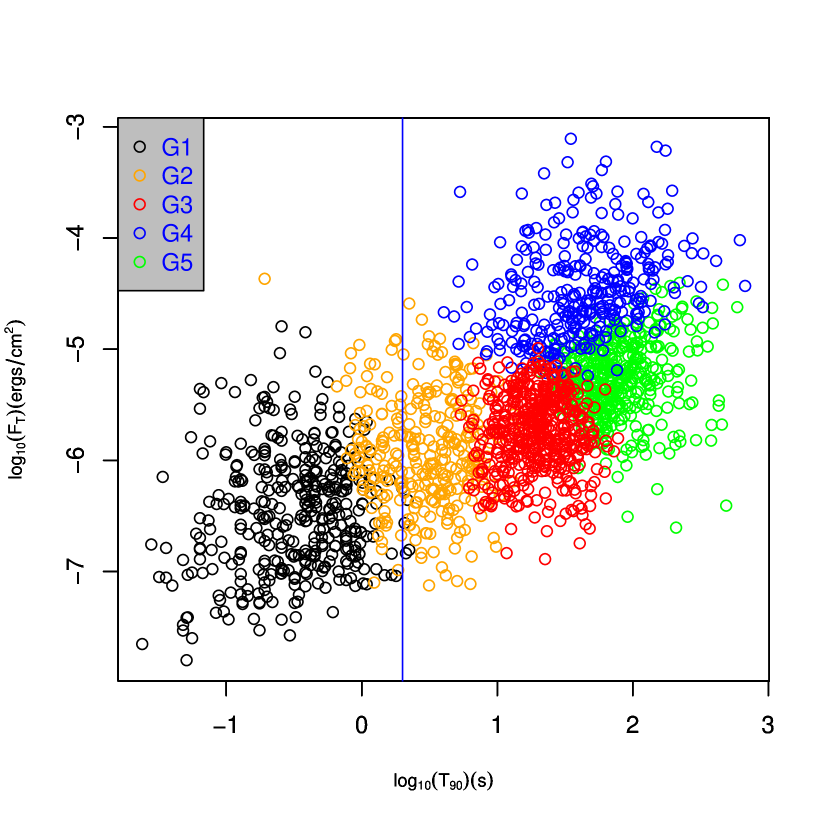
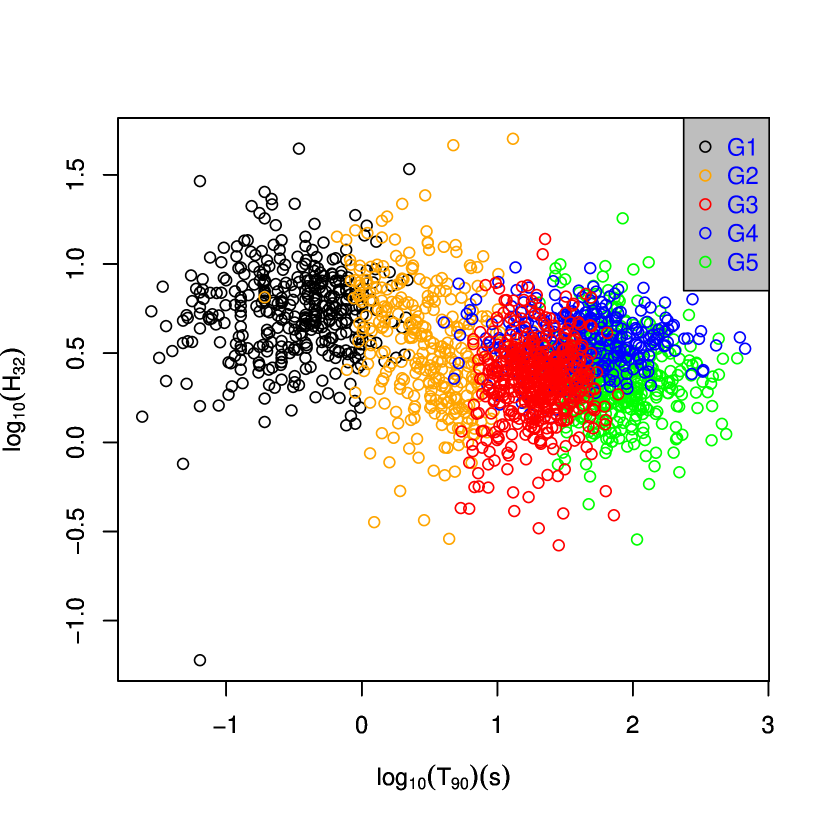
We investigate whether is actually a new group or a spurious cluster. One possibility is that the GRBs, falling near the border of two clusters of short bursts and of intermediate bursts in three-cluster situation, may now be better clustered in the middle class (with average s) lying between (with average s) and (with average s). In that situation, GRBs from should have small memberships in their closest fuzzy cluster or . But we observe that 155 GRBs of have a large mean membership of 78.034% (median ) in their nearest fuzzy class and the remaining 162 GRBs of produce a high mean membership of 70.416% (median ) in their closest fuzzy class . So in both the cases the high enough membership values prove that all 317 GRBs of are well clustered in classes and . Hence the seemingly new cluster , mixed of short and intermediate bursts, in reality redundantly emerges from numerical separation between clusters and (see, Figs. 3 and 4) without any statistical significance.
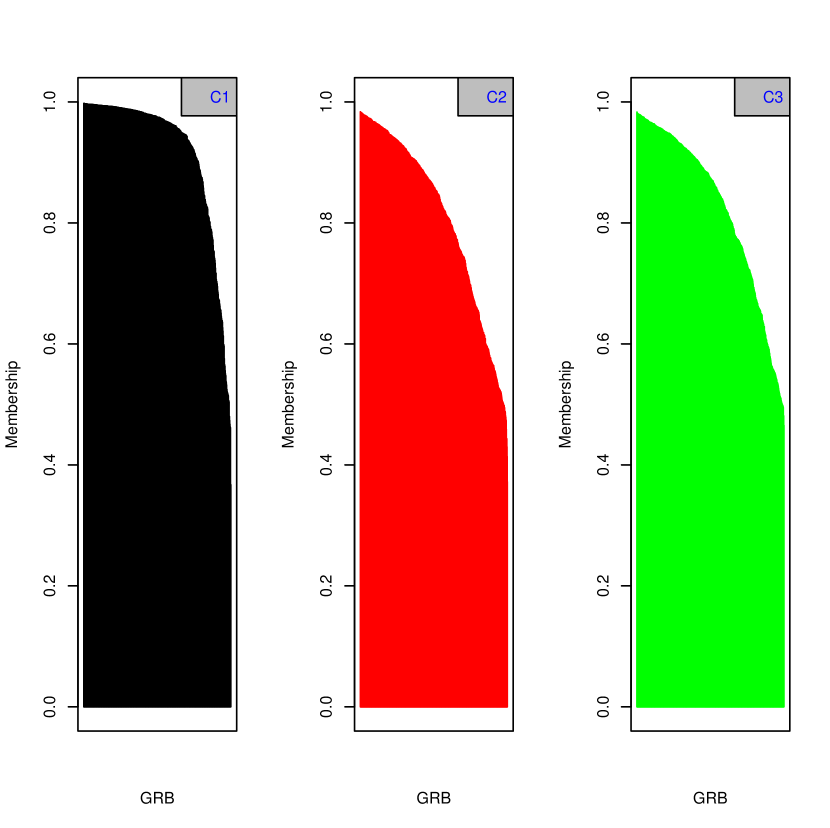
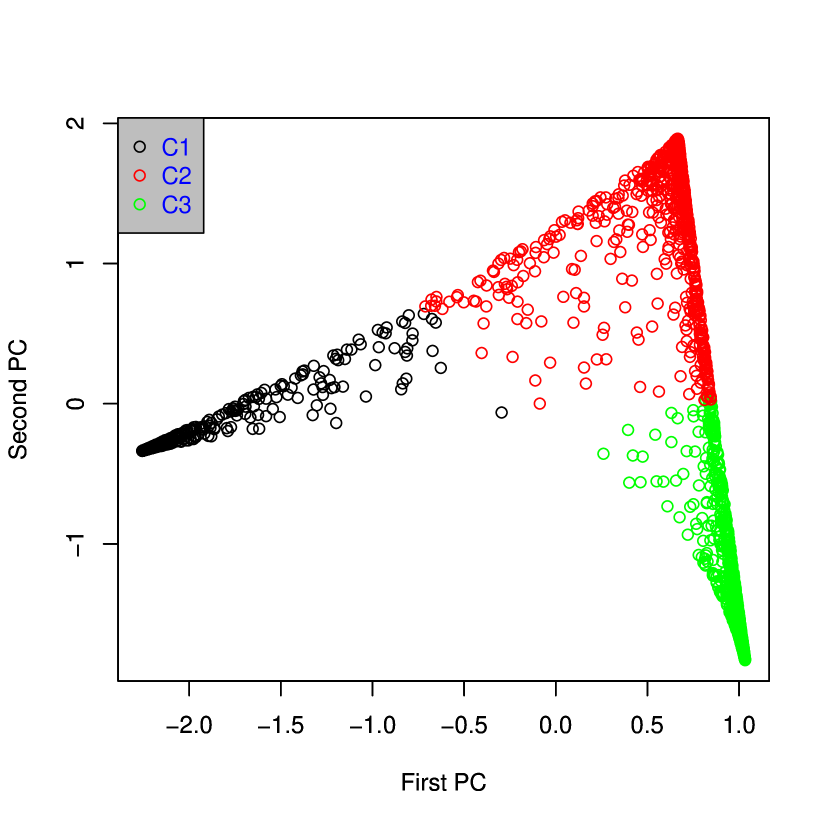
Now, we have a close look at each of the GRBs with respect to membership in its closest fuzzy cluster, i.e. the hard cluster it is assigned to through FANNY algorithm. Classes with significantly large memberships, wherein respective medians are and respective means (in %) are , and in total only 35 (1.789%) GRBs have memberships less than 50%, indicate well clustering of GRBs in the mentioned three clusters (see, Fig. 5 for a detailed visual impression of the high memberships in three clusters). Fig. 6 clearly shows three distinct clusters of GRBs in terms of the two non-degenerate principal components (PCs) explaining 53.65% and 46.35% variations, respectively, of the standardized memberships of GRBs in three fuzzy clusters resulted in FANNY algorithm (explained in Section 3). Therefore, meticulous study on the membership matrix gives strong evidence in favor of three clusters.
Moreover, FANNY algorithm with produces values for ) as and , respectively, which state that the closest hard clustering indicated by three fuzzy clusters is way more probable than that by five fuzzy groups. Finally, the same is also evidenced by the connectivity index (Handl et al. 2005; Modak et al. 2020), which provides a distance-based hard clustering validity measure having its value between zero and infinity, with a lower value suggests better clustering in terms of tighter groups. Its value for the closest hard clustering obtained through FANNY algorithm with comes out respectively as 308.081 and 455.450. Therefore, we conclude GRBs are better clustered in three groups than five, among which being part of is the short, hard class; spurious cluster is combination of short class and intermediate class ; emerges from intermediate, soft group ; and are made by separation of long, soft class between brighter with high fluence and dimmer with lower fluence groups, respectively (see, Table 2, Figs. 3 and 4).
Relevantly speaking, our three clusters are consistent with the findings in Modak et al. (2018). Their groups are comparable with our present classes , respectively. Modak et al. (2018) perform means clustering of the present BATSE GRBs using significant nonlinear features extracted through kernel principal component analysis (Schölkopf & Smola 2002; Modak et al. 2017). A novel kernel, namely kernel (10) with hyperparameters and , gives the best results of three groups based on the first two kernel principal components (KPCs) as indicated by the Dunn index (see, their Table 2). Very obviously, insufficient information in terms of merely the first KPC or irrelevant, noisy features induced by the third KPC may mislead to five clusters. However, efficient statistical machine learning methods like kernel principal component analysis, FANNY algorithm robustly expose the inherent clustering structure in GRB data set. This results in the short, hard, dim, lowest–fluence cluster ; the intermediate, soft, dimmer bursts with lower fluence from class ; and the long, soft, bright GRBs of group having high fluence and the highest peak flux (see, Table 1, Figs. 1 and 2). These statistically existing three groups may be generated by different physical processes (Mukherjee et al. 1998; Horváth 2002; Chattopadhyay et al. 2007; King et al. 2007; Modak et al. 2018). While the short and the long bursts are usually related to compact binary merger (Paczyński 1986; Usov 1992; Bloom et al. 2006; Nakar 2007; Berger 2014) and massive stellar collapse (Woosley 1993; Paczyński 1998; Woosley & Bloom 2006; Blanchard et al. 2016), respectively; astrophysical sources behind the intermediate group are yet to be confirmed following future analyses of more data, detailed study of individual GRBs using observed light curve, known redshift, other relevant variables, or fitting appropriate physical models.
Conclusions
In this paper, we reanalyze the biggest ever data set on GRBs to date from BATSE catalog to verify their natural clustering. Recently model-based clustering methods cast ambiguity by provoking a possibility of the existence of five clusters (Chattopadhyay & Maitra 2017, 2018; Toth et al. 2019) against the three well-known groups composed of short, intermediate and long bursts (Mukherjee et al. 1998; Balastegui et al. 2001; Chattopadhyay et al. 2007; Modak et al. 2018). However, the additional classes are so far at a loss to explain any new astrophysical sources, whereas Toth et al. (2019) study their cluster-wise average properties and conclude that these extra classes are further split-ups of the previously established three groups.
Based on the analysis of duration, hardness and peak flux variables, Toth et al. (2019) describe the new five clusters as short group, division of both intermediate and long groups into two further classes as dimmer and brighter (see, their Table 1). Again, study on the duration, fluence, hardness and peak flux variables results in separation of both the short and the intermediate clusters into dimmer and brighter ones, and one long cluster (see, their Table 2). It is worth noting that such decisions are made by studying group-wise average values of the variables rather than exploring the individual GRBs. They dismiss the statistically found five clusters as a result caused by violation of parametric distributional model assumptions adopted by the clustering methods. Hence, we apply the robust, nonparametric fuzzy clustering method using FANNY algorithm (Kaufman & Rousseeuw 2005), where each GRB is studied meticulously by means of its memberships in the fuzzy clusters. We statistically show that the five groups redundantly emerge from numerical separation of the established three groups and therefore solve the new conflict with confirmation of existence of three previously known clusters in GRBs whose astrophysical sources are still undergoing extensive investigation.
Acknowledgments
The author would like to thank the Editor and two anonymous referees for encouraging the present work and is sincerely grateful to the referees for their intriguing inquiries and insightful comments which helped to present the manuscript in a more precise way.
| Cluster | Cluster-size | ||||||
|---|---|---|---|---|---|---|---|
| name | (percentage) | (s) | (s) | (cm-2 s-1) | (ergs cm-2) | ||
| 529 (27.044%) | 00.327 0.015 | 00.921 0.045 | 2.363 0.160 | 01.187 0.121 | 6.425 0.206 | 3.937 0.101 | |
| 742 (37.934%) | 08.141 0.297 | 21.979 0.677 | 1.598 0.087 | 02.467 0.079 | 2.681 0.089 | 1.471 0.038 | |
| 685 (35.020%) | 37.759 2.039 | 85.361 3.082 | 5.700 0.463 | 32.639 2.636 | 3.310 0.065 | 1.941 0.042 |
| Cluster | Cluster-size | ||||||
|---|---|---|---|---|---|---|---|
| name | (percentage) | (s) | (s) | (cm-2 s-1) | (ergs cm-2) | ||
| 374 (19.120%) | 00.167 0.007 | 00.446 0.019 | 02.094 0.142 | 00.763 0.076 | 6.417 0.235 | 4.022 0.120 | |
| 317 (16.206%) | 01.265 0.044 | 03.776 0.151 | 02.992 0.266 | 02.325 0.211 | 4.863 0.282 | 2.727 0.120 | |
| 501 (25.614%) | 08.104 0.225 | 22.726 0.539 | 01.182 0.041 | 02.337 0.075 | 2.513 0.064 | 1.396 0.040 | |
| 327 (16.718%) | 22.089 1.918 | 64.438 4.142 | 10.625 0.895 | 59.709 5.112 | 3.876 0.075 | 2.355 0.055 | |
| 437 (22.342%) | 46.526 2.786 | 94.846 3.693 | 01.241 0.040 | 07.091 0.278 | 2.718 0.083 | 1.522 0.051 |
| Cluster | Total | |||
|---|---|---|---|---|
| 374 (100%) | 0 | 0 | 374 (100%) | |
| 155 (48.896 %) | 162 (51.104%) | 0 | 317 (100%) | |
| 0 | 492 (98.203%) | 9 (1.796%) | 501 (100%) | |
| 0 | 11 (3.364%) | 316 (96.636%) | 327 (100%) | |
| 0 | 77 (17.620%) | 360 (82.380%) | 437 (100%) |
References
- [1] Acuner, Z. & Ryde, F. (2018). Clustering of gamma-ray burst types in the Fermi GBM catalogue: indications of photosphere and synchrotron emissions during the prompt phase. Monthly Notices of the Royal Astronomical Society. 475, 1708–1724.
- [2] Balastegui, A., Ruiz-Lapuente, P., & Canal, R. (2001). Reclassification of gamma-ray bursts. Monthly Notices of the Royal Astronomical Society. 328, 283–290.
- [3] Bandyopadhyay, U. & Modak, S. (2018). Bivariate density estimation using normal-gamma kernel with application to astronomy. Journal of Applied Probability and Statistics. 13, 23–39.
- [4] Berger, E. (2011). The environments of short-duration gamma-ray bursts and implications for their progenitors. New Astronomy Reviews. 55, 1–22.
- [5] Berger, E. (2014). Short-Duration Gamma-Ray Bursts. Annual Review of Astronomy and Astrophysics. 52, 43–105.
- [6] Blanchard, P. K., Berger, E., Fong, W.–f. (2016). The Offset and Host Light Distributions of Long Gamma-Ray Bursts: A New View from HST Observations of Swift Bursts. The Astrophysical Journal. 817, 144.
- [7] Bloom, J. S., Prochaska, J. X., Pooley, D., Blake, C. H., Foley, R. J., Jha, S., Ramirez-Ruiz, E., Granot, J., Filippenko, A. V., Sigurdsson, S., Barth, A. J., Chen, H.-W., Cooper, M. C., Falco, E. E., Gal, R. R., Gerke, B. F., Gladders, M. D., Greene, J. E., Hennanwi, J., Ho, L. C., Hurley, K., Koester, B. P., Li, W., Lubin, L., Newman, J., Perley, D. A., Squires, G. K. & Wood-Vasey, W. M. (2006). Closing in on a short-hard burst progenitor: constraints from early-type optical imaging and spectroscopy of a possible host galaxy of GRB 050509b. The Astrophysical Journal. 638, 354–-368.
- [8] Bromberg, O., Nakar, E., Piran, T., & Sari, R. (2013). Short versus long and collapsars versus non–collapsars: a quantitative classification of gamma-ray bursts. The Astrophysical Journal. 764, 179.
- [9] Chattopadhyay, S. & Maitra, R. (2017). Gaussian-mixture-model-based cluster analysis finds five kinds of gamma-ray bursts in the BATSE catalogue. Monthly Notices of the Royal Astronomical Society. 469, 3374–3389.
- [10] Chattopadhyay, S. & Maitra, R. (2018). Multivariate -mixture-model-based cluster analysis of BATSE catalogue establishes importance of all observed parameters, confirms five distinct ellipsoidal sub-populations of gamma-ray bursts. Monthly Notices of the Royal Astronomical Society. 481, 3196–3209.
- [11] Chattopadhyay, T., Misra, R., Chattopadhyay, A. K., & Naskar, M. (2007). Statistical evidence for three classes of gamma-ray bursts. The Astrophysical Journal. 667, 1017–1023.
- [12] Dunn, J. C. (1974). Well-separated clusters and optimal fuzzy partitions. Journal of Cybernetics. 4, 95–104.
- [13] Dunn, J. C. (1976). Indices of partition fuzziness and the detection of clusters in large data sets, in Fuzzy Automata and Decision Processes, edited by M. Gupta. Elsevier, New York, USA.
- [14] Feigelson, E. D. & Babu, G. J. (Eds.) (2013). Statistical Challenges in Modern Astronomy V. Lecture Notes in Statistics 209. Springer Science+Business Media, New York, USA.
- [15] Fishman, G. J., Meegan, C. A., Wilson, R. B., Brock, M. N., Horack, J. M., Kouveliotou, C., Howard, S., Paciesas, W. S., Briggs, M. S., Pendleton, G. N., Koshut, T. M., Mallozzi, R. S., Stollberg, M., Lestrade, J. P. (1994). Astrophysical Journal Supplement Series. 92, 229–283.
- [16] Gehrels, N., Ramirez-Ruiz, E., & Fox, D. B. (2009). Gamma-Ray Bursts in the Swift Era. Annual Review of Astronomy and Astrophysics. 47, 567–617.
- [17] Hakkila, J., Giblin, T. W., Roiger, R. J., Haglin, D. J., Paciesas, W. S., Meegan, C. A. (2003). How Sample Completeness Affects Gamma-Ray Burst Classification. The Astrophysical Journal. 582, 320–329.
- [18] Hakkila, J., Haglin, D. J., Pendleton, G. N., Mallozzi, R. S., Meegan, C. A. & Roiger, R. J. (2000). Gamma-ray burst class properties. The Astrophysical Journal. 538, 165–180.
- [19] Handl, J., Knowles, K. & Kell, D. (2005). Computational cluster validation in post-genomic data analysis. Bioinformatics. 21, 3201–3212.
- [20] Hartigan, J. A. & Wong, M. A. (1979). A K-means clustering algorithm. Applied Statistics. 28, 100–108.
- [21] Hofmann, T., Schölkopf, B. & Smola, A. (2008). Kernel methods in machine learning. Annals of Statistics. 36, 1171–1220.
- [22] Horváth, I. (1998). A third class of gamma-ray bursts. The Astrophysical Journal. 508, 757–759.
- [23] Horváth, I. (2002). A further study of the BATSE Gamma-Ray Burst duration distribution. Astronomy & Astrophysics. 392, 791–-793.
- [24] Horváth, I. (2009). Classification of BeppoSAX’s gamma-ray bursts. Astrophysics & Space Science. 323, 83–86.
- [25] Horváth, I., Bagoly, Z., Balázs, L. G., de Ugarte Postigo, A.,Veres, P. & Mászáros, A. (2010). Detailed classification of Swift’s gamma-ray bursts. The Astrophysical Journal. 713, 552–557.
- [26] Horváth, I., Balázs, L. G., Bagoly, Z., Ryde, F., Mészáros, A. (2006). A new definition of the intermediate group of gamma-ray bursts. Astronomy & Astrophysics. 447, 23–30.
- [27] Horváth, I., Balázs, L. G., Bagoly, Z. & Veres, P. (2008). Classification of Swift’s gamma-ray bursts. Astronomy & Astrophysics, 489, L1–L4.
- [28] Horváth, I., Mészáros, A., Balázs, L. G., & Bagoly, Z. (2004). Where is the Third Subgroup of Gamma-Ray Bursts. Baltic Astronomy. 13, 217–220
- [29] Horváth, I. & Tóth, B. G. (2016). The duration distribution of Swift Gamma-Ray Bursts. Astrophysics & Space Science. 361, 155.
- [30] Horváth, I., Tóth, B. G., Hakkila, J., Tóth, L. V., Balázs, L. G., Rácz, I. I., Pintér, S. & Bagoly, Z., (2018). Classifying GRB 170817A/GW170817 in a Fermi duration–hardness plane. Astrophysics & Space Science, 363, 53.
- [31] Ishida, E. E. O. & Souza, R. S. de. (2013). Kernel PCA for type Ia supernovae photometric classification. Monthly Notices of the Royal Astronomical Society. 430, 509–532.
- [32] Kaufman, L. & Rousseeuw, P. J. (2005). Finding Groups in Data: An Introduction to Cluster Analysis. John Wiley & Sons, New Jersey.
- [33] King, A., Olsson, E., & Davies, M. B. (2007). A new type of long gamma-ray burst. Monthly Notices of the Royal Astronomical Society. 374, L34.
- [34] Koen, C. & Bere, A. (2012). On multiple classes of gamma-ray bursts, as deduced from autocorrelation functions or bivariate duration/hardness ratio distributions. Monthly Notices of the Royal Astronomical Society. 420, 405–415.
- [35] Kouveliotou, C., Meegan, C. A., Fishman, G. J., Bhat, N. P., Briggs, M. S., Koshut, T. M., Paciesas, W. S., & Pendleton, G. N. (1993). Identification of two classes of gamma-ray bursts. The Astrophysical Journal. 413, L101.
- [36] Levan, A., Crowther, P., de Grijs, R., Langer, N., Xu, D., Yoon, S.–C. (2016). Gamma-Ray Burst Progenitors. Space Science Reviews. 202, 33–78.
- [37] Mazets, E. P., Golenetskii, S. V., Ilyinskii, V. N., Panov, V. N., Aptekar, R. L., Guryan, Yu. A., Proskura, M. P., Sokolov, I. A., Sokolova, Z. Ya., Kharitonova, T. V., Dyatchkov, A. V., & Khavenson, N. G (1981). Catalog of cosmic gamma-ray bursts from the KONUS experiment data. Astrophysics and Space Science. 80, 119–143.
- [38] Meegan, C. A., Fishman, G. J., Wilson, R. B., Paciesas, W. S., Pendleton, G. N., Horack, J. M., Brock, M. N., & Kouveliotou, C. (1992). Spatial distribution of -ray bursts observed by BATSE. Nature. 355, 143–145.
- [39] Meegan, C. A., Pendleton, G. N., Briggs, M. S., Kouveliotou, C., Koshut, T. M., Lestrade, J. P., Paciesas, W. S., McCollough, M. L., Brainerd, J. J., Horack, J. M., Hakkila, J., Henze, W., Preece, R. D., Mallozzi, R. S., Fishman, G. J. (1996), The Third BATSE Gamma-Ray Burst Catalog. Astrophysical Journal Supplement Series. 106, 65–110.
- [40] Modak, S. & Bandyopadhyay, U. (2019). A new nonparametric test for two sample multivariate location problem with application to astronomy. Journal of Statistical Theory and Applications. 18, 136–146.
- [41] Modak, S., Chattopadhyay, T. & Chattopadhyay, A. K. (2017). Two phase formation of massive elliptical galaxies: study through cross-correlation including spatial effect. Astrophysics and Space Science. 362, 206–215.
- [42] Modak, S., Chattopadhyay, A. K. & Chattopadhyay, T. (2018). Clustering of gamma-ray bursts through kernel principal component analysis. Communications in Statistics – Simulation and Computation. 47, 1088–1102.
- [43] Modak, S., Chattopadhyay, T. & Chattopadhyay, A. K. (2020). Unsupervised classification of eclipsing binary light curves through k-medoids clustering. Journal of Applied Statistics. 47, 376–392.
- [44] Mukherjee, S., Feigelson, E. D., Babu, G. J., Murtagh, F., Fraley, C. & Raftery, A. (1998). Three types of gamma-ray bursts. The Astrophysical Journal. 508, 314–327.
- [45] Nakar, E. (2007). Short-hard gamma-ray bursts. Physics Reports. 442, 166–236.
- [46] Norris, J. P., Cline, T. L., Desai, U. D., & Teegarden, B. J. (1984). Frequency of fast, narrow -ray bursts. Nature. 308, 434–435.
- [47] Paciesas, W. S., Meegan, C. A., Pendleton, G. N., Briggs, M. S., Kouveliotou, C., Koshut, T. M., Lestrade, J. P., McCollough, M. L., Brainerd, J. J., Hakkila, J., Henze, W., Preece, R. D., Connaughton, V., Kippen, R. M., Mallozzi, R. S., Fishman, G. J., Richardson, G. A., & Sahi, M. (1999). The fourth BATSE gamma-ray burst catalog (revised). The Astrophysical Journal Supplement Series. 122, 465–495.
- [48] Paczyński, B., (1986). Gamma-ray bursters at cosmological distances . The Astrophysical Journal. 308, L43–L46.
- [49] Paczyński, B., (1998). Are gamma-ray bursts in star-forming regions. The Astrophysical Journal. 494, L45.
- [50] Rajaniemi, H. J. & Mähönen, P. (2002). Classifying Gamma-Ray Bursts using Self-organizing Maps. The Astrophysical Journal. 566, 202–209.
- [51] Řípa, J. & Mészáros, A. (2016). On the connection of gamma-ray bursts and X-ray flashes in the BATSE and RHESSI databases. Astrophysics & Space Science. 361, 370.
- [52] Řípa, J., Mészáros, A., Wigger, C., Huja, D., Hudec, R. & Hajdas, W. (2009). Search for gamma-ray burst classes with the RHESSI satellite. Astronomy & Astrophysics. 498, 399–406.
- [53] Roubens, M. (1982). Fuzzy clustering algorithms and their cluster validity. European Journal of Operational Research. 10, 294–301.
- [54] Rousseeuw, P. J., Derde, M. P. & Kaufman, L. (1989). Principal components of a fuzzy clustering. Trend in Analytical Chemistry. 8, 249–250.
- [55] Schölkopf, B. & Smola, A. (2002). Learning with kernels: Support vector machines, regularization, optimization, and beyond. MIT Press, London, England.
- [56] Schwarz, G. (1978). Estimating the Dimension of a Model. Annals of Statistics. 6, 461–464.
- [57] Tóth, B. G., Rácz, I. I. & Horváth, I. (2019). Gaussian-mixture-model-based cluster analysis of gamma-ray bursts in the BATSE catalog. Monthly Notices of the Royal Astronomical Society. 486, 4823–4828.
- [58] Tsutsui, R. & Shigeyama, T. (2014). On the subclasses in Swift long gamma-ray bursts: A clue to different central engines. Publications of the Astronomical Society of Japan. 66, 42.
- [59] Usov, V. V. (1992). Millisecond pulsars with extremely strong magnetic fields as a cosmological source of -ray bursts. Nature. 357, 472–474.
- [60] Veres, P., Bagoly, Z., Horváth, I., Mészáros, A. & Balázs, L. G. (2010). A Distinct Peak-flux Distribution of the Third Class of Gamma-ray Bursts: A Possible Signature of X-ray Flashes. The Astrophysical Journal. 725, 1955–1964.
- [61] Woosley, S. E. (1993). Gamma-Ray Bursts from Stellar Mass Accretion Disks around Black Holes. The Astrophysical Journal. 405, 273–277.
- [62] Woosley, S. E. & Bloom, J. S. (2006). The Supernova Gamma-Ray Burst Connection. Annual Review of Astronomy & Astrophysics. 44, 507–556.
- [63] Zhang, F.–W., Shao, L., Yan J.–Z., & Wei, D.–M. (2012). Revisiting the Long/Soft-Short/Hard Classification of Gamma-Ray Bursts in the Fermi Era . The Astrophysical Journal. 750, 88.
- [64] Zhang, B., Zhang, B.–B., Virgili, F. J., Liang, E.–W., Kann, D. A., Wu, X.-F., Proga, D., Lv, H.–J., Toma, K., Mészáros, P., Burrows, D. N., Roming, P. W. A., & Gehrels, N. (2009). Discerning the Physical Origins of Cosmological Gamma-Ray Bursts based on Multiple Observational Criteria: The cases of GRB 080913, GRB 090423 and Some Short/Hard GRBs. The Astrophysical Journal. 703, 1696–1724.
- [65] Zitouni, H., Guessoum, N., Azzam, W. J., & Mochkovitch, R. (2015). Statistical study of observed and intrinsic durations among BATSE and Swift/BAT GRBs. Astrophysics and Space Science. 357, 7.