Evaluation of Sustainable Green Materials: Pinecone in Permeable Adsorptive Barriers for Remediation of Groundwater Contaminated by and Methylene Blue
Abstract
We report herein, the potential of raw pinecone powder (PCP) and pinecone biochar (PCBC) as alternatives to activated carbon used in Permeable Adsorptive Barriers (PABs) for the in situ remediation of polluted groundwater. A constructed lab-scale unconfined aquifer ( ) fitted with PCP and PCBC PABs ( ), was evaluated for the removal of ions in a continuous flow setup. Results indicate that after minutes, PCP was able to reduce ions from a Co= to for the first run and for a second run, respectively. Comparatively, PCBC reached for the first run and for the second run. It was confirmed that adsorption was best described by the first-order kinetic model with values above . Maximum adsorption capacity values were found to be , , , and mg/g for each scenario respectively. In addition, nonlinear regression models of exponential and Gaussian Processes are fit to explain remediation by time for and Methylene Blue. Gaussian Processes are able to better explain the variation of pollution removal compared to simpler exponential models. When regressed against true removal percentages all models are able to provide .
keywords:
Permeable Adsorptive Barriers, Pinecone Char, , Methylene Blue, Gaussian Process Regression, green materials1 Problem Definition
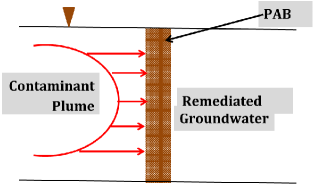
Groundwater contamination by heavy metals such as is a huge environmental concern because groundwater is a major source of water for day today application. The presence of Pb2+ in groundwater is a direct hazard to human beings causing severe neurological complications as well as organ and tissue damage (Mohammad et al. (2010)). Pb2+ pollution in groundwater can be related to various anthropogenic sources including: landfill waste disposal (Oyeku and Eludoyin (2010)), industrial and agricultural activities (Amin et al. (2011)). Groundwater pollution could also occurs as a result of water exchange from contaminated surface waters or leaching from contaminated soils through rainfall infiltration (Di Natale et al. (2008)). In situ remediation of contaminated groundwater sites presents more advantages in relation to ex situ pump and treat technologies including: feasibility and effectiveness of the method (Di Natale et al. (2008)); its versatile and simple configuration (Erto et al. (2014)); and low operation costs and energy requirements (Park et al. (2002)). In situ treatment makes use of Permeable Reactive Barriers (PRB) made of zero valent iron (Fe0) as the reactive material (Di Natale et al. (2008); Erto et al. (2014); Park et al. (2002); Blowes et al. (2000); Kamolpornwijit et al. (2003); Simon et al. (2002); Komnitsas et al. (2006); Di Natale et al. (2006); Keith et al. (2005)). The barriers are inserted underground to intercept the natural flow of contaminated groundwater allowing the water to pass through the barrier (Erto et al. (2014)) and is passively treated through redox and precipitation reactions (Di Natale et al. (2008)). The main shortcoming of the Fe0 barriers is the accumulation of precipitates that may limit barrier longevity by reducing porosity and conductivity (Blowes et al. (2000)) and preferential flow paths in the barrier may form leading to a reduction of the contact time of the contaminated water with the reactive material (Kamolpornwijit et al. (2003)). Researchers have therefore investigated the possible application of adsorbents as alternative materials to in Permeable Adsorptive Barriers (PAB). The main adsorbent applied in PABs is activated carbon (Di Natale et al. (2008); Erto et al. (2014)). Due to the environmental impact and costly nature of activated carbon, other adsorbents such as zeolites (Park et al. (2002)) have been investigated for the application in PABs.
In this study we investigated the possible application of cheaply acquired and environmentally sustainable raw pinecone powder (PCP) and pinecone biochar (PCBC) as adsorbents in PABs for in situ remediation of groundwater contaminated by in a lab-scale constructed unconfined aquifer.
2 Materials and Methods
2.1 Adsorbent Fabrication
Sun-dried pinecones were collected from the backyard of the principal investigator in Columbia, South Carolina, USA. The cones were scaled and washed with deionized water to remove all traces of impurities. Washed scales were subsequently oven dried at for 1 hour then ground into finer particles using a planetary ball mill to obtain raw pinecone powder (PCP).

Portions of the acquired powder was converted into pinecone biochar through hydrothermal carbonization (HTC) performed as follows: grams of the PCP and of deionized water were packed into custom HTC reactor and oven heated at for hours to obtain respective pinecone biochars (PCBC).
The physico-chemical properties of the adsorbents were determined through material characterization using a PerkinElmer Fourier transform infrared spectrometer (FTIR), a Zeiss Ultra Plus Field Emission Scanning Electron Microscope (FESEM), a Shimadzu X-ray diffraction (XRD), and Micrometrics ASAP 2020 Brunner-Emmett-Teller (BET) analyzer.
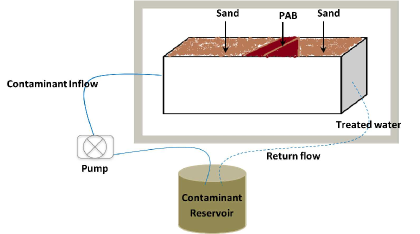
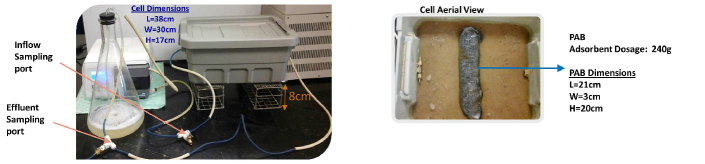
2.2 Experimental Setup
A lab-scale constructed cell emulating an unconfined aquifer (38x30x17cm) was packed with clean sand of known particle size distribution (Fig 3). The cell was then centrally fitted with PCP and PCBC PABs (21x3x20cm). A peristaltic pump set at a constant pumping rate of 70ml/min was used to continuously pump 6 of 50 of from a contaminant reservoir via an influent tubing into the cell (Fig 4). The total contact time between the contaminant and each PABs was minutes. Samples were collected using an effluent sampling port at 10 minute interval within the first 60 minutes and subsequently after every 60 minutes. The same experimental setup was repeated with reused PABs to investigate the residence time of the PABs. Collected samples were analyzed for final concentrations using an air/acetylene Agilent Atomic Absorption (AA) Spectrophotometer.
3 Results
3.1 Adsorbent Characterization
The FTIR spectra were measured within a scan range of 4000-650 wave number. According to the spectra shown in Fig. 5(a) PCP and PCBC have shown the presence of essential functional groups on their surfaces. The infrared spectra bands observed at and represent the carboxylic acid group and aliphatic stretches. The peak at corresponds to a conjugated stretch while peak represented a stretch (Ofomaja et al. (2009)). It is observed that the intensity of the functional group bands, stretches and peaks were lower in PCBC compared to PCP. These variations in intensity indicate that diverse thermal decompositions transpired throughout the HTC process resulting in loss of various functional groups on the surface of PCBC (Al-Asheh and Duvnjak (1997)).

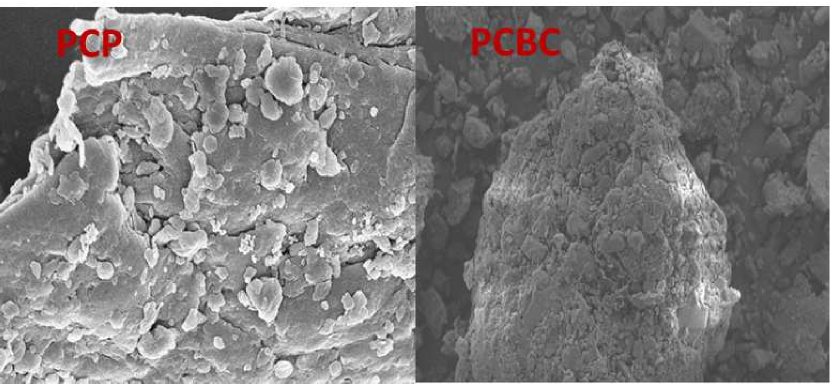
The SEM images shown in Fig. 5(b) indicates the surface morphology of the adsorbents. The presences of pores on pinecone materials indicate that they present good characteristics to be employed as adsorbents for metal ions uptake (Al-Asheh and Duvnjak (1997)). PCP consist of a smooth flat multilayer surface with tiny pores while PCBC depicted a coarser and rougher surface and larger pores. This change in the microstructure of PCBC can be attributed to the release of volatile gas contained in soften biomass matrix during the HTC processing (do Nascimento et al. (2012)). The XRD analysis revealed that pine cone materials are highly amorphous indicating that they can be used as good adsorbents for heavy metals (Wuana and Okieimen (2011)). PCBC had a slightly higher percent amorphous zone of than that of PCP of .
The BET surface areas analysis of the adsorbents showed that PCP had a higher surface area of than that of PCBC of . The average pore sizes were and for PCBC and PCP respectively.
3.2 Adsorption Results
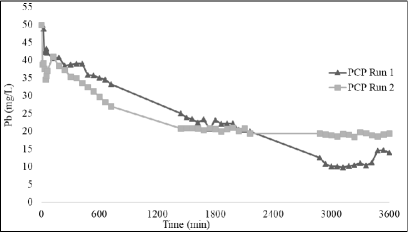
The effect of contact time and type of adsorbent barrier on the removal of from a simulated unconfined aquifer was evaluated. The efficiency of the PCP and PCBC was further investigated by spiking the system with fresh of . Obtained results were plotted final concentrations versus time as shown in Figs. 6 and Fig. 7. PCP PAB, Fig. 6, resulted in a decrease in final concentration with increasing contact time. The lowest concentration attained with PCP was at time minutes. Beyond this time a steady rise in final concentration to a final concentration of at time minutes was observed, an indication possible instances of desorption. The second run using PCP PAB resulted in a much lower adsorption efficiency. Similar decrease in final concentration with time was observed, however an equilibrium was attained at time minutes with a final concentration of .
The adsorption trend depicted by PCP can be attributed to its characteristics. PCP depicted a higher BET surface area and a highly amorphous structure that could explain its high adsorption efficiency in the first run. The lower adsorption efficiency in the second run can be attributed to the high intensity of acidic functional group on PCP. The group could have formed intermolecular bonds with H2O molecules from the first run causing the surface of PCP to be covered molecules hence minimal adsorption of . PCBC PAB, Fig. 6, depicted a higher adsorption efficiency for compared to PCP. A decrease in final concentration with contact time was observed. The adsorption with PCBC attained the lowest concentration of at time with no observable equilibrium. The second run with PCBC also depicted similarly high adsorption efficiency with final concentration of at time minutes.
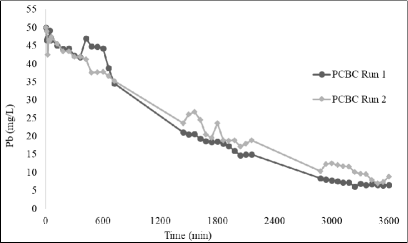
The high adsorption efficiency for PCBC can also be related to its properties. PCBC depicted a higher amorphous structure that PCP. This property allows it to have more intermolecular space to for to be adsorbed. It was also reported to have a high average pore size that can be attributed to its high adsorption efficiencies in both first and second runs. PCBC further depicted minimal functional groups, this could have resulted in minimal competition of its adsorption sites, allowing to be adsorbed more efficiently.
3.3 Pseudo First-Order Kinetic Model
Kinetic analysis of adsorption results is necessary as it provides insight on the rates of adsorption mechanism which are used primarily in the modeling and design process (Jeyakumar and Chandrasekaran (2014)) and is important in analyzing the efficiency of the process (Bulut (2007)). The experimental data were fitted in the linear form of the pseudo-first-order rate Eq. (1) given as:
| (1) |
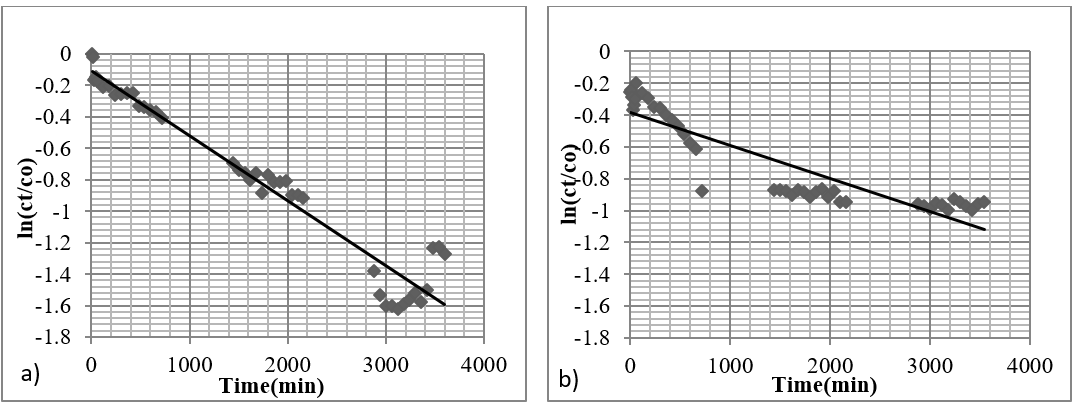
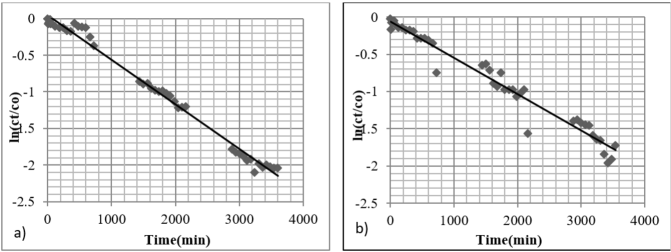
Where [] and [] are final and initial concentrations of respectively and () is the pseudo-first-order adsorption rate constant. The linear plots of versus (minutes) drawn for the pseudo-first-order model are shown in Figs. 8 and 9. The slopes of the plots of the experimental data and the intercepts of were used to determine the rate constant and the corresponding regression correlation coefficient values. The results are given in Table 1.
The correlation coefficients for the second-order kinetics model () are greater , indicating the applicability of this kinetics equation and the first-order nature of adsorption process of onto PCB and PCBC PABs.
| Adsorptive Barrier | Rate Constant () | |
|---|---|---|
| PCP Run | 0.9439 | |
| PCP Run | 0.8081 | |
| PCBC Run | 0.9894 | |
| PCBC Run | 0.9634 |
3.4 Nonlinear Regression Models
Experimental design- flow diagram of the contaminated groundwater through the PAB. In this subsection, results from models fitted for percent removal with respect to time () and thickness () are presented. Out of several models fitted, based on the root mean squared error, minimum and simplest model is presented here. Within several nonlinear regression models: hyperbolic tangent, logistic, exponential (see Eq. (2)), and Gaussian Processes, latter two provided better results. Model parameters are optimized by gradient descent. GPs kernel coefficients are considered hyperparameters. The time was transformed as .
| (2) |
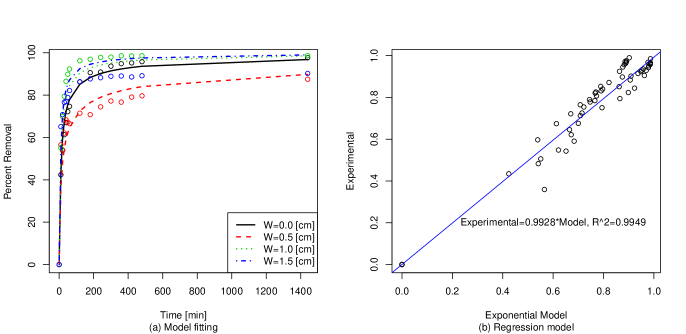
where, for and , and denotes the thickness. For Methylene Blue, and .
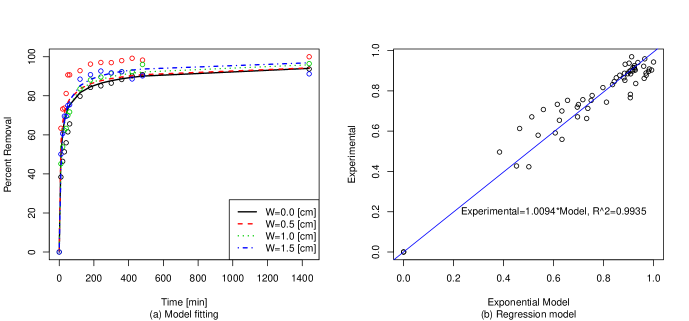
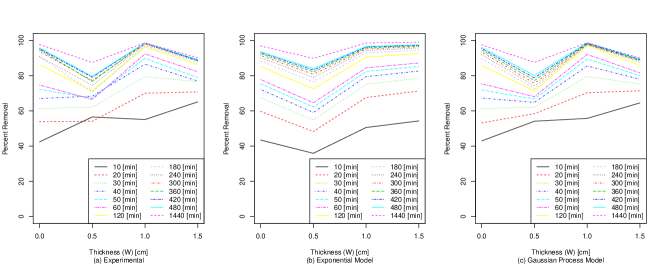
In Figs. 10 and 11, performance of exponential models are given. As we can see, models are able to fail if percent removal changes with respect thicknesses. They estimate that to removal behave either increasing or decreasing. However, behaves differently in both contaminant removals. Overall, as regression curves show, models are able to estimate better than any multiple linear regression model.
In this paper, Gaussian Process (GP) notation was adopted from Gramacy (2020). The nonlinear regression alternative, GPs can be simply written as multivariate Gaussian distributions via covariance structure defined over time, dependent variable, or spatial correlations. For instance, with general exponential decaying covariance structure can be expressed as where is number explanatory variables (e.g., three for and two for Methylene Blue), are hyperparameters to be optimized for best describing curve of the process, i.e., percent removal in this paper and is jittering with e.g., needed for inverse of the covariance matrix. In Eq. (3), fitting a GP models is given Gramacy (2020); Shi and Cheng (2014).
| (3) |
With new observations with size , GP-based predictions can be calculated by using Eq. (4).
| (4) |
For hyperparameters optimized are , for time, for pH, and for thickness . Similarly for Methylene Blue , for time and for thickness Shi and Cheng (2014).
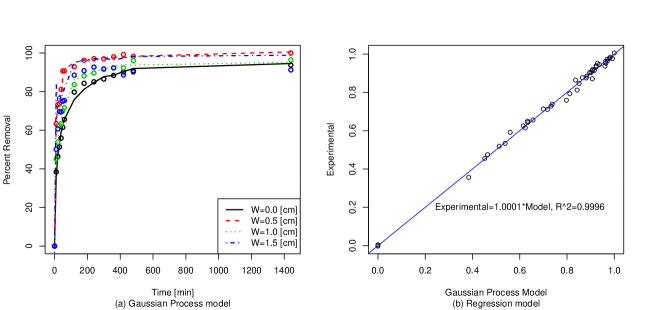
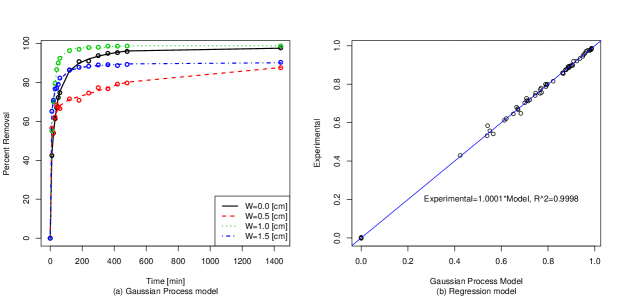
In Figs. 12 and 13, performance of GP models are given. As we can see, GP models are able to explain the percent removal changes with respect thicknesses with pH () and without pH (Methylene Blue). They are able to estimate the varying behavior in both contaminant removals. Moreover, GP prediction performance was shown in for . From regression curve, it can be seen that GP shows decent performance by following the straight line with coefficient of .
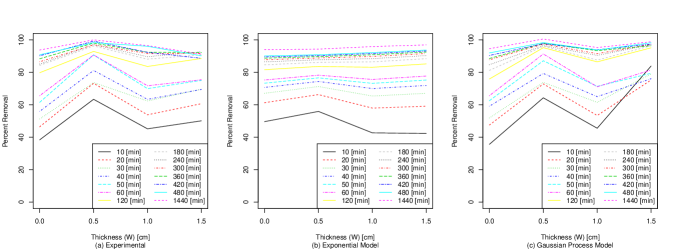
In Figs. 14 and 15, performance of Exponential and GP models are compared. We can see the behavior of GP estimates are much closer to observed percent removals at different times and thickness levels. We can also see that for optimum thickness level is about and for Methylene Blue is about .
3.5 Conclusion
This study investigated the possibility of applying pinecone derived adsorbents; PCP and PCBC in PABs for the remediation of from a simulated unconfined aquifer. Results have indicated that both PCP and PCBC possess adsorptive potentials capable of removing from a contaminated groundwater system. PCBC has depicted higher adsorption capacity both in the first run and the second run with spiked concentrations. PCP removed and of in the first and second runs respectively. PCBC on the other hand was capable of removing a total of and of in the first and second run respectively. Due to the major influence of functional groups on the adsorption of using PCP, it can deduced that the adsorption mechanism was chemisorption while PCBC exhibited a physi-sorption mechanism.
Nonlinear regression models were fit to explain the percent removal. Gaussian Process regression performs excellent which can be used to predict percent removal in between thicknesses against time and pH values. Behavior of the removal after certain time can also be predicted at certain thickness.
Acknowledgments
This paper is based upon work supported by DOE-EM Grant No. 0000473 and Freeda M. Johnson Laboratory for Environmental Research, Benedict College. This study is also partially supported by the Center for Connected Multimodal Mobility () (USDOT Tier 1 University Transportation Center) headquartered at Clemson University, Clemson, South Carolina. Any opinions, findings, and conclusions or recommendations expressed in this material are those of the authors and do not necessarily reflect the views of the Center for Connected Multimodal Mobility () and the official policy or position of the USDOT/OST-R, or any State or other entity, and the U.S. Government assumes no liability for the contents or use thereof. It is also partially supported by NSF SC EPSCoR/IDeA, 1719501, 1436222, 1954532, and 1400991.
References
- Al-Asheh and Duvnjak (1997) Al-Asheh, S., Duvnjak, Z., 1997. Sorption of cadmium and other heavy metals by pine bark. Journal of Hazardous Materials 56 (1-2), 35–51.
- Amin et al. (2011) Amin, S., Farjoud, M., Shabani, A., 2011. Groundwater contamination by heavy metals in water resources of shiraz area.
- Blowes et al. (2000) Blowes, D. W., Ptacek, C. J., Benner, S. G., McRae, C. W., Bennett, T. A., Puls, R. W., 2000. Treatment of inorganic contaminants using permeable reactive barriers. Journal of contaminant hydrology 45 (1-2), 123–137.
- Bulut (2007) Bulut, Y., 2007. Removal of heavy metals from aqueous solution by sawdust adsorption. Journal of environmental sciences 19 (2), 160–166.
- Di Natale et al. (2008) Di Natale, F., Di Natale, M., Greco, R., Lancia, A., Laudante, C., Musmarra, D., 2008. Groundwater protection from cadmium contamination by permeable reactive barriers. Journal of Hazardous Materials 160 (2-3), 428–434.
- Di Natale et al. (2006) Di Natale, M., Greco, R., Musmarra, D., 2006. Groundwater remediation by permeable adsorbing barriers to capture hexavalent chrome plume. In: 2nd IASTED International Conference on Environmental Modeling and Simulation. Vol. 1. IASTED, pp. 31–36.
- do Nascimento et al. (2012) do Nascimento, R. F., de Sousa, F. W., Neto, V. O. S., Fechine, P. B. A., Teixeira, R. N. P., Paulo de Tarso, C., Araujo-Silva, M. A., 2012. Biomass adsorbent for removal of toxic metal ions from electroplating industry wastewater. Electroplating, InTech, Rijeka, 101–136.
- Erto et al. (2014) Erto, A., Bortone, I., Di Nardo, A., Di Natale, M., Musmarra, D., 2014. Permeable adsorptive barrier (pab) for the remediation of groundwater simultaneously contaminated by some chlorinated organic compounds. Journal of environmental management 140, 111–119.
- Gramacy (2020) Gramacy, R. B., 2020. Surrogates: Gaussian Process Modeling, Design, and Optimization for the Applied Sciences. CRC Press.
- Jeyakumar and Chandrasekaran (2014) Jeyakumar, R. S., Chandrasekaran, V., 2014. Adsorption of lead (ii) ions by activated carbons prepared from marine green algae: Equilibrium and kinetics studies. International Journal of Industrial Chemistry 5 (1), 2.
- Kamolpornwijit et al. (2003) Kamolpornwijit, W., Liang, L., West, O., Moline, G., Sullivan, A., 2003. Preferential flow path development and its influence on long-term prb performance: column study. Journal of contaminant hydrology 66 (3-4), 161–178.
- Keith et al. (2005) Keith, P. D., Lai, C., Kjeldsen, P., Lo, I. M., 2005. Effect of groundwater inorganics on the reductive dechlorination of tce by zero-valent iron. Water, Air, and Soil Pollution 162 (1-4), 401–420.
- Komnitsas et al. (2006) Komnitsas, K., Bartzas, G., Paspaliaris, I., 2006. Inorganic contaminant fate assessment in zero-valent iron treatment walls. Environmental Forensics 7 (3), 207–217.
- Mohammad et al. (2010) Mohammad, M., Maitra, S., Ahmad, N., Bustam, A., Sen, T., Dutta, B. K., 2010. Metal ion removal from aqueous solution using physic seed hull. Journal of hazardous materials 179 (1-3), 363–372.
- Ofomaja et al. (2009) Ofomaja, A., Naidoo, E., Modise, S., 2009. Removal of copper (ii) from aqueous solution by pine and base modified pine cone powder as biosorbent. Journal of Hazardous Materials 168 (2-3), 909–917.
- Oyeku and Eludoyin (2010) Oyeku, O., Eludoyin, A., 2010. Heavy metal contamination of groundwater resources in a nigerian urban settlement. African Journal of Environmental Science and Technology 4 (4).
- Park et al. (2002) Park, J.-B., Lee, S.-H., Lee, J.-W., Lee, C.-Y., 2002. Lab scale experiments for permeable reactive barriers against contaminated groundwater with ammonium and heavy metals using clinoptilolite (01-29b). Journal of hazardous materials 95 (1-2), 65–79.
- Shi and Cheng (2014) Shi, J., Cheng, Y., 2014. Gpfda: apply gaussian process in functional data analysis. R package version 2.
- Simon et al. (2002) Simon, F.-G., Meggyes, T., Tünnermeier, T., 2002. Groundwater remediation using active and passive processes. In: Advanced groundwater remediation: Active and passive technologies. Thomas Telford Publishing, pp. 3–34.
- Wuana and Okieimen (2011) Wuana, R. A., Okieimen, F. E., 2011. Heavy metals in contaminated soils: a review of sources, chemistry, risks and best available strategies for remediation. Isrn Ecology 2011.