Scale-Aware Network with Regional and Semantic Attentions for Crowd Counting under Cluttered Background
Abstract
Crowd counting is an important task that shown great application value in public safety-related fields, which has attracted increasing attention in recent years. In the current research, the accuracy of counting numbers and crowd density estimation are the main concerns. Although the emergence of deep learning has greatly promoted the development of this field, crowd counting under cluttered background is still a serious challenge. In order to solve this problem, we propose a Scale-Aware Crowd Counting Network (SACCN) with regional and semantic attentions. The proposed SACCN distinguishes crowd and background by applying regional and semantic self-attention mechanisms on the shallow layers and deep layers, respectively. Moreover, the asymmetric multi-scale module (AMM) is proposed to deal with the problem of scale diversity, and regional attention based dense connections and skip connections are designed to alleviate the variations on crowd scales. Extensive experimental results on multiple public benchmarks demonstrate that our proposed SACCN achieves satisfied superior performances and outperform most state-of-the-art methods. All codes and pre-trained models will be released soon.
Index Terms:
Crowd counting, scale-aware, cluttered background, attention mechanism.I Introduction
High-density crowds are prone to public accidents and accelerate the spread of diseases. In the past year, the COVID-19 has swept the world. In order to prevent its spread again, it is of great significance to monitor and analyze high-density crowds and provide timely and effective evacuation. As one of the most important assistance for the analysis of high-density population, crowd counting is conducive to real-time guidance and control. Therefore, it has a wide range of applications in public safety-related fields and has attracted widespread attention in the field of computer vision. The task of crowd counting is aims to estimate the number and the distribution of people in a crowd. In the past, the mainstream methods relied on object detection [1, 2, 3] and regression [4, 5]. Recently, with the success of deep learning, crowd counting tasks have also made significant progress [6, 7, 8, 9]. However, it is still a challenging task since crowd scale variation and cluttered backgrounds is very common in the real world.
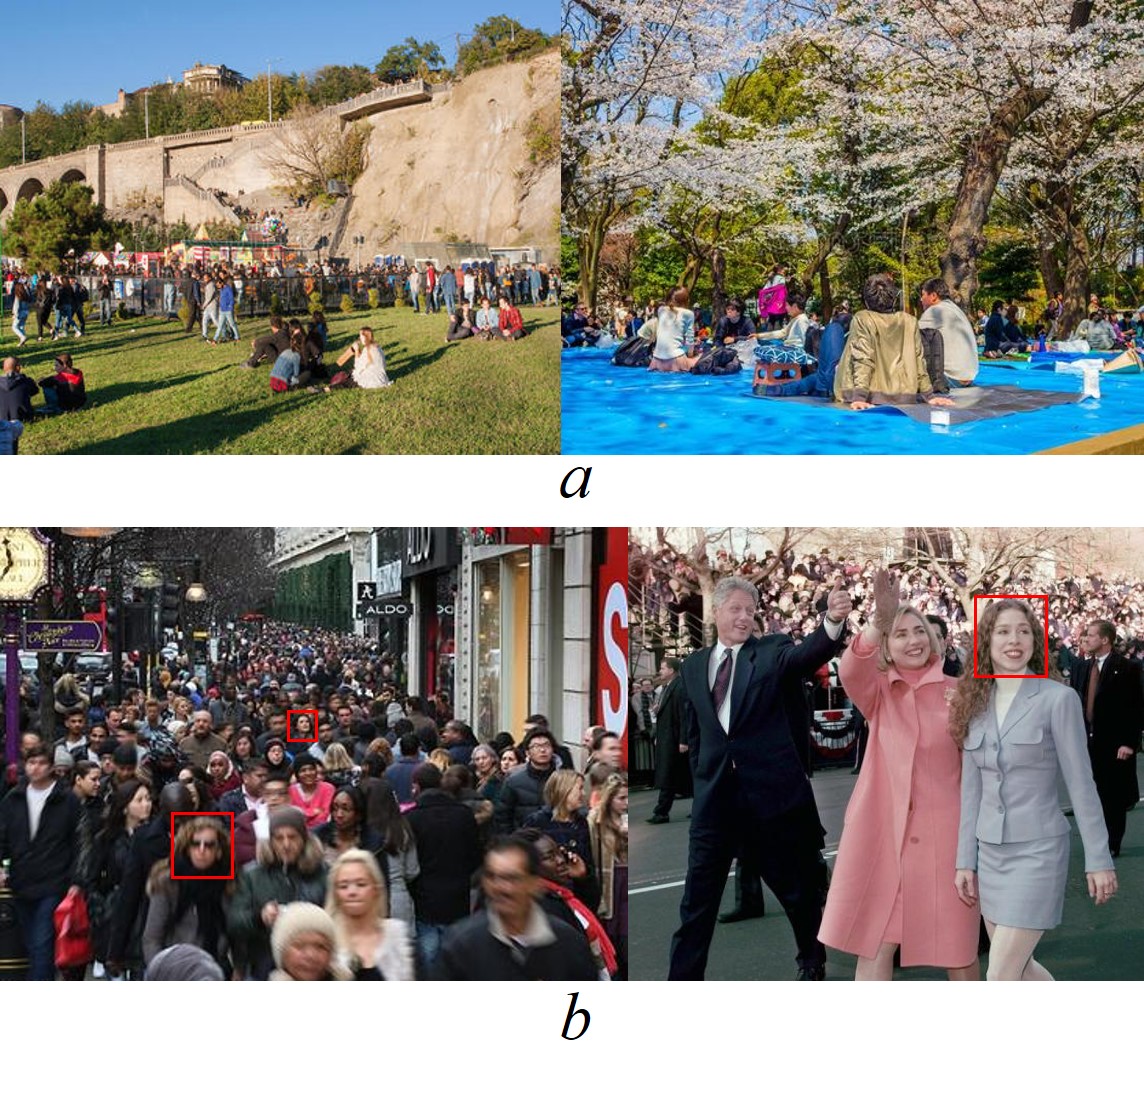
As shown in Fig. 1 (a), the background of the crowd scene is very complicated. Due to the gathering and interference of objects other than people, certain parts of the crowd are not easy to be distinguished from a cluttered background. In this case, crowd counting methods are prone to fail accurately counting the crowd and evaluating its distribution. As shown in Fig. 1 (b), the sizes of persons in the crowd have large variations, either caused by camera perspective or camera position. All these unexpected variations put forward rigorous requirements on the robustness of crowd counting algorithms. Therefore, in this paper, we aim to design effective solutions for these two obstacles.
To alleviate the counting errors caused by cluttered backgrounds, current mainstream solutions [10, 11, 12, 13] adopt visual attention mechanism. In the latest works, such as SDANet [13] and HA-CCN [11], researchers found that background and crowd were easier to be distinguished on shallow feature maps. Therefore, they suggested to apply pixel-wise attention on low-level feature maps. However, as we know, features in different channels contribute different discriminative information on classifying cluttered backgrounds and crowds. Limitedly applying pixel-attention is not enough. In this paper, we proposed to design region attention module (RAM) on shallow layers, in which channel-wise attention and pixel-attention collaborate to highlight crowd regions.
Moreover, we argue that distinguishing clutter backgrounds and crowd foreground can be taken as a semantic classification task. According to [14], features in deep layers have richer semantic information and less noise than shallow-layer features for semantic categorization. Therefore, we further propose a semantic attention module (SAM) on deep layers, in which spatial self-attention and channel-wise self-attention collaborate to identify persons in semantic space.
To alleviate the negative influences from crowd scale variations, current mainstream works proposed to utilize strategies like multi-column CNN [7], stacked multi-branch blocks [15, 16] and multi-scale feature fusion [17, 13]. However, the crowd scale variation is still far from being solved. As we know, features of different resolutions at different levels redundantly contain complementary information for crowd identification. Therefore, in this paper, we proposed to construct our crowd counting network in a U-like encoder-decoder structure for adequate feature reuse. Compared with traditional U-like network, the big differences are that, in the encoder stage, regional attention based dense connections are constructed to strength information fusion specifically for crowd identification. Regional attention based skip-connections between encoder and decoder stages and asymmetric multi-scale residual blocks in the decoder stage are originally proposed to account for information aggregation of different resolutions.
The main contributions can be summarized as followings:
-
•
We propose a Scale-Aware Crowd Counting Network (SACCN), which is concentrated on overcoming adverse influences from cluttered background and scale variations in crowd scenes. Comprehensive experiments demonstrate that our SACCN achieves superior performance.
-
•
We design two attention modules for crowd identification under cluttered backgrounds. One is the regional attention module (RAM), which calculates spatial and channel-wise attention on shallow features. The other is the semantic attention module (SAM) that imposes both spatial and channel self-attention on deep feature maps. These two attention modules are collaboratively employed in cascade and can effectively highlight crowd areas from cluttered backgrounds.
-
•
We propose an asymmetric multi-scale module (AMM) to deal with the problem of scale variations. The module employs asymmetric convolutions with different scales to learn crowd density maps. Ablation experiments confirmed that it can effectively improve the model performance and reduce the model parameters.
-
•
We design the regional attention based connections for complementary feature reuse, including the dense connections among shallow layers of the encoder and the skip connections between encoder and decoder. Ablation studies demonstrate that both connections play important roles in performance improvement.
II Related Work
The methods of crowd counting can be roughly divided into three paradigms: traditional detection-based methods, regression-based methods, and modern CNN-based methods. In this section, we briefly review some typical related works for completeness.
II-A Detection-based Methods
Traditional detection-based methods [18, 1] mainly focused on the characteristics of people, like face, body, etc. Methods of this paradigm usually employed sliding window-based detection schemes. Hand-crafted features like Haar wavelets [2] and Histogram of Gradient (HoG) [19] were extracted from images for object classification. Generally, these methods can provide accurate count in scenes with sparse objects, but in scenes with complex backgrounds and dense objects. These methods cannot work well when there exist severe crowd occlusion and large variations on crowd scales.
II-B Regression-based Methods
In order to deal with complex scenes with dense crowds, some methods [20, 3] proposed a regression method to avoid hard detection. These methods generally learned regression functions from local features of image patches to counting numbers. In these cases, spatial distribution information of people was often ignored.
Some other researchers [21, 22] also proposed density-based regression methods to take full advantage of annotation. However, variations in the crowd scale and cluttered backgrounds are still the main obstacles.
II-C CNN-based Methods
With the success of the convolution neural network (CNN) in the computer vision field, the crowd counting community has also realized to make use of the strong representation learning ability of CNN to estimate crowd density. CNN-based methods [7, 8, 13, 11] have shown significant improvements over previous methods.
Most of CNN-based methods address the problems of crowd scale variation and cluttered backgrounds through strategies such as multi-column CNN [7], stacked multi-branch blocks [15], multi-scale feature fusion [17, 13], selective regression [23, 24] and visual attention [12].
Crowdnet [4] was the first work to generate a density map by using the convolution network. It adopted a dual-column structure to solve crowd scale variation problems. MCNN [7] adopted a multi-column structure for crowd counting. CSRNet [8] adopted dilated convolutions that expanded the receptive field without parameters increasing. SANet [25] stacked multi-branch blocks as the feature extractor to overcome variations on crowd scales. MBTTBF-SCFB[17] propose a multilevel bottom-top and top-bottom fusion method. SDANet [13] found that using channel-wise attention in shallow layers can distinguish background and crowd better than in deep layers. HA-CCN [11] uses spatial attention in different levels of VGGNet [26] to distinguish the background and the crowd.
The closest methods to ours are the latest SDANet [13] and the HA-CCN [11]. However, there exist many big differences. For example, they only apply single attention, either limited channel-wise attention or spatial attention. In contrast, our method combines channel-wise attention and spatial attention together on feature maps at shallow layers to distinguish complicated backgrounds and crowd. Moreover, we employ spatial and channel-wise self-attention on deep layers at the same time to enhance discriminability of semantic representations for crowd.
III Scale-Aware Crowd Counting Network
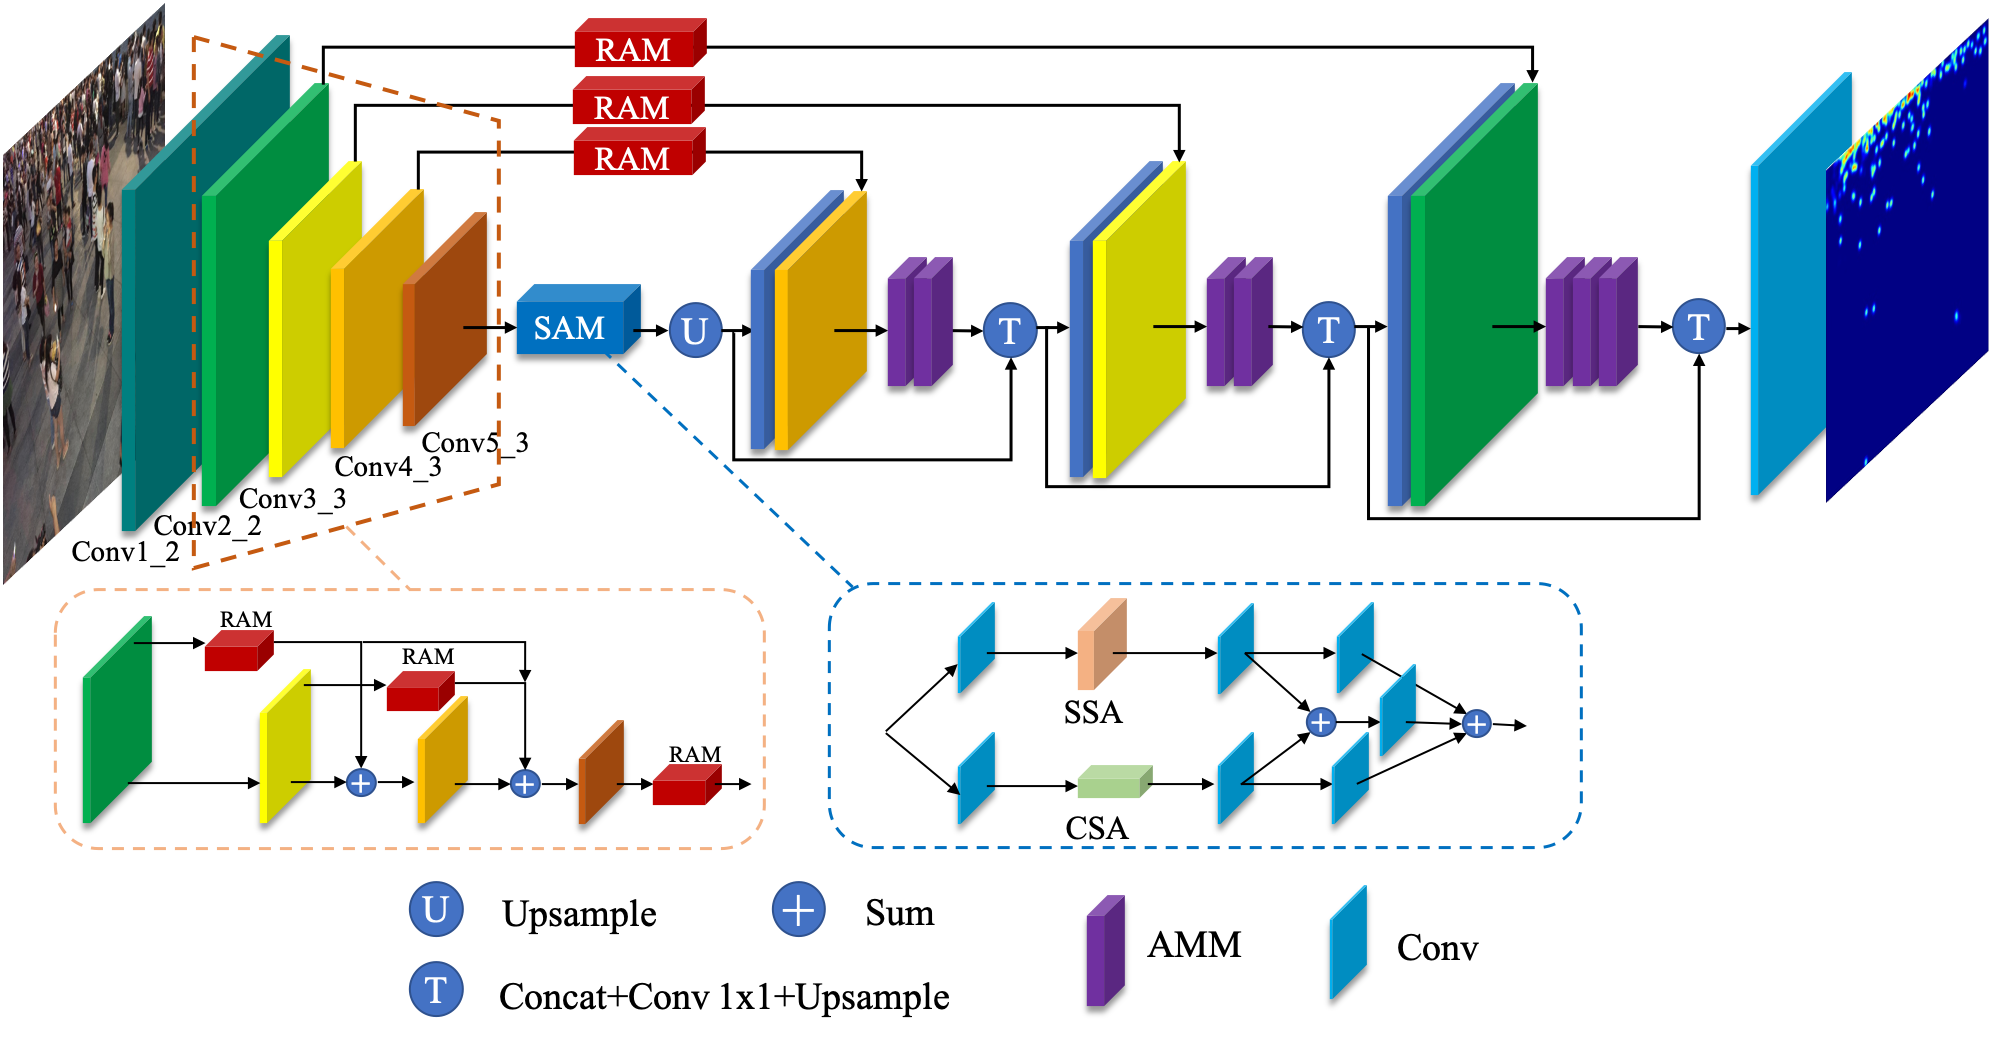
In this section, we describe the proposed Scale-Aware Crowd Counting Network(SACCN) in detail. As shown in Fig. 2, our method is mainly composed of three parts: encoder part, decoder part and regional attention based connections. Specifically, in the encoder part, the pre-trained VGGNet16[26] model is employed as the backbone network for feature extraction. Regional attention based dense connections are constructed to specifically strengthen information fusion for crowd identification. In the decoder part, asymmetric multi-scale residual blocks are employed to account for information aggregation of different resolutions. Regional attention based skip-connections between encoder and decoder layers are for feature reuse and crowd highlights. More details are explained in the following subsections.
III-A Attention Modules
Generally, crowd scene images not only contain people, but also backgrounds such as buildings, trees, cars, etc. Attention has been proved to be a very helpful mechanism for crowd counting [13, 11], especially when dealing with clutter backgrounds. Therefore, we specifically propose both regional attention and semantic attention modules for crowd representations highlighting.
III-A1 Regional Attention Module
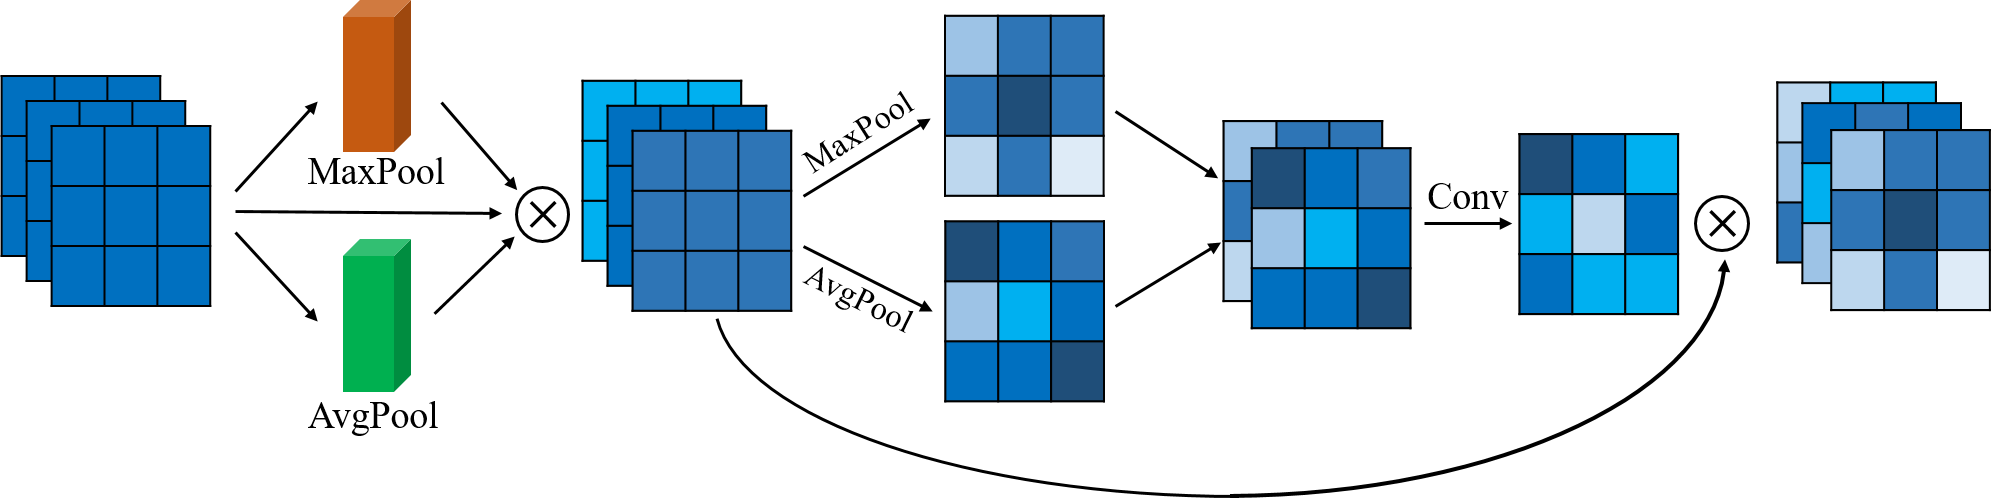
The structure of regional attention module (RAM) is shown in Fig. 3. It cascade combines channel-wise attention and spatial attention in a holistic block. The channel-wise attention learns to capture the importance of different feature channels, helping suppress unnecessary noisy information. Spatial attention is to focus on crowd relevant areas. Through explicitly employing spatial attention on the feature maps processed by channel-wise attention, the proposed network can be more easily encouraged to focus on representations learning for the interested crowd areas.
Formally, given a feature map , in channel-wise attention, average-pooling and max-pooling are firstly performed to produce pooled features respectively. Then, the and pass through two fully-connected (FC) layers to produce and , as shown Equation 1. Parameters of the two FC layers are shared across the two paths.
| (1) | ||||
Then, channel-wise attention vector is generated according to Equation 2.
| (2) |
Intermediate feature map is therefore obtained through element-wise weighting on input .
| (3) |
Similar to channel-wise attention, spatial attention in parallel employs max-pooling and average-pooling on in channel direction to produce and respectively. Then, and are concatenated in channel to get . We employ a convolution with kernel size on it to produce a spatial attention map .
| (4) |
Finally, the feature map is taken as the output of regional attention module, where represents elementary multiplication.
III-A2 Semantic Attention Module
Motivated by the success of self-attention [27, 28, 29] in many high-level vision tasks, we explore to utilize it on crowd counting tasks.
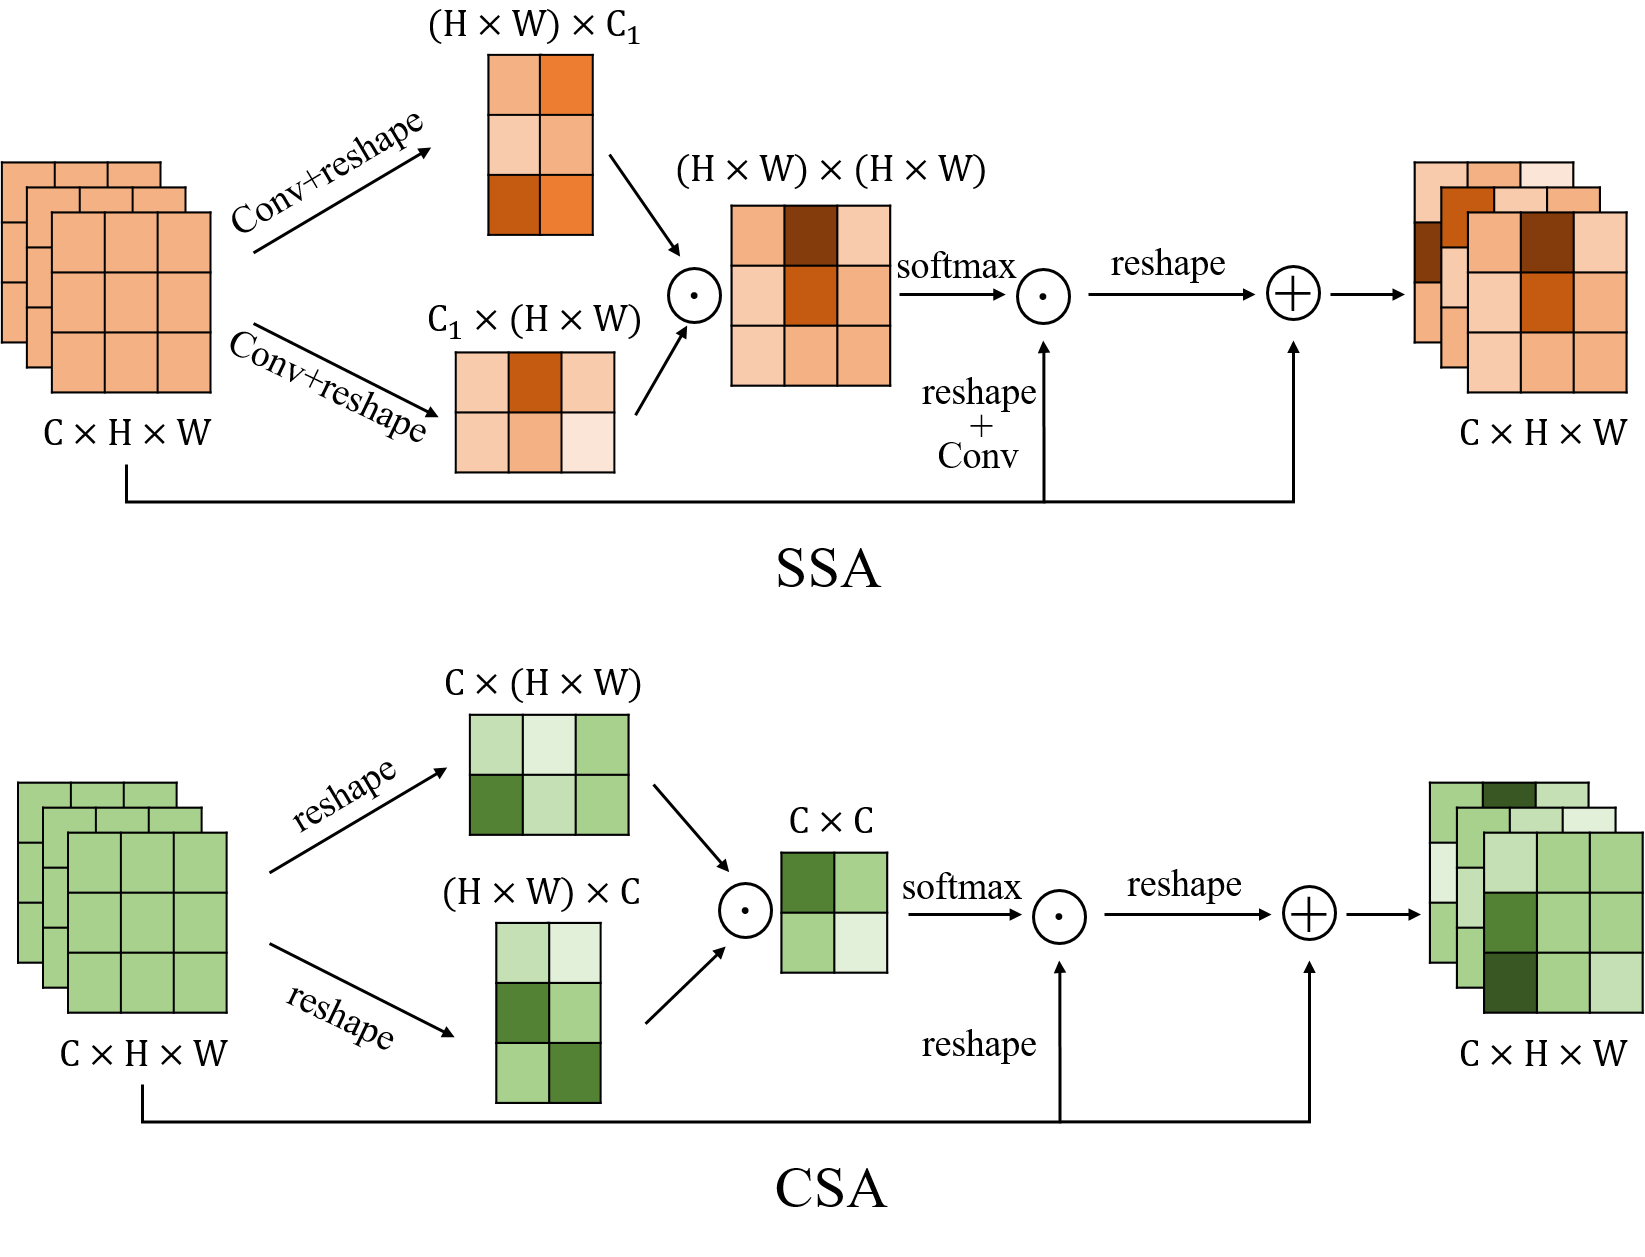
The structure of the proposed semantic attention module (SAM) is shown in Fig. 2. It is mainly composed of spatial self-attention (SSA), channel-wise self-attention (CSA), and some necessary convolutions. The structural details of SSA and CSA are shown in Fig. 4.
In case of spatial self-attention (SSA), given a feature map , two channel-wise features are firstly transformed to -dimension feature space, both through convolution with kernel size . Then, the resulted feature map is reshaped to and . A spatial attention map is consequently generated through feature correlation as shown in Equation 5.
| (5) |
where, represents matrix product.
In parallel, we perform feature transformation on input through a convolution with kernel size , and generate an intermediate feature .
The output of SSA block is then calculated in residual mode, as shown in Equation 6.
| (6) |
where, represents matrix product.
In case of channel-wise self-attention (CSA), given a feature map , we firstly reshape the feature map to produce and . Then, we perform matrix product and softmax operations to generate a channel-wise attention vector , as shown in Equation 7.
| (7) |
The is weighted by . The output of CSA is therefore generated according to Equation 8.
| (8) |
III-B Asymmetric Multi-scale Module
| Method | Part_A | Part_B | UCF_CC_50 | UCF_QNRF | ||||
|---|---|---|---|---|---|---|---|---|
| MAE | MSE | MAE | MSE | MAE | MSE | MAE | MSE | |
| MCNN[7](CVPR’16) | 110.2 | 173.2 | 26.4 | 41.3 | 377.6 | 509.1 | 277.0 | 426.0 |
| CP-CNN[24](ICCV’17) | 73.6 | 106.4 | 20.1 | 30.1 | 295.8 | 320.9 | - | - |
| Switch-CNN[23](CVPR’17) | 90.4 | 135.0 | 21.6 | 33.4 | 318.1 | 439.2 | 228.0 | 445.0 |
| CSRNet[8](CVPR’18) | 68.2 | 115.0 | 10.6 | 16.0 | 266.1 | 397.5 | 135.4 | 207.4 |
| SANet[25](ECCV’18) | 67.0 | 104.5 | 8.4 | 13.6 | 258.5 | 334.9 | - | - |
| ic-CNN[30](ECCV’18) | 69.8 | 117.3 | 10.7 | 16.0 | 260.9 | 365.5 | - | - |
| HA-CCN[11](TIP’19) | 62.9 | 94.9 | 8.1 | 13.4 | 256.2 | 348.4 | 118.1 | 180.4 |
| MACC[31](TCSVT’19) | 61.8 | 100.0 | 8.6 | 13.3 | 245.4 | 349.3 | - | - |
| COBC[32](TCSVT’19) | 62.8 | 102.0 | 8.6 | 16.4 | 239.6 | 322.2 | 118.0 | 192.0 |
| ADCrowdNet[12](CVPR’19) | 63.2 | 98.9 | 8.2 | 15.7 | 266.4 | 358.0 | - | - |
| CAN[33](CVPR’19) | 61.3 | 100.0 | 7.8 | 12.2 | 212.2 | 243.7 | 107.0 | 183.0 |
| PSDDN[34](CVPR’19) | 85.4 | 159.2 | 16.1 | 27.9 | 359.4 | 514.8 | - | - |
| SPN+L2SM[35](ICCV’19) | 64.2 | 98.4 | 7.2 | 11.1 | 188.4 | 315.3 | - | - |
| MBTTBF-SCFB[17](ICCV’19) | 60.2 | 94.1 | 8.0 | 15.5 | 233.1 | 300.9 | 97.5 | 165.2 |
| DSSINet[36](ICCV’19) | 60.6 | 96.1 | 6.9 | 10.4 | 216.9 | 302.4 | 99.1 | 159.2 |
| SDANet[13](AAAI’20) | 63.6 | 101.8 | 7.8 | 10.2 | 227.6 | 316.4 | - | - |
| DUBNet[37](AAAI’20) | 64.4 | 106.8 | 7.7 | 12.5 | 243.8 | 329.3 | 105.6 | 180.5 |
| HSRNet[38](ECAI’20) | 62.3 | 100.3 | 7.2 | 11.8 | - | - | - | - |
| KDMG [39](T-PAMI’20) | 63.8 | 99.2 | 7.8 | 12.7 | - | - | 99.5 | 173 |
| SACCN (Ours) | 59.2 | 98.0 | 6.8 | 10.5 | 178.0 | 258.5 | 96.1 | 167.8 |
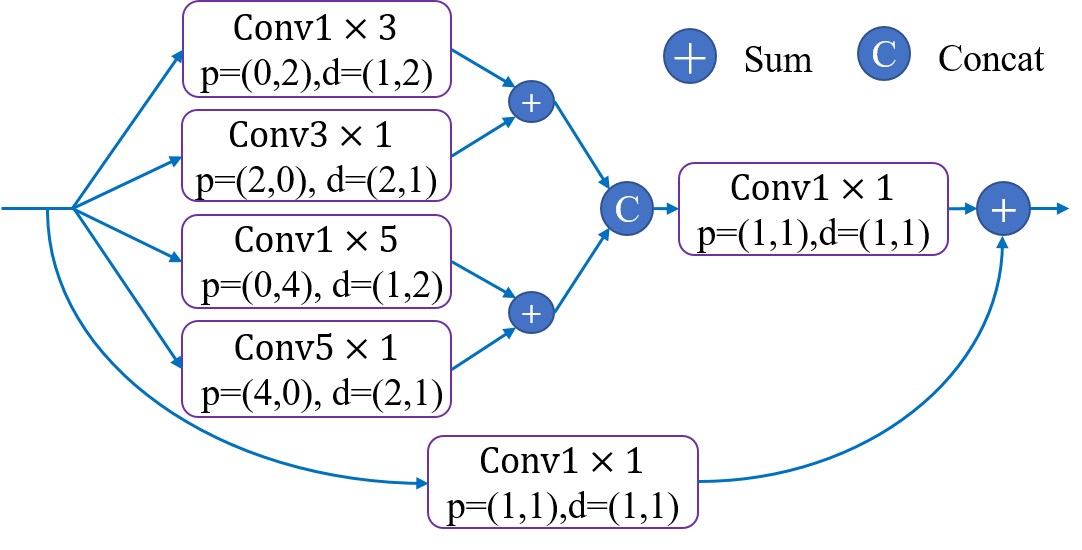
In crowd counting related works, multi-scale modules are widely used to solve scale variations. Inspired by Inception-v3 [40] and ACNet [41], we propose to use asymmetric convolutions for density estimation. As shown in Fig. 5, we design an asymmetric multi-scale module (AMM) which approximates conventional convolution with a kernel size of by the summation of two asymmetric convolutions with kernel size of and . The convolution is employed for feature fusion after the concatenation of multi-branch convolutions.
Moreover, in order to enlarge the receptive field without parameters increase, all asymmetric convolutions are set to be dilated convolutions. In this paper, the dilation rate is set to be 2. To ensure the size of the output feature keeping the same as input, we set the padding for each convolution, such as the padding (0,2) for is and (0,4) for .
III-C Regional Attention based Connections
In previous work [17, 13], multi-scale fusion is verified to be helpful for crowd counting. Therefore, in order to make full use of the redundant and complementary information from different layers, we construct several kinds of regional attention based connections in our crowd counting network. The connections are shown in Fig. 2.
III-C1 Regional Attention Based Dense Connections
We employ the first 13 layers of VGG16 as the backbone network for feature extraction. Besides, we add extra dense connections among layers , , , and for multi-resolution feature reuse. In order to highlight crowd information while suppress background, we utilize region attention mechanism in dense connection paths, as shown in Fig. 2. We formulate the process in Equation 9.
| (9) | ||||
where, is the input of the ”” layer in encoder. RAM represents the regional attention module, means down-sampling by times .
III-C2 Regional Attention Based Skip-connections
As we know, when the encoder going deeper, the resolutions of the feature map are becoming lower due to the down-sampling process. For adequate feature reuse, skip-connections are adopted in a conventional U-like encoder-decoder network. However, from the viewpoint of information reuse, convention skip connections transfer information uniformly without specific focus. In our method, we propose to introduce regional attention into skip-connections to highlight crowd identification.
For the convenience of description, we denote the layer in the decoder having the same size as its counterpart layer ”Conv ” in the encoder. We formulate the skip connections process as Equation 10 and Equation 11.
| (10) |
| (11) |
where, stands the output of the counterpart layer in decoder, represents the fused features after skip connections at the counterpart layer in decoder. RAM (or SAM) represents the Regional Attention Module (or Semantic Attention Module). AMM represents Asymmetric Multi-scale Module. represents convolution layer with kernel size of . ”” represents concatenation in channel. represents times Upsampling.
IV Experiments
In this section, we will describe our experimental evaluations in details. Firstly, experiment settings including training details, evaluation metrics and datasets are introduced. Then, comparisons among the proposed SACCN with some popular state-of-the-art approaches are performed on several public benchmarks. Finally, in ablation studies, the effects of key components proposed in SACCN is investigated and analyzed.
IV-A Experimental Setup
IV-A1 Training Details
The network is trained end-to-end using the Adam optimizer with a learning rate of 0.0001 and a momentum of 0.9 on single NVIDIA 2080Ti GPU. The batch size is set to be 4. Mean Squared Error (MSE) is taken as the loss function to constrain the network output and ground truth. Following HA-CCN, we employ similar data augmentation methods on training data, such as randomly cropping image patches from the images, and randomly flipping patches horizontally with a probability of 0.5.
IV-A2 Evaluation Metrics
Following most of crowd counting methods, we use mean absolute error (MAE) and mean square error (MSE) as evaluation metrics. The smaller the value of MAE and MSE, the better the performance.
| (12) |
| (13) |
where, is the predicted counting number, and stands for the ground truth.
IV-B Datasets
We conduct experiments on several benchmark datsets, including ShanghaiTech Part_A and Part_B [6], UCF_CC_50 [43], UCF-QNRF [44], WorldExpo’10 [6], Mall [3]. and the TRANCOS [42] dataset.
IV-B1 ShanghaiTech Dataset
ShanghaiTech dataset [6] is composed of 1198 annotated images, including 330165 annotated people. The dataset consists of Part_A and Part_B. Part_A contains 482 images of highly congested scenes randomly downloaded from the Internet. Among them, 300 images are for training and 182 images are for the test. Part_B contains 716 images of relatively sparse crowd scene taken from streets in Shanghai. There are 400 images in the training set and 316 images in the test set.
| Method | S1 | S2 | S3 | S4 | S5 | Average |
|---|---|---|---|---|---|---|
| MCNN[7] | 3.4 | 20.6 | 12.9 | 13.0 | 8.1 | 11.6 |
| MSCNN[45] | 7.8 | 15.4 | 14.9 | 11.8 | 5.8 | 11.7 |
| CP-CNN[24] | 2.9 | 14.7 | 10.5 | 10.4 | 5.8 | 8.86 |
| ic-CNN[30] | 17.0 | 12.3 | 9.2 | 8.1 | 4.7 | 10.3 |
| SANet[25] | 2.6 | 13.2 | 9.0 | 13.3 | 3.0 | 8.2 |
| CSRNet[8] | 2.9 | 11.5 | 8.6 | 16.6 | 3.4 | 8.6 |
| ADCrowdNet[12] | 1.7 | 14.4 | 11.5 | 7.9 | 3.0 | 7.7 |
| CAN[33] | 2.9 | 12.0 | 10.0 | 7.9 | 4.3 | 7.4 |
| MACC[31] | 2.2 | 11.5 | 11.6 | 13.9 | 2.5 | 8.34 |
| COBC[32] | 2.1 | 11.5 | 8.1 | 16.8 | 2.5 | 8.2 |
| DSSINet[36] | 1.6 | 9.5 | 9.5 | 10.4 | 2.5 | 6.7 |
| ZoomCount[46] | 2.1 | 15.3 | 9.0 | 10.3 | 4.5 | 8.3 |
| SDANet[13] | 2.0 | 14.3 | 12.5 | 9.5 | 2.5 | 8.1 |
| SACCN (Ours) | 1.5 | 10.6 | 8.1 | 8.9 | 2.7 | 6.4 |
IV-B2 UCF_CC_50 Dataset
UCF_CC_50 dataset [43] is an extremely challenging crowd dataset. All 50 images of different resolutions are randomly collected from the Internet. The number of people in these images varies greatly in a wide range from 94 to 4543. There are a total of 63974 head annotations. The average number per image is 1280. Besides, the dataset contains diverse scenes with varying perspective distortions. For better verification of model accuracy, we follow standard setting [43] and conduct 5-fold cross-validation for the test.
IV-B3 UCF_QNRF Dataset
UCF_QNRF dataset [44] is a recently proposed large-scale crowd dataset. It contains 1,535 images in which there are about 1.25 million head annotations. These images have many different scenes, backgrounds, and perspectives. The training dataset contains 1201 training images. The test dataset containing 334 images. Many of them are in very high-resolution. Therefore, we transform all images to a fixed size of before any pre-processing.
IV-B4 WorldExpo’10 Dataset
WorldExpo’10 dataset [6] is a large scale data-driven cross-scene crowd counting dataset which is collected from Shanghai 2010 WorldExpo. The dataset consists of 1132 annotated video sequences captured by 108 different surveillance cameras. Each camera with different view angles provides the region of interest (ROI). The whole dataset contains a total of 3920 frames in a fixed resolution of . It is divided into a training set with 3380 frames and a test set with 600 frames.
IV-B5 Mall Dataset
Mall dataset [3] is a dataset with relatively sparse crowd scenes. The dataset contains 2000 frames in a video, which are captured by using a surveillance camera installed in a shopping mall. The scenes significantly vary in the crowd’s scale and appearances due to perspective distortion. In addition, there exist challenging occlusions caused by objects in the scene. We use the first 800 frames as the training set, and the left 1200 frames as the test set to evaluate our model.
| Method | GAME 0 | GAME 1 | GAME 2 | GAME 3 |
|---|---|---|---|---|
| Fiaschi et al.[47] | 17.77 | 20.14 | 23.65 | 25.99 |
| Lempitsky et al.[21] | 13.76 | 16.72 | 20.72 | 24.367 |
| Hydra-3s[48] | 10.99 | 13.75 | 16.69 | 19.32 |
| CSRNet[8] | 3.67 | 5.82 | 8.53 | 14.40 |
| PSDDN[34] | 4.79 | 5.43 | 6.68 | 8.40 |
| COBC[32] | 3.15 | 5.45 | 8.34 | 15.02 |
| HSRNet[38] | 3.03 | 4.57 | 6.46 | 9.68 |
| KDMG[39] | 3.13 | 4.79 | 6.20 | 8.68 |
| SACCN (Ours) | 2.20 | 3.11 | 4.18 | 5.77 |
| Method | MAE | MSE |
|---|---|---|
| CNN-Boosting[49] | 2.01 | - |
| W-VLAD[50] | 2.67 | 11.72 |
| ConvLSTM[51] | 2.24 | 8.5 |
| DecideNet[10] | 1.52 | 1.9 |
| E3D[52] | 1.64 | 2.13 |
| SAAN[53] | 1.28 | 1.68 |
| AT-CNN[54] | 2.28 | 2.9 |
| Deem-CFCN[55] | 2.11 | 2.71 |
| FMLF[56] | 1.85 | 2.34 |
| HSRNet[38] | 1.8 | 2.28 |
| SACCN (Ours) | 1.42 | 1.85 |
IV-B6 TRANCOS Dataset
TRANCOS dataset [42] is the first one for vehicle counting in traffic jam scenes. It contains 1244 traffic images with vehicle numbers varying from 9 to 107. The dataset is often used to evaluate the generalization ability of population counting methods.
IV-C Experiment Results
We compare our proposed SACCN with state-of-the-art methods on ShanghaiTech Part_A/Part_B, UCF_CC_50, UCF_QNRF, WorldExpo’10, Mall, and TRANCOS.
From TABLE I, on the ShanghaiTech Part_A/Part_B, UCF_CC_50, and UCF_QNRF, it is not difficult to observe that the proposed SACCN achieves the lowest MAE in almost all datasets, showing more superiority over the other methods.
The comparison results on the WorldExpo’10 dataset are shown in TABLE II. From TABLE II, we can see that the proposed SACCN delivers top-2 accuracy in 3 out of 5 scenes and achieves the best accuracy on average.
For the Mall dataset and TRANCOS dataset, the comparison results are shown in TABLE IV and TABLE III respectively. In the case of the Mall dataset, the proposed SACCN achieves second lower MAE and MSE among all methods. In the case of the TRANCOS dataset, the proposed method delivers the best results according to the GAME metric.
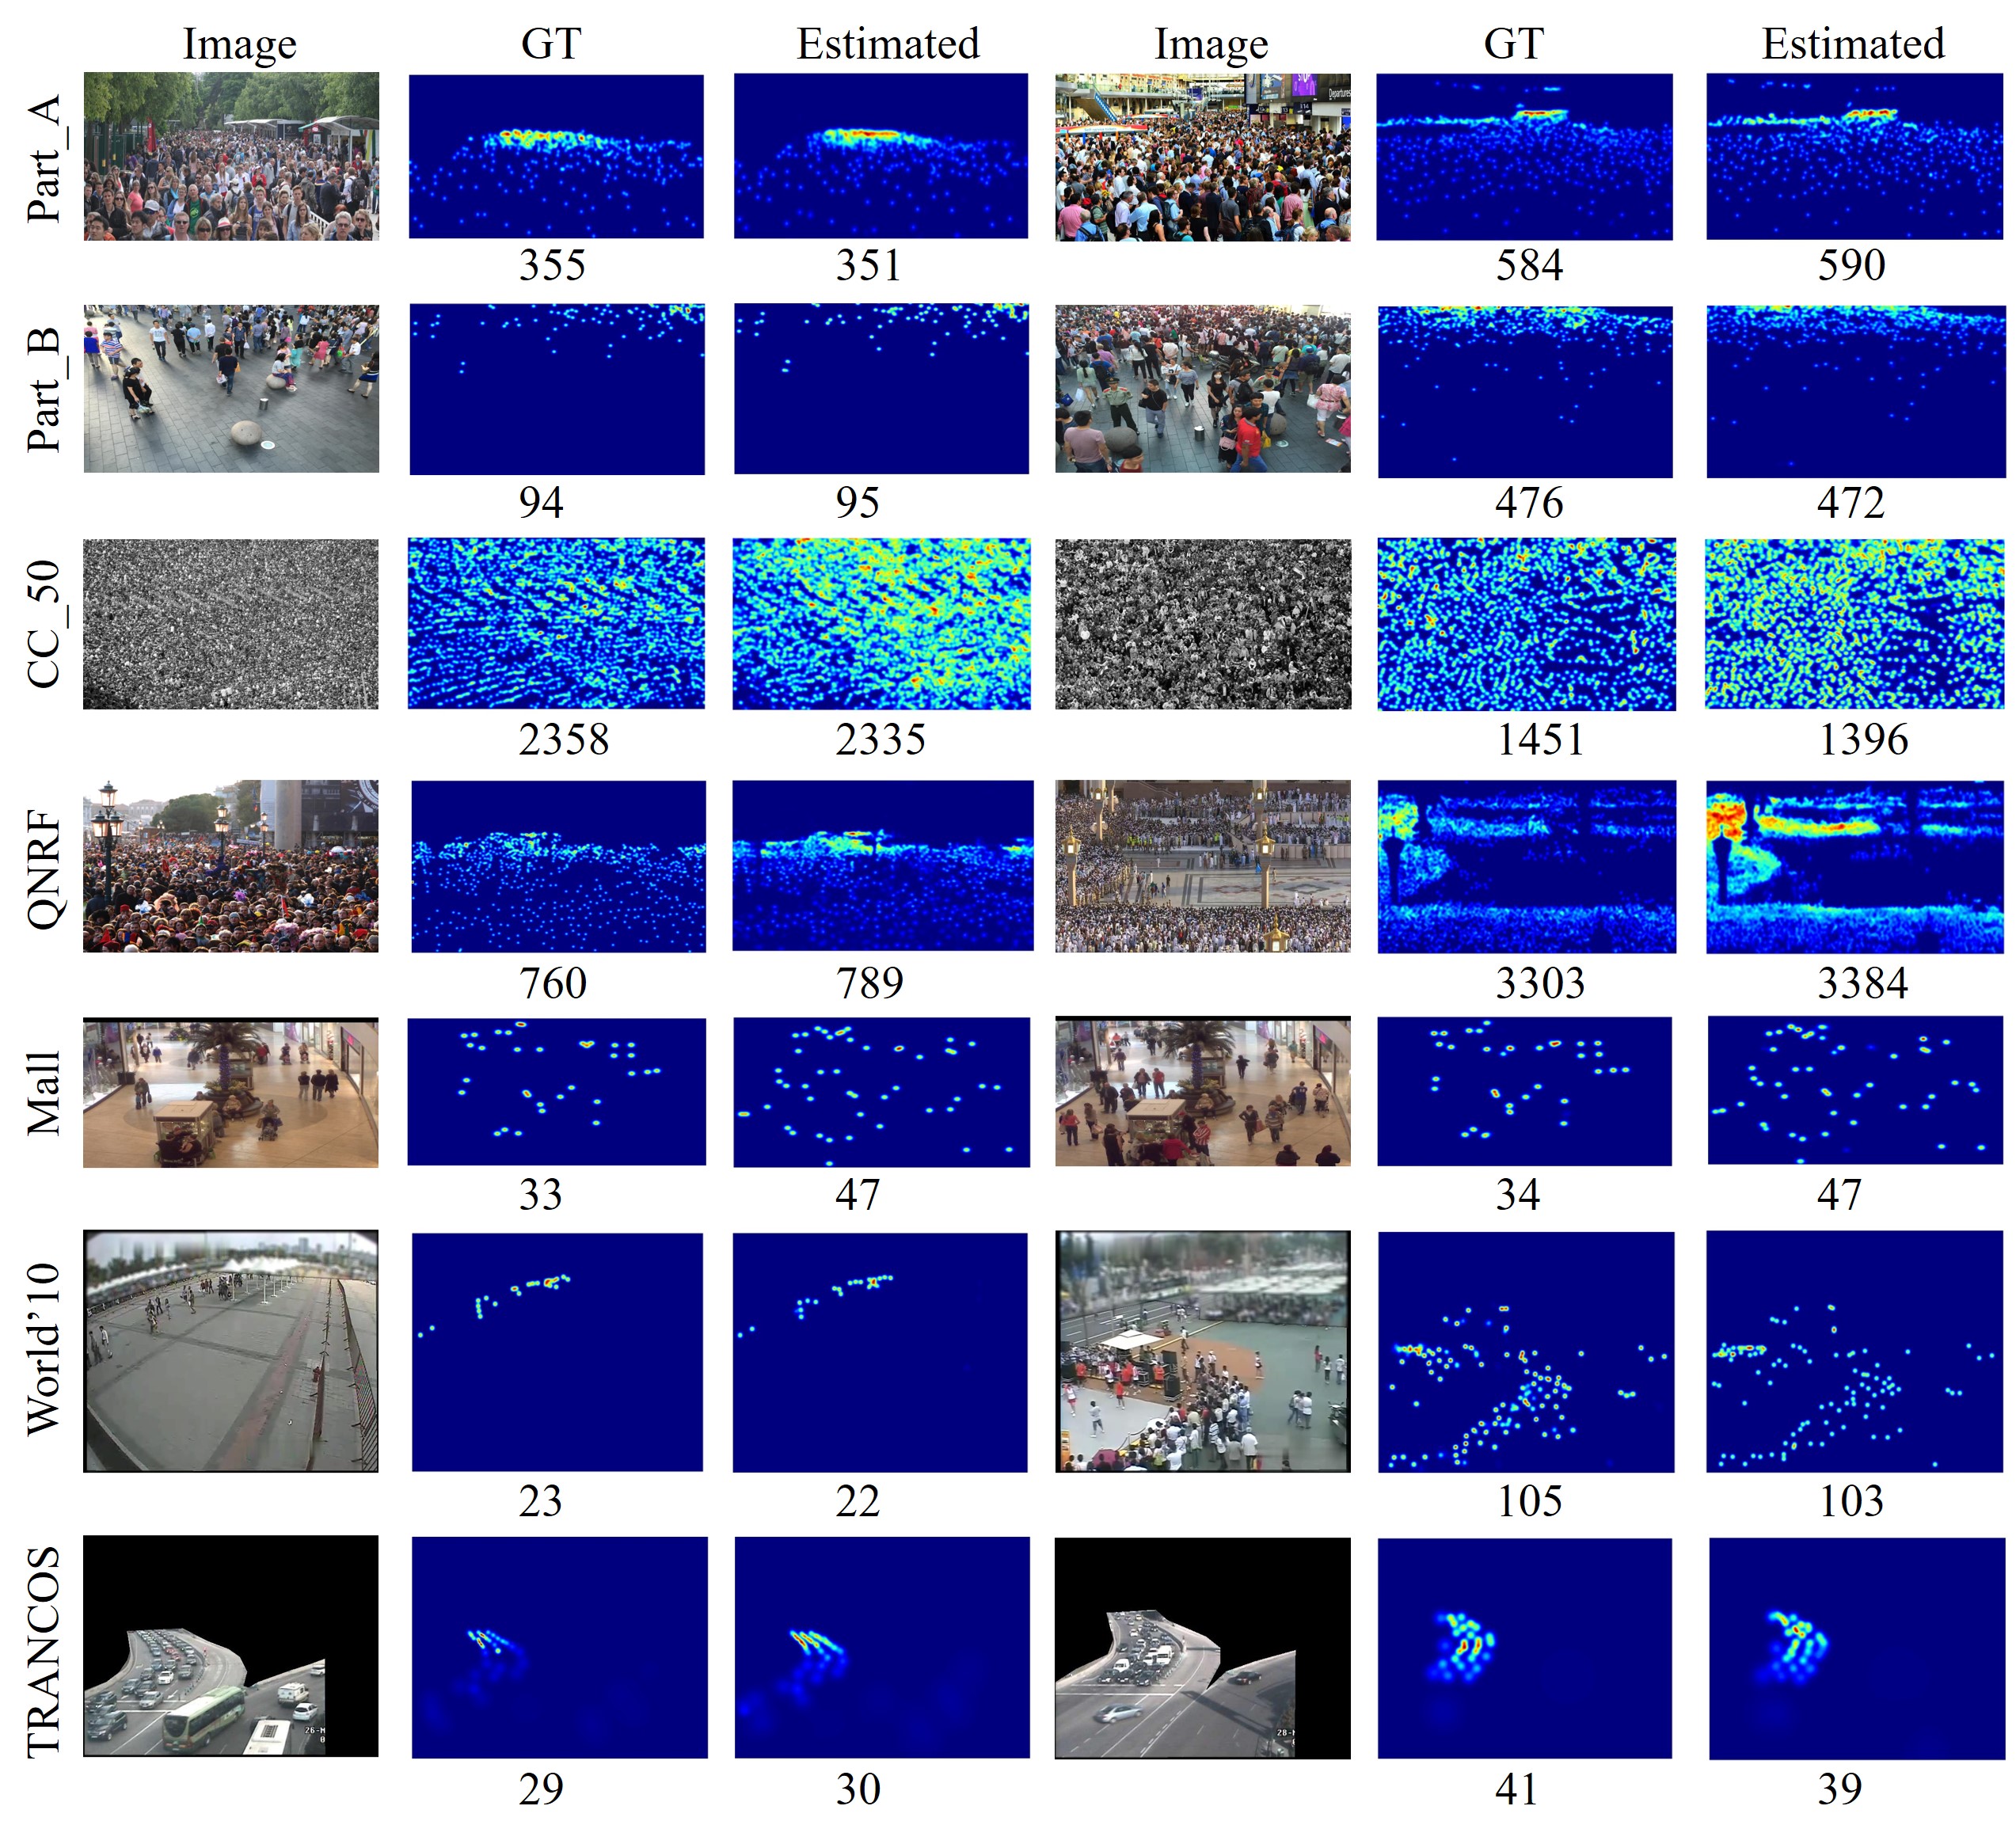
All the quantitative comparison results on different datasets indicate that our method is extremely robust to changes in scale, perspective and density. More visualized results on different datasets are shown in Fig. 6. The counting numbers are recorded below each GT and estimated density map.
From Fig. 6, it can be seen that the distribution of the generated density map by SACCN is very similar to the distribution of GT. Even though with a large span of counting numbers in Fig. 6, the proposed SACCN can still accurately estimate the density map, which implies its robustness.
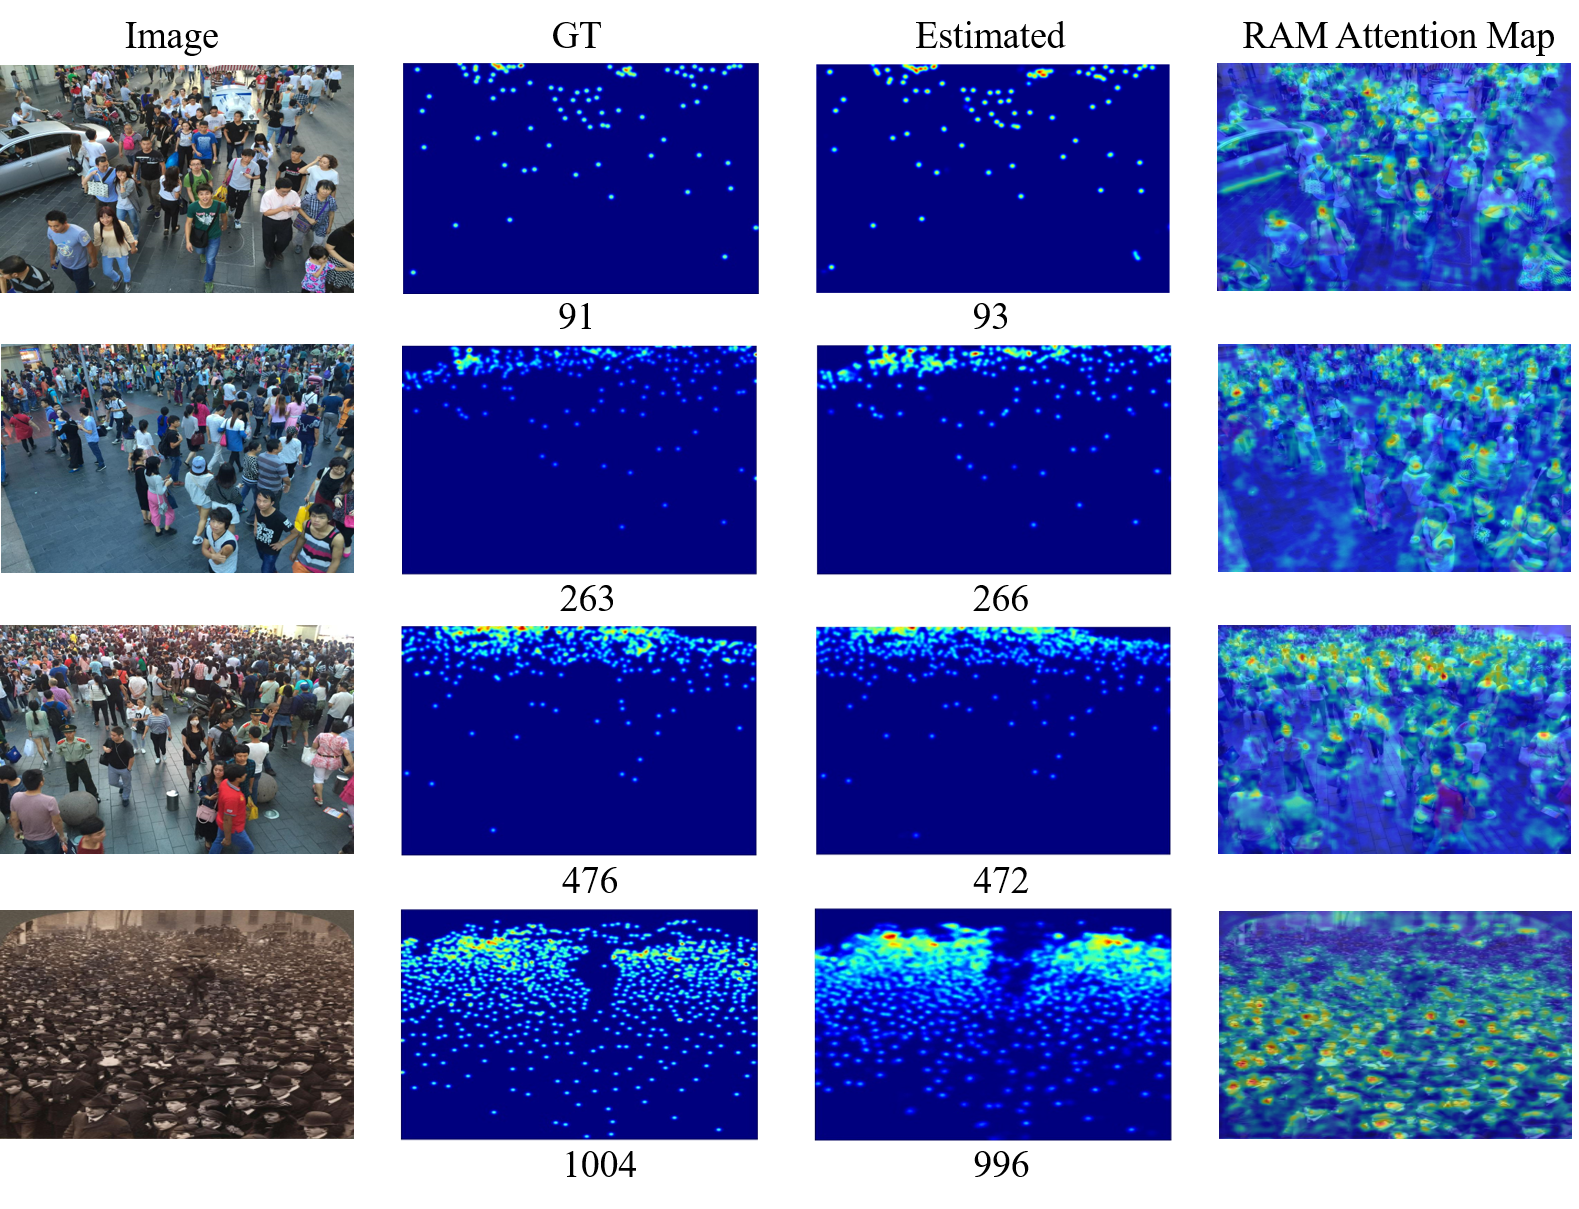
In addition, in Fig. 7, to display the effect of RAM, we visualize the RAM attention map for some samples with different backgrounds, perspectives, densities, and crowd scales. From Fig. 7, we can observe that the RAM attention map accurately highlights the crowd areas and suppresses the non-crowd areas. This shows that RAM components can effectively distinguish the crowd, which helps to count more accurately.
IV-D Ablation Studies
In this section, we conduct several ablation studies to demonstrate the effects of key components used in the proposed SACCN. Moreover, we further verify the influences of the proposed components on mitigating cluttered background and scale variation. All ablation experiments are conducted on ShanghaiTech Part_B dataset.
| Method | MAE | MSE | RAM | SAM | AMM | DC | SC |
|---|---|---|---|---|---|---|---|
| SACCN-ram | 8.3 | 12.9 | - | ||||
| SACCN-sam | 7.2 | 11.7 | - | ||||
| SACCN-amm | 6.9 | 10.8 | - | ||||
| SACCN-dc | 7.0 | 11.0 | - | ||||
| SACCN-sc | 7.1 | 11.4 | - | ||||
| SACCN | 6.8 | 10.5 |
| Method | MAE | MSE | CA | SP | RAM |
|---|---|---|---|---|---|
| 7.8 | 12.3 | - | - | ||
| 7.6 | 11.5 | - | - | ||
| SACCN | 6.8 | 10.5 | - | - |
IV-D1 The effects of the proposed components
TABLE V shows the performance of all the proposed components used in the proposed SACCN. The DC specifically represents the regional attention based dense connections. The SC represents the regional attention based skip-connections.
Firstly, without RAM, from the comparison between the first row ”SACCN-ram” and the last row ”SACCN”, we can find that the performance has severely deteriorated, indicating that region identification is very helpful for crowd counting.
Secondly, from the comparison between the second row ”SACCN-sam” and the last row ”SACCN”, we can infer that at deep layers, using semantic self-attentions is beneficial. This is because the feature maps in deeper layers have stronger semantics and can help to distinguish the crowd and the background in semantic space.
Thirdly, to demonstrate the effect of asymmetric convolution, the ablation method ”SACCN-amm” uses the convention convolution with instead of the asymmetric convolution with and , and use the convention convolution with instead of the asymmetric convolution with and in AMM. From the comparison result in TABLE V, it is unsurprising to find the performance gap between convention convolution and asymmetric convolution is very small. However, we should point out that herein asymmetric convolutions have fewer parameters than the convention convolution, which can greatly reduce the model size.
Finally, after comparing the cases that remove dense connections or skip-connections from the proposed SACCN, we can conclude that combining features of different scales can improve the accuracy of crowd counting. This method can also prevent gradient vanishing caused by network deepening.
IV-D2 The effects of different attentions
In order to verify the effect of different attention, we respectively replace RAM with single channel attention(CA) and spatial attention (SP).
In the TABLE VI, the first row shows the results that use CA instead of RAM. The second row shows the results that use SP instead of RAM. Through the performance comparison, we can see that the performance of only using CA or SP is worse than using RAM. Therefore, we have reasons to infer that, when distinguishing the crowd area from the background, both spatial attention and channel attention are important and complementary.
| Method | MAE | MSE | clutter background | scale variation | |||
|---|---|---|---|---|---|---|---|
| RAM | SAM | AMM | DC | SC | |||
| SACCN/all | 8.9 | 14.4 | - | - | - | - | - |
| SACCN/cb | 8.3 | 13.7 | - | - | |||
| SACCN/sv | 7.7 | 12.7 | - | - | - | ||
| SACCN | 6.8 | 10.5 | |||||
IV-D3 The effects of the proposed key components on mitigating adverse influences of cluttered background and scale variation
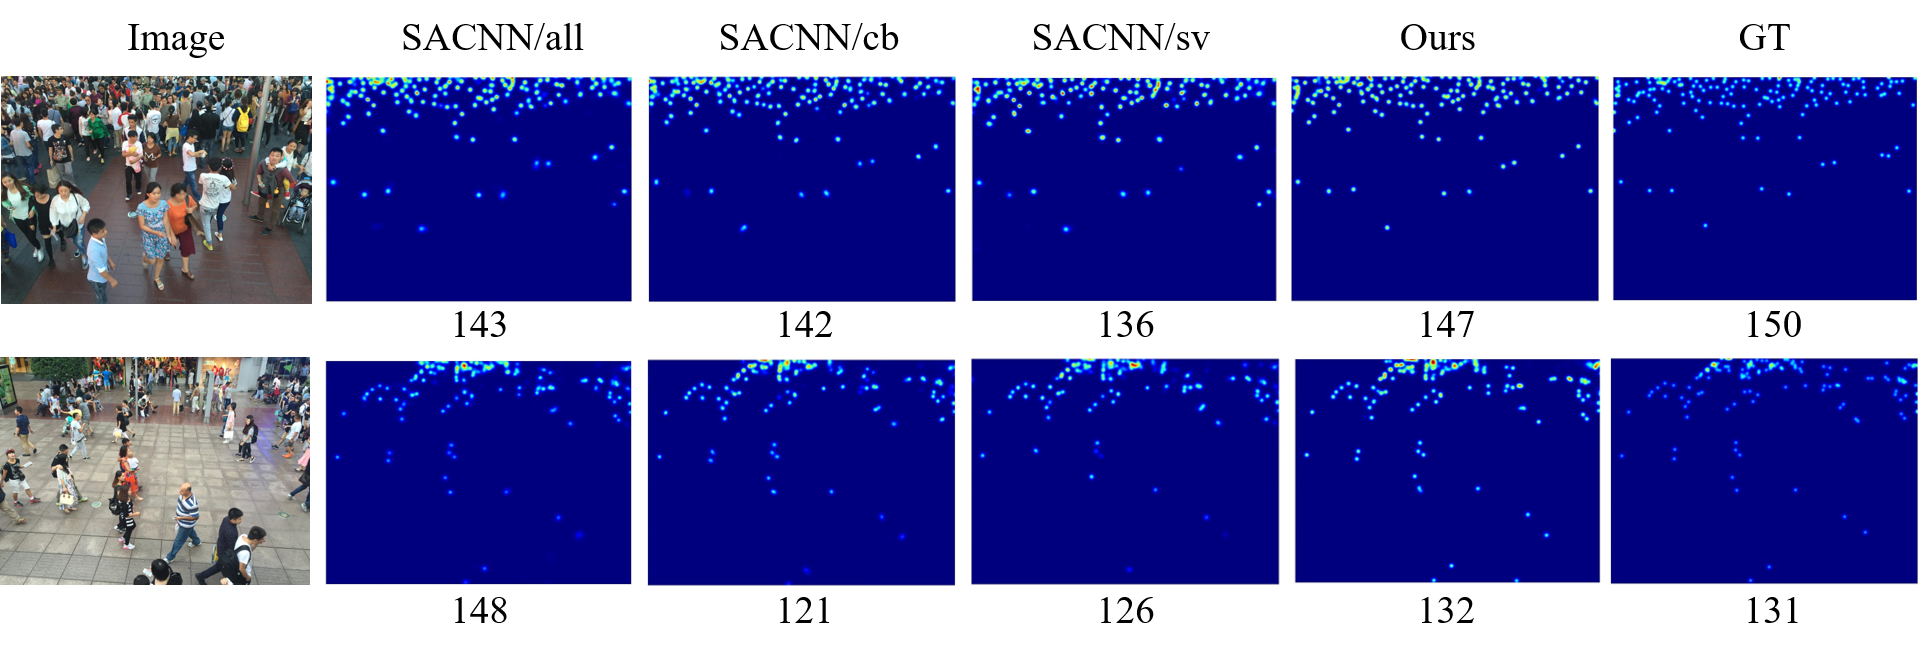
As we have summarized, cluttered background and scale variation are the main concentrated challenges in crowd counting. In this paper, we have proposed SACCN with some key innovative components to mitigate them. Among these components, RAM and SAM are attention modules mainly focusing on crowd identification from cluttered backgrounds. AMM, DC and SC mainly focus on scale variation. For a better understanding of the effects of these key components, we conduct more experiments (TABLE VII) to demonstrate their respective performance on mitigating the mentioned obstacles. The ablation results are shown in TABLE VII.
From TABLE VII, the comparison results indicate that each group of the proposed components can effectively improve the performance. Moreover, from Fig. 8, we can observe that the density maps generated by the proposed SACCN are more similar to the GT. The method without the proposed components cannot accurately count the crowd in the image.
V Conclusion
In this paper, we proposed a Scale-Aware Crowd Counting Network (SACCN) that can efficiently deal with the task of crowd counting under clutter background and scale variations. In the proposed SACCN, regional attention and semantic attention are employed for highlighting crowd area. Meanwhile, the asymmetric multi-scale module is specifically designed to handle the scale variations problem, and regional attention based connections are constructed for feature reuse and representation enhancement. Extensive experiments demonstrated that the proposed SACCN achieves superior performance against other state-of-the-art methods.
References
- [1] P. Dollar, C. Wojek, B. Schiele, and P. Perona, “Pedestrian detection: An evaluation of the state of the art,” IEEE transactions on pattern analysis and machine intelligence, vol. 34, no. 4, pp. 743–761, 2011.
- [2] P. Viola and M. J. Jones, “Robust real-time face detection,” International journal of computer vision, vol. 57, no. 2, pp. 137–154, 2004.
- [3] K. Chen, C. C. Loy, S. Gong, and T. Xiang, “Feature mining for localised crowd counting.” in BMVC, vol. 1, no. 2, 2012, p. 3.
- [4] L. Boominathan, S. S. Kruthiventi, and R. V. Babu, “Crowdnet: A deep convolutional network for dense crowd counting,” in Proceedings of the 24th ACM international conference on Multimedia, 2016, pp. 640–644.
- [5] K. Chen, S. Gong, T. Xiang, and C. Change Loy, “Cumulative attribute space for age and crowd density estimation,” in Proceedings of the IEEE conference on computer vision and pattern recognition, 2013, pp. 2467–2474.
- [6] C. Zhang, H. Li, X. Wang, and X. Yang, “Cross-scene crowd counting via deep convolutional neural networks,” in Proceedings of the IEEE conference on computer vision and pattern recognition, 2015, pp. 833–841.
- [7] Y. Zhang, D. Zhou, S. Chen, S. Gao, and Y. Ma, “Single-image crowd counting via multi-column convolutional neural network,” in Proceedings of the IEEE conference on computer vision and pattern recognition, 2016, pp. 589–597.
- [8] Y. Li, X. Zhang, and D. Chen, “Csrnet: Dilated convolutional neural networks for understanding the highly congested scenes,” in Proceedings of the IEEE conference on computer vision and pattern recognition, 2018, pp. 1091–1100.
- [9] H. Zheng, Z. Lin, J. Cen, Z. Wu, and Y. Zhao, “Cross-line pedestrian counting based on spatially-consistent two-stage local crowd density estimation and accumulation,” IEEE Transactions on Circuits and Systems for Video Technology, vol. 29, no. 3, pp. 787–799, 2018.
- [10] J. Liu, C. Gao, D. Meng, and A. G. Hauptmann, “Decidenet: Counting varying density crowds through attention guided detection and density estimation,” in Proceedings of the IEEE Conference on Computer Vision and Pattern Recognition, 2018, pp. 5197–5206.
- [11] V. A. Sindagi and V. M. Patel, “Ha-ccn: Hierarchical attention-based crowd counting network,” IEEE Transactions on Image Processing, vol. 29, pp. 323–335, 2019.
- [12] N. Liu, Y. Long, C. Zou, Q. Niu, L. Pan, and H. Wu, “Adcrowdnet: An attention-injective deformable convolutional network for crowd understanding,” in Proceedings of the IEEE Conference on Computer Vision and Pattern Recognition, 2019, pp. 3225–3234.
- [13] Y. Miao, Z. Lin, G. Ding, and J. Han, “Shallow feature based dense attention network for crowd counting.” in AAAI, 2020, pp. 11 765–11 772.
- [14] T.-Y. Lin, P. Dollár, R. Girshick, K. He, B. Hariharan, and S. Belongie, “Feature pyramid networks for object detection,” in Proceedings of the IEEE conference on computer vision and pattern recognition, 2017, pp. 2117–2125.
- [15] V. A. Sindagi and V. M. Patel, “Cnn-based cascaded multi-task learning of high-level prior and density estimation for crowd counting,” in 2017 14th IEEE International Conference on Advanced Video and Signal Based Surveillance (AVSS). IEEE, 2017, pp. 1–6.
- [16] M. Shi, Z. Yang, C. Xu, and Q. Chen, “Revisiting perspective information for efficient crowd counting,” in Proceedings of the IEEE Conference on Computer Vision and Pattern Recognition, 2019, pp. 7279–7288.
- [17] V. A. Sindagi and V. M. Patel, “Multi-level bottom-top and top-bottom feature fusion for crowd counting,” in Proceedings of the IEEE International Conference on Computer Vision, 2019, pp. 1002–1012.
- [18] B. Leibe, E. Seemann, and B. Schiele, “Pedestrian detection in crowded scenes,” in 2005 IEEE Computer Society Conference on Computer Vision and Pattern Recognition (CVPR’05), vol. 1. IEEE, 2005, pp. 878–885.
- [19] N. Dalal and B. Triggs, “Histograms of oriented gradients for human detection,” in 2005 IEEE computer society conference on computer vision and pattern recognition (CVPR’05), vol. 1. IEEE, 2005, pp. 886–893.
- [20] A. B. Chan and N. Vasconcelos, “Bayesian poisson regression for crowd counting,” in IEEE 12th international conference on computer vision. IEEE, 2009, pp. 545–551.
- [21] V. Lempitsky and A. Zisserman, “Learning to count objects in images,” Advances in neural information processing systems, vol. 23, pp. 1324–1332, 2010.
- [22] V.-Q. Pham, T. Kozakaya, O. Yamaguchi, and R. Okada, “Count forest: Co-voting uncertain number of targets using random forest for crowd density estimation,” in Proceedings of the IEEE International Conference on Computer Vision, 2015, pp. 3253–3261.
- [23] D. B. Sam, S. Surya, and R. V. Babu, “Switching convolutional neural network for crowd counting,” in 2017 IEEE Conference on Computer Vision and Pattern Recognition (CVPR). IEEE, 2017, pp. 4031–4039.
- [24] V. A. Sindagi and V. M. Patel, “Generating high-quality crowd density maps using contextual pyramid cnns,” in Proceedings of the IEEE International Conference on Computer Vision, 2017, pp. 1861–1870.
- [25] X. Cao, Z. Wang, Y. Zhao, and F. Su, “Scale aggregation network for accurate and efficient crowd counting,” in Proceedings of the European Conference on Computer Vision (ECCV), 2018, pp. 734–750.
- [26] K. Simonyan and A. Zisserman, “Very deep convolutional networks for large-scale image recognition,” arXiv preprint arXiv:1409.1556, 2014.
- [27] X. Wang, R. Girshick, A. Gupta, and K. He, “Non-local neural networks,” in Proceedings of the IEEE conference on computer vision and pattern recognition, 2018, pp. 7794–7803.
- [28] H. Zhang, I. Goodfellow, D. Metaxas, and A. Odena, “Self-attention generative adversarial networks,” in International Conference on Machine Learning, 2019, pp. 7354–7363.
- [29] J. Fu, J. Liu, H. Tian, Y. Li, Y. Bao, Z. Fang, and H. Lu, “Dual attention network for scene segmentation,” in Proceedings of the IEEE Conference on Computer Vision and Pattern Recognition, 2019, pp. 3146–3154.
- [30] V. Ranjan, H. Le, and M. Hoai, “Iterative crowd counting,” in Proceedings of the European Conference on Computer Vision (ECCV), 2018, pp. 270–285.
- [31] S. Jiang, X. Lu, Y. Lei, and L. Liu, “Mask-aware networks for crowd counting,” IEEE Transactions on Circuits and Systems for Video Technology, 2019.
- [32] L. Liu, H. Lu, H. Xiong, K. Xian, Z. Cao, and C. Shen, “Counting objects by blockwise classification,” IEEE Transactions on Circuits and Systems for Video Technology, 2019.
- [33] W. Liu, M. Salzmann, and P. Fua, “Context-aware crowd counting,” in Proceedings of the IEEE Conference on Computer Vision and Pattern Recognition, 2019, pp. 5099–5108.
- [34] Y. Liu, M. Shi, Q. Zhao, and X. Wang, “Point in, box out: Beyond counting persons in crowds,” in Proceedings of the IEEE Conference on Computer Vision and Pattern Recognition, 2019, pp. 6469–6478.
- [35] C. Xu, K. Qiu, J. Fu, S. Bai, Y. Xu, and X. Bai, “Learn to scale: Generating multipolar normalized density maps for crowd counting,” in Proceedings of the IEEE International Conference on Computer Vision, 2019, pp. 8382–8390.
- [36] L. Liu, Z. Qiu, G. Li, S. Liu, W. Ouyang, and L. Lin, “Crowd counting with deep structured scale integration network,” in Proceedings of the IEEE International Conference on Computer Vision, 2019, pp. 1774–1783.
- [37] M.-h. Oh, P. A. Olsen, and K. N. Ramamurthy, “Crowd counting with decomposed uncertainty.” in AAAI, 2020, pp. 11 799–11 806.
- [38] Z. Zou, Y. Liu, S. Xu, W. Wei, S. Wen, and P. Zhou, “Crowd counting via hierarchical scale recalibration network,” arXiv preprint arXiv:2003.03545, 2020.
- [39] J. Wan, Q. Wang, and A. B. Chan, “Kernel-based density map generation for dense object counting,” IEEE Transactions on Pattern Analysis and Machine Intelligence, 2020.
- [40] C. Szegedy, V. Vanhoucke, S. Ioffe, J. Shlens, and Z. Wojna, “Rethinking the inception architecture for computer vision,” in Proceedings of the IEEE conference on computer vision and pattern recognition, 2016, pp. 2818–2826.
- [41] X. Ding, Y. Guo, G. Ding, and J. Han, “Acnet: Strengthening the kernel skeletons for powerful cnn via asymmetric convolution blocks,” in Proceedings of the IEEE International Conference on Computer Vision, 2019, pp. 1911–1920.
- [42] R. Guerrero-Gómez-Olmedo, B. Torre-Jiménez, R. López-Sastre, S. Maldonado-Bascón, and D. Onoro-Rubio, “Extremely overlapping vehicle counting,” in Iberian Conference on Pattern Recognition and Image Analysis. Springer, 2015, pp. 423–431.
- [43] H. Idrees, I. Saleemi, C. Seibert, and M. Shah, “Multi-source multi-scale counting in extremely dense crowd images,” in Proceedings of the IEEE conference on computer vision and pattern recognition, 2013, pp. 2547–2554.
- [44] H. Idrees, M. Tayyab, K. Athrey, D. Zhang, S. Al-Maadeed, N. Rajpoot, and M. Shah, “Composition loss for counting, density map estimation and localization in dense crowds,” in Proceedings of the European Conference on Computer Vision (ECCV), 2018, pp. 532–546.
- [45] L. Zeng, X. Xu, B. Cai, S. Qiu, and T. Zhang, “Multi-scale convolutional neural networks for crowd counting,” in 2017 IEEE International Conference on Image Processing (ICIP). IEEE, 2017, pp. 465–469.
- [46] U. Sajid, H. Sajid, H. Wang, and G. Wang, “Zoomcount: A zooming mechanism for crowd counting in static images,” IEEE Transactions on Circuits and Systems for Video Technology, 2020.
- [47] L. Fiaschi, U. Köthe, R. Nair, and F. A. Hamprecht, “Learning to count with regression forest and structured labels,” in Proceedings of the 21st International Conference on Pattern Recognition (ICPR2012). IEEE, 2012, pp. 2685–2688.
- [48] D. Onoro-Rubio and R. J. López-Sastre, “Towards perspective-free object counting with deep learning,” in European Conference on Computer Vision. Springer, 2016, pp. 615–629.
- [49] E. Walach and L. Wolf, “Learning to count with cnn boosting,” in European conference on computer vision. Springer, 2016, pp. 660–676.
- [50] B. Sheng, C. Shen, G. Lin, J. Li, W. Yang, and C. Sun, “Crowd counting via weighted vlad on a dense attribute feature map,” IEEE Transactions on Circuits and Systems for Video Technology, vol. 28, no. 8, pp. 1788–1797, 2016.
- [51] F. Xiong, X. Shi, and D.-Y. Yeung, “Spatiotemporal modeling for crowd counting in videos,” in Proceedings of the IEEE International Conference on Computer Vision, 2017, pp. 5151–5159.
- [52] Z. Zou, H. Shao, X. Qu, W. Wei, and P. Zhou, “Enhanced 3d convolutional networks for crowd counting,” arXiv preprint arXiv:1908.04121, 2019.
- [53] M. Hossain, M. Hosseinzadeh, O. Chanda, and Y. Wang, “Crowd counting using scale-aware attention networks,” in 2019 IEEE Winter Conference on Applications of Computer Vision (WACV). IEEE, 2019, pp. 1280–1288.
- [54] M. Zhao, J. Zhang, C. Zhang, and W. Zhang, “Leveraging heterogeneous auxiliary tasks to assist crowd counting,” in Proceedings of the IEEE Conference on Computer Vision and Pattern Recognition, 2019, pp. 12 736–12 745.
- [55] M. Zhao, C. Zhang, J. Zhang, F. Porikli, B. Ni, and W. Zhang, “Scale-aware crowd counting via depth-embedded convolutional neural networks,” IEEE Transactions on Circuits and Systems for Video Technology, 2019.
- [56] X. Ding, F. He, Z. Lin, Y. Wang, H. Guo, and Y. Huang, “Crowd density estimation using fusion of multi-layer features,” IEEE Transactions on Intelligent Transportation Systems, 2020.