NGTS-14Ab: a Neptune-sized transiting planet in the desert
Abstract
Context. The sub-Jovian or Neptunian desert is a previously-identified region of parameter space where there is a relative dearth of intermediate-mass planets at short orbital periods.
Aims. We present the discovery of a new transiting planetary system within the Neptunian desert, NGTS-14A.
Methods. Transits of NGTS-14Ab were discovered in photometry from the Next Generation Transit Survey (NGTS). Follow-up transit photometry was conducted from several ground-based facilities, as well as extracted from TESS full-frame images. We combine radial velocities from the HARPS spectrograph with the photometry in a global analysis to determine the system parameters.
Results. NGTS-14Ab has a radius about 30 per cent larger than that of Neptune ( ), and is around 70 per cent more massive than Neptune ( ). It transits the main-sequence K1 star, NGTS-14A, with a period of 3.54 days, just far enough to have maintained at least some of its primordial atmosphere. We have also identified a possible long-period stellar mass companion to the system, NGTS-14B, and we investigate the binarity of exoplanet host stars inside and outside the Neptunian desert using Gaia.
Key Words.:
planetary systems – Planets and satellites: detection – Planets and satellites: individual: NGTS-14Ab – binaries: general1 Introduction
The first generation of wide-field transit surveys, the most prolific of which were SuperWASP (Pollacco et al., 2006) and HAT-Net (Bakos et al., 2002), unveiled the rich diversity of hot Jupiters. These planets, although intrinsically rare, have been discovered in numbers large enough to enable statistical population analyses such as those investigating inflation (e.g. Thorngren & Fortney 2018; Sestovic et al. 2018). Transiting hot Jupiters also remain the best-studied individual planetary systems, with characterisation observations such as atmospheric transmission spectroscopy pioneered on these objects (e.g. Sing et al. 2016).
The Kepler (Borucki et al., 2010) and K2 (Howell et al., 2014) missions, and the ongoing TESS (Transiting Exoplanet Survey Satellite; Ricker et al. 2015) mission subsequently revealed a large population of small (less than 2 – 3 Earth radii), short-period planets. In between these two populations, however, lies a relatively unpopulated region of parameter space, often referred to as the sub-Jovian or Neptunian desert (Szabó & Kiss, 2011; Mazeh et al., 2016).
The Next Generation Transit Survey (NGTS; Wheatley et al. 2018) consists of twelve independent 0.2-m telescopes, each equipped with a red-sensitive 2k 2k CCD covering eight square degrees. The survey is optimised for detecting short-period planets transiting K-dwarf stars, with the goal of detecting Neptune-sized planets. One of the main drivers for the extremely high-precision photometry achieved by NGTS is the telescope guiding, which uses Donuts (McCormac et al., 2013) to ensure sub-pixel pointing precision throughout the duration of an observing season. This has allowed the detection of significantly shallower transits than previously achieved from the ground, and the discovery of planets in the Neptunian desert, such as NGTS-4b (West et al., 2019).
In this paper we report the discovery from NGTS of a transiting planet slightly larger than Neptune orbiting the early K-dwarf NGTS-14A. In Section 2, we present the host star, and show that it probably has a bound long-period M-dwarf companion. In Section 3 we present our observations of the system with both NGTS and other facilities. In Section 4 we characterise the host star, and in Section 5 we perform a joint analysis of the transit photometry and radial velocities to determine the system parameters. Finally, we discuss NGTS-14 in the context of the Neptunian desert in Section 6, and summarise our findings in Section 7.
2 NGTS-14B
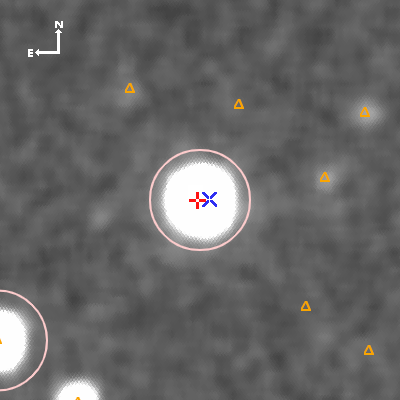
We list in Table 1 the Gaia positions, proper motions and parallaxes (Gaia Collaboration et al., 2018) for both NGTS-14A and NGTS-14B, a fainter star which lies just arcseconds away (see Fig. 1). The parallaxes of the two objects are identical to much less than 1 significance, and the proper motions in the RA direction are compatible at the 2 level. We note, however, that in the Declination direction, the proper motions differ from each other with a significance of 5.7 . We conclude, however, that these two stars are co-moving, and likely to be gravitationally bound.
As a test of the statistical significance of finding a companion with similar parallax and proper motions close to our target, we searched the Gaia DR2 catalogue for all stars lying within of NGTS-14A 111 Gaia DR2 reports a total of sources within of NGTS-14A. and whose proper motions and parallax match those of NGTS-14A to within 6 . This search of an area times larger than the area defined by a radius equal to the separation between target and putative companion returned exactly 100 results, excluding NGTS-14A itself. This implies that the chance of finding such an object within is around .
At a distance of pc, the projected separation of the two stars implies a physical separation of au. If the two objects are gravitationally bound, this sets a lower limit to the binary orbital period of around 40 000 yr, assuming a circular orbit. For a moderately eccentric orbit (0.6), this lower limit is reduced to around 20 000 yr, which is the orbital period obtained if we assume that we are observing NGTS-14B at apastron. We note that the physical separation implied here is an order of magnitude smaller than the widest binary that can survive for Gyr in the Solar neighbourhood (Jiang & Tremaine, 2010).
We also note that at a distance of around pc, the apparent discrepancy in proper motions in the declination direction ( mas yr-1) corresponds to a physical velocity of around 1.5 km s-1, which could be easily explained by the orbital motion of the secondary with respect to the primary. We searched the Digitized Sky Survey for archival imaging, but we found no images with sufficient angular resolution to resolve the two sources. A radial velocity measurement of NGTS-14B would provide further evidence of whether or not the two stars are really a binary pair, but NGTS-14B is too faint to be observed with CORALIE or HARPS (See Section 3.3).
The existence of such binary companions to planet host stars is interesting, since even at these very large separations, a binary companion may influence the evolution of the planet. For instance, long-period outer companions can act to maintain a non-zero planetary orbital eccentricity, even for short-period planets whose orbits would otherwise be rapidly circularised through tidal interactions with the host star (e.g. Wu & Murray 2003).
NGTS-14B is magnitudes fainter than NGTS-14A in the -band, and magnitudes fainter in the -band. The spectral type of NGTS-14A is estimated to be K1V, based on the effective temperature derived from spectral analysis, and the tabulation of Pecaut & Mamajek 2013222http://www.pas.rochester.edu/~emamajek/EEM_dwarf_UBVIJHK_colors_Teff.txt.
Based on the absolute -band magnitudes in the aforementioned table, if NGTS-14A has a spectral type of K1V, then NGTS-14B is probably an M2.5V star. Alternatively, using the (G-K) colour, the best-matching spectral types (according to the aforementioned table) are K1.5V and M3.5V for NGTS-14A and NGTS-14B, respectively. We adopt spectral types of K1V and M3V for the two stars, and account for the flux contamination of NGTS-14B in our light curves (Sec. 5.1).
| Positions & proper motions | NGTS-14A | NGTS-14B | Source |
| RA (J2015.5) | 21h54m04.20s | 21h54m03.89s | Gaia |
| Dec (J2015.5) | Gaia | ||
| pmRA (mas yr-1) | Gaia | ||
| pmDec (mas yr-1) | Gaia | ||
| parallax (mas) | Gaia | ||
| Projected separation from NGTS-14A | – | Gaia | |
| Distance from Earth (pc)† | |||
| Magnitudes | |||
| (Johnson) | – | APASS | |
| (Johnson) | – | APASS | |
| (Gaia) | Gaia | ||
| (Gaia) | Gaia | ||
| (Gaia) | Gaia | ||
| (Sloan) | – | APASS | |
| (Sloan) | – | APASS | |
| (Sloan) | – | APASS | |
| TESS | TESS | ||
| (2 limit) | 2MASS | ||
| (2 limit) | 2MASS | ||
| 2MASS | |||
| – | WISE | ||
| – | WISE | ||
| – | WISE | ||
| Spectral type | K1V | M3V | Sec. 2 |
| Additional identifiers: | |||
| Gaia DR2 | 6585082036193768832 | 6585082036193769088 | |
| 2MASS J | 21540423-3822388 | 21540393-3822386 | |
| TIC | 197643976 | 197641898 | |
| Gaia: Gaia DR2 (Gaia Collaboration et al., 2016, 2018) | |||
| APASS: AAVSO Photometric all-sky survey DR9 (Henden et al., 2016) | |||
| 2MASS: The Two Micron All Sky Survey (Skrutskie et al., 2006) | |||
| WISE: Wide-field Infrared Survey Explorer (Cutri & et al., 2013) | |||
| †Calculated from Gaia DR2 parallax, incorporating the systematic offset of Stassun & Torres (2018) | |||
3 Observations
3.1 NGTS photometry
NGTS-14A lies in one of the fields observed by NGTS starting from the commencement of routine science operations in 2016 April. In all, a total of 220 829 observations were made of this field using a single NGTS telescope, between 2016 April 21 and 2016 December 22. Each image has an exposure time of 10 s, and a typical cadence of 13 s. The data were reduced using the NGTS pipeline (Wheatley et al., 2018), which comprises standard bias subtraction and flat-field correction, followed by aperture photometry based on the CASUtools333http://casu.ast.cam.ac.uk/surveys-projects/software-release software package. Finally, systematic effects in the light curves were removed using the SysRem algorithm (Tamuz et al., 2005).
The NGTS light curves are searched for period transit-like signals using our implementation of the box-fitting least-squares (BLS) algorithm (Kovács et al., 2002). In the case of NGTS-14A, a signal consistent with a transiting exoplanet was detected, with a periodicity of around 3.5 days. After passing several vetting checks designed to eliminate false positives such as eclipsing binaries and blended systems (e.g. Günther et al., 2017), we initiated follow-up observations to confirm the planetary nature of the system, and to better characterise it.
We also note that this system received a high planetary probability of 0.97 from a neural network trained to distinguish between transiting planetary systems and false positives in NGTS data (Chaushev et al., 2019).
3.2 Follow-up photometry
We used several larger aperture telescopes, as well as multiple NGTS telescopes, to perform follow-up transit observations. The motivation of these observations was to confirm the transit, increase the signal-to-noise of our transit photometry to improve the characterisation of the system, and to improve our knowledge of the orbital ephemeris by extending the observational baseline.
3.2.1 SAAO 1-m
We observed a partial transit of NGTS-14Ab on the night of 2019 October 04, from the South African Astronomical Observatory in Sutherland, Northern Cape using their 1-m telescope. The telescope was equipped with one of the Sutherland High-speed Optical Cameras (SHOC; specifically ‘SHOC’n’awe’). A description of the instrument can be found in Coppejans et al. (2013). The observations were conducted in I-band, in focus, with binning of the CCD, and each of the 960 exposures had a duration of 20 s.
The data were bias and flat field corrected via the standard procedure, using the safphot Python package (Chaushev & Raynard, in preparation). Differential photometry was also carried out using safphot, by first extracting aperture photometry for both the target and comparison stars using the SEP package (Barbary, 2016). The sky background was measured and subtracted using the SEP background map, adopting box size and filter width parameters that minimised background residuals, measured across the frame after masking the stars. Three comparison stars were then utilised to perform differential photometry on the target, using a 3.4 pixel () radius aperture which maximised the signal-to-noise.
3.2.2 EulerCam
A partial transit of NGTS-14Ab was observed on the night of 2019 August 08 with EulerCam on the 1.2-m Euler-Swiss telescope at La Silla Observatory, Chile. A total of 271 observations were made in a filter corresponding to the NGTS bandpass, each with an exposure time of 40 s, giving a cadence of around 52 s. A slight defocus was applied during the observations. Standard data reduction and aperture photometry techniques were applied, using a photometric aperture radius of 19 pixels (), and 17 comparison stars.
3.2.3 CHAT
Another partial transit of NGTS-14Ab was observed from the Chilean-Hungarian Automated Telescope (CHAT), a 0.7-m robotic telescope installed at Las Campanas Observatory, Chile. The observations were conducted on the night of 2019 November 8, using an filter. The cadence of the light curve is around 180 s and 73 images were obtained spanning airmass values between 1 and 2. Data was processed with a dedicated pipeline adapted from a set of routines to process photometric data of the LCOGT network (e.g. Hartman et al., 2019; Espinoza et al., 2019; Jordán et al., 2019).
3.2.4 NGTS multi-telescope observations
In addition to its survey mode, where each telescope observes a different field to maximise sky coverage, NGTS can also be operated in a mode where multiple telescopes observe the same target simultaneously (Smith et al., 2020). This mode is used for follow-up of shallow transits detected by the NGTS survey, as well as for TESS targets (Jenkins et al., 2020; Armstrong et al., 2020) and for other exoplanets transiting bright stars (Bryant et al., 2020).
We observed a partial transit of NGTS-14Ab on the night of 2019 November 08 (the same event we observed with CHAT), using eight of the NGTS telescopes. We obtained a total of 8790 exposures (around 1100 per camera), each with the usual NGTS exposure time (10 s) and cadence (13 s).
The NGTS follow-up data for NGTS-14A were reduced using a custom photometry pipeline. This pipeline uses the SEP Python library for both the source extraction and the aperture photometry (Bertin & Arnouts, 1996; Barbary, 2016). We do not apply bias, dark, and flat-field image corrections during the image reduction, as testing showed them to provide no improvement to the photometric precision achieved. We use Gaia (Gaia Collaboration et al., 2018) to automatically identify comparison stars with a similar colour, brightness and CCD position to NGTS-14A (see Bryant et al., 2020, for more details on the photometric pipeline).
3.2.5 TESS
NGTS-14A falls in Sector 1 of the TESS survey, which was observed between 2018 July 25 and 2018 August 22, covering seven transits of NGTS-14Ab. We were able to extract a light curve from the full-frame images (FFIs) of Camera 1, CCD 2, which have a cadence of 30 minutes. To do this, we used a custom photometric aperture selected on the basis of a flux threshold, and to minimise blending from other sources. A pixels area was used for background estimation.
We ran the BLS algorithm on the TESS data to test if the planet could have been detected from the TESS data alone. A peak at around 3.5 d is the highest in the resulting periodogram, with a significance (following Collier Cameron et al. 2006) of 10.9. This suggests that an exhaustive search of light curves derived from the TESS FFIs could have revealed this system. However the transit is much less evident in TESS data compared with the NGTS data. This is primarily due to the fact that NGTS typically produces higher precision photometry for stars with T12.5.
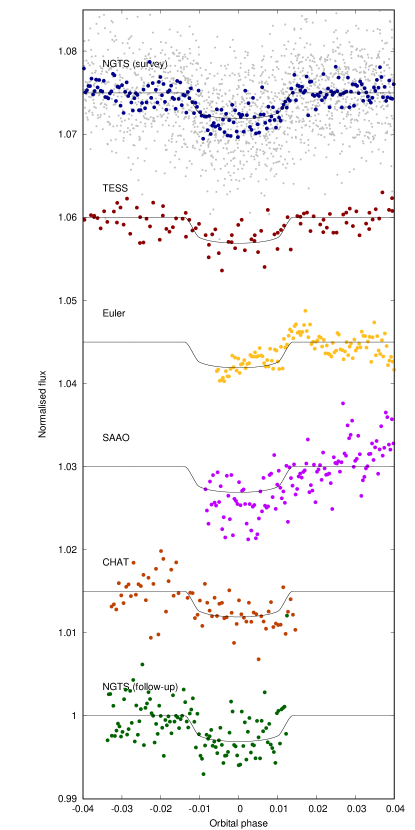
The transit photometry from all the instruments listed above is listed in Table 2, and shown in Fig. 3.
| Relative | Inst. | ||
|---|---|---|---|
| (-2450000) | flux | ||
| 7562.688132 | 1.014176 | 0.006391 | NGTS |
| 7562.689019 | 0.993882 | 0.005278 | NGTS |
| 7562.690361 | 0.993867 | 0.005867 | NGTS |
| 7562.691707 | 0.997182 | 0.005817 | NGTS |
| 7562.693124 | 0.992255 | 0.005179 | NGTS |
| 7562.694540 | 1.001568 | 0.002645 | NGTS |
| 7562.695955 | 0.990161 | 0.004289 | NGTS |
| 7562.697372 | 0.991594 | 0.005725 | NGTS |
| 7562.698713 | 0.991647 | 0.005552 | NGTS |
| 7562.700052 | 0.992255 | 0.005312 | NGTS |
3.3 High resolution spectroscopy
3.3.1 CORALIE
We observed NGTS-14A with the CORALIE spectrograph on the Swiss 1.2 m Euler telescope at La Silla Observatories, Chile (Queloz et al., 2001b), between 3 November and 4 December 2018. CORALIE has a resolving power of and is fed by a 2″ on-sky science fibre. Radial velocity (RV) measurements were computed for each epoch by cross-correlating with a binary G2 mask (Pepe et al., 2002). The observations showed no significant RV variation within the uncertainties of and were used to screen NGTS-14A for possible scenarios of blended eclipsing binaries mimicking a planetary transit.
3.3.2 HARPS
We observed NGTS-14A using the HARPS spectrograph (Mayor et al., 2003) on ESO’s 3.6-m telescope at La Silla Observatories, Chile, under programmes 0103.C-0719 and 0104.C-0588. A total of fifteen measurements were made between 2019 August 03 and 2019 September 20.
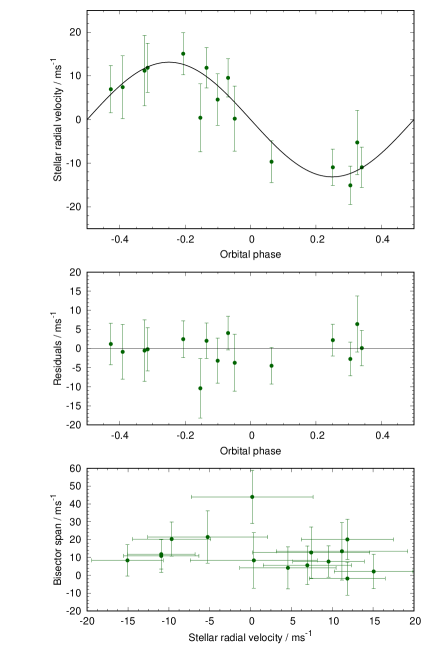
We used the standard HARPS data reduction software to obtain RV measurements of NGTS-14A at each epoch. This was done via cross-correlation with a K5 binary mask. Bisector-span, FWHM and other line-profile diagnostics were computed as well. Using an exposure time of 2700 s we obtained typical error bars of . The resulting radial velocities are listed in Table 3, and are plotted in Fig. 4.
The HARPS science fibre has a 1″ on-sky projection, and does thus not include NGTS-14B. We co-added the fifteen HARPS spectra while weighting each epoch the inverse-variance. Section 4.1 details the spectral analysis performed on the stacked spectrum.
| RV | RV err | FWHM | BIS | |
|---|---|---|---|---|
| (-2450000) | (m s-1) | (m s-1) | (m s-1) | (m s-1) |
| 8698.71245 | 30 272.51 | 4.38 | 6 147.32 | 8.36 |
| 8699.65656 | 30 294.53 | 5.40 | 6 139.47 | 5.61 |
| 8700.69210 | 30 299.43 | 4.63 | 6 153.15 | -1.84 |
| 8717.70010 | 30 298.77 | 8.05 | 6 160.60 | 13.47 |
| 8718.60361 | 30 297.13 | 4.38 | 6 161.24 | 7.71 |
| 8719.73729 | 30 276.65 | 4.14 | 6 157.38 | 11.83 |
| 8721.65430 | 30 302.65 | 4.81 | 6 158.79 | 2.14 |
| 8722.60994 | 30 277.93 | 4.79 | 6 140.92 | 20.31 |
| 8723.58722 | 30 276.65 | 4.62 | 6 131.25 | 10.87 |
| 8724.53490 | 30 295.00 | 7.17 | 6 141.78 | 12.75 |
| 8724.80470 | 30 299.44 | 5.63 | 6 120.43 | 20.12 |
| 8725.56246 | 30 292.16 | 5.89 | 6 124.07 | 4.17 |
| 8725.74721 | 30 287.79 | 7.45 | 6 134.53 | 43.93 |
| 8730.60832 | 30 282.33 | 7.34 | 6 131.68 | 21.46 |
| 8746.58959 | 30 287.98 | 7.77 | 6 119.95 | 8.34 |
4 Stellar characterisation
4.1 Spectral analysis
The HARPS spectra were co-added, and the resulting spectrum (S/N ) was analysed with the synthesis method (without the use of wavelets) outlined in Gill et al. (2018). The resulting parameters are K, , (cgs), and km s-1.
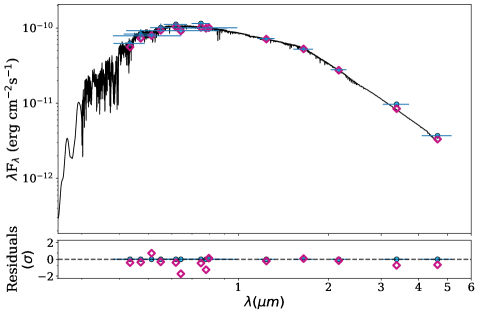
4.2 SED fit with ARIADNE
We fit the spectral energy distribution (SED) of NGTS-14A using ARIADNE, a python tool written to fit catalogue photometry to different atmospheric model grids (Fig. 2). It hosts model grids for Phoenix v2 (Husser et al., 2013), BT-Settl, BT-Cond, BT-NextGen (Allard et al., 2012; Hauschildt et al., 1999), Castelli & Kurucz (2003), and Kurucz (1993) convolved with filter response functions: ; 2MASS ; SDSS ugriz; WISE and ; Gaia , , and , Pan-STARRS ’ Strömgren uvby; GALEX NUV and FUV; TESS; Kepler; and NGTS. Each synthetic SED is modelled by interpolating grids in --[Fe/H] space with the remaining parameters being distance, radius, extinction in the band, and an individual excess noise for each photometry in order to account for underestimated uncertainties. The priors for , and [Fe/H] were taken from the spectral analysis determined values, for radius and distance we took the Gaia DR2 reported value, noting that we inflated the radius reported error to account for modelling errors and we applied the Stassun & Torres 2018 correction to the parallax, we limited the to the maximum line-of-sight taken from the re-calibrated SFD galactic dust map (Schlegel et al. 1998; Schlafly & Finkbeiner 2011), and finally, each excess noise parameter has a zero mean Normal distribution as their priors with a variance equal to five times the size of the reported uncertainty. ARIADNE uses dynesty’s nested sampler for parameter estimation and calculating the Bayesian evidence for each model (Speagle, 2020). The final step in ARIADNE’s algorithm is calculating the weighted average of each parameter using the relative probabilities of each models as weights. For a detailed explanation of the fitting procedure, accuracy and precision of ARIADNE the reader is referred to Vines & Jenkins (2020). The resulting stellar parameters are listed in Table 4.
| Parameter | Value | Source |
|---|---|---|
| / K | ARIADNE | |
| (cgs) | ARIADNE | |
| / km s-1 | HARPS spectrum | |
| [Fe/H] | ARIADNE | |
| / | ARIADNE | |
| / | ARIADNE | |
| Age / Gyr | ARIADNE |
4.3 TIC
The TESS Input Catalog (Stassun et al., 2019) lists the following parameters for NGTS-14A, based on the Gaia DR2 (Gaia Collaboration et al., 2018) observations: , K. We note that our adopted values are in good agreement with these TIC values.
4.4 Stellar rotation
We searched the NGTS survey light curve for periodic signals, using both a Lomb-Scargle periodogram and a generalised autocorrelation (G-ACF) method (Gillen et al., 2020). Both methods revealed a signal with a period of approximately 10 d to be the most prominent, although given the small amplitude of the putative signal ( 1 mmag), this is not a robust detection.
From the derived from the HARPS spectra ( km s-1) and the stellar radius, we calculate an upper limit to the stellar rotation period, d. This value corresponds to the case where the stellar spin and planet rotation axes are aligned.
It is unclear if the 10-d signal is related to rotation, since it would imply a faster-rotating star than suggested by the , and would be indicative of a star significantly younger (c. 700 Myr; Rebull et al. 2017; Douglas et al. 2017) than our SED analysis (Sec. 4.2) implies. At an age less than 1 Gyr, K0 stars typically exhibit photometric rotational modulation of at least a few mmag, which would be readily detectable in the NGTS data.
5 Joint fit to photometry and RVs
We performed a joint fit to the photometry and radial velocities using the Transit and Light Curve Modeller (TLCM; Csizmadia 2020). In order to reduce the large number of data points in the NGTS survey photometry, and thus increase modelling speed, we modelled only those nights of NGTS data where a transit occurred, and we binned the remaining light curve to a cadence of 120 s. This resulted in a total of 2404 NGTS survey data points. Similarly, the NGTS multi-telescope data were binned to a single light curve with a cadence of 120 s. We excluded TESS data taken far from transit, only modelling that with an orbital phase between -0.1 and 0.1. The CHAT, SAAO, and Euler light curves were modelled unbinned and in their entirety.
5.1 Contaminating flux from NGTS-14B
In all photometric data sets, except that from the SAAO 1-m, NGTS-14B (Sec. 2) is well within the photometric aperture used to extract the target flux from the images. To account for this contamination, we calculated the flux ratio of the two components of NGTS-14, and corrected the affected datasets accordingly. We find that NGTS-14B contributes around two per cent of the observed flux, and that in the absence of any correction, our value of is biased by around .
5.2 Stellar limb darkening
The signal-to-noise ratio of our photometry is not sufficiently high to precisely constrain the limb-darkening coefficients in each bandpass in which we observed NGTS-14A. The bandpasses used do not span a particularly large range of wavelengths; rather they are fairly similar to each other. We calculated theoretically expected quadratic limb-darkening coefficients for each band using the Limb Darkening Toolkit (LDTk) of Parviainen & Aigrain (2015), which relies on the stellar models of Husser et al. (2013). The difference between the coefficients for the different bandpasses is insignificant, much smaller than the uncertainties on the coefficients we measure for each light curve individually. Further, we find that our derived system parameters are insensitive to our choice of limb-darkening parameters, within this range. We therefore opt to fit for a single pair of limb-darkening coefficients, common to all observed bandpasses. In TLCM, this is done with the parameters and , where and are the commonly used quadratic coefficients.
5.3 Orbital eccentricity
We also tried fitting for an eccentric orbit, via the additional parameters and , where is the orbital eccentricity, and the argument of periastron. Our best-fitting values are and , resulting in and degrees. The three-sigma upper limit to the eccentricity is 0.11. The very modest improvement in of less than 0.4 does not compensate for the much larger Bayesian penalty on having two additional model parameters. This results in a significantly lower BIC (Bayesian Information Criterion) for the circular orbital model (). We therefore reject the eccentric model, and adopt .
5.4 Additional trend in RVs
We also tried fitting for a radial acceleration, , of NGTS-14A. The presence of such a trend in the RVs is usually indicative of an additional body in the system (e.g. Smith et al. 2017). We obtained a best-fitting value , suggesting that no significant radial acceleration is detected. This is confirmed by a BIC analysis, where the simpler model with no acceleration has a smaller BIC value (by 1.2), and is hence preferred.
5.5 Bisector spans
We observe no evidence for a correlation between either time and bisector span or bisector span and radial velocity (Fig. 4). A correlation can indicate that the apparent planetary signal is caused by a blended eclipsing binary system, or by stellar activity (Queloz et al., 2001a). Furthermore, we see no correlation between radial velocity and the FWHM of the line profile.
Our joint fit to the photometry and RVs is shown in Figs. 3 and 4, respectively. The resulting system parameters are listed in Table 5.
| Parameter | value | unit |
|---|---|---|
| TLCM fitted parameters: | ||
| Orbital period | d | |
| Transit epoch | BJD | |
| Scaled semi-major axis | ||
| Radius ratio | ||
| Transit impact parameter | ||
| Limb-darkening coefficient | ||
| Limb-darkening coefficient | ||
| Radial velocity semi amplitude | m s-1 | |
| Systemic radial velocity | km s-1 | |
| Derived parameters: | ||
| Eccentricity | 0.0 | (fixed, see Sec. 5.3) |
| Semi-major axis | au | |
| Orbital inclination angle | ||
| Transit Duration | h | |
| Planet mass | ||
| Planet radius | ||
| Planet mean density | kg m-3 | |
| Planet surface gravity | (cgs) | |
| Planet equilibrium temperature† | K | |
| †assuming zero albedo, and isotropic heat redistribution. |
6 Discussion
6.1 NGTS-14Ab in the Neptunian desert
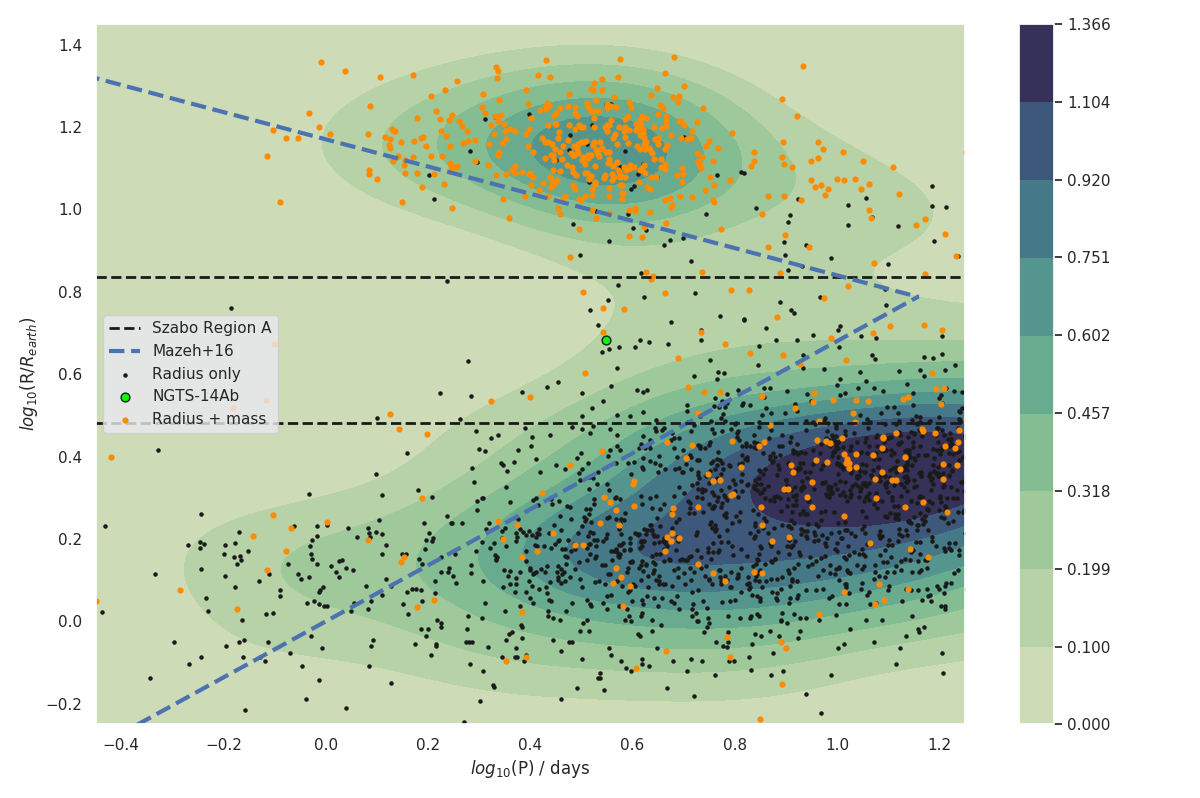
NGTS-14Ab joins a growing number of planets that reside in the Neptunian desert, a sparsely populated region of parameter space between the hot Jupiters and the super Earths in the radius – period plane (Fig. 5). NGTS-14Ab lies within both the desert as defined by Mazeh et al. (2016), and the smaller region identified by Szabó & Kálmán (2019), who along with Eigmüller et al. (2019) have recently investigated the boundaries of the Neptunian desert as a function of host star spectral type.
Owen & Lai (2018) explain the lower boundary of the desert as a consequence of photoevaporation – a process that is more efficient at reducing the size of close-in planets. Further, they suggest that the upper boundary of the desert is a result of the fact that only the highest mass planets can be tidally circularised in the closest orbits, after high-eccentricity migration. NGTS-14Ab lies among the lower boundaries of the desert computed by Owen & Lai (2018), which are dependent upon metallicity and core mass. Comparing NGTS-14Ab to their simulations (which ran for 5 Gy, similar to the age of the system) suggests that NGTS-14Ab has a core mass of close to 10 , and that any additional envelope accreted by the planet during its formation would have by now been lost to photoevaporation.
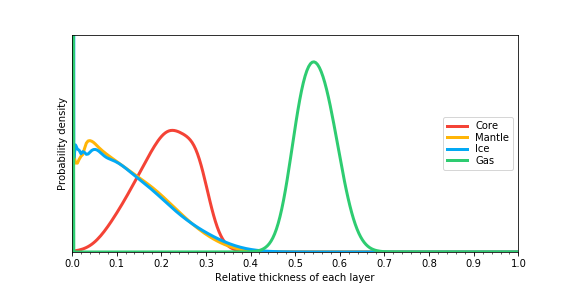
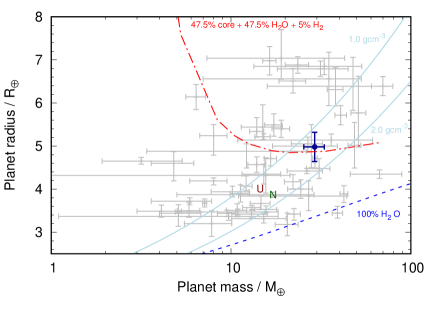
We use the neural network model of planetary interiors developed by Baumeister et al. (2020) to predict the internal structure of NGTS-14Ab (Fig. 6), using the planetary mass and radius (Table 5) as model inputs. Although internal structure is notoriously degenerate with mass and radius, this model suggests that NGTS-14Ab has a significant gaseous envelope. The models of Howe et al. (2014) suggest that an H2-He envelope constituting approximately half of the planet’s radius would contribute five to ten per cent of the planet’s mass, for a core mass of 10 . In other words, there is broad compatibility between the models of Baumeister et al. (2020) (Fig. 6) and the model of Zeng et al. (2019) with a five per cent (by mass) hydrogen-rich envelope (Fig. 7, red curve).
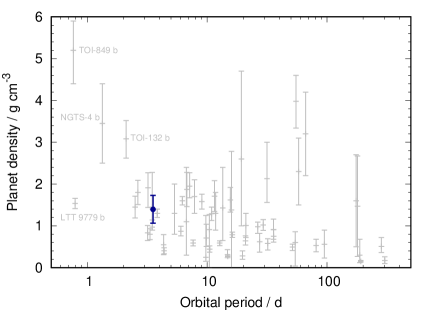
In Fig. 7, we compare NGTS-14Ab to the other planets that inhabit ‘Region A’ of Szabó & Kálmán (2019), i.e. those planets having radii between 0.28 and 0.63 . Planets orbiting closer than NGTS-14Ab does, such as NGTS-4 b (West et al., 2019) and TOI-132 b (Díaz et al., 2020), tend to be denser because they have undergone evaporation, and lost much or all of their primary, hydrogen-dominated atmospheres. The most extreme example of this is the recently-discovered TOI-849 b (Armstrong et al., 2020), thought to be the remnant core of a giant planet. LTT 9779 b (Jenkins et al., 2020) on the other hand, remains an intriguing exception – how it has apparently retained its hydrogen-rich envelope is a mystery. NGTS-14Ab appears to just far enough from its star that it is able to maintain a significant atmosphere, resulting in a density similar to those of Uranus and Neptune.
6.2 Stellar companion
Motivated by the apparent stellar companion to NGTS-14A (Section 2), and NGTS-14Ab’s position in the Neptunian desert (as defined by Mazeh et al. 2016), we conducted a search for stellar companions to other planet host stars in and around the desert. The presence of a long-period companion may influence the evolution of a planetary system, for instance by driving high-eccentricity migration (Wu & Murray, 2003).
We used the Gaia DR2 catalogue Gaia Collaboration et al. (2018) to search for companions to stars that are listed in the NASA Exoplanet Archive444https://exoplanetarchive.ipac.caltech.edu/, accessed 2020 June 17. as hosting planets with orbital periods less than ten days, and masses measured to a precision of less than 50 per cent. We then sub-divided the sample into planets lying above, in, or below the Neptunian desert (as defined in the mass-period plane in Mazeh et al. 2016). This resulted in 73 systems in the desert, 339 systems above the desert, and 55 systems (70 planets) below the desert.
| Subset | No. of | Plx & PM matches — | RUWE ¿ 1.4 | |||
| systems | No. | % | No. | % | ||
| Exoplanet host stars | ||||||
| Desert | 73 | 10 | 13.7 | 4 | 5.5 | |
| Above desert | 339 | 62 | 18.3 | 18 | 5.3 | |
| Below desert | 55 | 3 | 5.5 | 0 | 0.0 | |
| Above + below | 394 | 65 | 16.5 | 18 | 4.6 | |
| Sum of all host stars | 467 | 75 | 15.6 | 22 | 4.6 | |
| Analogous non-host stars | ||||||
| Desert | 73 | 1 | 1.4 | 11 | 15.1 | |
| Above desert | 339 | 27 | 8.0 | 49 | 14.5 | |
| Below desert | 55 | 5 | 9.1 | 14 | 25.5 | |
| Sum of all non-host stars | 467 | 33 | 7.1 | 74 | 15.8 | |
We then queried Gaia DR2, using a cone search centred on each object, conducted using the astroquery package (Ginsburg et al., 2019). The radius of the search was chosen individually for each object, so that it corresponds to a separation of 10 000 au. We then applied the same technique as used in Section 2 to search for nearby objects whose parallaxes and proper motions match the planet host star within . For , we identified possible companions to 62 host stars (18.3 per cent) from above the desert, ten (13.7 per cent) in the desert, and three (5.5 per cent) below it. Combining the results for above and below the desert, we find potential companions to 16.5 per cent of host stars outside the desert, which is statistically indistinguishable from the proportion inside the desert. These results are summarised in Table 6.
To extend our binarity analysis to companions too close to be resolved as individual objects in Gaia DR2, we used the renormalized unit weight error (RUWE) to the Gaia DR2 astrometric solutions (Lindegren et al., 2018). A previous analysis conducted using the RUWE statistic has suggested that there is tentative evidence for increased binarity among hot Jupiter host stars (Belokurov et al., 2020).
We adopt the threshold of RUWE = 1.4 suggested by the Gaia team for distinguishing between well-behaved solutions and those where an unseen additional body may impact the astrometry555Technical note GAIA-C3-TN-LU-LL-124-01 http://www.rssd.esa.int/doc_fetch.php?id=3757412. In Table 6, we report the number of systems for which the RUWE statistic is greater than 1.4. We fail to find a significant difference between the RUWE distributions for objects inside and outside the Neptunian desert. There is, however, a hint of fewer companions below the desert, with no large RUWE values in this population.
Finally, we attempted to compare the three populations of exoplanet-hosting stars with their non-exoplanet host counterparts. To do this, for each exoplanet host star, we searched Gaia DR2 for other nearby stars with similar properties. Specifically, we required that the -band magnitude be within 0.25, the colour within 15 per cent, and the parallax within a factor 2 (to exclude giant stars). Where multiple stars were found to match these criteria, we selected one at random. We then performed the same analysis on these non-exoplanet host stars as on the hosts; the results are reported in the lower part of Table 6.
We see fewer potential long-period companions with matching parallax and proper motions amongst the non-host stars, suggesting that the presence of a long-period companion increases the probability of a star hosting an exoplanet in or above the desert. Non-well behaved (RUWE ¿ 1.4) astrometric solutions are more likely to occur around stars not known to host an exoplanet, perhaps indicating that short-period binaries are more common in this population. We note, however, that selection effects may play a role here, in that short-period binarity of an exoplanet candidate host star may complicate both photometric and spectroscopic follow-up, and hence the confirmation of exoplanets orbiting stars with close binary companions.
Although this binarity analysis is inconclusive, future Gaia data releases will include the identification of further gravitationally bound companions to exoplanet host stars. This may allow any trends with planet parameters (such as membership of the Neptunian desert) to be elucidated.
7 Conclusions
We have presented the discovery of the NGTS-14 system, which consists of an early K-type dwarf star, NGTS-14A, with a long-period companion, NGTS-14B, which is likely to be a mid-M dwarf. The primary star is orbited by a transiting exoplanet, NGTS-14Ab, which is slightly larger and more massive than Neptune. The planet’s orbital period of just over 3.5 days places it in the Neptunian desert, a thus far sparsely-populated region of parameter space. NGTS-14Ab has a density which suggests that it has retained some of its primordial atmosphere.
Acknowledgements.
This work uses data collected under the NGTS project at the ESO La Silla Paranal Observatory. The NGTS facility is operated by the consortium institutes with support from the UK Science and Technology Facilities Council (STFC) under projects ST/M001962/1 and ST/S002642/1. This research made use of Astropy,666http://www.astropy.org a community-developed core Python package for Astronomy (Astropy Collaboration et al., 2013; Price-Whelan et al., 2018). This work has made use of data from the European Space Agency (ESA) mission Gaia (https://www.cosmos.esa.int/gaia), processed by the Gaia Data Processing and Analysis Consortium (DPAC, https://www.cosmos.esa.int/web/gaia/dpac/consortium). Funding for the DPAC has been provided by national institutions, in particular the institutions participating in the Gaia Multilateral Agreement. This research has made use of the NASA Exoplanet Archive, which is operated by the California Institute of Technology, under contract with the National Aeronautics and Space Administration under the Exoplanet Exploration Program. This publication makes use of data products from the Wide-field Infrared Survey Explorer, which is a joint project of the University of California, Los Angeles, and the Jet Propulsion Laboratory/California Institute of Technology, funded by the National Aeronautics and Space Administration. This study is based on observations collected at the European Southern Observatory under ESO programmes 0103.C-0719 and 0104.C-0588.We thank the Swiss National Science Foundation (SNSF) and the Geneva University for their continuous support to our planet search programs. This work has been in particular carried out in the frame of the National Centre for Competence in Research PlanetS supported by the Swiss National Science Foundation (SNSF).
This publication makes use of The Data & Analysis Center for Exoplanets (DACE), which is a facility based at the University of Geneva (CH) dedicated to extrasolar planets data visualisation, exchange and analysis. DACE is a platform of the Swiss National Centre of Competence in Research (NCCR) PlanetS, federating the Swiss expertise in Exoplanet research. The DACE platform is available at https://dace.unige.ch.
MNG acknowledges support from MIT’s Kavli Institute as a Juan Carlos Torres Fellow. Contributions by authors from the University of Warwick were supported by STFC consolidated grants ST/P000495/1 and ST/T000406/1. DJA acknowledges support from the STFC via an Ernest Rutherford Fellowship (ST/R00384X/1). EG gratefully acknowledges support from the David and Claudia Harding Foundation in the form of a Winton Exoplanet Fellowship. Ph.E., A.C., and H.R. acknowledge the support of the DFG priority program SPP 1992 “Exploring the Diversity of Extrasolar Planets” (RA 714/13-1). R.B. acknowledges support from FONDECYT Post-doctoral Fellowship Project 3180246, and from the Millennium Institute of Astrophysics (MAS).
Finally, we acknowledge our anonymous referee, whose comments helped to improve the quality of this manuscript.
References
- Allard et al. (2012) Allard, F., Homeier, D., & Freytag, B. 2012, Philosophical Transactions of the Royal Society A: Mathematical, Physical and Engineering Sciences, 370, 2765
- Armstrong et al. (2020) Armstrong, D. J., Lopez, T. A., Adibekyan, V., et al. 2020, Nature, 583, 39
- Astropy Collaboration et al. (2013) Astropy Collaboration, Robitaille, T. P., Tollerud, E. J., et al. 2013, A&A, 558, A33
- Bakos et al. (2002) Bakos, G. Á., Lázár, J., Papp, I., Sári, P., & Green, E. M. 2002, PASP, 114, 974
- Barbary (2016) Barbary, K. 2016, Journal of Open Source Software, 58
- Baumeister et al. (2020) Baumeister, P., Padovan, S., Tosi, N., et al. 2020, ApJ, 889, 42
- Belokurov et al. (2020) Belokurov, V., Penoyre, Z., Oh, S., et al. 2020, MNRAS, 496, 1922
- Bertin & Arnouts (1996) Bertin, E. & Arnouts, S. 1996, A&AS, 117, 393
- Borucki et al. (2010) Borucki, W. J., Koch, D., Basri, G., et al. 2010, Science, 327, 977
- Bryant et al. (2020) Bryant, E. M., Bayliss, D., McCormac, J., et al. 2020, MNRAS, 494, 5872
- Castelli & Kurucz (2003) Castelli, F. & Kurucz, R. L. 2003, in Modelling of Stellar Atmospheres, ed. N. Piskunov, W. W. Weiss, & D. F. Gray, Vol. 210, A20
- Chaushev et al. (2019) Chaushev, A., Raynard, L., Goad, M. R., et al. 2019, MNRAS, 488, 5232
- Collier Cameron et al. (2006) Collier Cameron, A., Pollacco, D., Street, R. A., et al. 2006, MNRAS, 373, 799
- Coppejans et al. (2013) Coppejans, R., Gulbis, A. A. S., Kotze, M. M., et al. 2013, PASP, 125, 976
- Csizmadia (2020) Csizmadia, S. 2020, MNRAS, 496, 4442
- Cutri & et al. (2013) Cutri, R. M. & et al. 2013, VizieR Online Data Catalog, II/328
- Díaz et al. (2020) Díaz, M. R., Jenkins, J. S., Gand olfi, D., et al. 2020, MNRAS, 493, 973
- Douglas et al. (2017) Douglas, S. T., Agüeros, M. A., Covey, K. R., & Kraus, A. 2017, ApJ, 842, 83
- Eigmüller et al. (2019) Eigmüller, P., Chaushev, A., Gillen, E., et al. 2019, A&A, 625, A142
- Espinoza et al. (2019) Espinoza, N., Hartman, J. D., Bakos, G. Á., et al. 2019, AJ, 158, 63
- Gaia Collaboration et al. (2018) Gaia Collaboration, Brown, A. G. A., Vallenari, A., et al. 2018, A&A, 616, A1
- Gaia Collaboration et al. (2016) Gaia Collaboration, Prusti, T., de Bruijne, J. H. J., et al. 2016, A&A, 595, A1
- Gill et al. (2018) Gill, S., Maxted, P. F. L., & Smalley, B. 2018, A&A, 612, A111
- Gillen et al. (2020) Gillen, E., Briegal, J. T., Hodgkin, S. T., et al. 2020, MNRAS, 492, 1008
- Ginsburg et al. (2019) Ginsburg, A., Sipőcz, B. M., Brasseur, C. E., et al. 2019, AJ, 157, 98
- Günther et al. (2017) Günther, M. N., Queloz, D., Gillen, E., et al. 2017, MNRAS, 472, 295
- Hartman et al. (2019) Hartman, J. D., Bakos, G. Á., Bayliss, D., et al. 2019, AJ, 157, 55
- Hauschildt et al. (1999) Hauschildt, P. H., Allard, F., & Baron, E. 1999, ApJ, 512, 377
- Henden et al. (2016) Henden, A. A., Templeton, M., Terrell, D., et al. 2016, VizieR Online Data Catalog, II/336
- Howe et al. (2014) Howe, A. R., Burrows, A., & Verne, W. 2014, ApJ, 787, 173
- Howell et al. (2014) Howell, S. B., Sobeck, C., Haas, M., et al. 2014, PASP, 126, 398
- Husser et al. (2013) Husser, T.-O., Wende-von Berg, S., Dreizler, S., et al. 2013, A&A, 553, A6
- Jenkins et al. (2020) Jenkins, J. S., Díaz, M. R., Kurtovic, N. T., et al. 2020, Nature Astronomy [arXiv:2009.12832]
- Jiang & Tremaine (2010) Jiang, Y.-F. & Tremaine, S. 2010, MNRAS, 401, 977
- Jordán et al. (2019) Jordán, A., Brahm, R., Espinoza, N., et al. 2019, AJ, 157, 100
- Kovács et al. (2002) Kovács, G., Zucker, S., & Mazeh, T. 2002, A&A, 391, 369
- Kurucz (1993) Kurucz, R. L. 1993, VizieR Online Data Catalog, 6039
- Lindegren et al. (2018) Lindegren, L., Hernández, J., Bombrun, A., et al. 2018, A&A, 616, A2
- Mayor et al. (2003) Mayor, M., Pepe, F., Queloz, D., et al. 2003, The Messenger, 114, 20
- Mazeh et al. (2016) Mazeh, T., Holczer, T., & Faigler, S. 2016, A&A, 589, A75
- McCormac et al. (2013) McCormac, J., Pollacco, D., Skillen, I., et al. 2013, PASP, 125, 548
- Owen & Lai (2018) Owen, J. E. & Lai, D. 2018, MNRAS, 479, 5012
- Parviainen & Aigrain (2015) Parviainen, H. & Aigrain, S. 2015, MNRAS, 453, 3821
- Pecaut & Mamajek (2013) Pecaut, M. J. & Mamajek, E. E. 2013, ApJS, 208, 9
- Pepe et al. (2002) Pepe, F., Mayor, M., Rupprecht, G., et al. 2002, The Messenger, 110, 9
- Pollacco et al. (2006) Pollacco, D. L., Skillen, I., Cameron, A. C., et al. 2006, PASP, 118, 1407
- Price-Whelan et al. (2018) Price-Whelan, A. M., Sipőcz, B. M., Günther, H. M., et al. 2018, AJ, 156, 123
- Queloz et al. (2001a) Queloz, D., Henry, G. W., Sivan, J. P., et al. 2001a, A&A, 379, 279
- Queloz et al. (2001b) Queloz, D., Mayor, M., Udry, S., et al. 2001b, The Messenger, 105, 1
- Rebull et al. (2017) Rebull, L. M., Stauffer, J. R., Hillenbrand, L. A., et al. 2017, ApJ, 839, 92
- Ricker et al. (2015) Ricker, G. R., Winn, J. N., Vanderspek, R., et al. 2015, Journal of Astronomical Telescopes, Instruments, and Systems, 1, 014003
- Schlafly & Finkbeiner (2011) Schlafly, E. F. & Finkbeiner, D. P. 2011, Astrophysical Journal, 737
- Schlegel et al. (1998) Schlegel, D. J., Finkbeiner, D. P., & Davis, M. 1998, ApJ, 500, 525
- Sestovic et al. (2018) Sestovic, M., Demory, B.-O., & Queloz, D. 2018, A&A, 616, A76
- Sing et al. (2016) Sing, D. K., Fortney, J. J., Nikolov, N., et al. 2016, Nature, 529, 59
- Skrutskie et al. (2006) Skrutskie, M. F., Cutri, R. M., Stiening, R., et al. 2006, AJ, 131, 1163
- Smith et al. (2020) Smith, A. M. S., Eigmüller, P., Gurumoorthy, R., et al. 2020, Astronomische Nachrichten, 341, 273
- Smith et al. (2017) Smith, A. M. S., Gandolfi, D., Barragán, O., et al. 2017, MNRAS, 464, 2708
- Speagle (2020) Speagle, J. S. 2020, MNRAS, 493, 3132
- Stassun et al. (2019) Stassun, K. G., Oelkers, R. J., Paegert, M., et al. 2019, AJ, 158, 138
- Stassun & Torres (2018) Stassun, K. G. & Torres, G. 2018, ApJ, 862, 61
- Szabó & Kálmán (2019) Szabó, G. M. & Kálmán, S. 2019, MNRAS, 485, L116
- Szabó & Kiss (2011) Szabó, G. M. & Kiss, L. L. 2011, ApJ, 727, L44
- Tamuz et al. (2005) Tamuz, O., Mazeh, T., & Zucker, S. 2005, MNRAS, 356, 1466
- Thorngren & Fortney (2018) Thorngren, D. P. & Fortney, J. J. 2018, AJ, 155, 214
- Vines & Jenkins (2020) Vines, J. I. & Jenkins, J. S. 2020, in prep
- West et al. (2019) West, R. G., Gillen, E., Bayliss, D., et al. 2019, MNRAS, 486, 5094
- Wheatley et al. (2018) Wheatley, P. J., West, R. G., Goad, M. R., et al. 2018, MNRAS, 475, 4476
- Wu & Murray (2003) Wu, Y. & Murray, N. 2003, ApJ, 589, 605
- Zeng et al. (2019) Zeng, L., Jacobsen, S. B., Sasselov, D. D., et al. 2019, Proceedings of the National Academy of Science, 116, 9723