Asymmetrically interacting dynamics with mutual confirmation from multi-source on multiplex networks
Abstract
In the early stage of epidemics, individuals’ determination on adopting protective measures, which can reduce their risk of infection and suppress disease spreading, is likely to depend on multiple information sources and their mutual confirmation due to inadequate exact information. Here we introduce the inter-layer mutual confirmation mechanism into the information-disease interacting dynamics on multiplex networks. In our model, an individual increases the information transmission rate and willingness to adopt protective measures once he confirms the authenticity of news and severity of disease from neighbors status in multiple layers. By using the microscopic Markov chain approach, we analytically calculate the epidemic threshold and the awareness and infected density in the stationary state, which agree well with simulation results. We find that the increment of epidemic threshold when confirming the aware neighbors on communication layer is larger than that of the contact layer. On the contrary, the confirmation of neighbors’ awareness and infection from the contact layer leads to a lower final infection density and a higher awareness density than that of the communication layer. The results imply that individuals’ explicit exposure of their infection and awareness status to neighbors, especially those with real contacts, is helpful in suppressing epidemic spreading.
keywords:
multiplex network , epidemic spreading model, asymmetrically interacting dynamics , mutual confirmation mechanism, microscopic Markov chain1 Introduction
The human beings have been fighting with epidemic disease for a long history. The recent coronavirus disease 2019 (COVID-19) has rapidly infected more than 25 millions of people and killed more than 800 thousands in just a few months [1]. Unraveling the mechanism that underlies the disease dynamics and adopting timely and accurate action are very important to save lives of many people and reduce the impact on the society and economics [2, 3, 4, 5]. In the longrun through social and economic activities, people form kinds of networks, such as the contact network, communication network, trade network, et al [6]. The global spread of epidemics is thus a complex, network-driven process [7]. The underlying networks through which the disease transmits play a critical role in determining the spatiotemporal patterns of the dynamic process [8]. Using the complex network approach, some key properties of the epidemic process, such as the epidemic threshold, the disease arrival time, the critical transmission path, the spatial origin of spreading process, can be reliably predicted [9, 10, 11].
Nowadays with the rapid development of information technology, people communicate and obtain information much more easily and through multiple channels, e.g., kinds of online social networks, email, mobile phone and mass media. When epidemics outbreaks, the information about disease spreads and stimulates risk awareness among people. The preventive measures people adopt help to reduce infection and thus suppress the spreading of disease [12]. The coevolving dynamics of information spreading and disease spreading can be modeled and analyzed as the asymmetrically interacting processes on the multiplex network, where the communication layer is formed by online social network and the physical contact layer is formed through persistent contacts in daily life [13, 14, 15]. The multiplex network is a particular kind of multilayer network where the same set of individuals form different layers. This multilayer approach has proved to be very successful in modeling the real complex systems where layers of networks are interrelated with each other [16, 17, 18].
In the efforts to understand the information-disease coevolving spreading dynamics on multiplex network, a number of excellent models are proposed and some non-trivial phenomena are discovered which are substantially different from the independent spreading dynamics [13, 19, 20, 21, 22, 23]. For example, researchers demonstrated that there is a metacritical point for the oneset of the epidemics which is determined by the topology of the virtual network and the dynamics of information spreading [13]. The outbreak threshold of epidemic is not affected by the information spreading, but an optimal information transmission rate may exist to markedly suppress the disease spreading [24]. The time scale of information propagation doesn’t affect the outbreak threshold, but an optimal relative timescale of information and disease spreading may reduce the epidemics incidence [25, 26]. Some works define heterogenous disease or information transmission rate for nodes by taking the local or global infection or awareness density into consideration, where the awareness density is obtained from the communication layer and the infection density is obtained from the physical contact layer [27, 28, 29]. In all the studies, the individuals receive information on one layer and transmit disease on the other layer.
In the real-world, people usually receive information from multiple source and the mutual confirmation of the information is likely to strengthen their willingness to accept the information and adopt responding activities. For example, before a customer makes a decision to purchase, he or she may get information from websites, social media, digital advertisements, catalogs, mobile and face-to-face recommendation. A consistent and positive evaluation of the focused product from multiple channels is probably to facilitate the customer’s decision to purchase. In multilayer networks, the spreading processes on each layer are dynamically dependent on each other and their interactions are either interdependent or competitive [30], which impact the activity of individual in different ways. In the information-disease coupling spreading dynamics, an individual can obtain the information on wether his neighboring nodes have been infected, either through the neighbors on the physical contact layer, e.g., from the neighbor’s daily symptoms such as cough, fever, difficulty breathing, or through the neighbors on the communication layer, e. g., from the neighbor’s blog contents or online shared pictures. These mutual confirmation on the infection of disease is likely to enhance the individual to accept and transmit the information about the epidemics. On the other hand, an individual can get to know wether his neighbors are aware of the disease either through the contact layer, from the neighbors’ actions such as wearing mask, frequently cleaning hands or using hand sanitizers, intentionally maintaining at least one meter distance from others [31], or through the communication layer, e.g., the neighbor’s attitude toward disease and safeguard in communications. These mutual confirmation of the information on disease may enhance the individual’s willingness to adopt higher level of preventive measures, and thus further suppress the diffusion of disease.
In this manuscript, we introduce the mutual confirmation mechanism into the asymmetrically interacting spreading process on multiplex networks. By using the microscopic Markov chain approach (MMCA), we are able to capture the key quantities in epidemic spreading such as the epidemic threshold and the infection density in stationary state. The rest of the paper is organized as follows. In Section 2, the model with mutual confirmation mechanism is introduced. In Section 3, we use the Markov chain approach to analyze the epidemic threshold. In Section 4, we compare the MMCA predictions with the numerical simulation results and analyze the parameters. Finally in Section 5, we make conclusions.
2 Model
2.1 The asymmetrically interacting spreading model on multiplex network
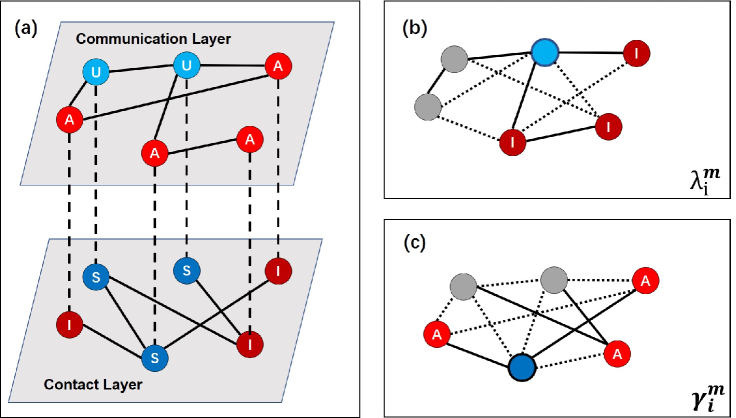
The information-disease interacting model is implemented on a multiplex network, as illustrated in Fig. 1. The network consists of a virtual communication layer labeled as layer A and a physical contact layer labeled as layer B. The information spreading process is an unaware-aware-unaware (UAU) dynamics, where a node can be in either the unaware (U) state or aware state (A). The unaware individuals become aware once they have communicated with the aware individuals, and the aware individuals return to unaware state if they have forgotten or lost confidence on the news. The transmission rate of information is and the recovery rate is . In the physical contact layer, the classical susceptible-infected-susceptible (SIS) model is used, where an infected node propagates disease to each of its susceptible neighbor at disease transmission rate , and infected nodes recover with rate . An infected node in layer B is automatically aware of the disease and thus is in state A in layer A. An aware node is probably to adopt some preventive measures against disease, thus its infected probability is reduced. We use and to represent the disease transmission rate for nodes with and without awareness respectively, where and . The attenuation factor represents the extent of reduction of disease transmission rate. So the nodes in the multiplex network can be in one of the three states: unaware and susceptible (US), aware and susceptible (AS) and aware and infected (AI).
2.2 The confirmation of multi-source information
In the mutual confirmation mechanism, an individual can obtain the infection status of its neighbors, either from the communication layer or contact layer. A large proportion of infected neighbors from both layers mutually confirm that the disease is spreading and dangerous, which increases people’s belief on the information and the information transmission rate is thus likely to be enhanced. Here we define the information receiving rate of node in the mutual confirmation mechanism as
| (1) |
where is the basic information transmission rate, is the proportion of infected neighbors in communication layer and is the proportion of infected neighbors in contact layer. if node is in infected states, otherwise . The two parameters and quantify the confirmation strength of and in promoting the information transmission rate. Meanwhile, an individual is able to obtain the awareness status of his neighbors from both the communication layer and the contact layer. A large proportion of aware neighbors from both layers mutually confirm that the information about disease are widely accepted, which enhances the individuals’ willingness to adopt higher level of preventive measures, therefore reduces the transmission rate of disease. Here we define the attenuation factor for disease transmission rate of node as
| (2) |
where is the basic attenuation factor, is the proportion of aware neighbors in communication layer and is the proportion of aware neighbors in contact layer. if node is in aware status, otherwise . The two parameters and quantify the confirmation strength of and in reducing the disease transmission rate. When the four parameters , then , , and the model reduces to the classical model without mutual confirmation mechanism. Symbols used in this paper are list in Table 1.
| Symbol | Description |
|---|---|
| () | adjacent matrix for communication layer A (element in matrix ) |
| () | adjacent matrix for contact layer B (element in matrix ) |
| () | degree of node in layer A(B) |
| basic disease transmission rate | |
| disease recovery rate | |
| basic information transmission rate | |
| information recovery rate | |
| information receiving rate for node under mutual confirmation | |
| disease transmission rate for unaware node, | |
| disease transmission rate for aware node | |
| basic attenuation factor, | |
| attenuation factor for node under mutual confirmation | |
| () | proportion of infected neighbors in layer A(B) for node |
| () | proportion of aware neighbors in layer A(B) for node |
| () | confirmation strength of () in |
| () | confirmation strength of () in |
| probability of node in A state at time | |
| probability of node not being informed by any neighbor at time | |
| probability of a U node not being infected by any neighbor at time | |
| probability of an A node not being infected by any neighbor at time | |
| infection density in the stationary state | |
| awareness density in the stationary state |
3 Microscopic Markov chain approach
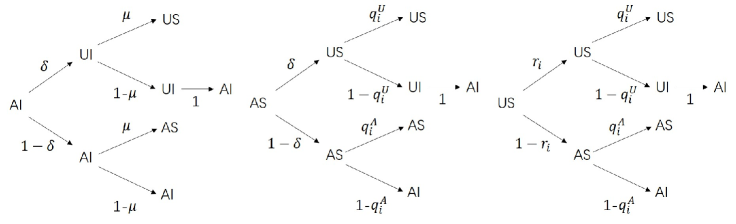
We use the microscopic Markov chain approach (MMCA) [13] to describe the information-disease coupled spreading process in the proposed model. We denote the probability that node is in one of the three states US, AS and AI at time t as , and respectively. On the communication layer, the probability that a node is not informed by any neighbor at time t is
| (3) |
where is the information receiving rate of node under mutual confirmation mechanism. On the contact layer, the probability of an unaware node or an aware node not being infected by any neighbor at time t are respectively
| (4) |
and
| (5) |
where and are the disease transmission rates for and nodes respectively, and is the attenuation factor for disease transmission rate under the mutual conformation mechanism. The transition probability tree for node states is demonstrated in Fig. 2.
Then the evolution equations of the three states in the coupled spreading dynamics can be written as
| (6) |
| (7) |
and
To obtain the epidemic threshold, we use the stationary solutions of the system by letting in Eqs. (6)-(3), which satisfy
| (9) |
| (10) |
| (11) |
Around the epidemic threshold, the number of infected nodes is negligible compared to the total population, thus the probability of nodes being infected can be assumed to be . Eqs. (4) and (5) can be approximated as
| (12) |
and
| (13) |
Using the above conditions, we can simplify the stationary solution equations of Eqs. (6-3) as
| (14) |
| (15) |
Near the threshold , then
| (18) |
In addition, there is node in the network, but no node, so . As , then . Eq. (17) can be rewritten as
| (19) |
The Eq. (19) can be written in the format of matrix as
| (20) |
where is the element of identity matrix. When epidemic starts to pervade the network in stationary state, the epidemic threshold is the minimum value that satisfies Eq. (17). As a self-consistent equation, obtaining reduces to the eigenvalue problem [20]. Let be the largest eigenvalue of matrix , where the elements of is
| (21) |
Then the epidemic threshold can be written as
| (22) |
In calculating , we iterate Eqs. (6) and (7) to get in the stationary state, and , .
4 Numerical simulations
To validate our MMCA method, we carry out extensive numerical simulations and find a good agreement between the analytical and numerical results. In simulations, the uncorrelated configuration model (UCM) is used to generate each layer of the multiplex network, which follows a power law degree distribution [32]. The number of nodes is set to be , the power exponent is , the minimal and maximal degree are and respectively. The nodes of two layers are randomly connected thus each node in one layer has a counterpart in the other layer. Initially, 10% nodes are randomly selected as infected seeds and the remaining nodes are susceptible.
Fig. 3 demonstrates the density of aware nodes and infected nodes in the stationary state as a function of basic disease transmission rate under different parameters, where and .
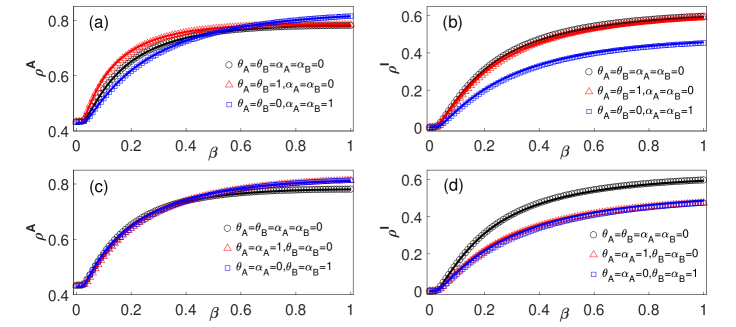
In Fig. 3 (a) and (b), three cases are compared, which are (1) information-disease interacting dynamics with no mutual confirmation, corresponding to , (2) only the infection of neighbors are mutually confirmed to increase the information receiving rate, corresponding to , , and (3) only the awareness of neighbors are mutually confirmed to reduce the attenuation factor of disease transmission rate, corresponding to , . It can be seen that the when is smaller than , the awareness density is the highest when there is mutual confirmation from infected neighbors. This is because the information transmission rate is directly enhanced due to the confirmation from infected neighbors. The awareness density is the lowest when there is mutual confirmation from the aware neighbors. This is because the disease transmission rate is reduced in this case, and the number of aware nodes informed by their infected counterparts decreases correspondingly. When is greater than , the corresponding to is growing larger than the other cases. This is because when the disease transmission rate is large enough, the proportion of infected neighbors and become large and thus significantly enhance the information receiving rate of nodes, as defined in Eq. (1). As for the infection density , it can be seen that for both cases with mutual confirmation, the infection is suppressed compared with the case with no mutual confirmation. The infection density is the lowest when the aware neighbors are mutually confirmed, corresponding to the case of and . This is because the disease transmission rate is reduced directly. When the infected neighbors are mutually confirmed, the information receiving rate of nodes increases, resulting in the increase of aware nodes in layer A and decrease of infection in layer B. So for the case of and is smaller than that of the classical model.
In Fig. 3 (c) and (d), the effects of confirmation from layer A an layer B are demonstrated. It can be seen that neighbors of layer A (corresponding to and ) or layer B (corresponding to and ) have a similar impact on , which is very close to that of the classical model when is small and a bit higher than that of the classical model when is greater than . As for , the effects of confirmation from layer A or layer B are very obvious, leading to a reduced infection density than the classical model. This is because the disease transmission rate is reduced and information transmission rate is enhanced at the same time, which together suppress the disease transmission. This result implies that if the neighbors in either layer can explicitly transmit their attitude and infection status, it will help to reduce the infection of epidemic disease. In the later part, we will discuss the impact of confirmation from layer A and layer B in detail.
4.1 Effect of confirmation mechanism on the epidemic threshold
According to the MMCA method, the epidemic threshold is strongly dependent on the matrix , whose elements are . Here the and represent the proportion of aware neighbors in layer A and B respectively, and the parameter and represent the strength of confirmation from neighbors. If the information spreading does not outbreak when the information transmission rate , then and the parameter and will have no impact on the epidemic threshold. Only when the information spreading outbreaks when , the information spreading can suppress the disease spreading [19]. In this case, and and and work. On the other hand, as the infected individuals are very few near the epidemic threshold, and . Then as described in Eq.(1), the two parameters and representing the confirmation strength of and have no impact on and the epidemic threshold. So we focus on the impact of and on the epidemic threshold . Fig. 4 shows the epidemic threshold as a function of . The threshold obtained by our MMCA method and numerical simulations are compared. The simulated epidemic threshold is obtained by using a method called susceptibility [33, 34], where a is defined as
| (23) |
In the equation, is the infection density in the stationary state in one run, and is the average over several runs. We implement 100 runs under each of the infection rate to get a , and the infection rate that corresponds to the largest is identified as the simulated epidemic threshold. As shown in Fig. 4, the epidemic threshold increases with , where is either A or B. The increment of is larger when is applied than that of , which is due to the lower average attenuation factor for disease transmission of as shown in Fig. 4 (b).
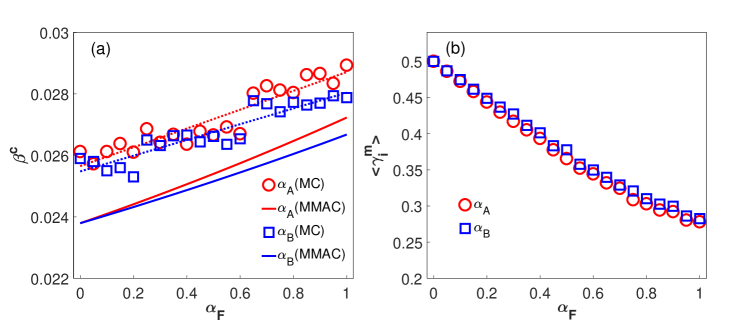
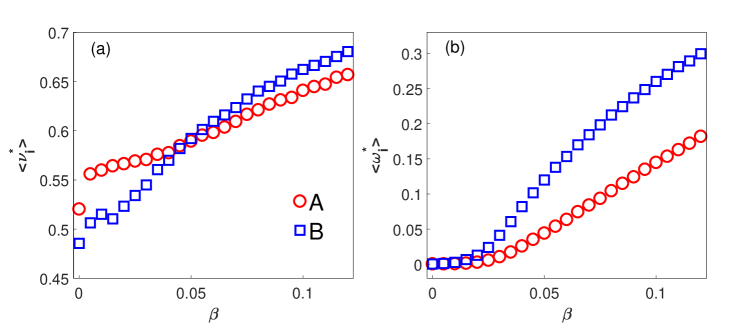
The reason why the average of is lower than that of can be explained by comparing the size of the average proportion of aware neighbors in layer A and in layer B . According to Eq.(2), . It can be seen from Fig. 5 (a) that around the epidemic threshold , . Thus at a fixed value of or , is smaller when is applied than that of . When the disease transmission rate is under or around the epidemic threshold, the epidemic does not breakout and there are very few infected nodes. The aware nodes are mostly generated by the information spreading on layer A. As the spreading is from an aware node to its neighbors, the newly generated aware nodes are locally around the previous aware nodes. Thus is relatively high for nodes with aware neighbors. While for nodes in layer B, as there are few infected nodes, their counterparts as aware nodes are correspondingly few. Meanwhile the aware nodes in layer A, if mapping to layer B, are randomly distributed in layer B because the two layers have no overlapping edges. Thus is relatively small. When the disease transmission rate is above the epidemic threshold, the disease outbreaks and there are more and more infected nodes. In such stage, the proportion of aware neighbors for nodes in layer B exceeds that of nodes in layer A. This is because the nodes which have a possibility of being infected in layer B has at least one infected neighbors and thus one aware neighbors. For nodes in layer A, there is no such constraints on neighbors. So is a bit greater than when becomes larger. The cross point at which exceeds is larger than . This means the local effect of information spreading dominates at first and then the coevolution of information-spreading and disease-spreading makes the relative proportion of aware neighbors in the two layers changes.
Similarly, we plot the average proportion of infected neighbors in layer A and in layer B as a function of respectively. As can be seen in Fig.5 (b) that is greater than under all disease transmission rate. This is because the infection spreads on layer B. As an infected node infects its neighbors, the newly infected nodes are locally around the infecting nodes. The infected nodes are locally clustered, resulting in a relatively large . Mapping these infected nodes to their counterparts in layer A, the infected nodes are scattered randomly. Thus is relatively small.
These results imply that when the information on disease spreads only by relationships, it is local at the initial stage, which is not beneficial for suppressing the disease spreading. If at this stage the public health authorities can propagate the information on disease through mass media, it will help suppress the spreading of epidemics.
In Fig. 6 we compare the theoretical and numerical values of the density of aware individuals and infected individuals under different and .
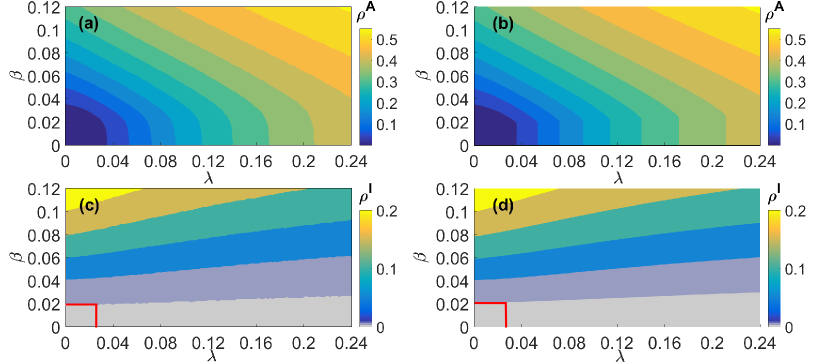
It can be seen from Fig. 6 (a) and (b) that, with the increase of or , increases. In Fig. 6 (c) and (d), increases with and decreases with . When , the information spreading does not break out thus has no effect on disease spreading. This corresponds to the plateau of marked in Fig. 6 (c) and (d). When , the epidemic threshold increases with . This is because in , and represent the proportion of aware neighbors. Increasing the information transmission rate can increase the value of and , thus decrease the attenuation factor of disease transmission rate and increases the epidemic threshold.
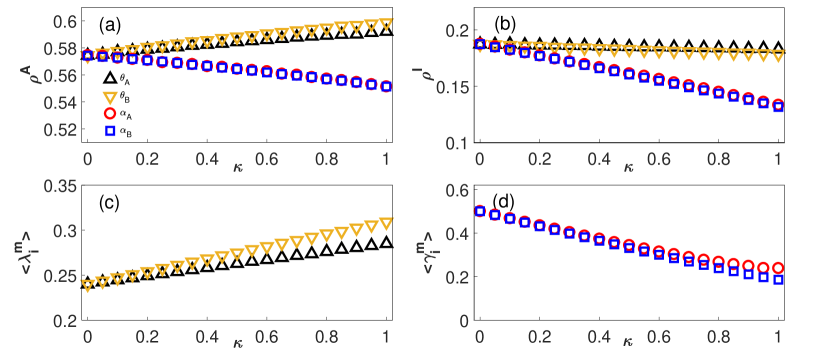
4.2 Effect of different layers on suppressing the disease spreading
In the proposed mutual confirmation mechanism, the infected and aware neighbors of communication layer and contact layer can affect the information receiving rate and disease transmission rate of nodes. Then the confirmation from which layer suppresses the disease spreading and promotes the information spreading more effectively is the question we are interested in. Fig. 7 demonstrates the and in the stationary state when the confirmation from layer A or layer B is applied.
It can be seen from Fig.7 (a) that when only the confirmation from neighbors in layer B is applied, the density of aware individuals is larger than that of layer A. This is because the average information transmission rate is higher when the confirmation from layer B is applied than that when only confirmation from layer A is applied, as can be seen in Fig.7 (c). The higher when the confirmation from layer B is applied is due to the higher as demonstrated in Fig.5 (b), which is a result of the locally clustered newly infected nodes in the disease-spreading process.
From Fig. 7 (b) we can see that the density of infected individuals is slightly lower when the confirmation from layer B is applied than that of layer A. This is because the average attenuation factor for disease transmission rate when the confirmation from layer B is applied is smaller than that of layer A, as can be seen from Fig.7 (d). So the lower of confirmation from layer B may due to the smaller and the wider spreading of awareness as shown in (a).
The above results imply that the confirmation from contact layer can promote the diffusion of awareness more widely and suppress the disease more deeply than that of the communication layer. In real-world scenarios, for the public healthy authorities to control the diffusion of disease, let the individuals timely and accurately reveal their infected status and aware status, especially for those having real contacts in daily life, is effective to further suppress the epidemics.
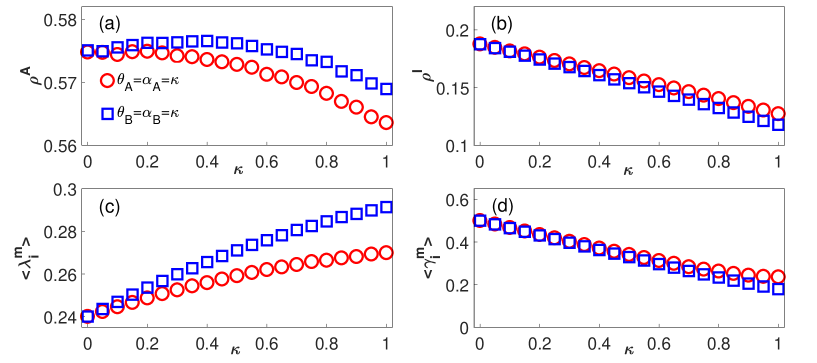
4.3 Impact of each confirmation information on suppressing the disease spreading
In this part, we focus on the impact of each confirmation information, which are the , , and , on promoting information diffusion and suppressing infection. To do this, we vary the confirmation strength of each confirmation information, which are , , and respectively, and investigate the density of aware individuals and infected individuals . From Fig.8 (a) it can be seen that is the highest when , the confirmation strength of the proportion of infected neighbors in layer B, is introduced. While is introduced, which is the confirmation strength of the proportion of infected neighbors in layer A , is lower than that of . This is because the average information transmission rate is higher when is applied than that of as shown in Fig. 8 (c). The higher of is due to the larger shown in Fig.5 (b), which is the result of local effect in disease spreading process. When and are applied respectively, is the lowest. This is because the non-zero and in the attenuation factor for disease transmission reduce the disease transmission rate directly, thus leading to a decreased number of infected individuals as well as their counterparts as aware nodes.
In Fig. 8 (b) when and are applied respectively, is lower than that of and . This is because the disease transmission rate is directly reduced when or is applied. The average attenuation factor for disease transmission of is lower than that of as shown in Fig. 8 (d), which leads to the lower of . The smaller when is introduced is the result of larger proportion of aware neighbors in layer B as shown in Fig.5 (a) when the basic disease transmission rate is far above the threshold, which is the result of the local effect in disease spreading process. The reason of is higher than that of is that results in a lower than , thus the suppressing effect is smaller than that of .
The above results indicate that in suppressing disease spreading, the rank for the effect of confirmation from neighbors is . This implies that directly reducing the disease transmission rate, other than promoting awareness spreading, can suppress the disease spreading more effectively. In addition, the local effect in disease spreading makes the average proportion of infected neighbors in the physical contact layer larger than that of communication layer, which leads to the impact of .
5 Conclusion and Discussion
In the early stage of epidemics, people are not certain about the credibility of information, thus may seek for confirmation from multiple sources. The infection of neighbors from both the communication layer and the contact layer will convince people the prevalence of disease, thus making the transmission of information on epidemics more easily. Meanwhile if there is a large proportion of acquaintances that have accepted the information, people are more likely to adopt protective measures to reduce the risk of infection. Based on this assumption, we articulate the information-disease interacting spreading model with inter-layer mutual confirmation mechanism on multiplex networks. By using the microscopic Markov chain method, we analytically predict the epidemic threshold and infection density in stationary state, which agree well with the simulation results.
We find that the confirmation from aware neighbors in layer A can enhance the epidemic threshold more than the confirmation from aware neighbors in layer B. This is because around the epidemic threshold there are few infected nodes and the spreading of information dominates the diffusion of awareness. The local effect of information spreading makes the proportion of aware neighbors in layer A larger than that of layer B. On the other hand, the infected neighbors of either layer A or B has no impact on the epidemic threshold, because around the epidemic threshold the number of infected neighbors is approaching zero.
As for the effect of suppressing disease, when independently apply one of the four confirmation information, the reduction of can be ordered as . There are two reasons for this ranking. Firstly, reducing the disease transmission rate directly suppresses the epidemic more than enhancing the awareness spreading does. Secondly, the local effect in disease spreading makes the proportion of infected neighbors in layer B, as well as the proportion of aware neighbors of layer B, larger than that of layer A, thus leading to the larger inhibitory effect of confirmation from layer B. From the perspective of layers, confirmation from the aware and infected neighbors in contact layer can result in a lower infection density in the stationary state than that of the confirmation from the communication layer, which is also due to the local effect in disease-spreading and information-spreading.
The results in this work imply that when epidemic outbreaks, encouraging people to explicitly express their infected status and aware attitude is helpful to reduce the infection in the whole population. While the spreading of disease and information has a local effect, the heath authority’s announcement of the information on epidemics to the public is important to suppress the disease. When the anti-epidemic resource is limited, investing the limited resource into real-world activities, such as distributing protective goods or medicines, cutting off disease transmission path, is more effective than propagating online.
Acknowledgement
This work is supported by the National Natural Science Foundation of China (No. 61802321, 11975099), the Sichuan Science and Technology Program (No. 2020YJ0125), the Natural Science Foundation of Shanghai (No. 18ZR1412200) and the Science and Technology Commission of Shanghai Municipality (Grant No. 14DZ2260800).
References
References
- [1] World health organization website (September 2020). URL https://www.who.int/
- [2] J. Zhang, M. Litvinova, Y. Liang, Y. Wang, W. Wang, S. Zhao, Q. Wu, S. Merler, C. Viboud, A. Vespignani, et al.,Changes in contact patterns shape the dynamics of the covid-19 outbreak in china, Science 368 (6498) (2020) 1481-1486.
- [3] M. U. Kraemer, C.-H. Yang, B. Gutierrez, C.-H. Wu, B. Klein, D. M. Pigott, L. Du Plessis, N. R. Faria, R. Li, W. P. Hanage, et al., The effect of human mobility and control measures on the covid-19 epidemic in china, Science 368 (6490) (2020) 493-497.
- [4] S. M. Kissler, C. Tedijanto, E. Goldstein, Y. H. Grad, M. Lipsitch, Projecting the transmission dynamics of sarscov-2 through the postpandemic period, Science 368 (6493) (2020) 860-868.
- [5] Z.-M. Zhai, Y.-S. Long, M. Tang, Z. Liu, Y.-C. Lai, When did covid-19 start? -optimal inference of time zero, Research Square (2020) 1-14.
- [6] M. E. J. Newman, The structure and function of complex networks, SIAM Review 45 (2) (2003) 167-256.
- [7] R. M. Anderson, B. Anderson, R. M. May, Infectious diseases of humans: dynamics and control, Oxford university press, 1992.
- [8] L. Hufnagel, D. Brockmann, T. Geisel, Forecast and control of epidemics in a globalized world, Proceedings of the National Academy of Sciences 101 (42) (2004) 15124-15129.
- [9] C. Castellano, R. Pastor-Satorras, Thresholds for epidemic spreading in networks, Physical Review Letters 105 (21) (2010) 218701.
- [10] D. Brockmann, D. Helbing, The hidden geometry of complex, network-driven contagion phenomena, Science 342 (6164) (2013) 1337-1342.
- [11] R. Pastor-Satorras, C. Castellano, P. Van Mieghem, A. Vespignani, Epidemic processes in complex networks, Reviews of Modern Physics 87 (3) (2015) 925.
- [12] S. Funk, E. Gilad, C. Watkins, V. A. Jansen, The spread of awareness and its impact on epidemic outbreaks, Proceedings of the National Academy of Sciences 106 (16) (2009) 6872-6877.
- [13] C. Granell, S. Gomez, A. Arenas, Dynamical interplay between awareness and epidemic spreading in multiplex networks, Physical Review Letters 111 (12) (2013) 128701.
- [14] C. Granell, S. Gomez, A. Arenas, Competing spreading processes on multiplex networks: awareness and epidemics, Physical Review E 90 (1) (2014) 012808.
- [15] M. De Domenico, C. Granell, M. A. Porter, A. Arenas, The physics of spreading processes in multilayer networks, Nature Physics 12 (10) (2016) 901-906.
- [16] M. Kivela, A. Arenas, M. Barthelemy, J. P. Gleeson, Y. Moreno, M. A. Porter, Multilayer networks, Journal of Complex Networks 2 (3) (2014) 203-271.
- [17] S. Boccaletti, G. Bianconi, R. Criado, C. D. Genio, J. Gómez-Gardeñes, M. Romance, I. Sendiña-Nadal, Z. Wang, M. Zanin, The structure and dynamics of multilayer networks, Physics Reports 544 (1) (2014) 1-122.
- [18] G. F. de Arruda, F. A. Rodrigues, Y. Moreno, Fundamentals of spreading processes in single and multilayer complex networks, Physics Reports 756 (2018) 1-59.
- [19] W. Wang, M. Tang, H. Yang, Y. Do, Y.-C. Lai, G. Lee, Asymmetrically interacting spreading dynamics on complex layered networks, Scientific Reports 4 (2014) 5097.
- [20] Q. Guo, X. Jiang, Y. Lei, M. Li, Y. Ma, Z. Zheng, Two-stage effects of awareness cascade on epidemic spreading in multiplex networks, Physical Review E 91 (1) (2015) 012822.
- [21] V. Nicosia, P. S. Skardal, A. Arenas, V. Latora, Collective phenomena emerging from the interactions between dynamical processes in multiplex networks, Physical Review Letters 118 (13) (2017) 138302.
- [22] A. Moinet, R. Pastor-Satorras, A. Barrat, Effect of risk perception on epidemic spreading in temporal networks, Physical Review E 97 (1) (2018) 012313.
- [23] H. Yang, C. Gu, M. Tang, S.-M. Cai, Y.-C. Lai, Suppression of epidemic spreading in time-varying multiplex networks, Applied Mathematical Modelling 75 (2019) 806-818.
- [24] W. Wang, Q.-H. Liu, S.-M. Cai, M. Tang, L. A. Braunstein, H. E. Stanley, Suppressing disease spreading by using information diffusion on multiplex networks, Scientific Reports 6 (2016) 29259.
- [25] H. Wang, C. Chen, B. Qu, D. Li, S. Havlin, Epidemic mitigation via awareness propagation in communication networks: the role of time scales, New Journal of Physics 19 (7) (2017) 073039.
- [26] P. C. V. da Silva, F. Velasquez-Rojas, C. Connaughton, F. Vazquez, Y. Moreno, F. A. Rodrigues, Epidemic spreading with awareness and different timescales in multiplex networks, Physical Review E 100 (3) (2019) 032313.
- [27] H.-F. Zhang, J.-R. Xie, M. Tang, Y.-C. Lai. Suppression of epidemic spreading in complex networks by local information based behavioral responses, Chaos: An Interdisciplinary Journal of Nonlinear Science 24 (4) (2014) 043106.
- [28] Y. Pan, Z. Yan, The impact of individual heterogeneity on the coupled awareness-epidemic dynamics in multiplex networks, Chaos: An Interdisciplinary Journal of Nonlinear Science 28(6) (2018) 063123
- [29] V. Sagar, Y. Zhao, A. Sen, Effect of time varying transmission rates on the coupled dynamics of epidemic and awareness over a multiplex network, Chaos: An Interdisciplinary Journal of Nonlinear Science 28 (2018) 113125.
- [30] M. M. Danziger, I. Bonamassa, S. Boccaletti, S. Havlin, Dynamic interdependence and competition in multilayer networks, Nature Physics 15 (2) (2019) 178-185.
- [31] Coronavirus disease (covid-19) advice for the public from the who website (September 2020). URL https://www.who.int/emergencies/diseases/novel-coronavirus-2019/advice-for-public
- [32] M. E. Newman, S. H. Strogatz, D. J. Watts, Random graphs with arbitrary degree distributions and their applications, Physical Review E 64 (2) (2001) 026118.
- [33] S. C. Ferreira, C. Castellano, R. Pastor-Satorras, Epidemic thresholds of the susceptible-infected-susceptible model on networks: A comparison of numerical and theoretical results, Physical Review E 86 (4) (2012) 041125.
- [34] P. Shu, W. Wang, M. Tang, Y. Do, Numerical identification of epidemic thresholds for susceptible-infectedrecovered model on finite-size networks, Chaos: An Interdisciplinary Journal of Nonlinear Science 25 (6) (2015) 063104.