Fractional model of COVID-19 applied to Galicia, Spain and Portugal
Abstract
A fractional compartmental mathematical model for the spread of the COVID-19 disease is proposed. Special focus has been done on the transmissibility of super-spreaders individuals. Numerical simulations are shown for data of Galicia, Spain, and Portugal. For each region, the order of the Caputo derivative takes a different value, that is not close to one, showing the relevance of considering fractional models.
keywords:
mathematical modeling of COVID-19 pandemic , Galicia, Spain and Portugal case studies , fractional differential equations , numerical simulations.MSC:
[2010]26A33 , 34A08 , 92D30.1 Introduction
Coronavirus disease 2019 (COVID-19), the outbreak due to severe acute respiratory syndrome coronavirus 2 (SARS-CoV-2), has taken on pandemic proportions in 2020, affecting several millions of individuals in almost all countries [12]. An integrated science and multidisciplinary approach is necessary to fight the COVID-19 pandemic [17, 18]. In particular, mathematical and epidemiological simulation plays a crucial role in predicting, anticipating, and controlling present and future epidemics.
As for the mathematical modelling of coronavirus disease COVID-19, it has been shown to be extremely useful for governments in order to define appropriate policies [19]. In this direction, a number of papers has been recently published related with modelling of this pandemic (see, e.g., [6, 9], just to cite some of them).
In [19], a model including the super-spreader class has been presented, and applied to give an estimation of the infected and death individuals in Wuhan. The collaboration with Galician government [3] has allowed to understand some important considerations in order to perform analysis. In particular, due to the pandemic, some cases have not been reported as expected, but with some days of delay. As a consequence, in this paper we propose to consider not the daily reported cases, but the means in the previous 5 days of daily reported cases. As a result, it seems appropriate to consider fractional derivatives, which have been intensively used to obtain models of infectious diseases since they take into account the memory effect, which is now bigger due to the aforementioned mean of the five previous days of daily reported cases. Having estimates a priori of infected individuals of COVID-19, obtained by using mathematical models, has helped to predict the number of required beds both for hospitalized individuals and mainly at intensive care units [3].
Fractional calculus and fractional differential equations have recently been applied in numerous areas of mathematics, physics, engineering, bio-engineering, and other applied sciences. We refer the reader to the monographs [7, 11, 13, 22, 24, 25, 27] and the articles [1, 2, 20, 26]. In this work we shall consider the Caputo fractional derivative [4] (see also [8]). A fractional model using the Caputo–Fabrizio fractional derivative of COVID-19 in Wuhan (China) has been developed in [21].
The structure of this work is as follows. In Section 2, we introduce a fractional model by using Caputo fractional derivatives on the classical compartmental model presented in [19], and where the fractional order of differentiation can be used to describe different strains and genomes of the coronavirus and vary with mutations. In Section 3, some numerical results are presented for three different territories: Galicia, Spain, and Portugal. Galicia is an autonomous community of Spain and located in the northwest Iberian Peninsula and having a population of about 2,700,000 and a total area of 29,574 km2. Spain (officially, the Kingdom of Spain) is a country mostly located on the Iberian Peninsula, in southwestern Europe, with a population of about 47,000,000 people and a total area of 505,992 km2. Portugal (officially, the Portuguese Republic) is also a country located mostly on the Iberian Peninsula with a population of about 10,276,000 individuals and a total area of 92,212 km2. We end with Section 4 of conclusions and discussion.
2 The Proposed COVID-19 Fractional Model
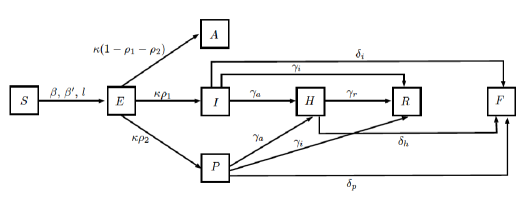
In what follows we shall assume that we have a constant population divided in 8 epidemiological classes, namely:
-
1.
susceptible individuals (),
-
2.
exposed individuals (),
-
3.
symptomatic and infectious individuals (),
-
4.
super-spreaders individuals (),
-
5.
infectious but asymptomatic individuals (),
-
6.
hospitalized individuals (),
-
7.
recovery individuals (), and
-
8.
dead individuals () or fatality class.
Our model is based on the one presented in [19] and substituting the first order derivative by a derivative of fractional order . We use the fractional derivative in the sense of Caputo: for an absolutely continuous function the Caputo fractional derivative of order is given by [11, 13, 15, 22]:
Fractional calculus and fractional differential equations are an active area of research and, in some cases, adequate to incorporate the history of the processes [1, 10, 14, 15, 16, 23, 27]. The fractional proposed model takes the form
| (1) |
in which we have the following parameters:
-
1.
quantifies the human-to-human transmission coefficient per unit time (days) per person,
-
2.
quantifies a high transmission coefficient due to super-spreaders,
-
3.
quantifies the relative transmissibility of hospitalized patients,
-
4.
is the rate at which an individual leaves the exposed class by becoming infectious (symptomatic, super-spreaders or asymptomatic),
-
5.
is the proportion of progression from exposed class to symptomatic infectious class ,
-
6.
is a relative very low rate at which exposed individuals become super-spreaders,
-
7.
is the progression from exposed to asymptomatic class,
-
8.
is the average rate at which symptomatic and super-spreaders individuals become hospitalized,
-
9.
is the recovery rate without being hospitalized,
-
10.
is the recovery rate of hospitalized patients,
-
11.
denotes the disease induced death rates due to infected individuals,
-
12.
denotes the disease induced death rates due to super-spreaders individuals,
-
13.
denotes the disease induced death rates due to hospitalized individuals.
A flowchart of model (1) is presented in Figure 1. For additional details and particular values of the parameters we refer the reader to [19].
3 Numerical Simulations
Next, we shall show the numerical simulations in three territories: Galicia, Portugal, and Spain. For all these cases we have considered the official data published by the corresponding authorities and we have computed the means of the five previous reports. As it has been observed during this pandemic, the output of the laboratories has had some delays due to the big pressure and collapse of the public health systems. In this way, some cases have been reported with some delay and some updates have been published days later of the corresponding dates. In order to reduce these problems, we consider the mean of the five previous reported cases, always following the official data. Moreover, in each of the territories there are specificities such as territorial dispersion/concentration, use of public transportation, and mainly the date of starting the confinement, as compared with the initial spread of the COVID-19. These factors imply tiny adjustments in the factor to divide the total population as well as in the value of the fractional parameter . For solving the system of fractional differential equations (1) we have used [5], by using Matlab in a MacBook Pro computer with a 2.3 GHz Intel Core i9 processor and 16GB of 2400 MHz DDR4 memory.
3.1 The Case Study of Galicia
In the autonomous region of Galicia, we have the values given in Table 1 as for the cumulative cases, the new daily infected individuals, as well as the mean of the previous days.
| Date | Confirmed |
|
|
Date | Confirmed |
|
|
|||||||||
|---|---|---|---|---|---|---|---|---|---|---|---|---|---|---|---|---|
| 03-08 | 6 | 1 | 1 | 04-03 | 5625 | 406 | 380,4 | |||||||||
| 03-09 | 22 | 16 | 4,2 | 04-04 | 5944 | 319 | 381 | |||||||||
| 03-10 | 35 | 13 | 6,4 | 04-05 | 6151 | 207 | 343,8 | |||||||||
| 03-11 | 35 | 0 | 6,4 | 04-06 | 6331 | 180 | 297,8 | |||||||||
| 03-12 | 85 | 50 | 16 | 04-07 | 6538 | 207 | 263,8 | |||||||||
| 03-13 | 115 | 30 | 21,8 | 04-08 | 6758 | 220 | 226,6 | |||||||||
| 03-14 | 195 | 80 | 34,6 | 04-09 | 6946 | 188 | 200,4 | |||||||||
| 03-15 | 245 | 50 | 42 | 04-10 | 7176 | 230 | 205 | |||||||||
| 03-16 | 292 | 47 | 51,4 | 04-11 | 7336 | 160 | 201 | |||||||||
| 03-17 | 341 | 49 | 51,2 | 04-12 | 7494 | 158 | 191,2 | |||||||||
| 03-18 | 453 | 112 | 67,6 | 04-13 | 7597 | 103 | 167,8 | |||||||||
| 03-19 | 578 | 125 | 76,6 | 04-14 | 7708 | 111 | 152,4 | |||||||||
| 03-20 | 739 | 161 | 98,8 | 04-15 | 7873 | 165 | 139,4 | |||||||||
| 03-21 | 915 | 176 | 124,6 | 04-16 | 8013 | 140 | 135,4 | |||||||||
| 03-22 | 1208 | 293 | 173,4 | 04-17 | 8084 | 71 | 118 | |||||||||
| 03-23 | 1415 | 207 | 192,4 | 04-18 | 8185 | 101 | 117,6 | |||||||||
| 03-24 | 1653 | 238 | 215 | 04-19 | 8299 | 114 | 118,2 | |||||||||
| 03-25 | 1915 | 262 | 235,2 | 04-20 | 8468 | 169 | 119 | |||||||||
| 03-26 | 2322 | 407 | 281,4 | 04-21 | 8634 | 166 | 124,2 | |||||||||
| 03-27 | 2772 | 450 | 312,8 | 04-22 | 8805 | 171 | 144,2 | |||||||||
| 03-28 | 3139 | 367 | 344,8 | 04-23 | 8932 | 127 | 149,4 | |||||||||
| 03-29 | 3723 | 584 | 414 | 04-24 | 9116 | 184 | 163,4 | |||||||||
| 03-30 | 4039 | 316 | 424,8 | 04-25 | 9176 | 60 | 141,6 | |||||||||
| 03-31 | 4432 | 393 | 422 | 04-26 | 9238 | 62 | 120,8 | |||||||||
| 04-01 | 4842 | 410 | 414 | 04-27 | 9328 | 90 | 104,6 | |||||||||
| 04-02 | 5219 | 377 | 416 |
The data includes 51 values starting 7th March since after that date (27th April) the way of officially computing individuals has changed.
By considering the fractional order and the same values of the parameters as in [19], the results of the numerical simulation are shown in Figure 2.
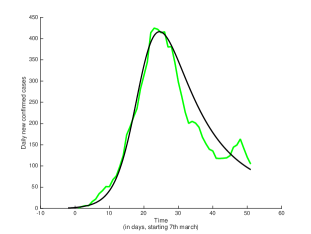
The green line denotes the real data while the black line is the numerical solution of the fractional system (1), with total population , where , since the population of Galicia is widely dispersed in the territory with very few big cities and low use of public transportation.
3.2 The Case Study of Spain
As for the Kingdom of Spain, the data of 82 days is collected in Table 2, as for the cumulative cases, the new daily infected individuals, as well as the mean of the previous days, starting 25th February.
| Date | Confirmed |
|
|
Date | Confirmed |
|
|
|||||||||
| 02-25 | 10 | 6 | 1,4 | 04-06 | 147717 | 5213 | 5676,2 | |||||||||
| 02-26 | 18 | 8 | 3 | 04-07 | 153303 | 5586 | 5337,4 | |||||||||
| 02-27 | 36 | 18 | 6,6 | 04-08 | 159051 | 5748 | 5151,4 | |||||||||
| 02-28 | 55 | 19 | 10,4 | 04-09 | 163591 | 4540 | 4951,8 | |||||||||
| 02-29 | 83 | 28 | 15,8 | 04-10 | 168151 | 4560 | 5129,4 | |||||||||
| 03-01 | 138 | 55 | 25,6 | 04-11 | 172054 | 3903 | 4867,4 | |||||||||
| 03-02 | 195 | 57 | 35,4 | 04-12 | 175087 | 3033 | 4356,8 | |||||||||
| 03-03 | 270 | 75 | 46,8 | 04-13 | 178224 | 3137 | 3834,6 | |||||||||
| 03-04 | 352 | 82 | 59,4 | 04-14 | 182662 | 4438 | 3814,2 | |||||||||
| 03-05 | 535 | 183 | 90,4 | 04-15 | 186484 | 3822 | 3666,6 | |||||||||
| 03-06 | 769 | 234 | 126,2 | 04-16 | 190308 | 3824 | 3650,8 | |||||||||
| 03-07 | 1101 | 332 | 181,2 | 04-17 | 194150 | 3842 | 3812,6 | |||||||||
| 03-08 | 1536 | 435 | 253,2 | 04-18 | 193437 | 713 | 3042,6 | |||||||||
| 03-09 | 2309 | 773 | 391,4 | 04-19 | 195655 | 2218 | 2598,6 | |||||||||
| 03-10 | 3285 | 976 | 550 | 04-20 | 198614 | 2959 | 2426 | |||||||||
| 03-11 | 4442 | 1157 | 734,6 | 04-21 | 200968 | 2354 | 2132 | |||||||||
| 03-12 | 5976 | 1534 | 975 | 04-22 | 203888 | 2920 | 1947,6 | |||||||||
| 03-13 | 7659 | 1683 | 1224,6 | 04-23 | 206002 | 2114 | 2513 | |||||||||
| 03-14 | 9806 | 2147 | 1499,4 | 04-24 | 208507 | 2505 | 2570,4 | |||||||||
| 03-15 | 11515 | 1709 | 1646 | 04-25 | 210148 | 1641 | 2306,8 | |||||||||
| 03-16 | 14018 | 2503 | 1915,2 | 04-26 | 211807 | 1659 | 2167,8 | |||||||||
| 03-17 | 17713 | 3695 | 2347,4 | 04-27 | 213338 | 1531 | 1890 | |||||||||
| 03-18 | 21764 | 4051 | 2821 | 04-28 | 214215 | 877 | 1642,6 | |||||||||
| 03-19 | 26333 | 4569 | 3305,4 | 04-29 | 215470 | 1255 | 1392,6 | |||||||||
| 03-20 | 31779 | 5446 | 4052,8 | 04-30 | 216757 | 1287 | 1321,8 | |||||||||
| 03-21 | 36645 | 4866 | 4525,4 | 05-01 | 217992 | 1235 | 1237 | |||||||||
| 03-22 | 41291 | 4646 | 4715,6 | 05-02 | 218894 | 902 | 1111,2 | |||||||||
| 03-23 | 48984 | 7693 | 5444 | 05-03 | 219338 | 444 | 1024,6 | |||||||||
| 03-24 | 57546 | 8562 | 6242,6 | 05-04 | 220362 | 1024 | 978,4 | |||||||||
| 03-25 | 66503 | 8957 | 6944,8 | 05-05 | 221236 | 874 | 895,8 | |||||||||
| 03-26 | 75691 | 9188 | 7809,2 | 05-06 | 222145 | 909 | 830,6 | |||||||||
| 03-27 | 83944 | 8253 | 8530,6 | 05-07 | 223305 | 1160 | 882,2 | |||||||||
| 03-28 | 90371 | 6427 | 8277,4 | 05-08 | 224048 | 743 | 942 | |||||||||
| 03-29 | 96184 | 5813 | 7727,6 | 05-09 | 224755 | 707 | 878,6 | |||||||||
| 03-30 | 104332 | 8148 | 7565,8 | 05-10 | 227659 | 2904 | 1284,6 | |||||||||
| 03-31 | 111745 | 7413 | 7210,8 | 05-11 | 228373 | 714 | 1245,6 | |||||||||
| 04-01 | 119336 | 7591 | 7078,4 | 05-12 | 228978 | 605 | 1134,6 | |||||||||
| 04-02 | 126616 | 7280 | 7249 | 05-13 | 229471 | 493 | 1084,6 | |||||||||
| 04-03 | 133294 | 6678 | 7422 | 05-14 | 230228 | 757 | 1094,6 | |||||||||
| 04-04 | 138832 | 5538 | 6900 | 05-15 | 230929 | 701 | 654 | |||||||||
| 04-05 | 142504 | 3672 | 6151,8 | 05-16 | 231350 | 421 | 595,4 |
By considering again the fractional order and the same values of the parameters as in [19], the results of the numerical simulation are shown in Figure 3.
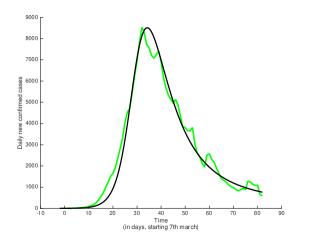
The green line denotes the real data while the black line is the numerical solution of the fractional system (1), with since in some parts of Spain there is more concentrated population and intensive use of public transportation.
3.3 The Case Study of Portugal
As for the Republic of Portugal, the data of 56 days starting 3rd March for the cumulative cases, the new daily infected individuals, as well as the mean of the 5 previous days is collected in Table 3.
| Date | Confirmed |
|
|
Date | Confirmed |
|
|
|||||||||
| 03-03 | 4 | 2 | 4 | 03-31 | 7443 | 1035 | 725,9 | |||||||||
| 03-04 | 6 | 2 | 2 | 04-01 | 8251 | 808 | 750,9 | |||||||||
| 03-05 | 9 | 3 | 3 | 04-02 | 9034 | 783 | 784,3 | |||||||||
| 03-06 | 13 | 4 | 4 | 04-03 | 9886 | 852 | 802,6 | |||||||||
| 03-07 | 21 | 8 | 8 | 04-04 | 10524 | 638 | 764,9 | |||||||||
| 03-08 | 30 | 9 | 9 | 04-05 | 11278 | 754 | 759,4 | |||||||||
| 03-09 | 39 | 9 | 5,5 | 04-06 | 11730 | 452 | 760,3 | |||||||||
| 03-10 | 41 | 2 | 5,3 | 04-07 | 12442 | 712 | 714,1 | |||||||||
| 03-11 | 59 | 18 | 7,6 | 04-08 | 13141 | 699 | 698,6 | |||||||||
| 03-12 | 78 | 19 | 9,9 | 04-09 | 13956 | 815 | 703,1 | |||||||||
| 03-13 | 112 | 34 | 14,1 | 04-10 | 15472 | 1516 | 798 | |||||||||
| 03-14 | 169 | 57 | 21,1 | 04-11 | 15987 | 515 | 780,4 | |||||||||
| 03-15 | 245 | 76 | 30,7 | 04-12 | 16585 | 598 | 758,1 | |||||||||
| 03-16 | 331 | 86 | 41,7 | 04-13 | 16934 | 349 | 743,4 | |||||||||
| 03-17 | 448 | 117 | 58,1 | 04-14 | 17448 | 514 | 715,1 | |||||||||
| 03-18 | 642 | 194 | 83,3 | 04-15 | 18091 | 643 | 707,1 | |||||||||
| 03-19 | 785 | 143 | 101 | 04-16 | 18841 | 750 | 697,9 | |||||||||
| 03-20 | 1020 | 235 | 129,7 | 04-17 | 19022 | 181 | 507,1 | |||||||||
| 03-21 | 1280 | 260 | 158,7 | 04-18 | 20206 | 1184 | 602,7 | |||||||||
| 03-22 | 1600 | 320 | 193,6 | 04-19 | 20863 | 657 | 611,1 | |||||||||
| 03-23 | 2060 | 460 | 247 | 04-20 | 21379 | 516 | 635 | |||||||||
| 03-24 | 2362 | 302 | 273,4 | 04-21 | 21982 | 603 | 647,7 | |||||||||
| 03-25 | 2995 | 633 | 336,1 | 04-22 | 22353 | 371 | 608,9 | |||||||||
| 03-26 | 3544 | 549 | 394,1 | 04-23 | 22797 | 444 | 565,1 | |||||||||
| 03-27 | 4268 | 724 | 464 | 04-24 | 23392 | 595 | 624,3 | |||||||||
| 03-28 | 5170 | 902 | 555,7 | 04-25 | 23864 | 472 | 522,6 | |||||||||
| 03-29 | 5962 | 792 | 623,1 | 04-26 | 24027 | 163 | 452 | |||||||||
| 03-30 | 6408 | 446 | 621,1 | 04-27 | 24322 | 295 | 420,4 |
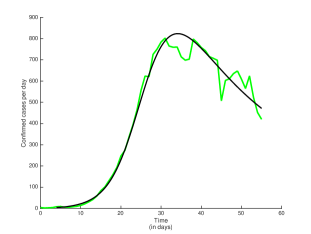
By considering now the fractional order and the same values of the parameters as in [19], the results of the numerical simulation are shown in Figure 4. As in the previous figures, the green line denotes the real data while the black line is the numerical solution of the fractional system (1), with since the Portuguese population is widely dispersed and the confinement started at an earlier stage of the spread of the disease.
4 Conclusions and Discussion
In this paper, we have shown the importance of considering a fractional Caputo differential system, where the order of the derivative plays a crucial role to fit the number of confirmed cases in the regions of Galicia, Spain and Portugal. In fact, the considered values of for Galicia and Spain and for Portugal, are not close to 1 (the classical derivative), as it happens in many of the proposed fractional compartmental models in the literature. Note that the same values of the parameters in the differential system (1), taken from [19], were used for the three regions. Therefore, we may conclude that model (1) can be used to approximate the confirmed cases of COVID-19 in regions with different economic, geographical, social and epidemic characteristics, as it happens for the three considered regions in this paper.
Our variables are divided into eight epidemiological sub-populations as in [19] and they are detailed at the beginning of the second section, dedicated to the introduction of the dynamical model. We have solved our fractional dynamical model using a subroutine called FracPECE [5] to approximate numerically the solution of the proposed fractional system of differential equations. Our numerical simulations show a good agreement between the output of the fractional model given by the sum of the symptomatic and infectious individuals, super-spreaders, and hospitalized individuals and the data collected from the health authorities in Spain, Portugal and Galicia. We plan to consider other countries and regions in our future studies and also, of course, an update of the data. In the future, we also plan to study the stability of the possible equilibrium point, the bifurcation of solutions depending on the parameters, and the role of the basic reproduction number.
Our fractional model is novel and in the future we will study the optimal fractional order of differentiation for the study of the COVID-19 epidemic in different contexts. The system has a unique solution for given initial conditions and a detailed mathematical analysis study will be performed. A crucial point is, of course, to determine the optimal fractional order adequate for each process and, in this case, each region.
The results obtained here allow us to conjecture that the strains and genomes of the new coronavirus present in Spain and Portugal are different than those that initially hit China: the proposed mathematical model is good to describe the outbreak that was first identified in Wuhan in December 2019 with ; to describe the spread in Spain and its autonomous community of Galicia, where the virus was first confirmed on January 31 and March 4 2020, respectively, with ; and the COVID-19 situation in Portugal with , where the first cases of COVID-19 were recorded in March 2, 2020. We will continue our research using this and other future models, as well as considering different approaches as the COVID-19 evolves and new insights and conjectures emerge.
Funding
This research was partially supported by the Portuguese Foundation for Science and Technology (FCT) within “Project n. 147 – Controlo Ótimo e Modelação Matemática da Pandemia COVID-19: contributos para uma estratégia sistémica de intervenção em saúde na comunidade”, in the scope of the “RESEARCH 4 COVID-19” call financed by FCT; and by the Instituto de Salud Carlos III, within the Project COV20/00617 “Predicción dinámica de escenarios de afectación por COVID-19 a corto y medio plazo (PREDICO)”, in the scope of the “Fondo COVID” financed by the Ministerio de Ciencia e Innovación of Spain. The work of Ndaïrou, Silva and Torres was also partially supported within project UIDB/04106/2020 (CIDMA); the work of Area and Nieto has been partially supported by the Agencia Estatal de Investigación (AEI) of Spain, cofinanced by the European Fund for Regional Development (FEDER) corresponding to the 2014-2020 multiyear financial framework, project MTM2016-75140-P. Moreover, Ndaïrou is also grateful to the support of FCT through the Ph.D. fellowship PD/BD/150273/2019; Nieto also thanks partial financial support by Xunta de Galicia under grant ED431C 2019/02. Silva is also supported by national funds (OE), through FCT, I.P., in the scope of the framework contract foreseen in the numbers 4, 5 and 6 of the article 23, of the Decree-Law 57/2016, of August 29, changed by Law 57/2017, of July 19.
Acknowledgment
The authors are grateful to the anonymous reviewers for their suggestions and invaluable comments.
References
- [1] R. P. Agarwal, D. Baleanu, J. J. Nieto, D. F. M. Torres, and Y. Zhou. A survey on fuzzy fractional differential and optimal control of nonlocal evolution equations. J. Comput. Appl. Math. 339 (2018), 3–29. doi:10.1016/j.cam.2017.09.039. arXiv:1709.07766
- [2] A. Alshabanat, M. Jleli, S. Kumar, and B. Samet. Generalization of Caputo-Fabrizio fractional derivative and applications to electrical circuits. Front. Phys. 8 (2020), Art. 64, 10 pp. doi:10.3389/fphy.2020.00064.
- [3] I. Area, X. Hervada Vidal, J. J. Nieto, M.J. Purriños Hermida. Determination in Galicia of the required beds at Intensive Care Units. Alexandria Engineering Journal 60 (2021), no. 1, 559–564. doi:10.1016/j.aej.2020.09.034.
- [4] M. Caputo. Linear model of dissipation whose Q is almost frequency independent. II. Geophysical Journal International 13 (1967), no. 5, 529–539. doi:doi:10.1111/j.1365-246x.1967.tb02303.x.
- [5] K. Diethelm, A. D. Freed. The FracPECE subroutine for the numerical solution of differential equations of fractional order. http://citeseerx.ist.psu.edu/viewdoc/download?doi=10.1.1.27.2444&rep=rep1&type=pdf (2002).
- [6] M. Gatto, E. Bertuzzo, L. Mari, S. Miccoli, L. Carraro, R. Casagrandi and A. Rinaldo, Spread and dynamics of the COVID-19 epidemic in Italy: Effects of emergency containment measures, PNAS 117 (2020), no. 19, 10484–10491.
- [7] F. Ge, Y. Q. Chen, and C. Kou. Regional analysis of time-fractional diffusion processes. Springer, Cham, 2018.
- [8] A. N. Gerasimov. A generalization of linear laws of deformation and its application to problems of internal friction. Akad. Nauk SSSR, Prikladnaya Matematika i Mekhanika 12 (1948), 251–259.
- [9] G. Giordano, F. Blanchini, R. Bruno, et al., Modelling the COVID-19 epidemic and implementation of population-wide interventions in Italy, Nature Medicine 26 (2020), 855–860.
- [10] A. Goswami, J. Singh, D. Kumar, and Sushila. An efficient analytical approach for fractional equal width equations describing hydro-magnetic waves in cold plasma. Physica A 524 (2019), 563–575. doi:10.1016/j.physa.2019.04.058.
- [11] R. Hilfer. Applications of Fractional Calculus in Physics. World Scientific Publishing Co., Inc., River Edge, NJ, 2000. doi:10.1142/9789812817747.
- [12] Johns Hopkins Coronavirus Resource Center. Coronavirus COVID-19 Global Cases by the Center for Systems Science and Engineering (CSSE) at Johns Hopkins University (JHU). 2020, May 27, 2020.
- [13] A. A. Kilbas, H. M. Srivastava, and J. J. Trujillo. Theory and Applications of Fractional Differential Equations. Amsterdam: Elsevier Science, 2006.
- [14] S. Kumar, Ali Ahmadian, Ranbir Kumar, D. Kumar, J. Singh, D. Baleanu, and M. Salimi. An efficient numerical method for fractional SIR epidemic model of infectious disease by using Bernstein wavelets. Mathematics 8 (2020), no. 4, Art. 558, 10 pp. doi:10.3390/math8040558.
- [15] D. Kumar, J. Singh, M. Al Qurashi, and D. Baleanu. A new fractional SIRS-SI malaria disease model with application of vaccines, anti-malarial drugs, and spraying. Advances in Difference Equations 2019 (2019), Art. 278, 19 pp. doi:10.1186/s13662-019-2199-9.
- [16] D. Kumar, J. Singh, K. Tanwar, and D. Baleanu. A new fractional exothermic reactions model having constant heat source in porous media with power, exponential and Mittag-Leffler Laws. Int. J. Heat and Mass Transfer 138 (2019), 1222–1227. doi:10.1016/j.ijheatmasstransfer.2019.04.094.
- [17] K. Mohamed, E. Rodríguez-Román, F. Rahmani, H. Zhang, M. Ivanovska, S.A. Makka SA, et al. Borderless collaboration is needed for COVID-19; a disease that knows no borders. Infect. Control Hosp. Epidemiol. 16 (2020), no. 5, 465–470. doi:10.1080/1744666X.2020.1750954.
- [18] N. Moradian et al. The urgent need for integrated science to fight COVID?19 pandemic and beyond. J. Transl. Med. 18 (2020), Art. 205, 7 pp. doi:10.1186/s12967-020-02364-2.
- [19] F. Ndaïrou, I. Area, J. J. Nieto, and D. F. M. Torres. Mathematical Modeling of COVID-19 Transmission Dynamics with a Case Study of Wuhan. Chaos, Solitons & Fractals 135 (2020), Art. 109846, 6 pp. doi:10.1016/j.chaos.2020.109846. arXiv:2004.10885
- [20] K. S. Nisar. Generalized Mittag-Leffler Type Function: Fractional Integrations and Application to Fractional Kinetic Equations. Front. Phys. 8 (2020), Art. 33, 7 pp. doi:10.3389/fphy.2020.00033.
- [21] R. Prasad and R. Yadav. A numerical simulation of Fractional order mathematical modeling of COVID-19 disease in case of Wuhan China. Chaos, Solitons & Fractals 140 (2020), Art. 110124, 17 pp. doi:10.1016/j.chaos.2020.110124.
- [22] S. G. Samko, A. A. Kilbas, and O. I. Marichev. Fractional Integrals and Derivatives. Theory and Applications. Amsterdam: Gordon and Breach, 1993.
- [23] J. Singh, D. Kumar, and D. Baleanu. A new analysis of fractional fish farm model associated with Mittag-Leffler type kernel. Int. J. Biomath. 13 (2020), no. 2, Art. 2050010, 17 pp. doi:0.1142/S1793524520500102.
- [24] V. E. Tarasov. Fractional Dynamics: Application of Fractional Calculus to Dynamics of Particles, Fields and Media. Springer, Heidelberg, Higher Education Press, Beijing, 2010.
- [25] D. Valério and J. Sá da Costa. An introduction to fractional control. London: Institution of Engineering and Technology (IET), 2013.
- [26] T. A. Yıldız. Optimal control problem of a non-integer order waterborne pathogen model in case of environmental stressors. Frontiers in Physics 7 (2019), Art. 95, 10 pp. doi:10.3389/fphy.2019.00095.
- [27] Y. Zhou. Basic Theory of Fractional Differential Equations. Singapore: World Scientific, 2014.