Subaru High-z Exploration of Low-Luminosity Quasars (SHELLQs) XII.
Extended [C II] Structure (Merger or Outflow) in a Red Quasar
Abstract
We present ALMA [C II] 158 m line and far-infrared (FIR) continuum emission observations toward HSC J120505.09000027.9 (J12050000) at with the beam size of (or 4.1 kpc 2.6 kpc), the most distant red quasar known to date. Red quasars are modestly reddened by dust, and are thought to be in rapid transition from an obscured starburst to an unobscured normal quasar, driven by powerful active galactic nucleus (AGN) feedback which blows out a cocoon of interstellar medium (ISM). The FIR continuum of J12050000 is bright, with an estimated luminosity of . The [C II] line emission is extended on scales of kpc, greater than the FIR continuum. The line profiles at the extended regions are complex and broad (FWHM km s-1). Although it is not practical to identify the nature of this extended structure, possible explanations include (i) companion/merging galaxies and (ii) massive AGN-driven outflows. For the case of (i), the companions are modestly star-forming ( yr-1), but are not detected by our Subaru optical observations ( mag). For the case of (ii), our lower-limit to the cold neutral outflow rate is yr-1. The outflow kinetic energy and momentum are both much smaller than what predicted in energy-conserving wind models, suggesting that the AGN feedback in this quasar is not capable of completely suppressing its star formation.
1 Introduction
It has long been considered that mergers or interactions of gas-rich galaxies are the trigger for intense starburst and black hole growth (e.g., Sanders et al., 1988; Hopkins et al., 2006). In this scenario, a substantial fraction of the black hole growth takes place inside a dusty starburst, during which time the system appears as an obscured active galactic nucleus (obscured AGN, Hickox & Alexander, 2018). Subsequent strong AGN feedback, particularly in the form of massive outflows (e.g., Maiolino et al., 2012; Cicone et al., 2014; Carniani et al., 2016; Bischetti et al., 2019; Fluetsch et al., 2019; Lutz et al., 2020), is expected to clear gas and dust from the galaxy, halting further star formation and black hole growth. This feedback is also invoked in galaxy evolution models to shape the galaxy mass function and ultimately black hole-host galaxy co-evolution relations (Kormendy & Ho, 2013).
High-redshift quasars are a unique laboratory to test or refine our understanding of the early supermassive black hole (SMBH) and galaxy formation (e.g., Inayoshi et al., 2019). To date, quasars with absolute ultraviolet (UV) magnitude are known at , most of which were discovered by wide-field optical and near-infrared surveys (e.g., Fan et al., 2001; Bañados et al., 2016; Matsuoka et al., 2016, 2018a, 2018b). Sub/millimeter observations have revealed that their host galaxies often possess copious amounts of dust () and gas () with high star formation rates (SFR) of – yr-1 (e.g., Wang et al., 2013; Venemans et al., 2016, 2017; Decarli et al., 2018), while smaller values are found in lower luminosity quasars (e.g., Willott et al., 2013, 2015, 2017; Izumi et al., 2018, 2019).
As a galaxy-overdensity increases the likelihood of interactions and mergers of galaxies, deep submillimeter searches for companion star-forming galaxies have been performed toward quasars mainly by using the Atacama Large Millimeter/submillimeter Array (ALMA). Such efforts tried to detect C+ 157.74 (hereafter [C II] 158 ) line and/or rest-frame far-infrared (FIR) continuum emission from companions. Indeed, some works found companions (e.g., Decarli et al., 2017; Trakhtenbrot et al., 2017; Willott et al., 2017; Neeleman et al., 2019), or very close likely-merging galaxies (Decarli et al., 2019; Venemans et al., 2019; Bañados et al., 2019), to the optically-luminous ( mag) quasars, which would support the triggering of quasars by gas-rich major mergers. Contrary to this, no overdensity of submillimeter continuum emitters was reported for the case of optically less-luminous ( mag) quasars (Izumi et al., 2019), implying that rather secular processes (e.g., Shirakata et al., 2019; Marshall et al., 2020) may also be capable of triggering quasars.
As massive quiescent galaxies already exist at (e.g., Straatman et al., 2014; Estrada-Carpenter et al., 2020), we also anticipate that AGN feedback is already taking place at higher redshift. An outstanding case is the quasar J11485251, in which a massive AGN-driven outflow (outflow rate yr-1) extending to kpc is detected in the [C II] 158 emission line (Maiolino et al., 2012; Cicone et al., 2015). However, there is no other single quasar in which [C II] outflow has been reported, likely due to inadequate sensitivity. To overcome the sensitivity issue, Bischetti et al. (2019) stacked the [C II] cubes of 48 quasars at , and reported a successful detection of a broad [C II] wing: the inferred outflow rate ( yr-1) is only modest, but may be enough to quench star formation in the central regions of these galaxies. On the other hand, Novak et al. (2020) performed another stacking analysis of [C II] cubes of 27 quasars, revealing no clear evidence of [C II] outflows (see also Decarli et al., 2018). Hence the situation is quite controversial these days. In either case, however, previous studies are biased toward the unobscured (= blue) quasar population.
In this regard, one intriguing population of quasars, whose host galaxies have not been studied at all at , are the so-called red quasars. Unlike the unobscured population, they are reddened () by dust at rest-UV (e.g., Richards et al., 2003; Glikman et al., 2004, 2018; Ross et al., 2015). Red quasars typically have high Eddington ratios and are accompanied by broad absorption line (BAL) features indicative of nuclear fast outflows (e.g., Richards et al., 2003; Urrutia et al., 2009). At lower redshifts like , red quasars often host galaxy-scale outflows at various gas phases (e.g., Brusa et al., 2018; Perrotta et al., 2019; Zakamska et al., 2019). In addition, high resolution imaging observations revealed that red quasars tend to be hosted by major mergers (e.g., Urrutia et al., 2008; Glikman et al., 2015). These properties support an evolutionary scenario, in which red quasars are emerging from the merger-induced dusty starburst phase likely by blowing out surrounding medium with powerful winds (e.g., Farrah et al., 2012). However, as no red quasar has been identified at primarily due to their apparent faintness in the rest-UV, it is not clear if this picture also holds in the first generation of quasars.
1.1 Our target: J12050000
Very recently, we successfully discovered two red quasars at (Kato et al., 2020) by matching the deep sample of quasars optically-selected from the Subaru Hyper Suprime-Cam (HSC) wide-field survey (Aihara et al., 2018) with mid-infrared photometric data obtained by the Wide-field Infrared Survey Explorer (WISE). In this work, we present our ALMA observations of [C II] 158 m line and underlying FIR continuum emission of one of these two sources, J120505.09000027.9 (hereafter 12050000; Figure 1 top-right) at , by far the highest redshift red quasar known to date (Kato et al., 2020) 111Mazzucchelli et al. (2017) performed submm observations toward this quasar by using NOEMA interferometer, but did not detect [C II] emission as the line was out of their frequency coverage.. Without correcting for dust extinction, J12050000 has a rest-frame UV magnitude of mag (Matsuoka et al., 2016). But once the extinction ( mag) is accounted for, the quasar has mag, with an Eddington ratio of 0.22 (Kato et al., 2020): here the reddening was estimated by fitting a typical quasar template to the broad band (optical to mid-IR) spectral energy distribution with the Small Magellanic Cloud (SMC) dust extinction law. J12050000 hosts prominent N V and C IV BALs as well, confirming the existence of nuclear outflows (Onoue et al., 2019).
In the following parts, we describe ALMA observations in § 2, extended nature of [C II] emission in § 3, and possible origins of the extended structures in § 4. We provide our conclusions in § 5. This is the twelfth in a series of publications presenting the results from our high redshift quasar survey, the Subaru High-z Exploration of Low-Luminosity Quasars (SHELLQs). Throughout this work, we adopt the standard cosmology with = 70 km s-1 Mpc-1, , and .
2 ALMA Observations
We observed the redshifted [C II] line and FIR continuum emission of J12050000 in Band 6 on 2020 February 26 (ID = 2019.1.00074.S, PI: T. Izumi), with 41 antennas. Our observations were conducted in a single pointing with a diameter field of view. The baseline length ranged from 15.1 m to 783.5 m, resulting in a maximum recoverable scale of . J12560547 was observed as a flux and bandpass calibrator and J12170029 was monitored to calibrate the complex gain. The total on-source time was 71 minutes.
The data were processed using CASA version 5.6 (https://casa.nrao.edu).
All images were reconstructed with the tclean task using natural weighting to maximize the sensitivity.
We averaged several channels to obtain a velocity resolution of 100 km s-1,
which resulted in a 1 channel sensitivity of 0.13 mJy beam-1 (beam size = , P.A. = ).
Note that we first cleaned the line cube including the continuum emission down to 3 level to determine the line position.
With this knowledge, we identified the channels free of line emission.
All these line-free channels were integrated to generate a continuum map (1 = 17.6 Jy beam-1),
which was subtracted in the plane by using the first-order polynomial before making the final line cube.
Throughout the paper, only statistical errors are displayed unless mentioned otherwise
(absolute flux uncertainty ; ALMA Cycle 7 Proposer’s Guide).
As the [C II] emission turned out to fall at around the edge of one of the spectral windows,
we display spectral data from two contiguous windows when necessary.
We also used the MIRIAD software (Sault et al., 1995) for some of the analyses in this paper.
3 Result: Extended [C II] emission
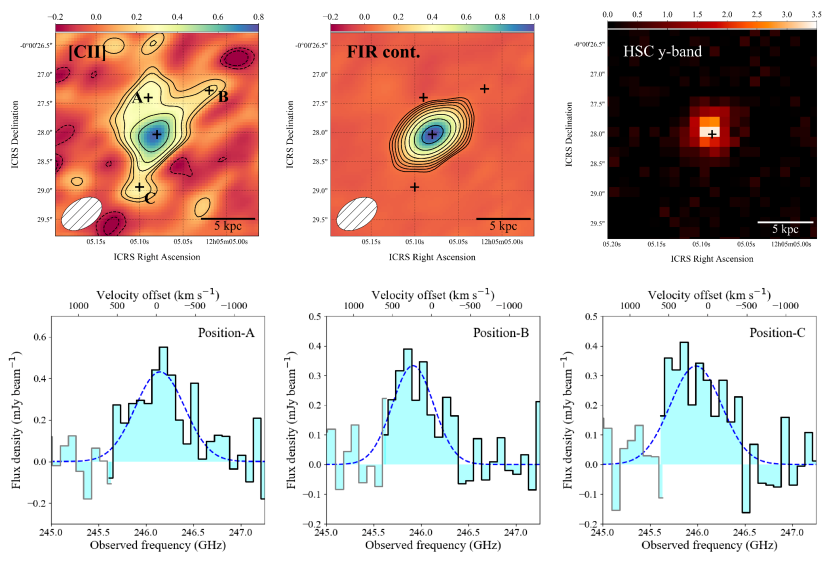
The top panels of Figure 1 show the distributions of the velocity-integrated [C II] 158 line emission and FIR continuum emission. The optical -band image of J12050000 taken with the Subaru HSC is also shown for a reference. Figure 2 shows the [C II] channel maps revealing the global velocity structure. We describe details of this emission in the following. The relevant physical properties are summarized in Table 1.
3.1 FIR continuum properties
| Area-integrated [C II] 158 m Line Emission | |||
|---|---|---|---|
| Single Gaussian | Double Gaussian | ||
| Core | Wing | ||
| 6.7230 0.0003 | 6.7224 0.0003 | 6.7336 0.0009 | |
| FWHM[CII] (km s-1) | 536 26 | 442 33 | 232 72 |
| (Jy km s-1) | 1.69 0.07 | 1.49 0.10 | 0.21 0.07 |
| (108 ) | 18.7 0.8 | 16.5 1.0 | 2.4 0.8 |
| SFR[CII] ( yr-1) | 122 5 | 108 7 | 16 6 |
| Size (beam-convolved) | (1″.55 0″.30) (1″.03 0″.17) (8.3 1.6) kpc (5.5 0.9) kpc | ||
| Size (beam-deconvolved) | (1″.43 0″.36) (0″.77 0″.33) (7.7 1.9) kpc (4.1 1.8) kpc | ||
| [C II] 158 m Line Emission at Selected Positions (Figure 1) | |||
| A | B | C | |
| Line center (km s-1) | 49 54 | 235 61 | 151 69 |
| FWHM[CII] (km s-1) | 746 124 | 625 145 | 775 162 |
| (Jy beam-1 km s-1) | 0.34 0.05 | 0.22 0.04 | 0.27 0.05 |
| (108 ) | 3.8 0.6 | 2.5 0.5 | 3.0 0.6 |
| Continuum Emission ( = 47 K, = 1.6, = 0.4 cm2 g-1) | |||
| (mJy) | 1.17 0.04 | ||
| (1012 ) | 2.7 0.1 | ||
| (1012 ) | 3.9 0.1 | ||
| SFRTIR ( yr-1) | 575 21 | ||
| (108 ) | 2.0 0.1 | ||
| Size (beam-convolved) | (0″.79 0″.02) (0″.52 0″.01) (4.3 0.1) kpc (2.8 0.1) kpc | ||
| Size (beam-deconvolved) | (0″.25 0″.06) (0″.17 0″.09) (1.3 0.3) kpc (0.9 0.5) kpc | ||
Note. — The SFR[CII] for the wing component is appropriate if this reflects a star-forming companion galaxy.
The continuum emission ( mm) comes
from the central (see Table 1 for detailed sizes measured with the CASA task imfit).
The continuum peaks at (RA, Dec)ICRS = (12h05m05s.080, 000028.04),
which is consistent with the optical quasar position.
To include all extended emission, we measure the continuum flux density
with a 2 diameter circular aperture placed at this peak position,
resulting in mJy.
We determine the FIR luminosity (; 42.5–122.5 ) and the total IR luminosity (; 8–1000 ) by assuming an optically-thin modified black body with dust temperature K and emissivity index , values which are characteristic of high-redshift luminous quasars (Beelen et al., 2006) and are commonly adopted in the literature (e.g., Izumi et al., 2018). After correcting for the contrast and the additional heating effects of the cosmic microwave background radiation (da Cunha et al., 2013), we obtain and , respectively. Note that there is actually a wide variety in from source to source (Venemans et al., 2018). If we adopt K, typical for local star-forming galaxies (U et al., 2012), these values become smaller.
With this ( K) and the calibration of Murphy et al. (2011), we found a SFR of yr-1. However, this should be regarded as an upper limit, as we have assumed that the FIR emission is due entirely to star formation, even though there may be a significant contribution from the AGN itself (e.g., Symeonidis, 2017). Similarly, by adopting a rest-frame mass absorption coefficient of cm2 g-1 (Alton et al., 2004), we find a dust mass of .
3.2 [C II] line emission
Figure 1 demonstrates that the [C II] emission is spatially more extended than the FIR continuum emission, extending to (5.4 kpc) 222Although the distribution is complex, we fit a 2-dimensional elliptical Gaussian to it (CASA task imfit; Table 1). The estimated beam-deconvolved size is kpc2, which is much larger than that of the FIR continuum., and has a complex morphology. The extended structure that is directly connected to the continuum-bright core region is real, as we see positive signals from several contiguous velocity channels measured there (Figure 1; positions A–C), over [500, 500] km s-1 relative to the systemic velocity (defined in the following).
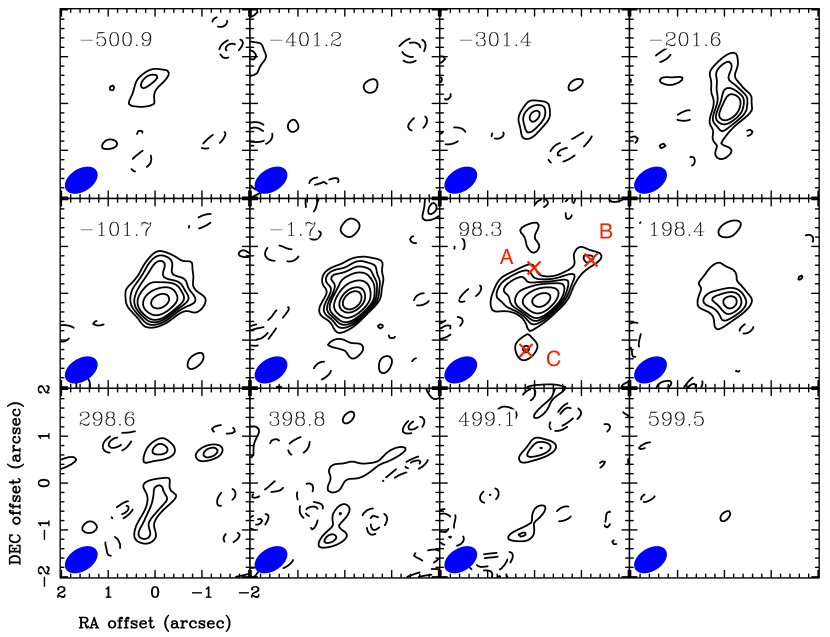
Figure 3 shows an area-integrated spectrum measured over the region within radius of the nucleus in which [C II] integrated-intensity is detected at more than . We first fit the spectrum with a single Gaussian function (Figure 3a), but the observed profile clearly deviates from this model; we found /d.o.f. = 37.6/22 (estimated over 1200 km s-1 range) for this single Gaussian fit. A notable deviation can be found at a positive velocity channels of km s-1. As the spatially extended regions (Figure 2) have such high positive velocities, they must contribute to this excess wing of the area-integrated spectrum. We then performed a double Gaussian fit (Figure 3b) to account for that excess. This works fairly well with a returned /d.o.f. = 21.1/19. With this difference in , this model is preferred at confidence. Note that we also see extended [C II] emission in negative velocity channels (Figure 2), but deeper observations are required to confirm its existence (or another wing at the bluer side of the area-integrated spectrum).

We naively attribute the core component in the double Gaussian fit to the host galaxy itself, hence providing its systemic redshift as . With respect to this , Mg II emission () (Onoue et al., 2019) is blueshifted by km s-1. In addition, an absorption feature of a higher ionization line C IV of J12050000 is further blueshifted by km s-1 relative to Mg II (Onoue et al., 2019), hence C IV is blueshifted up to km s-1 relative to . These clearly manifest the existence of very fast nuclear outflows in this red quasar.
With the [C II] core flux and the 1.2 mm continuum flux density (Table 1), we also measure a rest-frame [C II] equivalent width as . This is roughly half of the mean of local star-forming galaxies ( , e.g., Díaz-Santos et al., 2013). In optically low-luminosity quasars (e.g., HSC quasars with mag) is usually , but optically luminous quasars tend to show (Izumi et al., 2019), the latter of which is consistent with the intrinsically luminous nature of J12050000 ( mag after extinction correction, Kato et al., 2020).
Lastly, we estimate SFR from the [C II] luminosity of this component (Table 1), giving yr-1 with the De Looze et al. (2011) calibration, which has dex dispersion. Again, this would be an upper limit, as some of the [C II] emission may be due to the quasar itself (i.e., narrow line region). Indeed, shows a marginal correlation with AGN power (Izumi et al., 2019).
3.3 Comparison to the other quasars
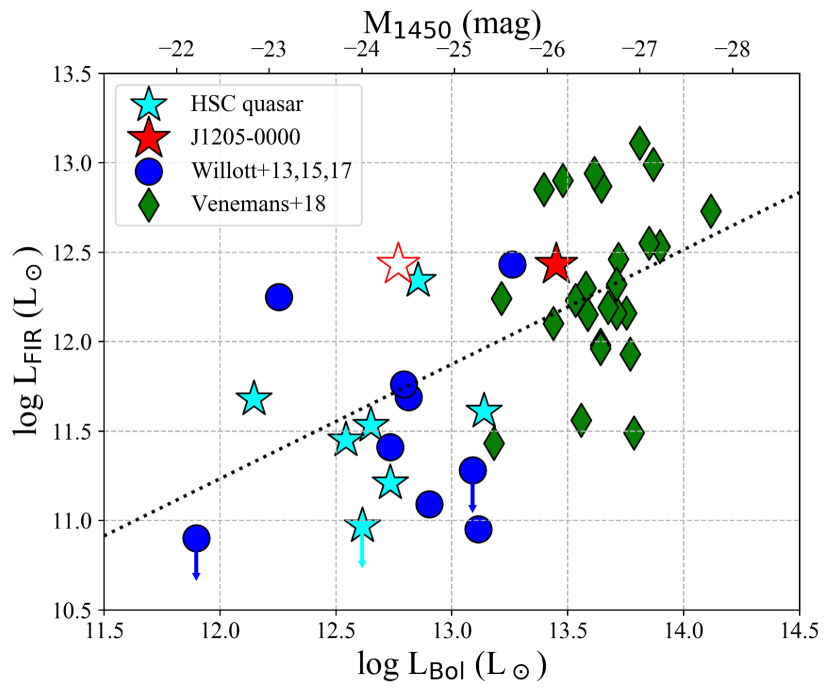
We briefly compare the quasar nuclear bolometric luminosity () and of a sample of quasars in Figure 4. Here we adopted the bolometric correction factor 4.4 from 1450 Å luminosity (Richards et al., 2006) to compute . The same assumptions presented in § 3.1 are made to derive . Optically luminous quasar data is compiled from a recent survey work of Venemans et al. (2018), whereas we collected the data of relatively low-luminosity quasars from Willott et al. (2013, 2015, 2017) and Izumi et al. (2018, 2019).
Although there is admittedly a wide spread in for a given , J12050000 shows a characteristic to the optically luminous quasars once its dust extinction is corrected. If we assume that a quasar-phase happens during a longer timescale starburst-phase (e.g., Davies et al., 2007; Hopkins et al., 2008; Bergvall et al., 2016), there was once a growing obscured AGN phase in J12050000 which was embedded in this starburst host galaxy.
At the lower quasar luminosity regime, i.e., , there are only two quasars (out of twelve) having comparable to J12050000, namely J22390207 (Izumi et al., 2019) and VIMOS2911 (Willott et al., 2017). J22390207 is likely to have a close [C II] companion galaxy, which may have triggered its intense starburst (Izumi et al., 2019). VIMOS2911, which was originally discovered by Kashikawa et al. (2015), seems to be an outlier in this plane as no companion was reported (Willott et al., 2017), as well as its narrow [C II] line profile (FWHM = 264 km s-1) indicates an absence of a merger-like active event. The remaining low-luminosity quasars all show (some show as low as ), which is clearly not the case of the optically luminous quasars.
Indeed, we found a positive correlation between and , after excluding the objects with upper limits on , as
| (1) |
A Spearman correlation coefficient for this – data is 0.56 (-value = ). Although it is still a marginal correlation, this implies that a black hole and its host galaxy are actually co-evolving at this high redshift. In addition, if we assume a common star-formation efficiency over the whole quasars used here, this correlation suggests that an optically luminous quasar tends to form in a gas richer galaxy. Note that Venemans et al. (2018) did not find a significant correlation between these two luminosities, likely because they only studied optically luminous quasars.
4 Nature of the extended [C II] emission
We now turn to the physical origin of the extended [C II] structure, which also contributes to the [C II] wing in the area-integrated spectrum. Major possibilities include companion/merging galaxy and cold outflow. However, as detailed later, it is not possible to distinguish these two scenarios with the current dataset. Thus, we discuss both of these scenarios and provide relevant properties, respectively in the following. Note that other key properties including the early co-evolution of this quasar will be discussed in our forthcoming paper, along with those of the other HSC quasars observed in our ALMA Cycle 7 program (T. Izumi et al. in preparation).
4.1 Companion/merging galaxies?
Major mergers of gas-rich galaxies has been considered to be a promising driver of quasar activity (e.g., Sanders et al., 1988; Di Matteo et al., 2005; Hopkins et al., 2006). High resolution and/or high sensitivity observations at the low redshift universe indeed show an enhanced AGN fraction in major merger systems (e.g., Ellison et al., 2011; Silverman et al., 2011; Goulding et al., 2018; Koss et al., 2018). It is also noteworthy that (intrinsically luminous) red quasars tend to be hosted by major merger systems (e.g., Urrutia et al., 2008; Glikman et al., 2015). In this context, it is intriguing that recent sensitive ALMA observations of rest-FIR continuum and/or [C II] emission started to uncover star-forming companion galaxies to some luminous quasars (e.g., Wang et al., 2011; Trakhtenbrot et al., 2017; Decarli et al., 2017; Willott et al., 2017; Neeleman et al., 2019), with some of these companions very close to, or even merging with, the main quasar (Decarli et al., 2019; Venemans et al., 2019; Bañados et al., 2019; Venemans et al., 2020).
We found that the [C II] spatial distribution of J12050000 including the channel maps (Figures 1 and 2) well resembles that of J13420928 at (Bañados et al., 2019), which is considered to be an ongoing merger system. Therefore it is plausible that the extended [C II] structure of J12050000 is due to very close companion or merging galaxies. As the [C II] emission extends toward multiple directions, there could be corresponding multiple mergers in J12050000. This picture fits into an evolutionary scenario in which a red quasar corresponds to an emergent phase from a merger-induced dusty starburst. A high fraction of merger event in red quasar-host galaxies (e.g., Urrutia et al., 2008; Glikman et al., 2015) measured at lower redshifts also supports this scenario. Although we need higher resolution and sensitivity [C II] data to better understand the dynamical nature of this system, J12050000 has a great potential to be an ideal laboratory to study physical properties of merging galaxies that would eventually evolve into an unobscured luminous quasar.
Note that we do not find any companion in our optical - and -band maps ( resolution) with limiting magnitudes of (, ) = (25.1, 24.4), taken by HSC (Matsuoka et al., 2016, see also Figure 1). Although previous ALMA observations actually uncovered optically-unidentified [C II] or FIR continuum emitters around some quasars (e.g., Decarli et al., 2017; Mazzucchelli et al., 2019), the situation appears to be different in J12050000. Those known companions are typically bright at FIR with SFRIR of yr-1. Hence their stellar emission would suffer severe dust extinction, which can make them optically unidentifiable (Mazzucchelli et al., 2019). Contrary to this, the FIR continuum emission of J12050000 is undetected () at the regions with the spatially extended [C II] emission (Figure 1). An inferred upper limit on SFRIR by assuming a modest of 35 K (typical value of local star-forming galaxies, U et al., 2012) is only yr-1. Hence a corresponding dust extinction is not so significant for the potential companions of J12050000. Rather, an insufficient optical survey depth would simply matter. If we suppose Lyman break galaxies (LBGs) are responsible for the potential companions, our -band observation ( mag) only probes the bright-end of a UV luminosity function of LBGs at (Ono et al., 2018). In this regard, much deeper data from future facilities such as James Webb Space Telescope (JWST) is needed to conclusively identify the companions.
4.2 Cold neutral outflows?
The extended and complex gas morphology of J12050000 also reminds us that of J11485251, the only other known quasar with prominent [C II] outflows. While J11485251 is brighter than J12050000 at UV and the observed [C II] extent is as large as kpc (Cicone et al., 2015), this hints at the existence of cold outflows also in J12050000. In addition, the off-center [C II] spectra are all broad (FWHM km s-1). These are even broader than that of the core component, as well as than those of known companion galaxies of quasars ( km s-1, e.g., Neeleman et al., 2019), which would prefer the outflow scenario. Thus, we discuss potential outflow properties hereafter by assuming that the extended structure is formed fully due to cold outflows. Given that the (potential) outflows are both spatially and spectrally resolved, we can measure the dynamical timescales of each [C II] blob defined in Figure 1 (A, B, C). With these timescales, we follow the standard prescription (e.g., Bischetti et al., 2019) to estimate outflow rate, kinetic power, and momentum (Table 2).
We define the outflow rate as , where is outflowing mass, is outflow velocity, and is the distance from the continuum peak. For , we adopt , which combines the shift of the velocity centroid from the systemic and the FWHM of each blob. is directly measured from Figure 1 as 3.5, 6.4, and 5.1 kpc for the blobs A–C, respectively. Note that is projected along the line of sight, and is projected in the plane of the sky, thus, should be corrected by a factor , where is the angle between our line-of-sight and the outflow direction of each blob. While we do not know a priori, the average of this factor over all angles is unity.
We calculate the outflow mass in neutral hydrogen gas as
| (2) |
where is the C+ fraction per H atom, is the excitation temperature in K, is the gas density, and is the line critical density ( cm-3). As the actual gas density is unknown, we here assume the high density limit () to provide a lower limit on . The factor 0.7 in the first parenthesis indicates a typical fraction of [C II] arising from photodissociation regions (PDRs; i.e., the remaining 30% originates from H II regions). For consistency with previous works (e.g., Maiolino et al., 2012; Cicone et al., 2015), we adopt and K, which are characteristic to PDRs (e.g., Hollenbach & Tielens, 1997), but varying K changes the inferred by only .
| Blob ID | (km s-1) | (108 ) | (107 yr) | ( yr-1) | (108 ) | (%) |
|---|---|---|---|---|---|---|
| A | 422 82 | 3.8 0.6 | 0.8 0.2 | 45 11 | 6.6 2.4 | 4.3 1.4 |
| B | 547 95 | 2.4 0.5 | 1.1 0.2 | 21 5 | 5.1 1.8 | 2.6 0.8 |
| C | 538 106 | 2.9 0.5 | 0.9 0.2 | 31 8 | 7.5 2.9 | 3.9 1.3 |
Interestingly, the (projected) flow times of the blobs A–C are all clustered around yr, which suggests that these outflows were launched at roughly the same time. Summing over these three blobs, the total atomic outflow mass and outflow rate are and yr-1, respectively. The summed outflow rate is greater than a (current) BH accretion rate of J12050000 ( yr-1), which is estimated from the quasar bolometric luminosity ( erg s-1, Kato et al., 2020) with a canonical radiative efficiency of .
Note that, however, our (possible) outflow rate only refers to the neutral atomic component, while a significant fraction of the outflowing gas would be in a molecular phase. Indeed, Fluetsch et al. (2019) found in local galaxies that the total mass-flow rate is dex larger than the atom-only value. As our computation provided a lower limit on , and we measured rates only at the three selected positions, J12050000 is likely to have a (possible) total outflow rate of yr-1. This is factor greater than the [C II]-based SFR, and it is not typical for star formation to drive a wind at a much greater rate than the SFR (e.g., Cicone et al., 2014). We therefore naively suppose that the quasar itself powers this outflow. We emphasize that J12050000 is the highest redshift red quasar known to date. Therefore, it is intriguing that the existence of outflows on the scale of the host galaxy is hinted at here, suggesting that the surrounding interstellar medium is actively being blown out, as predicted in SMBH/galaxy evolution scenarios (e.g., Hopkins et al., 2006).
We found that the peak flux density of the red wing is of that of the core component, while Maiolino et al. (2012) found a broad-to-narrow peak flux density ratio of for the case of J11485251. The (possible) outflow velocity is much smaller in J12050000 than J11485251, but we may be limited by the sensitivity of our measurement to detect faster components. Interestingly, a similar line profile to J12050000 is seen in cold outflows of lower redshift obscured quasars (e.g., Brusa et al., 2018; Fan et al., 2018). Hence suppose for example that the high-peak wing is due to a dense gas that once obscured the nucleus in a shell-like form. It had a high wind velocity when it was launched, but is now decelerated after traveling a long way from the center. As time progresses and the quasar becomes less reddened, the outflow will continue to slow down. It would be hard to identify such a low-velocity component as an outflow unless it is spatially resolved. Indeed, spatially extended but low-velocity ( km s-1) structures are also found in J11485251 (Cicone et al., 2015).
If the extended structures were formed genuinely due to outflows, both the outflow kinetic power
| (3) |
and the momentum load
| (4) |
are significantly smaller (Table 2) than what energy-conserving AGN feedback models typically predict (, , e.g., King & Pounds, 2015). The small values found here are comparable to those of J11485251 (Cicone et al., 2015), implying that these may be typical among both red and blue quasars. Hence, the nuclear winds contribute only a small fraction of the galaxy-scale feedback if we apply this energy-conserving feedback scenario. This indicates that, without additional feedback from star formation, the AGN feedback is not able to completely suppress star formation over the entire host galaxy.
5 Summary
We have presented ALMA observations of [C II] line and underlying FIR continuum emission of the highest redshift red quasar known to date, J12050000 at , which was discovered in our deep optical imaging survey with the Subaru Hyper Suprime-Cam (HSC). Although it appears as a low-luminosity quasar ( mag), its intrinsic luminosity is as high as mag once its dust extinction is corrected. A red quasar population has been considered as an emergent phase from a dusty starburst by blowing out its surrounding dense obscuring medium. The main findings of this paper are summarized as follows.
-
1.
We successfully detected the [C II] line and FIR continuum emission. The [C II] emission is spatially more extended (over kpc scale) than the continuum emission. The area-integrated [C II] line profile is complex and is characterized by two components, i.e., a main core component that is attributed to the host galaxy itself and an additional red wing component. Summing up these two, we found the line luminosity of . The FIR continuum emission is also bright as ( K, ).
-
2.
The SFR inferred from the continuum luminosity and [C II] core luminosity is yr-1 and yr-1, respectively. Note that, however, these would be regarded as upper limits as we neglect a contamination from this intrinsically luminous quasar itself.
-
3.
Based on the [C II] equivalent width and – relation, we found that J12050000 shows consistent properties to optically luminous quasars once its dust extinction is corrected. We also found a marginal positive correlation between and , implying a black hole and its host galaxy are co-evolving.
-
4.
Although it is not practical to identify the physical origin of the spatially extended [C II] emission with the current dataset, possible explanations include (i) companion/merging galaxies and (ii) cold outflows. Both of these appear fascinating as they well fit into the merger-induced galaxy evolution scenario.
-
5.
If the extended structure is due to (multiple) companion/merging galaxies, this indicates that this red quasar indeed emerges with a merger event. While no counterpart was identified in our optical imaging survey with Subaru/HSC (e.g., -band 5 limiting magnitude = 24.4 mag), dust extinction would not be the prime cause of this given the non-detection of FIR continuum emission. Rather, we may still not be sensitive enough to detect normal galaxies like LBGs at that high redshift. Deeper imaging observations by future facilities like JWST are necessary to search for the possible companion/merging galaxies.
-
6.
If the extended structure is due to cold outflows, we can argue that this red quasar is in a key transition phase from a dusty starburst by blowing our its surrounding medium. On the other hand, our lower-limit on the cold neutral outflow is only yr-1, and we found that the outflow kinetic energy and momentum are both much smaller than what predicted in energy-conserving wind models. This suggests that the AGN feedback in this quasar, if genuinely exists, is not sufficient to suppress star-formation of the host galaxy.
In this work, we revealed some intriguing host galaxy properties of this red quasar. This red quasar was originally identified by matching our low-luminosity quasar sample and the mid-IR photometric data obtained by WISE (Kato et al., 2020). As the HSC survey has still been on-going and our sample of low-luminosity quasars has been growing, we would be able to find other red quasars at this high redshift. They should be a good sample for extensive follow-up studies by, e.g., ALMA and JWST, to better understand the early black hole growth and co-evolution.
References
- Aihara et al. (2018) Aihara, H., Arimoto, N., Armstrong, R., et al. 2018, PASJ, 70, S4, doi: 10.1093/pasj/psx066
- Alton et al. (2004) Alton, P. B., Xilouris, E. M., Misiriotis, A., Dasyra, K. M., & Dumke, M. 2004, A&A, 425, 109, doi: 10.1051/0004-6361:20040438
- Astropy Collaboration et al. (2013) Astropy Collaboration, Robitaille, T. P., Tollerud, E. J., et al. 2013, A&A, 558, A33, doi: 10.1051/0004-6361/201322068
- Astropy Collaboration et al. (2018) Astropy Collaboration, Price-Whelan, A. M., SipHocz, B. M., et al. 2018, aj, 156, 123, doi: 10.3847/1538-3881/aabc4f
- Bañados et al. (2016) Bañados, E., Venemans, B. P., Decarli, R., et al. 2016, ApJS, 227, 11, doi: 10.3847/0067-0049/227/1/11
- Bañados et al. (2019) Bañados, E., Novak, M., Neeleman, M., et al. 2019, ApJ, 881, L23, doi: 10.3847/2041-8213/ab3659
- Beelen et al. (2006) Beelen, A., Cox, P., Benford, D. J., et al. 2006, ApJ, 642, 694, doi: 10.1086/500636
- Bergvall et al. (2016) Bergvall, N., Marquart, T., Way, M. J., et al. 2016, A&A, 587, A72, doi: 10.1051/0004-6361/201525692
- Bischetti et al. (2019) Bischetti, M., Maiolino, R., Carniani, S., et al. 2019, A&A, 630, A59, doi: 10.1051/0004-6361/201833557
- Brusa et al. (2018) Brusa, M., Cresci, G., Daddi, E., et al. 2018, A&A, 612, A29, doi: 10.1051/0004-6361/201731641
- Carniani et al. (2016) Carniani, S., Marconi, A., Maiolino, R., et al. 2016, A&A, 591, A28, doi: 10.1051/0004-6361/201528037
- Cicone et al. (2014) Cicone, C., Maiolino, R., Sturm, E., et al. 2014, A&A, 562, A21, doi: 10.1051/0004-6361/201322464
- Cicone et al. (2015) Cicone, C., Maiolino, R., Gallerani, S., et al. 2015, A&A, 574, A14, doi: 10.1051/0004-6361/201424980
- da Cunha et al. (2013) da Cunha, E., Groves, B., Walter, F., et al. 2013, ApJ, 766, 13, doi: 10.1088/0004-637X/766/1/13
- Davies et al. (2007) Davies, R. I., Müller Sánchez, F., Genzel, R., et al. 2007, ApJ, 671, 1388, doi: 10.1086/523032
- De Looze et al. (2011) De Looze, I., Baes, M., Bendo, G. J., Cortese, L., & Fritz, J. 2011, MNRAS, 416, 2712, doi: 10.1111/j.1365-2966.2011.19223.x
- Decarli et al. (2017) Decarli, R., Walter, F., Venemans, B. P., et al. 2017, Nature, 545, 457, doi: 10.1038/nature22358
- Decarli et al. (2018) —. 2018, ApJ, 854, 97, doi: 10.3847/1538-4357/aaa5aa
- Decarli et al. (2019) Decarli, R., Dotti, M., Bañados, E., et al. 2019, ApJ, 880, 157, doi: 10.3847/1538-4357/ab297f
- Di Matteo et al. (2005) Di Matteo, T., Springel, V., & Hernquist, L. 2005, Nature, 433, 604, doi: 10.1038/nature03335
- Díaz-Santos et al. (2013) Díaz-Santos, T., Armus, L., Charmandaris, V., et al. 2013, ApJ, 774, 68, doi: 10.1088/0004-637X/774/1/68
- Ellison et al. (2011) Ellison, S. L., Patton, D. R., Mendel, J. T., & Scudder, J. M. 2011, MNRAS, 418, 2043, doi: 10.1111/j.1365-2966.2011.19624.x
- Estrada-Carpenter et al. (2020) Estrada-Carpenter, V., Papovich, C., Momcheva, I., et al. 2020, ApJ, 898, 171, doi: 10.3847/1538-4357/aba004
- Fan et al. (2018) Fan, L., Knudsen, K. K., Fogasy, J., & Drouart, G. 2018, ApJ, 856, L5, doi: 10.3847/2041-8213/aab496
- Fan et al. (2001) Fan, X., Narayanan, V. K., Lupton, R. H., et al. 2001, AJ, 122, 2833, doi: 10.1086/324111
- Farrah et al. (2012) Farrah, D., Urrutia, T., Lacy, M., et al. 2012, ApJ, 745, 178, doi: 10.1088/0004-637X/745/2/178
- Fluetsch et al. (2019) Fluetsch, A., Maiolino, R., Carniani, S., et al. 2019, MNRAS, 483, 4586, doi: 10.1093/mnras/sty3449
- Glikman et al. (2004) Glikman, E., Gregg, M. D., Lacy, M., et al. 2004, ApJ, 607, 60, doi: 10.1086/383305
- Glikman et al. (2015) Glikman, E., Simmons, B., Mailly, M., et al. 2015, ApJ, 806, 218, doi: 10.1088/0004-637X/806/2/218
- Glikman et al. (2018) Glikman, E., Lacy, M., LaMassa, S., et al. 2018, ApJ, 861, 37, doi: 10.3847/1538-4357/aac5d8
- Goulding et al. (2018) Goulding, A. D., Greene, J. E., Bezanson, R., et al. 2018, PASJ, 70, S37, doi: 10.1093/pasj/psx135
- Hickox & Alexander (2018) Hickox, R. C., & Alexander, D. M. 2018, ARA&A, 56, 625, doi: 10.1146/annurev-astro-081817-051803
- Hollenbach & Tielens (1997) Hollenbach, D. J., & Tielens, A. G. G. M. 1997, ARA&A, 35, 179, doi: 10.1146/annurev.astro.35.1.179
- Hopkins et al. (2006) Hopkins, P. F., Hernquist, L., Cox, T. J., et al. 2006, ApJS, 163, 1, doi: 10.1086/499298
- Hopkins et al. (2008) Hopkins, P. F., Hernquist, L., Cox, T. J., & Kereš, D. 2008, ApJS, 175, 356, doi: 10.1086/524362
- Inayoshi et al. (2019) Inayoshi, K., Visbal, E., & Haiman, Z. 2019, arXiv e-prints, arXiv:1911.05791. https://arxiv.org/abs/1911.05791
- Izumi et al. (2018) Izumi, T., Onoue, M., Shirakata, H., et al. 2018, PASJ, 70, 36, doi: 10.1093/pasj/psy026
- Izumi et al. (2019) Izumi, T., Onoue, M., Matsuoka, Y., et al. 2019, PASJ, 71, 111, doi: 10.1093/pasj/psz096
- Kashikawa et al. (2015) Kashikawa, N., Ishizaki, Y., Willott, C. J., et al. 2015, ApJ, 798, 28, doi: 10.1088/0004-637X/798/1/28
- Kato et al. (2020) Kato, N., Matsuoka, Y., Onoue, M., et al. 2020, PASJ, doi: 10.1093/pasj/psaa074
- King & Pounds (2015) King, A., & Pounds, K. 2015, ARA&A, 53, 115, doi: 10.1146/annurev-astro-082214-122316
- Kormendy & Ho (2013) Kormendy, J., & Ho, L. C. 2013, ARA&A, 51, 511, doi: 10.1146/annurev-astro-082708-101811
- Koss et al. (2018) Koss, M. J., Blecha, L., Bernhard, P., et al. 2018, Nature, 563, 214, doi: 10.1038/s41586-018-0652-7
- Lutz et al. (2020) Lutz, D., Sturm, E., Janssen, A., et al. 2020, A&A, 633, A134, doi: 10.1051/0004-6361/201936803
- Maiolino et al. (2012) Maiolino, R., Gallerani, S., Neri, R., et al. 2012, MNRAS, 425, L66, doi: 10.1111/j.1745-3933.2012.01303.x
- Marshall et al. (2020) Marshall, M. A., Mutch, S. J., Qin, Y., Poole, G. B., & Wyithe, J. S. B. 2020, MNRAS, 494, 2747, doi: 10.1093/mnras/staa936
- Matsuoka et al. (2016) Matsuoka, Y., Onoue, M., Kashikawa, N., et al. 2016, ApJ, 828, 26, doi: 10.3847/0004-637X/828/1/26
- Matsuoka et al. (2018a) —. 2018a, PASJ, 70, S35, doi: 10.1093/pasj/psx046
- Matsuoka et al. (2018b) Matsuoka, Y., Iwasawa, K., Onoue, M., et al. 2018b, ApJS, 237, 5, doi: 10.3847/1538-4365/aac724
- Mazzucchelli et al. (2017) Mazzucchelli, C., Bañados, E., Venemans, B. P., et al. 2017, ApJ, 849, 91, doi: 10.3847/1538-4357/aa9185
- Mazzucchelli et al. (2019) Mazzucchelli, C., Decarli, R., Farina, E. P., et al. 2019, ApJ, 881, 163, doi: 10.3847/1538-4357/ab2f75
- McMullin et al. (2007) McMullin, J. P., Waters, B., Schiebel, D., Young, W., & Golap, K. 2007, in Astronomical Society of the Pacific Conference Series, Vol. 376, Astronomical Data Analysis Software and Systems XVI, ed. R. A. Shaw, F. Hill, & D. J. Bell, 127
- Murphy et al. (2011) Murphy, E. J., Condon, J. J., Schinnerer, E., et al. 2011, ApJ, 737, 67, doi: 10.1088/0004-637X/737/2/67
- Neeleman et al. (2019) Neeleman, M., Bañados, E., Walter, F., et al. 2019, ApJ, 882, 10, doi: 10.3847/1538-4357/ab2ed3
- Novak et al. (2020) Novak, M., Venemans, B. P., Walter, F., et al. 2020, arXiv e-prints, arXiv:2010.14875. https://arxiv.org/abs/2010.14875
- Ono et al. (2018) Ono, Y., Ouchi, M., Harikane, Y., et al. 2018, PASJ, 70, S10, doi: 10.1093/pasj/psx103
- Onoue et al. (2019) Onoue, M., Kashikawa, N., Matsuoka, Y., et al. 2019, ApJ, 880, 77, doi: 10.3847/1538-4357/ab29e9
- Perrotta et al. (2019) Perrotta, S., Hamann, F., Zakamska, N. L., et al. 2019, MNRAS, 488, 4126, doi: 10.1093/mnras/stz1993
- Richards et al. (2003) Richards, G. T., Hall, P. B., Vand en Berk, D. E., et al. 2003, AJ, 126, 1131, doi: 10.1086/377014
- Richards et al. (2006) Richards, G. T., Lacy, M., Storrie-Lombardi, L. J., et al. 2006, ApJS, 166, 470, doi: 10.1086/506525
- Ross et al. (2015) Ross, N. P., Hamann, F., Zakamska, N. L., et al. 2015, MNRAS, 453, 3932, doi: 10.1093/mnras/stv1710
- Sanders et al. (1988) Sanders, D. B., Soifer, B. T., Elias, J. H., et al. 1988, ApJ, 325, 74, doi: 10.1086/165983
- Sault et al. (1995) Sault, R. J., Teuben, P. J., & Wright, M. C. H. 1995, in Astronomical Society of the Pacific Conference Series, Vol. 77, Astronomical Data Analysis Software and Systems IV, ed. R. A. Shaw, H. E. Payne, & J. J. E. Hayes, 433. https://arxiv.org/abs/astro-ph/0612759
- Shirakata et al. (2019) Shirakata, H., Okamoto, T., Kawaguchi, T., et al. 2019, MNRAS, 482, 4846, doi: 10.1093/mnras/sty2958
- Silverman et al. (2011) Silverman, J. D., Kampczyk, P., Jahnke, K., et al. 2011, ApJ, 743, 2, doi: 10.1088/0004-637X/743/1/2
- Straatman et al. (2014) Straatman, C. M. S., Labbé, I., Spitler, L. R., et al. 2014, ApJ, 783, L14, doi: 10.1088/2041-8205/783/1/L14
- Symeonidis (2017) Symeonidis, M. 2017, MNRAS, 465, 1401, doi: 10.1093/mnras/stw2784
- Trakhtenbrot et al. (2017) Trakhtenbrot, B., Lira, P., Netzer, H., et al. 2017, ApJ, 836, 8, doi: 10.3847/1538-4357/836/1/8
- U et al. (2012) U, V., Sanders, D. B., Mazzarella, J. M., et al. 2012, ApJS, 203, 9, doi: 10.1088/0067-0049/203/1/9
- Urrutia et al. (2009) Urrutia, T., Becker, R. H., White, R. L., et al. 2009, ApJ, 698, 1095, doi: 10.1088/0004-637X/698/2/1095
- Urrutia et al. (2008) Urrutia, T., Lacy, M., & Becker, R. H. 2008, ApJ, 674, 80, doi: 10.1086/523959
- Venemans et al. (2019) Venemans, B. P., Neeleman, M., Walter, F., et al. 2019, ApJ, 874, L30, doi: 10.3847/2041-8213/ab11cc
- Venemans et al. (2016) Venemans, B. P., Walter, F., Zschaechner, L., et al. 2016, ApJ, 816, 37, doi: 10.3847/0004-637X/816/1/37
- Venemans et al. (2017) Venemans, B. P., Walter, F., Decarli, R., et al. 2017, ApJ, 845, 154, doi: 10.3847/1538-4357/aa81cb
- Venemans et al. (2018) Venemans, B. P., Decarli, R., Walter, F., et al. 2018, ApJ, 866, 159, doi: 10.3847/1538-4357/aadf35
- Venemans et al. (2020) Venemans, B. P., Walter, F., Neeleman, M., et al. 2020, ApJ, 904, 130, doi: 10.3847/1538-4357/abc563
- Wang et al. (2011) Wang, R., Wagg, J., Carilli, C. L., et al. 2011, ApJ, 739, L34, doi: 10.1088/2041-8205/739/1/L34
- Wang et al. (2013) —. 2013, ApJ, 773, 44, doi: 10.1088/0004-637X/773/1/44
- Willott et al. (2015) Willott, C. J., Bergeron, J., & Omont, A. 2015, ApJ, 801, 123, doi: 10.1088/0004-637X/801/2/123
- Willott et al. (2017) —. 2017, ApJ, 850, 108, doi: 10.3847/1538-4357/aa921b
- Willott et al. (2013) Willott, C. J., Omont, A., & Bergeron, J. 2013, ApJ, 770, 13, doi: 10.1088/0004-637X/770/1/13
- Zakamska et al. (2019) Zakamska, N. L., Sun, A.-L., Strauss, M. A., et al. 2019, MNRAS, 489, 497, doi: 10.1093/mnras/stz2071