A catastrophic charge density wave in BaFe2Al9
Abstract
Charge density waves (CDW) are modulations of the electron density and the atomic lattice that develop in some crystalline materials at low temperature. We report an unusual example of a CDW in BaFe2Al9 below 100 K. In contrast to the canonical CDW phase transition, temperature dependent physical properties of single crystals reveal a first-order phase transition. This is accompanied by a discontinuous change in the size of the crystal lattice. In fact, this large strain has catastrophic consequences for the crystals causing them to physically shatter. Single crystal x-ray diffraction reveals super-lattice peaks in the low-temperature phase signaling the development of a CDW lattice modulation. No similar low-temperature transitions are observed in BaCo2Al9. Electronic structure calculations provide one hint to the different behavior of these two compounds; the d-orbital states in the Fe compound are not completely filled. Iron compounds are renowned for their magnetism and partly filled d-states play a key role. It is therefore surprising that BaFe2Al9 develops a structural modulation at low temperature instead of magnetic order.
keywords:
Charge density wave, intermetallic, aluminide, first order, phase transition, magnetic susceptibility, resistance, x-ray diffraction, neutron diffraction, MössbauerNeutron Scattering Division, Oak Ridge National Laboratory, Oak Ridge, Tennessee 37831 \abbreviationsCDW,DFT
![[Uncaptioned image]](/html/2101.00321/assets/x1.png)
This manuscript has been authored by UT-Battelle, LLC under Contract No. DE-AC05-00OR22725 with the U.S. Department of Energy. The United States Government retains and the publisher, by accepting the article for publication, acknowledges that the United States Government retains a non-exclusive, paid-up, irrevocable, world-wide license to publish or reproduce the published form of this manuscript, or allow others to do so, for United States Government purposes. The Department of Energy will provide public access to these results of federally sponsored research in accordance with the DOE Public Access Plan (http://energy.gov/downloads/doe-public-access-plan).
1 Introduction
Some crystalline materials experience rearrangements of their atomic structure when they are heated or cooled. These structural transitions are important in many technologies including hardening steel2, battery materials3, 4 and next generation electronic devices5, 6, 7. In addition, examining the details of the structural and property changes offers insights into the mechanisms at play and inspires design of new useful materials. A charge density wave is a curious variant of a structural transition.
A charge density wave (CDW) is a modulation of a material’s atomic lattice that develops on cooling. This phenomenon is characterized not only by a periodic redistribution of electronic density (the charge density wave), but also a complementary static periodic displacement of the atoms. Critically, most CDWs have wavelengths distinct from the repeat unit of the original crystal lattice.8 The simplest picture of a CDW is the Peierls model. Partially filled orbitals in a chain of atoms display an instability to forming alternating bonds.9, 8, 10 This is a powerful yet simple idea often used to understand dimers and distorted networks in a wide variety of chemical systems.11, 12, 13 Although CDWs are usually introduced conceptually with the Peierls model, the origin of CDW order is not always clear.8, 14, 15, 16
CDW materials host unusual physical properties including metal-insulator transitions and nonlinear electrical conductivity.8 In addition, a number of CDW systems can be modified to suppress the modulation and induce superconductivity.17, 18 CDW order has taken on new importance in the field of 2D materials like the transition metal dichalcogenides 18, 19, 20, 21, 22, 23, 24. CDW modulations can modify the electronic, magnetic and optical properties of these materials in useful ways.25, 26, 27, 28 Classic examples of CDWs occur in materials with 1D or 2D electronic structures derived from weakly-coupled chain-like (K0.3MoO3 and NbSe3)8, 29, 30 or sheet-like motifs (NbSe2 and EuAl4)22, 31, 32, 33. Few examples of 3D-network compounds with CDWs are known.14
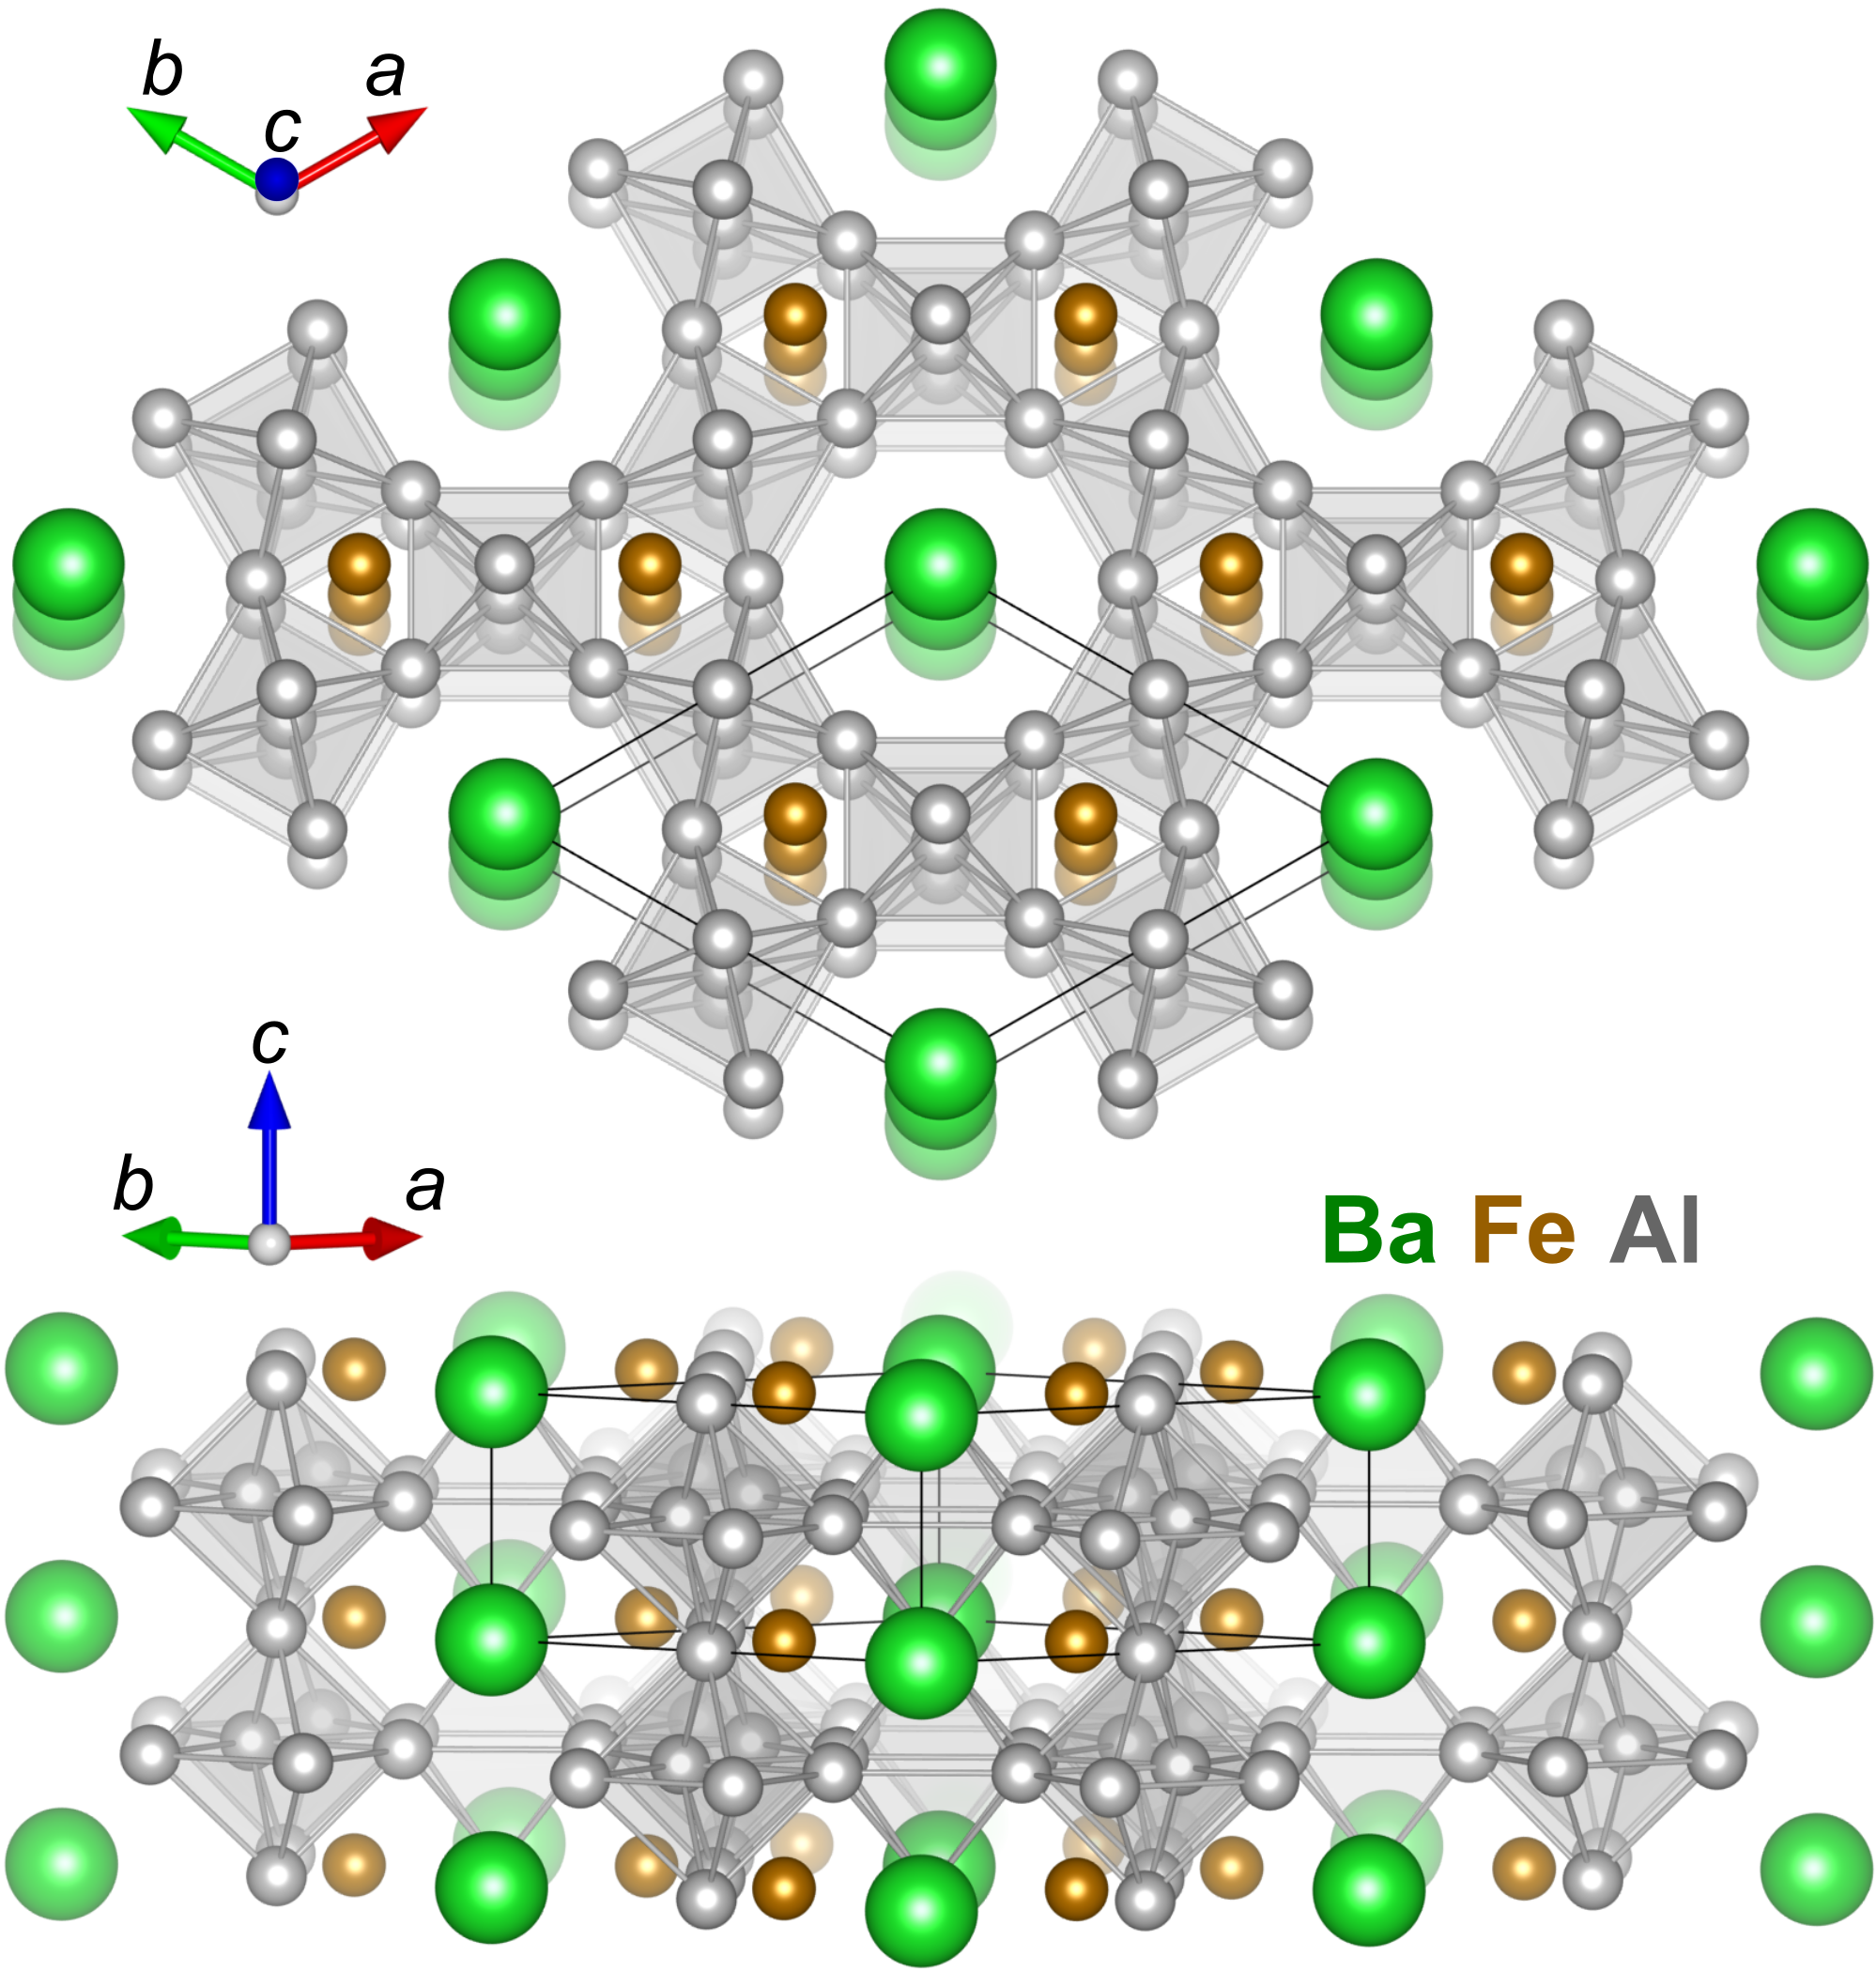
BaFe2Al9 is a member of a family of aluminum-rich, intermetallic compounds; Al9. Turban and Schäfer introduced the family with BaAl9 ( = Fe, Co, Ni) and SrAl9 ( = Co, Ni).34 CaCo2Al9 35 and EuCo2Al9 36 share the same structure and three indium-rich compounds are variations on the same theme; KCo2In9, KNi2In9 37 and BaIr2In9 38. The hexagonal structure of BaFe2Al9 (6/ No. 191) is presented in Fig. 1.34 First, note the 3D network of corner-sharing Al octahedra. Vajenine and Hoffmann discussed the network bonding in detail and noted that this aluminum framework provides some flexibility in the optimal electron count39. This likely explains why the structure forms with a series of transition-metals (Fe, Co, Ni) accommodating the additional electrons in the Al bands. Barium atoms are closely-spaced, forming columns along the -direction within large channels in the Al-framework. The iron atoms are centered in a tri-capped triangular prisms of Al atoms. The nearest Fe-Fe (and Ba-Ba) spacings are unit cell height, around 3.93 Å at room temperature.
BaFe2Al9 came to our attention while searching the ICSD for transition-metal materials with kagome-lattice motifs.40 Although Al (not Fe) formed the desired lattice, the compounds still held an opportunity for interesting magnetism. Specifically, the Materials Project database predicted that the electronic structure had partially filled d-orbitals41 from the stacked honeycombs of Fe. To our surprise, BaFe2Al9 develops a CDW without any signs of the magnetism we anticipated.
We report a charge density wave below 100 K in crystals of BaFe2Al9 grown from an aluminum melt. Physical property measurements reveal that this transition is first-order with a sufficiently large change of the lattice parameters to shatter the crystals (0.5 and 1.5%). Single crystal x-ray diffraction resolves super-lattice peaks at low temperature signaling CDW order. In contrast, BaCo2Al9 has no phase transitions below room temperature. Electronic structure calculations reveal that the transition-metal d-orbitals are partly filled in BaFe2Al9 and completely filled in BaCo2Al9. Based on this comparison, we propose that d-electrons in the Fe compound play a key role in CDW formation. Iron is renowned for its magnetism and partly filled d-orbitals are key to its behavior. This makes it more surprising that BaFe2Al9 hosts CDW order. This dramatic structural transition is the first CDW in an Fe-intermetallic compound and a rare example of a CDW in a 3D-network compound. BaFe2Al9 has many opportunities for chemical substitution to tune this transition to investigate its origin and its concomitant, large lattice contraction.
2 Experimental
2.1 Crystal growth
Crystals of BaFe2Al9 and BaCo2Al9 were grown from an aluminum-rich melt using a starting atomic composition of Ba::Al = 6:8:86 ( = Fe and Co) in 1.5-2.1 g batches. Barium pieces (Alfa Aesar 99.9%), iron granules (Alfa Aesar 99.98%), cobalt powder (Alfa Aesar 99.8%) and aluminum shot (Alfa Aesar 99.999%) were loaded into a 2 mL alumina Canfield Crucible Set 42. The raw materials and crucibles were sealed in a fused silica ampoule filled with argon. In a box furnace, the assembly was heated to 1150 °C over 6 h, held for 12 h then slowly cooled to 1000 °C over 200 h to grow the crystals. The ampoule was removed from the hot furnace, inverted into a centrifuge and spun to remove the remaining Al-rich solution from the crystals.
2.2 Products
This procedure yielded around 0.5 g of metallic hexagonal crystals with habits ranging from needles to blocky columns 0.3-7 mm in diameter which often spanned the interior of the crucible (up to 13 mm long). Crystals of BaCo2Al9 were generally smaller and thinner. These brittle crystals exhibit conchoidal fracture with no evidence of cleavage. Flux on the crystal surfaces was dissolved away in a 1 M HCl solution over 0.5-4 h.
2.3 Characterization
Magnetization measurements were performed at 2 kOe on single crystals or crushed crystals in plastic drinking straws with a Quantum Design Magnetic Property Measurement System (MPMS) between 2 and 300 K using a rate of 1 K/min. 4-probe electrical resistance was measured on crystals contacted with Pt wire and Ag epoxy (EPO-TEK H20E) between 2 and 300 K (at 1 K/min) with the ac-transport option of a 9 T Quantum Design Physical Property Measurement System (PPMS). Small, previously shattered crystal fragments were more likely to hold together during resistance measurements. Heat capacity was measured using the Quantum Design heat capacity option of the PPMS using Apiezon N-grease between 1.8 and 200 K.
Powder neutron diffraction was performed using the POWGEN time of flight diffractometer at the Spallation Neutron Source at Oak Ridge National Laboratory43. 1.83 g of ground BaFe2Al9 crystals were held in a vanadium can in the POWGEN Automatic Sample Changer. Measurements were preformed at temperatures from 7 to 300 K using neutron wavelength bands centered at 1.5 and 2.66 Å. Rietveld refinement was preformed using Jana2020.44
The lattice parameters were determined by powder x-ray diffraction (PANalytical X’pert Pro, with Cu-K1 radiation). An Oxford PheniX closed-cycle helium cryostat was used for scans below room temperature. Lattice parameters were determined from full 2 scans taken at each temperature.
Single-crystal diffraction data were collected from a 100 µm BaFe2Al9 crystal fragment as a function of temperature using a Rigaku XtaLAB PRO diffractometer with graphite monochromated Mo K radiation ( = 0.71073 Å, 50 kV and 40 mA) equipped with a Rigaku HyPix-6000HE detector and an Oxford N-HeliX cryocooler. Peak indexing and integration were done using the Rigaku Oxford Diffraction CrysAlisPro software45. An empirical absorption correction was applied using the SCALE3 ABSPACK algorithm as implemented in CrysAlisPro. Omega scans with counting times up to 60 s per point ensured that the weak superlattice reflections could be easily seen. Structure refinements were performed in Jana2020.44
Temperature-dependent 57Fe Mössbauer spectra were acquired on ground BaFe2Al9 crystals placed in a Janis SH-850 closed cycle cryostat. A 15 mCi 57Co source and a Ritverc-2 Tl@NaI detector were used with a Wissel drive. This was calibrated using a room-temperature alpha-iron sample, which serves as a reference for the isomer shift. Data was acquired between 295 K and 10 K, first on cooling and then on heating to reveal the hysteretic nature of the transition.
DFT calculations were carried out using the projector augmented wave method 46 with the generalized gradient approximation in the parametrization of Perdew, Burke, and Enzerhof (PBE) 47 for exchange-correlation as implemented in the Vienna ab-initio simulation package (VASP) 48. For Ba, a pseudo-potential, in which semi-core s-states are treated as valence states, is used (Basv in the VASP distribution). For Fe, Co and Al standard potentials are used (Fe, Co and Al, respectively). For both cases, we use the experimental lattice parameters obtained at room temperature with a -point grid and an cutoff of 500 eV. Local Hubbard + correction is not included because both compounds are itinerant intermetallic systems. While the spin-orbit coupling was included, its effect is negligibly small because no heavy elements had states near the Fermi-level. In both cases, paramagnetic ground states are stabilized, consistent with experimental observations.
3 Results
3.1 Physical properties
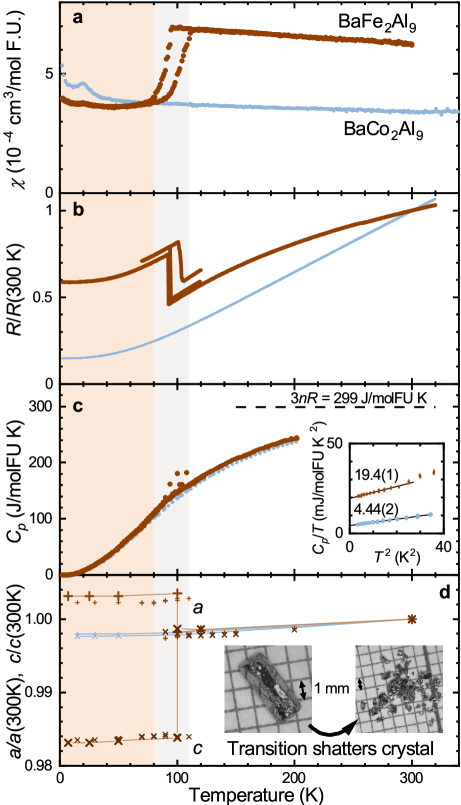
Figure 2 presents the low temperature physical properties of BaFe2Al9 and BaCo2Al9. In Fig. 2a, the Co compound shows a relatively small, paramagnetic susceptibility, , with weak temperature dependence across the whole temperature range. This is consistent with the Pauli paramagnetic response of a metal.49, 50
BaFe2Al9 has a similar flat magnetic response at high temperatures but the susceptibility rapidly decreases around 100 K on cooling. Below this, the is nearly temperature independent once again. This change in magnetic response occurs over a 10 K range and displays a 10 K hysteresis between heating and cooling. Both features are suggestive of a first-order phase transition in BaFe2Al9 at around 100 K. Neither compound has a significant Curie-Weiss contribution suggestive of local magnetic moments. The weak peak in both curves near 20 K is not present in all samples and is likely an impurity.
In Fig. 2b the electrical resistance of both compounds exhibit metallic behavior with resistance generally increasing with temperature. The data for BaFe2Al9 displays a conspicuous 60% jump around 100 K on cooling between two metallic regimes. This hysteretic feature coincides with the first order transition observed in the magnetization measurement. Although the orientation of the small BaFe2Al9 crystal used for this measurement is unknown, another sample had a resistivity of 144 µ cm along the -axis at 300 K.
BaCo2Al9 shows uninterrupted metallic resistance down to base temperature with resistivity along the -axis of 2.3 and 16 µ cm at 2 and 300 K, respectively. This results compares well with the resistance behavior reported by Ryżyńska et al. although we observe a smaller residual resistance ratio of 6.7 instead of 10.51 Neither BaFe2Al9 or BaCo2Al9 display superconductivity above 1.85 K.
Figure 2c presents the low-temperature specific heat capacity of the two compounds. BaCo2Al9 exhibits a relatively featureless heat capacity curve. The BaFe2Al9 data have a slightly larger across the whole range and a subtle change in slope near 100K. A first order transition would be expected to produce a spike at this temperature corresponding to the latent heat. Instead, we find a few data points with elevated values of . These are likely due to the portions of the sample transforming at different times. The 10 K transition width observed in magnetic susceptibility also suggests an inhomogeneous transformation. This is likely why a single, sharp peak expected for a first-order phase transition is not observed near 100 K in the BaFe2Al9 specific heat data.
The inset of Fig. 2c shows fits to the lowest temperature specific heat data to estimate the electronic heat capacity term, . We estimate values of 19.4(1) and 4.44(2) mJ/molF.U. K2 for the BaFe2Al9 and BaCo2Al9, respectively. Ryżyńska et al. calculated a of BaCo2Al9 to be 7.94 mJ/molF.U. K2. Our estimated of the Fe compound is 4.4 times that of the Co variant suggesting a larger electronic density of states in the low temperature phase50. In contrast, the low temperature magnetic susceptibilities of the two compounds (Fig. 2a) suggest that they have comparable density of states below 100 K. Pauli paramagnetic and Landau diamagnetic contributions are proportional to the density of states and should be dominant in these two metals.50 Therefore, similar values imply similar density of states. The origin of this contradiction is not clear, but the enhanced value of in BaFe2Al9 might arise from electronic correlations.
Figure 2d presents the temperature dependence of the lattice parameters of BaFe2Al9 and BaCo2Al9 determined by powder x-ray (small symbols) and neutron diffraction (larger symbols). BaCo2Al9 shows a relatively isotropic contraction of the lattice by 0.2% for both and between 300 and 15 K. This is in contrast to the anisotropic thermal expansion observed in isostructural BaIr2In9.38 The thermal expansion of BaFe2Al9 shows a similar uniform lattice contraction down to 100 K. The lattice parameters change discontinuously at the transition observed in magnetization and resistance measurements. abruptly increases by 0.5% and shrinks by 1.5% for a net volume contraction of 0.5%. Coexistence of the high and low temperature phases is observed between 80 and 110 K in both the x-ray and neutron experiments. Phase coexistance and the jump in the lattice parameters provide further evidence that the transition in BaFe2Al9 is truly first order.
This inhomogeneous first-order transformation has catastrophic consequences for crystals of BaFe2Al9. Samples cooled through 100 K physically shatter. Crystals larger than 1 mm fragment into 0.01 - 0.3 mm pieces as depicted by the insets of Fig. 2d. This can be accomplished by dropping them in liquid nitrogen. This self-destructive behavior likely stems from the large, 1.5% strain at the transition. Rigid inclusions and an inhomogeneous transformation will develop significant stresses in samples causing them to fail. This unfortunate feature of BaFe2Al9 complicated physical property measurements. Samples either had to be held together mechanically or had to be small enough that they survived the transformation.
3.2 Evidence for charge density wave
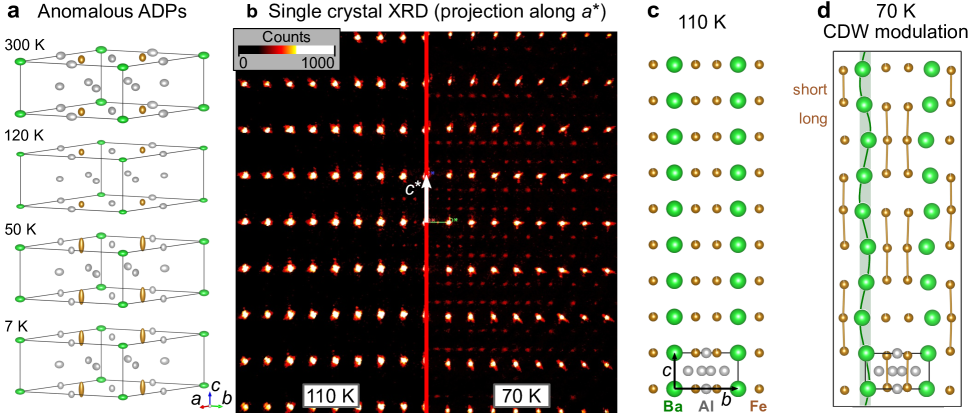
The temperature-dependent physical properties presented in Fig. 2 suggest that a first-order phase transition occurs in BaFe2Al9 around 100 K. Powder x-ray and neutron diffraction measurements did not reveal any evidence for new diffraction peaks, measurable deviations from hexagonal symmetry or magnetic order. Refinement of the neutron diffraction data revealed a dramatic increase in Fe and Ba atomic displacement parameters (ADPs) on cooling through 100 K (Fig. 3a and supplemental information). This increase was notably anisotropic; Fe atoms displace more along the [001] direction and Ba in the -plane. This observation signals a potential lattice modification in the low temperature phase.
We turn to single crystal x-ray diffraction to expose the nature of this phase transition. Figure 3b presents all the measured intensity in reciprocal space projected along the direction (i.e. projected onto the () reciprocal plane). At 110 K (left side) a rectangular array of peaks is observed consistent with the room-temperature unit cell. At 70 K, new peaks appear signaling a change in lattice periodicity. These superlattice peaks are on the order of 1/300th the intensity of the primary reflections and can be indexed by three symmetry-related wave vectors: ½ 0 , -½ ½ , and 0 -½ . We determined the incommensurate index, 0.3020(9) r.l.u. at 70 K. These peaks signal the presence of a charge density wave (CDW) modulation in the low temperature phase of BaFe2Al9.
Using ISODISTORT, we determined that has 4 irreducible representations with wave-vector ½ 0 . 52, 53 Among these, the displacement modes were consistent with anomalous Fe and Ba ADPs noted above and gave the best agreement with the superlattice intensities using Jana2020.
Figure 3c shows the refined 110 K hexagonal structure viewed along the direction and Fig. 3d shows the corresponding view of our best model of the modulated CDW structure at 70K. This is a commensurate approximate version of the CDW with 20-times larger, C-centered orthorhombic unit cell (thin black rectangle) corresponding to the super-lattice wave-vector. First, note that straight columns of barium atoms at 110 K along the [001] direction develop a sine-modulated, horizontal displacement with a period of . The Fe atoms also have modulated displacements primarily along [001] leading to varying Fe-Fe distances. Lines connect Fe atoms that are closer than average emphasizing this change. These displacements correspond to the directions with large Fe and Ba ADPs in Fig. 3a at low temperature.
We are confident that the dominant distortion mode is similar to the one depicted in Fig. 3d and transforms at the irreducible representation. This model best explains the ADPs of the refined average structures and intensity of the superlattice peaks. Unfortunately, our x-ray data does not provide a complete refinement of the modulated structure. Attempts to refine the modulated structure in Jana2020 yielded confident modulation parameters for the heavier Ba and Fe atoms but not for the two Al sites. Including these parameters did not give consistent or stable solutions and negative ADP parameters signaled that this model is insufficient to completely describe the data.
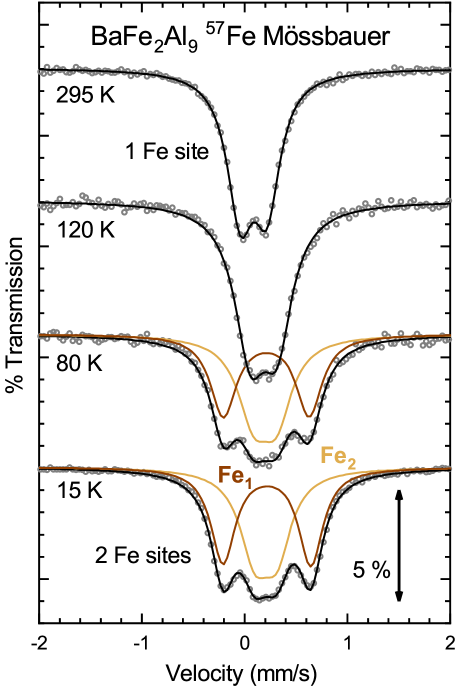
In addition to our partial structure refinement, 57Fe Mössbauer spectroscopy indicates that our CDW description in Fig. 3d is missing something. Figure 4 presents the Mössbauer spectra for BaFe2Al9 above and below the first order transition. At 295 and 120 K, a single absorption doublet is observed generated by the single iron site in the room-temperature structure. The small asymmetry suggests a minor preferential orientation. The spectra change abruptly on cooling through the transition and four peaks can be resolved. This spectrum is best modeled by a pair of doublets as show. These correspond to two iron sites with different quadrupole splitting values and isomer shifts with equal population. In short, the low temperature phase of BaFe2Al9 has two types of iron atoms with different local environments. None of the measured spectra showed evidence of magnetic hyperfine splitting. Based on magnetic susceptibility, neutron diffraction, and this Mössbauer result, BaFe2Al9 does not appear to undergo magnetic ordering.
First, this Mössbauer evidence for two Fe sites at low temperature supports our identification of a structural change below 100 K. However, our diffraction result is not immediately consistent with two Fe sites. The first-order super-lattice peaks observed only provide information on the first harmonic of the position modulations. The simplest (sinusoidal) modulation this describes would give a distribution of iron site environments with a range of Mössbauer parameters, not two distinct Fe-site populations. The Mössbauer spectra are not well fit by such a distribution of quadrupole splittings and isomer shifts (see supplemental material).
There are likely higher-order harmonics to the CDW modulation which generate the two distinct Fe atom environments suggested by Mössbauer spectroscopy. These additional modulation components should generate higher-order super-lattice peaks54. We suspect these were too weak for us to resolve with the single crystal diffractometer. Between an inconclusive x-ray refinement and the Mössbauer result, the CDW structure of BaFe2Al9 presented in Fig. 3d is not yet a complete description of the low temperature structure.
4 Discussion
The temperature dependent physical properties in Fig. 2 reveal a first-order phase transition in BaFe2Al9 around 100 K which tends to shatter the crystals. Superlattice peaks observed with single crystal XRD reveal that the low temperature phase is a charge density wave. No such transition is observed in BaCo2Al9. Electronic structure calculations provide one clue to why a CDW appears in the Fe and not the Co compound; the filling of the transition-metal d-orbitals.
4.1 Electronic structure calculations
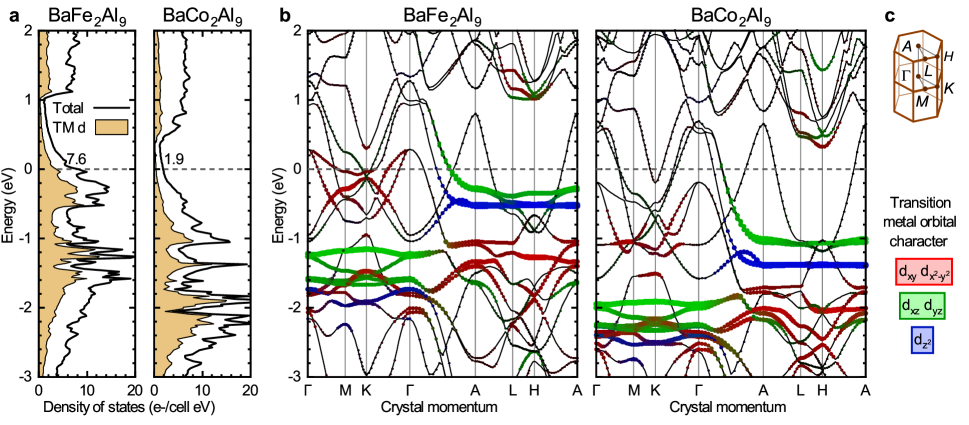
Figure 5 presents the calculated electronic structure of BaFe2Al9 and BaCo2Al9 from DFT. Panel 5a provides a comparison of the density of states between the two compounds. The shaded region represents the d-orbital contribution at each energy. The d-states are shifted to lower energies in the Co compound dramatically reducing the density of states at the Fermi energy (dashed line).
The band structure in Fig. 5b shows more detail of these changes. The thicker bands have more transition-metal d-orbital character and the color denotes the contribution from each d-orbital variety. Thinner bands are generally dominated by Al s- and p-orbitals in the depicted energy range.
Note the common features between the two compounds. The thicker d-orbital bands show small dispersion in and planes but they are shifted down by 0.7-0.9 eV in the Co compound. Critically, in BaFe2Al9 several of the bands at the Fermi level (dashed line) have d-orbital character; the red (/) bands in the plane and green (/) bands on the line. In the BaCo2Al9, only thin lines representing Al-dominated bands lie at the Fermi level.
We propose that the partly filled d-bands play an important role in the formation of the CDW in BaFe2Al9. First, this is the most conspicuous difference between the electronic structures in Fig. 5. Second, our physical property measurements suggest that the CDW only opens a gap in some of the bands. In a canonical, single-band CDW system the structural modulation is heralded by a metal-insulator transition. High-temperature metallic properties give way to semiconducting behavior as a band gap opens on cooling.8 In contrast, BaFe2Al9 displays metallic resistance behavior both above and below the transition (Fig. 2b).
In BaFe2Al9 many bands cross the Fermi energy. CDW formation likely gaps out some of these bands (maybe the d-bands) which reduces the density of states. This reduction of metallic carriers causes the abrupt increase in the resistance on cooling but the un-gapped bands facilitate metallic resistance vs. temperature behavior at low temperatures. The magnetic susceptibility data presented in Fig. 2a supports this model. The Pauli paramagnetic contribution to the susceptibility is proportional to the density of states at the Fermi level.49 Gap formation on some of the bands by the CDW leads to a smaller density of states and, therefore a weaker Pauli paramagnetic response at low temperature.
We believe the role of the d-orbitals in the CDW we propose is testable. Once the modulated structure of the CDW in BaFe2Al9 is determined, the electronic structure can be calculated for the superstructure. Based on our model, we would anticipate that Fe-dominated states would be gapped at the Fermi level and bands from the Al-network would not. This observation would emphasize the relative involvement of these d-orbital states in the structural modulation.
Vajenine and Hoffmann noted something curious about this BaFe2Al9 family of compounds; the transition metal is the most electronegative constituent39. They suggest that Fe and Co will have filled d-orbitals and the remaining electrons are distributed on the Al-network. Our DFT results reveal that this is not quite the case in BaFe2Al9. As we noted above, the d-bands have unfilled states. Their argument still has merit in that the additional electrons per formula unit (F.U.) in BaCo2Al9 preferentially fill the d-bands. The thinner bands, with strong Al character, shift less than the d-bands between the two compounds in Fig. 5b. Al-bands fall by 0.15-0.4 eV while the d-bands fall by 0.7-0.9 eV. The smaller shift of Al-network bands is exemplified by the thin hole band above the Fermi energy at the point in both compounds.
This disparate energy shift of the d- and Al-bands suggests that filled d-orbitals are indeed favored in this family of compounds. Unfilled d-orbitals in BaFe2Al9 may explain its abrupt volume change at the CDW transition. To fill the Fe d-orbitals, the electrons would have to come from the Al-network. Reducing the filling of the Al-bands would modify network bonding leading to the changes of the lattice parameters presented in Fig. 2d.
The archetypal CDW compounds are characterized by weakly coupled chains or sheets such as NbSe3, K0.3MoO3, the NiC2-family, K2Mo15Se13, NbSe2, and (K,Ba)AgTe2.8, 55, 56, 57, 58 CDWs in intermetallic compounds with 3D structural networks, like BaFe2Al9, are notably less common. Examples include a few transition metal silicides, germanides, stannides, and chalcogenides such as Si5,59, 60, 61 Ge5,62 and Si1063, 64, 65, 66, the Sr3Ir4Sn13-family67, 68 and Ir2In8Se 69. Few compounds show first-order CDW transitions like that in BaFe2Al9. Examples include Lu2Ir3Si5, Er2Ir3Si5 60, 59 and light rare-earth variants of Pt2Si2 70. The first two compounds show similar jumps in resistance vs temperature with low temperature metallic behavior like BaFe2Al9. Although charge order has been identified in two iron oxides (LuFe2O4 71 and magnetite 72), BaFe2Al9 is the first example of a CDW in an Fe-based compound we are aware of without magnetism.
Identifying a CDW ground-state in BaFe2Al9 begs two key questions. First, iron is renowned for its magnetism and partially filled d-orbitals are critical ingredients for magnetic order.49 This is particularly true for 3d transition-metal compounds. Therefore, it is somewhat surprising to find a CDW in BaFe2Al9 despite its nearly filled Fe d-bands. Why is a charge modulation favored over magnetism in this compound?
Second, the majority of charge density wave transitions are second-order or weakly first order.8 In contrast, the CDW in BaFe2Al9 appears at a strongly first-order transition with a 1.5% shrinkage along . Why is the CDW transition first order in this compound? What is the role of the large lattice strain that accompanies it?
In general, the mechanism that drives CDW transitions is not entirely clear.8, 14 This is especially true in materials with relatively 3D electronic structures and many Fermi surfaces, like BaFe2Al9. Although Fermi surface nesting is frequently discussed as driving CDW formation, this argument is strongest in materials with particularly 1D character. Electron correlations and wavelength-dependent electron-phonon coupling may be more important in 3D materials like BaFe2Al9.
This compound offers a unique opportunity for chemical tuning to explore the origin of its CDW order. First, unlike the more common second-order CDW transition, the first-order transition produces a strong signal for tracking changes. Magnetic susceptibility, resistance, and particularly the lattice parameters all show dramatic discontinuities. This will allow us to easily track the phase transition as we modify the material. Next, BaFe2Al9 belongs to a family with some compositional flexibility.39 As a result, this compound offers several opportunities for chemical substitution. Isovalent doping of Sr for Ba, Ru for Fe, or Ga for Al allow tuning of the lattice size and disorder. The role of band filling could be explored by replacing Fe with other transition metals. Overall, BaFe2Al9 has a wonderful potential for tuning its conspicuous first-order CDW transition to learn what drives it.
In summary, we grew crystals of BaFe2Al9 and BaCo2Al9 from aluminum flux and characterized their temperature-dependent physical properties. These results reveal no transitions in BaCo2Al9 and a first-order phase transition in the Fe compound near 100 K. Diffraction results reveal a discontinuous change in lattice parameters across the transition. This strain is large enough to physically shatter the crystals. Single crystal x-ray diffraction revealed the low-temperature phase in BaFe2Al9 to be a charge density wave (CDW) with modulated Fe and Ba positions. Comparing the electronic structures of BaFe2Al9 and BaCo2Al9 hints that the CDW in the former might be associated with Fe d-bands at the Fermi energy. BaFe2Al9 offers many opportunities for chemical tuning to answer some outstanding questions about its unusual CDW ground state.
We would like to thank Anna Böhmer, Andreas Kreyssig, Joe Paddison, Andrew May, Jiaqiang Yan, Gordon Miller, Tom Roberson and Rob Moore for their discussions and insights. We would also like to thank Václav Petříček for his assistance with the modulated structure which required an early copy of Jana2020.
Research supported by the U. S. Department of Energy, Office of Science, Basic Energy Sciences, Materials Sciences and Engineering Division (under contract number DE-AC05-00OR22725). GDS was supported as part of the Energy Dissipation to Defect Evolution (EDDE), an Energy Frontier Research Center funded by the US Department of Energy, Office of Science, Basic Energy Sciences under Contract Number DE-AC05-00OR22725.This research used resources at the Spallation Neutron Source, a DOE Office of Science User Facility operated by Oak Ridge National Laboratory.
The following files are available free of charge.
-
•
CDW_in_BaFe2Al9_SI_02.pdf : Details of neutron powder diffraction refinements and Mössbauer fits
-
•
BaFe2Al9_neutron_300K_submit.cif : Refined structure of BaFe2Al9 at 300 K using neutron diffraction
Supplemental Information
Neutron powder diffraction refinement
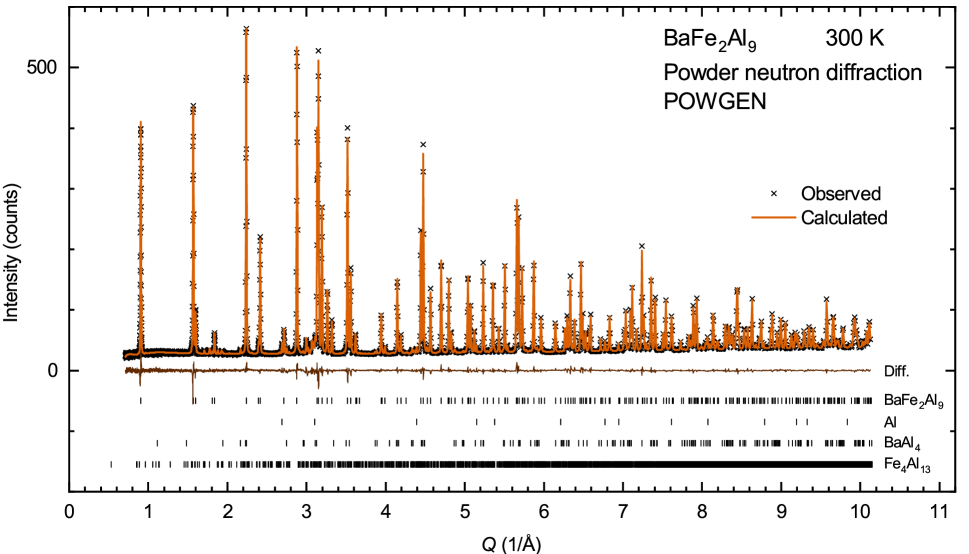
Figure 6 depicts the fit to the powder neutron diffraction of BaFe2Al9 taken at 300 K. We were not selective with the crystals chosen to grind into the 1.83 g sample. As a result, this measurement represents a worst-case scenario for impurities. The refinement indicates 92.2(3) wt% BaFe2Al9 1.14(7) wt% Al metal, 2.62(19) wt% BaAl4, and 4.00(12) wt% Fe4Al13.
Tables 1 presents the details of the structure refinement from the powder neutron diffraction data of BaFe2Al9 above and below the charge density wave (CDW) transition. Although the compound has a CDW modulation at 50 and 7 K the same structure model was used for all temperatures. This was done because no super-lattice peaks are observed in the neutron data to refine a modulated structure. We were able to infer the presence of a CDW modulation in the average structure based on the atomic parameters in Tables 2 and 3. As discussed in the main text, the anisotropic atomic displacement parameters (ADPs) show an anomalous temperature dependence below 100 K consistent with the CDW model we propose.
Our refinement indicated that the Fe site in BaFe2Al9 mostly occupied with only a few percent vacancies. This reduced site occupancy was also observed when x-ray data were refined.
| Chemical formula | BaFe1.92Al9 | |||
|---|---|---|---|---|
| Formula wt. (g/molF.U.) | 487.383 | |||
| Crystal system | hexagonal | |||
| Space group | (191) | |||
| Temperature (K) | 300 | 120 | 50 | 7 |
| (Å) | 8.018667(16) | 8.006172(15) | 8.04357(3) | 8.04363(3) |
| (Å) | 3.934816(14) | 3.929166(13) | 3.86933(3) | 3.86835(3) |
| (Å3) | 219.1086(10) | 218.1127(9) | 216.8024(19) | 216.7509(18) |
| 1 | ||||
| Density calculated (g/cm3) | 3.7277 | 3.7447 | 3.7674 | 3.7683 |
| wavelength range (Å) | 0.97 - 2.033 | |||
| F(000) | 494.718 | 494.718 | 482.026 | 494.718 |
| Time of flight range (ms) | 11.3 - 315 | |||
| No. of variables | 46 | |||
| RF(obs) | 1.15 | 1.17 | 2.7 | 2.65 |
| RFw(obs) | 1.58 | 1.69 | 4.4 | 4.15 |
| Goodness of fit | 2.8 | 3 | 4.58 | 4.27 |
| Absorption | 0.077(2) | 0.077(2) | 0.078(4) | 0.074(3) |
| Atom | Site | Occupancy | ||||
|---|---|---|---|---|---|---|
| 300 K | ||||||
| Al1 | 3 | ½ | 0 | 0 | 0.0099(2) | 1 |
| Al2 | 6 | 0.21481(4) | 0.42961(8) | ½ | 0.0089(2) | 1 |
| Ba | 1 | 0 | 0 | 0 | 0.0126(3) | 1 |
| Fe | 2 | 0 | 0.0067(1) | 0.984(3) | ||
| 120 K | ||||||
| Al1 | 3 | ½ | 0 | 0 | 0.0059(2) | 1 |
| Al2 | 6 | 0.21484(4) | 0.42968(8) | ½ | 0.0055(2) | 1 |
| Ba | 1 | 0 | 0 | 0 | 0.0064(2) | 1 |
| Fe | 2 | 0 | 0.0045(1) | 0.985(3) | ||
| 50 K | ||||||
| Al1 | 3 | ½ | 0 | 0 | 0.0055(4) | 1 |
| Al2 | 6 | 0.21355(7) | 0.42711(13) | ½ | 0.0077(3) | 1 |
| Ba | 1 | 0 | 0 | 0 | 0.0101(4) | 1 |
| Fe | 2 | 0 | 0.0127(2) | 0.988(5) | ||
| 7 K | ||||||
| Al1 | 3 | ½ | 0 | 0 | 0.0053(3) | 1 |
| Al2 | 6 | 0.21354(6) | 0.42707(12) | ½ | 0.0076(3) | 1 |
| Ba | 1 | 0 | 0 | 0 | 0.0093(4) | 1 |
| Fe | 2 | 0 | 0.0125(2) | 0.985(5) | ||
| Atom | ||||
|---|---|---|---|---|
| 300 K | ||||
| Al1 | 0.0128(3) | 0.0071(4) | 0.0078(4) | 0.00356(18) |
| Al2 | 0.0093(2) | 0.0105(2) | 0.0073(3) | 0.00525(12) |
| Ba | 0.0156(3) | 0.0156(3) | 0.0067(5) | 0.00782(17) |
| Fe | 0.00598(15) | 0.00598(15) | 0.00898(19) | 0.00299(7) |
| 120 K | ||||
| Al1 | 0.0073(3) | 0.0056(3) | 0.0043(3) | 0.00282(17) |
| Al2 | 0.00589(19) | 0.0069(2) | 0.0040(3) | 0.00344(11) |
| Ba | 0.0083(3) | 0.0083(3) | 0.0026(4) | 0.00414(14) |
| Fe | 0.00389(14) | 0.00389(14) | 0.00570(17) | 0.00195(7) |
| 50 K | ||||
| Al1 | 0.0049(4) | 0.0045(5) | 0.0069(6) | 0.0022(3) |
| Al2 | 0.0064(3) | 0.0107(4) | 0.0073(5) | 0.0054(2) |
| Ba | 0.0125(5) | 0.0125(5) | 0.0052(7) | 0.0063(2) |
| Fe | 0.0038(3) | 0.0038(3) | 0.0305(4) | 0.00188(13) |
| 7 K | ||||
| Al1 | 0.0048(4) | 0.0046(5) | 0.0064(5) | 0.0023(2) |
| Al2 | 0.0064(3) | 0.0108(4) | 0.0070(4) | 0.00539(19) |
| Ba | 0.0118(4) | 0.0118(4) | 0.0044(7) | 0.0059(2) |
| Fe | 0.0035(2) | 0.0035(2) | 0.0305(4) | 0.00176(12) |
Mössbauer fits
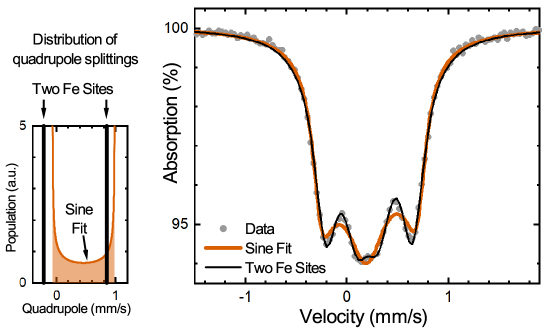
In the results section we note an inconsistency between out Mössbauer spectra from BaFe2Al9 and the charge density wave modulation presented in Fig. 3d. Specifically, the observed super-lattice reflections from single crystal x-ray diffraction signal a simple sine-modulation of the atomic positions. This should give a distribution of Fe atom environments with a range of Mössbauer parameters. For example, a sine-modulation of the quadrupole parameter would yield the orange distribution of values in the left panel of Fig. 7. This contrasts with the discrete pair of values from a fit to the two Fe-site model (thick black line).
We tried to fit the low temperature Mössbauer spectra of BaFe2Al9 with such a modulated model. We summed the spectra of 20 sites with sine-modulated Mössbauer parameters. The maximum and minimum values of the quadrupole splitting, isomer shift and linewidth were allowed to vary and the best fit is given by the orange curve on the right-hand plot of Fig. 7. This fit is distinctly worse than the two iron site model in black presented in the main text.
References
- Momma and Izumi 2011 Momma, K.; Izumi, F. VESTA3 for three-dimensional visualization of crystal, volumetric and morphology data. Journal of Applied Crystallography 2011, 44, 1272–1276
- Bhadeshia and Honeycombe 2006 Bhadeshia, H. K. D. H.; Honeycombe, R. W. K. Steels : microstructure and properties; Elsevier, Butterworth-Heinemann: Amsterdam, 2006
- Orikasa et al. 2013 Orikasa, Y.; Maeda, T.; Koyama, Y.; Murayama, H.; Fukuda, K.; Tanida, H.; Arai, H.; Matsubara, E.; Uchimoto, Y.; Ogumi, Z. Transient phase change in two phase reaction between LiFePO4 and FePO4 under battery operation. Chemistry of Materials 2013, 25, 1032–1039
- Yahia et al. 2013 Yahia, H. B.; Shikano, M.; Kobayashi, H. Phase transition mechanisms in LixCoO2 (0.25 1) based on group-subgroup transformations. Chemistry of Materials 2013, 25, 3687–3701
- Tomforde et al. 2011 Tomforde, J.; Bensch, W.; Kienle, L.; Duppel, V.; Merkelbach, P.; Wuttig, M. Thin films of Ge-Sb-Te-based phase change materials: microstructure and in situ transformation. Chemistry of Materials 2011, 23, 3871–3878
- Bischoff et al. 2017 Bischoff, F.; Auwärter, W.; Barth, J. V.; Schiffrin, A.; Fuhrer, M.; Weber, B. Nanoscale phase engineering of niobium diselenide. Chemistry of Materials 2017, 29, 9907–9914
- Meddar et al. 2012 Meddar, L.; Josse, M.; Maglione, M.; Guiet, A.; La, C.; Deniard, P.; Decourt, R.; Lee, C.; Tian, C.; Jobic, S.; Whangbo, M.-H.; Payen, C. Increasing the phase-transition temperatures in spin-frustrated multiferroic MnWO4 by Mo doping. Chemistry of Materials 2012, 24, 353–360
- Grüner 1994 Grüner, G. Density waves in solids; Perseus Publishing, Cambridge, Mass., 1994
- Burdett 1995 Burdett, J. Chemical bonding in solids; Oxford University Press: New York, NY, 1995
- Hoffmann 1987 Hoffmann, R. How chemistry and physics meet in the solid state. Angewandte Chemie International Edition in English 1987, 26, 846–878
- Owens-Baird et al. 2019 Owens-Baird, B.; Xu, J.; Petrovykh, D. Y.; Bondarchuk, O.; Ziouani, Y.; González-Ballesteros, N.; Yox, P.; Sapountzi, F. M.; Niemantsverdriet, H.; Kolen’ko, Y. V.; Kovnir, K. NiP2: A story of two divergent polymorphic multifunctional materials. Chemistry of Materials 2019, 31, 3407–3418
- Kobayashi et al. 2019 Kobayashi, S.; Katayama, N.; Manjo, T.; Ueda, H.; Michioka, C.; Sugiyama, J.; Sassa, Y.; Forslund, O. K.; Månsson, M.; Yoshimura, K.; Sawa, H. Linear trimer formation with antiferromagnetic ordering in 1T-CrSe2 originating from Peierls-like instabilities and interlayer Se-Se Interactions. Inorganic Chemistry 2019, 58, 14304–14315
- Alemany et al. 2009 Alemany, P.; Llunell, M.; Canadell, E. Host-guest interactions, uniform vs fragmented linear atom chains and likeliness of Peierls distortions in the (Ca7N4)[x] ( = Ag, Ga, In) phases. Inorganic Chemistry 2009, 48, 2919–2931
- Zhu et al. 2017 Zhu, X.; Guo, J.; Zhang, J.; Plummer, E. W. Misconceptions associated with the origin of charge density waves. Advances in Physics: X 2017, 2, 622–640
- Grüner 1988 Grüner, G. The dynamics of charge-density waves. Reviews of Modern Physics 1988, 60, 1129–1181
- Johannes and Mazin 2008 Johannes, M. D.; Mazin, I. I. Fermi surface nesting and the origin of charge density waves in metals. Physical Review B 2008, 77, 165135
- Chikina et al. 2020 Chikina, A.; Fedorov, A.; Bhoi, D.; Voroshnin, V.; Haubold, E.; Kushnirenko, Y.; Kim, K. H.; Borisenko, S. Turning charge-density waves into Cooper pairs. npj Quantum Materials 2020, 5, 22
- Chen et al. 2016 Chen, C.-W.; Choe, J.; Morosan, E. Charge density waves in strongly correlated electron systems. Reports on Progress in Physics 2016, 79, 084505
- Duvjir et al. 2018 Duvjir, G. et al. Emergence of a metal-insulator transition and high-temperature charge-density waves in VSe2 at the monolayer limit. Nano Letters 2018, 18, 5432–5438
- Malliakas and Kanatzidis 2013 Malliakas, C. D.; Kanatzidis, M. G. Nb-Nb interactions define the charge density wave structure of 2H-NbSe2. Journal of the American Chemical Society 2013, 135, 1719–1722
- Duong et al. 2017 Duong, D. L.; Ryu, G.; Hoyer, A.; Lin, C.; Burghard, M.; Kern, K. Raman characterization of the charge density wave phase of 1T-TiSe2: From bulk to atomically thin layers. ACS Nano 2017, 11, 1034–1040
- Wilson et al. 1975 Wilson, J. A.; Salvo, F. J. D.; Mahajan, S. Charge-density waves and superlattices in the metallic layered transition metal dichalcogenides. Advances in Physics 1975, 24, 117–201
- Rossnagel 2011 Rossnagel, K. On the origin of charge-density waves in select layered transition-metal dichalcogenides. Journal of Physics: Condensed Matter 2011, 23, 213001
- Bianco et al. 2019 Bianco, R.; Errea, I.; Monacelli, L.; Calandra, M.; Mauri, F. Quantum enhancement of charge density wave in NbS2 in the two-dimensional limit. Nano Letters 2019, 19, 3098–3103
- Fu et al. 2016 Fu, W.; Chen, Y.; Lin, J.; Wang, X.; Zeng, Q.; Zhou, J.; Zheng, L.; Wang, H.; He, Y.; He, H.; Fu, Q.; Suenaga, K.; Yu, T.; Liu, Z. Controlled synthesis of atomically thin 1T-TaS2 for tunable charge density wave phase transitions. Chemistry of Materials 2016, 28, 7613–7618
- Feng et al. 2018 Feng, J. et al. Electronic structure and enhanced charge-density wave order of monolayer VSe2. Nano Letters 2018, 18, 4493–4499
- Fumega et al. 2020 Fumega, A. O.; Phillips, J.; Pardo, V. Controlled two-dimensional ferromagnetism in 1T-CrTe2: The role of charge density wave and strain. The Journal of Physical Chemistry C 2020, 124, 21047–21053
- Xi et al. 2015 Xi, X.; Zhao, L.; Wang, Z.; Berger, H.; Forró, L.; Shan, J.; Mak, K. F. Strongly enhanced charge-density-wave order in monolayer NbSe2. Nature Nanotechnology 2015, 10, 765–769
- Whangbo and Gressier 1984 Whangbo, M. H.; Gressier, P. Characterization of the charge density waves in niobium triselenide (NbSe3) by band electronic structure. Inorganic Chemistry 1984, 23, 1305–1306
- Hor et al. 2005 Hor, Y. S.; Xiao, Z. L.; Welp, U.; Ito, Y.; Mitchell, J. F.; Cook, R. E.; Kwok, W. K.; Crabtree, G. W. Nanowires and nanoribbons of charge-density-wave conductor NbSe3. Nano Letters 2005, 5, 397–401
- Weber et al. 2011 Weber, F.; Rosenkranz, S.; Castellan, J.-P.; Osborn, R.; Hott, R.; Heid, R.; Bohnen, K.-P.; Egami, T.; Said, A. H.; Reznik, D. Extended phonon collapse and the origin of the charge-density wave in 2H-NbSe2. Physical Review Letters 2011, 107, 107403
- Arguello et al. 2014 Arguello, C. J.; Chockalingam, S. P.; Rosenthal, E. P.; Zhao, L.; Gutiérrez, C.; Kang, J. H.; Chung, W. C.; Fernandes, R. M.; Jia, S.; Millis, A. J.; Cava, R. J.; Pasupathy, A. N. Visualizing the charge density wave transition in 2H-NbSe2 in real space. Physical Review B 2014, 89, 235115
- Shimomura et al. 2019 Shimomura, S.; Murao, H.; Tsutsui, S.; Nakao, H.; Nakamura, A.; Hedo, M.; Nakama, T.; Ōnuki, Y. Lattice modulation and structural phase transition in the antiferromagnet EuAl4. Journal of the Physical Society of Japan 2019, 88, 014602
- Turban and Schäfer 1975 Turban, K.; Schäfer, H. Zur kenntnis des BaFe2Al9-strukturtyps: Ternäre aluminide AT2Al9 MIT A = Ba, Sr und T = Fe, Co, Ni. Journal of the Less Common Metals 1975, 40, 91–96
- Manyako et al. 1988 Manyako, I. B.; Yanson, T. I.; Zarechnyuk, O. S. Phase equilibria in the Ca-Co(Ni)-Al systems at 700 K. Izv. Akad. Nauk SSSR, Met. 1988, 3, 185–188
- Thiede and Jeitschko 1999 Thiede, V. M. T.; Jeitschko, W. Crystal structure of europium cobalt aluminide (1/2/9), EuCo2Al9. Zeitschrift für Kristallographie - New Crystal Structures 1999, 214, 149–150
- Lei et al. 2009 Lei, X.-W.; Zhong, G.-H.; Li, L.-H.; Hu, C.-L.; Li, M.-J.; Mao, J.-G. Eu3Co2In15 and K2In9 ( = Co, Ni): 3D frameworks based on transition metal centered In9 clusters. Inorganic Chemistry 2009, 48, 2526–2533
- Calta et al. 2015 Calta, N. P.; Han, F.; Kanatzidis, M. G. Synthesis, structure, and rigid unit mode-like anisotropic thermal expansion of BaIr2In9. Inorganic Chemistry 2015, 54, 8794–8799
- Vajenine and Hoffmann 1998 Vajenine, G. V.; Hoffmann, R. Magic electron counts for networks of condensed clusters: Vertex-sharing aluminum octahedra. Journal of the American Chemical Society 1998, 120, 4200–4208
- Bergerhoff and Brown 1987 Bergerhoff, G.; Brown, I. D. Crystallographic databases. International Union of Crystallography, Chester 1987, 360, 77–95
- Jain et al. 2013 Jain, A.; Ong, S. P.; Hautier, G.; Chen, W.; Richards, W. D.; Dacek, S.; Cholia, S.; Gunter, D.; Skinner, D.; Ceder, G.; Persson, K. A. Commentary: The Materials Project: A materials genome approach to accelerating materials innovation. APL Materials 2013, 1, 011002
- Canfield et al. 2016 Canfield, P. C.; Kong, T.; Kaluarachchi, U. S.; Jo, N. H. Use of frit-disc crucibles for routine and exploratory solution growth of single crystalline samples. Philosophical Magazine 2016, 96, 84–92
- Huq et al. 2019 Huq, A.; Kirkham, M.; Peterson, P. F.; Hodges, J. P.; Whitfield, P. S.; Page, K.; Hűgle, T.; Iverson, E. B.; Parizzi, A.; Rennich, G. POWGEN: rebuild of a third-generation powder diffractometer at the Spallation Neutron Source. Journal of Applied Crystallography 2019, 52, 1189–1201
- Petříček et al. 2014 Petříček, V.; Dušek, M.; Palatinus, L. Crystallographic computing system JANA2006: general features. Zeitschrift für Kristallographie - Crystalline Materials 2014, 229, 345
- 45 CrysAlisPRO. Oxford Diffraction/Agilent Technologies UK Ltd, Yarnton, England
- Kresse and Joubert 1999 Kresse, G.; Joubert, D. From ultrasoft pseudopotentials to the projector augmented-wave method. Physical Review B 1999, 59, 1758–1775
- Perdew et al. 1996 Perdew, J. P.; Burke, K.; Ernzerhof, M. Generalized gradient approximation made simple. Physical Review Letters 1996, 77, 3865–3868
- Kresse and Furthmüller 1996 Kresse, G.; Furthmüller, J. Efficiency of ab-initio total energy calculations for metals and semiconductors using a plane-wave basis set. Computational Materials Science 1996, 6, 15–50
- Blundell 2001 Blundell, S. Magnetism in condensed matter; Oxford University Press, USA, 2001
- Kittel 2004 Kittel, C. Introduction to solid state physics, eighth ed.; John Wiley & Sons Inc: Hoboken, NJ, 2004
- Ryżyńska et al. 2020 Ryżyńska, Z.; Klimczuk, T.; Winiarski, M. J. Single crystal growth and physical properties of Co2Al9 (= Sr, Ba). Journal of Solid State Chemistry 2020, 289, 121509
- Stokes et al. Sep 2020 Stokes, H. T.; Hatch, D. M.; Campbell, B. J. ISODISTORT, ISOTROPY software suite, version 6.7.2. Sep 2020; iso.byu.edu
- Campbell et al. 2006 Campbell, B. J.; Stokes, H. T.; Tanner, D. E.; Hatch, D. M. ISODISPLACE: a web-based tool for exploring structural distortions. Journal of Applied Crystallography 2006, 39, 607–614
- Boucher et al. 1996 Boucher, F.; Evain, M.; Petříček, V. Incommensurately modulated structure of TaGe0.354Te2: application of crenel functions. Acta Crystallographica Section B Structural Science 1996, 52, 100–109
- Steiner et al. 2018 Steiner, S.; Michor, H.; Sologub, O.; Hinterleitner, B.; Höfenstock, F.; Waas, M.; Bauer, E.; Stöger, B.; Babizhetskyy, V.; Levytskyy, V.; Kotur, B. Single-crystal study of the charge density wave metal LuNiC2. Physical Review B 2018, 97, 205115
- Roman et al. 2018 Roman, M.; Strychalska-Nowak, J.; Klimczuk, T.; Kolincio, K. K. Extended phase diagram of RNiC2 family: Linear scaling of the Peierls temperature. Physical Review B 2018, 97, 041103
- Candolfi et al. 2020 Candolfi, C.; Míšek, M.; Gougeon, P.; Orabi, R. A. R. A.; Gall, P.; Gautier, R.; Migot, S.; Ghanbaja, J.; Kaštil, J.; Levinský, P.; Hejtmánek, J.; Dauscher, A.; Malaman, B.; Lenoir, B. Coexistence of a charge density wave and superconductivity in the cluster compound K2Mo15Se19. Physical Review B 2020, 101, 134521
- Gourdon et al. 2000 Gourdon, O.; Hanko, J.; Boucher, F.; Petricek, V.; Whangbo, M.-H.; Kanatzidis, M. G.; Evain, M. A unique distortion in K1/3Ba2/3AgTe2: X-ray diffraction determination and electronic band structure analysis of its incommensurately modulated structure. Inorganic Chemistry 2000, 39, 1398–1409
- Ramakrishnan et al. 2020 Ramakrishnan, S.; Schönleber, A.; Rekis, T.; van Well, N.; Noohinejad, L.; van Smaalen, S.; Tolkiehn, M.; Paulmann, C.; Bag, B.; Thamizhavel, A.; Pal, D.; Ramakrishnan, S. Unusual charge density wave transition and absence of magnetic ordering in Er2Ir3Si5. Physical Review B 2020, 101, 060101
- Singh et al. 2005 Singh, Y.; Pal, D.; Ramakrishnan, S.; Awasthi, A. M.; Malik, S. K. Phase transitions in Lu2Ir3Si5. Physical Review B 2005, 71, 045109
- Sangeetha et al. 2012 Sangeetha, N. S.; Thamizhavel, A.; Tomy, C. V.; Basu, S.; Awasthi, A. M.; Ramakrishnan, S.; Pal, D. Interplay of superconductivity and charge density wave ordering in pseudoternary alloy compounds: Lu2Ir3(Si1-xGex)5, Lu2(Ir1-xRhx)3Si5, and (Lu1-xScx)2Ir3Si5. Physical Review B 2012, 86, 024524
- Bugaris et al. 2017 Bugaris, D. E.; Malliakas, C. D.; Han, F.; Calta, N. P.; Sturza, M.; Krogstad, M. J.; Osborn, R.; Rosenkranz, S.; Ruff, J. P. C.; Trimarchi, G.; Bud’ko, S. L.; Balasubramanian, M.; Chung, D. Y.; Kanatzidis, M. G. Charge density wave in the new polymorphs of RE2Ru3Ge5 (RE = Pr, Sm, Dy). Journal of the American Chemical Society 2017, 139, 4130–4143
- Kuo et al. 2001 Kuo, Y.-K.; Lue, C. S.; Hsu, F. H.; Li, H. H.; Yang, H. D. Thermal properties of Lu5Ir4Si10 near the charge-density-wave transition. Physical Review B 2001, 64, 125124
- Kuo et al. 2003 Kuo, Y.-K.; Hsu, F. H.; Li, H. H.; Huang, H. L.; Huang, C. W.; Lue, C. S.; Yang, H. D. Ionic size and atomic disorder effects on the charge-density-wave transitions in 5Ir4Si10 (= Dy-Lu). Physical Review B 2003, 67, 195101
- Lue et al. 2002 Lue, C. S.; Kuo, Y.-K.; Hsu, F. H.; Li, H. H.; Yang, H. D.; Fodor, P. S.; Wenger, L. E. Thermal hysteresis in the charge-density-wave transition of Lu5Rh4Si10. Physical Review B 2002, 66, 033101
- Yang et al. 1991 Yang, H. D.; Klavins, P.; Shelton, R. N. Phase transitions in the superconducting compound Lu5Rh4Si10 at ambient and high pressure. Physical Review B 1991, 43, 7676–7680
- Klintberg et al. 2012 Klintberg, L. E.; Goh, S. K.; Alireza, P. L.; Saines, P. J.; Tompsett, D. A.; Logg, P. W.; Yang, J.; Chen, B.; Yoshimura, K.; Grosche, F. M. Pressure- and composition-induced structural quantum phase transition in the cubic superconductor (Sr,Ca)3Ir4Sn13. Physical Review Letters 2012, 109, 237008
- Welsch et al. 2019 Welsch, J.; Ramakrishnan, S.; Eisele, C.; van Well, N.; Schönleber, A.; van Smaalen, S.; Matteppanavar, S.; Thamizhavel, A.; Tolkiehn, M.; Paulmann, C.; Ramakrishnan, S. Second-order charge-density-wave transition in single crystals of La3Co4Sn13. Physical Review Materials 2019, 3, 125003
- Khoury et al. 2020 Khoury, J. F.; Rettie, A. J. E.; Robredo, I.; Krogstad, M. J.; Malliakas, C. D.; Bergara, A.; Vergniory, M. G.; Osborn, R.; Rosenkranz, S.; Chung, D. Y.; Kanatzidis, M. G. The subchalcogenides Ir2In8 ( = S, Se, Te): Dirac semimetal candidates with re-entrant structural modulation. Journal of the American Chemical Society 2020, 142, 6312–6323
- Nagano et al. 2013 Nagano, Y.; Araoka, N.; Mitsuda, A.; Yayama, H.; Wada, H.; Ichihara, M.; Isobe, M.; Ueda, Y. Charge density wave and superconductivity of Pt2Si2 ( = Y, La, Nd, and Lu). Journal of the Physical Society of Japan 2013, 82, 064715
- Ikeda et al. 2005 Ikeda, N.; Ohsumi, H.; Ohwada, K.; Ishii, K.; Inami, T.; Kakurai, K.; Murakami, Y.; Yoshii, K.; Mori, S.; Horibe, Y.; Kitô, H. Ferroelectricity from iron valence ordering in the charge-frustrated system LuFe2O4. Nature 2005, 436, 1136–1138
- Walz 2002 Walz, F. The Verwey transition - a topical review. Journal of Physics: Condensed Matter 2002, 14, R285–R340