PKS 1830211: OH and H i at and the first MeerKAT UHF spectrum
The Large Survey Project (LSP) ”MeerKAT Absorption Line Survey” (MALS) is a blind H i 21-cm and OH 18-cm absorption line survey in the L- and UHF-bands, with the primary goal to better determine the occurrence of atomic and molecular gas in the circum-galactic and inter-galactic medium, and its redshift evolution. Here we present the first results using the UHF-band, obtained towards the strongly lensed radio source PKS 1830211, detecting absorption produced by the lensing galaxy. With merely 90 mins of data acquired on-source for science verification and processed using the Automated Radio Telescope Imaging Pipeline (ARTIP), we detect in absorption the known H i 21-cm and OH 18-cm main lines at at an unprecedented signal-to-noise ratio (4000 in the continuum, in each 6 km s-1 wide channel). For the first time we report the detection at of OH satellite lines, so far not detected at . We decompose the OH lines into a thermal and a stimulated contribution, where the 1612 and 1720 MHz lines are conjugate. The total OH 1720 MHz emission line luminosity is 6100 L⊙. This is the most luminous known 1720 MHz maser line. It is also among the highest luminosities for the OH-main lines megamasers. The absorption components of the different images of the background source sample different light paths in the lensing galaxy, and their weights in the total absorption spectrum are expected to vary in time, on daily and monthly time scales. We compare our normalized spectra with those obtained more than 20 yrs ago, and find no variation, in spite of the high signal-to-noise ratios. We interpret the absorption spectra with the help of a lens galaxy model, derived from an N-body hydro-dynamical simulation, with a morphology similar to its optical HST image. The resulting absorption lines depend mainly on the background continuum, and the radial distribution of the gas surface density, for each atomic /molecular species. We show that it is possible to reproduce the observations assuming a realistic spiral galaxy disk, without invoking any central gas outflows. There are, however, distinct and faint high-velocity features in the ALMA millimeter absorption spectra, that most likely originate from high-velocity clouds or tidal features. These clouds may contribute to broaden the H i and OH spectra.
Key Words.:
galaxies: ISM, quasars: absorption lines, quasars: individual: PKS 18302111 Introduction
PKS 1830211 is a highly reddened radio quasar at z=2.51 (Lidman et al. 1999), and also the brightest known radio lens in the sky. It was identified as a gravitational lens on the basis of its peculiar radio spectrum and morphology (Pramesh Rao & Subrahmanyan 1988; Jauncey et al. 1991). Its morphology (see the Appendix) reveals two compact radio components, called North-East (NE) and South-West (SW), separated by one arcsecond and surrounded by a low surface-brightness Einstein ring, meaning that the background radio-source and the lens center are well aligned along the line of sight. The two compact components have a relatively flat spectrum, with a spectral index consistent with synchrotron emission, while the ring spectrum is steeper, such that at low frequency ( 1.7 GHz) the ring is contributing more significantly to the total flux density. Since, in projection the line of sight of PKS 1830211 is very close to the Galactic plane (galactic latitude = ), and confused with stars, for a long time it was difficult to optically identify the lensing galaxy (Courbin et al. 1998). The redshift of the lensing galaxy was discovered through molecular absorption (Wiklind & Combes 1996), and it was determined that most of this absorption comes from the SW image, kpc from the center (Frye et al. 1997). There is also a much weaker molecular absorption at V=150 km s-1 towards the NE image, in the opposite direction at 5 kpc from the center of the nearly face-on lensing galaxy (Wiklind & Combes 1998; Koopmans & de Bruyn 2005). Throughout this paper, the velocity scale is defined with respect to (heliocentric reference frame), which corresponds to the main molecular (e.g., CO, HCO+, and HCN) absorption components detected at mm wavelengths (Wiklind & Combes 1998).
The apparent size of the lensed images of the quasar at mm wavelengths is a fraction of a milliarcsecond (Jin et al. 2003; Guirado et al. 1999), implying that the molecular absorption could be originating from a single molecular cloud of a few pc in size. However, due to the thickness of the gaseous plane along the line of sight, the pencil beam from the quasar core travels several hundreds of pc in the galaxy, and encounters many clouds along the line of sight, covering a large velocity gradient. This broadens the absorption spectrum because the gas actually involved in the absorption traces the velocity gradient over 1 kpc in the disk. H i 21-cm and OH 18-cm main absorption lines have also been detected at (Chengalur et al. 1999; Koopmans & de Bruyn 2005).
It is worth noting that PKS 1830211 also traces an H i 21-cm absorber at (Lovell et al. 1996; Allison et al. 2017), albeit with a smaller velocity width. The 90% of the total 21-cm optical depth () of the low redshift absorber is contained within 86 km s-1 (Gupta et al. 2021).
The absorber at is particularly rich in molecules and also in dust. A strong absorption at rest-frame 10m reveals amorphous or crystalline silicates (Aller et al. 2012). More than sixty molecular species associated with this absorber have been detected towards the SW component, where the inferred H2 column density is cm-2 (Muller et al. 2011, 2014; Tercero et al. 2020). In contrast, only 19 species, including atomic hydrogen and carbon, have been detected towards the NE component (at 5 kpc from the center), where the molecular gas has a lower column density by an order of magnitude and is more diffuse. On the contrary, at 18-21 cm wavelengths, it is the NE component which has the stronger absorption signal (Chengalur et al. 1999; Koopmans & de Bruyn 2005). The absorption spectrum peaks at km s-1, and is relatively weaker at km s-1. This suggests that, towards the center of the lensing galaxy (SW at 3 kpc), the gas phase is mostly molecular and the H i is depleted. Compared to the mm-absorptions, the broader linewidths of 280 km s-1 and 150 km s-1 (FWHM) for H i and OH cm-absorption, respectively, at are explained by the larger thickness of the H i or OH plane, and to some extent by the more extended background radio continuum at lower frequencies.
Such a strong lens system should be useful to determine the Hubble constant, through the cosmography method or time-delay between the images. However, it is then necessary to precisely determine the mass distribution of the lens, which has been difficult, because of extinction and confusion with Milky Way stars (Courbin et al. 2002; Winn et al. 2002). Even the determination of the center of the lensing galaxy is problematic, and two models have been developed, with a bright peak at the center of the lens being a nearby star (Courbin et al. 2002) or the bulge of the lensing galaxy (Winn et al. 2002). The detection of several absorption components at different velocities, towards the different images helps to determine the geometry of the lens, which is a nearly face-on spiral galaxy (Wiklind & Combes 1998). Recently, the detection of a third lensed image of PKS 1830211 with ALMA by Muller et al. (2020) has brought more constraints leading to the refinement of the lens model.
Due to its very strong radio continuum and absorption lines, PKS 1830211 is also one of the favorite targets for science verification at various radio telescopes. Very recently it was observed as part of the preparation for the MeerKAT Absorption Line Survey (MALS) to demonstrate the spectral line capabilities of MeerKAT. MALS has begun MeerKAT science verification and proper survey observations using the L- and UHF-bands covering 900-1670 MHz and 580-1015 MHz, respectively (Gupta et al. 2017). Owing to the excellent sensitivity of MeerKAT (Jonas & MeerKAT Team 2016; Camilo et al. 2018; Mauch et al. 2020), the L-band spectrum of PKS 1830211 presented in Gupta et al. (2021) provided a robust characterization of H i 21-cm (from ) and OH 18-cm main absorption lines from . Here, we present the first MeerKAT UHF-band spectrum that simultaneously covers both H i and all four OH 18-cm lines for the system. We report for the first time the detection of the OH satellite lines.
This paper is structured as follows. Section 2 presents the details of the observations and data analysis with ARTIP. The results in terms of optical depths and column densities are quantified in Section 3, where we discuss the origin of the various absorption components in comparison with the dense molecular gas absorptions, and present a lens-galaxy model. Section 4 summarises our conclusions. To compute distances, we adopt a flat CDM cosmology, with =0.29, =0.71, and the Hubble constant H0 = 70 km s-1Mpc-1. At the distance of the PKS 1830211 absorber, an arcsecond corresponds to 7.8 kpc, in physical units.
2 Observations and data analysis
The field centered at PKS 1830211 was observed on July 13, 2020 using the MeerKAT-64 array and 32K mode of the SKA Reconfigurable Application Board (SKARAB) correlator. For these UHF-band science verification observations, the total observable bandwidth of 544 MHz was split into 32768 frequency channels. This corresponds to a frequency resolution of 16.602 kHz, or 6.1 km s-1 at the center of the band i.e., 815.9917 MHz. The correlator dump time was 8 seconds and the data were acquired for all 4 polarization products, labelled as XX, XY, YX and YY. Of the 64 antennas, 56 participated in these observations. The baseline lengths in the dataset are in the range: 29 - 7300 m. We also observed PKS 1934-638 and 3C286 for flux density and bandpass calibrations. Since PKS 1830211 is a bonafide gain calibrator for the VLA in the C- and D- array configurations, there was no need to separately observe a complex gain calibrator. The total on-source time on PKS 1830211 and duration of the observations are 90 and 155 mins, respectively. The full dataset in measurement set format is about 3.1 TB.
Here we are interested only in the Stokes- properties of the target, therefore for processing we generated a measurement set consisting of only XX and YY polarization products. We also dropped the extreme 1024 frequency channels at both edges of the band. The resulting data set consisting of 30720 channels, was processed on the VROOM cluster at IUCAA using the latest version of the Automated Radio Telescope Imaging Pipeline ARTIP based on CASA 5.6.2. The details of ARTIP and data processing steps are provided in Gupta et al. (2021). In short, an initial RFI mask was applied to the data to mask the strongest radio frequency interference (RFI) in the band. Up to this stage, only 10.0% of the bandwidth gets flagged. After this step, the data were further flagged and calibrated using the ARTIP-CAL package. The spectral-line processing of calibrated visibilities was done using the ARTIP-CUBE package. The final continuum-subtracted spectrum of PKS 1830211 is shown in Fig. 1. The gray-shaded regions in the figure mark the above-mentioned initial RFI mask. For the ARTIP-CUBE processing, the frequency band was partitioned into 15 spectral windows (SPW) with an overlap of 256 frequency channels. The unique frequency ranges covered by these measurement sets are marked by dashed vertical lines in Fig. 1. For easier referencing, we refer to these as SPW-0 to -14.
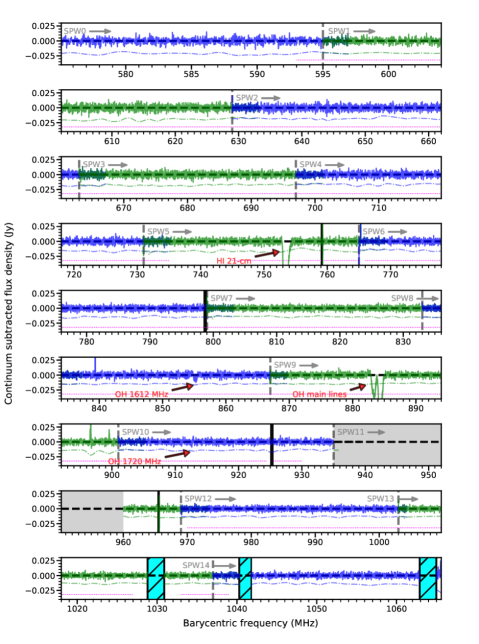
Recall that prior to any flagging and calibrations the 935 - 960 MHz range was flagged to mask persistent strong RFI. However, the spectral line processing revealed some additional RFI. Specifically, we find the following frequency ranges to be persistently affected by RFI: 759.1 - 759.2, 798.6 - 798.9, 925.1 - 925.3, 965.5 - 965.6, 1028.8 - 1030.9, 1040.3 - 1041.8 and 1062.9 - 1065.0 MHz (see hatched regions in Fig. 1). We also find a few frequency ranges to be affected by sporadic RFI. These are at 735.275, 765.28, 896.6, 899.294 - 899.404 and 928.0 - 935.0 MHz, and often accompanied by positive / negative spikes in the spectra. The spike at 839 MHz is caused by the known H i 21-cm absorption line in the spectrum of the bandpass calibrator (3C286; Wolfe et al. 2008). Nevertheless, as shown in Fig. 1 the UHF spectrum is spectacularly clean, and we detect the known H i 21-cm and OH 18-cm main lines at . Due to the excellent sensitivity, the MeerKAT spectrum has also led to the detection of OH satellite lines (further details in Section 3).
For continuum imaging through the ARTIP-CONT package, a more stringent RFI mask to completely exclude band edges and RFI-afflicted regions was applied to the calibrated visibilities (see horizontal dotted lines in Fig. 1). The data were then averaged in frequency over 32 channels (0.531 MHz) and regridded along the frequency axis into 16 distinct spectral windows. We created a widefield broad band 6k6k continuum image with a pixel size of , spanning using tclean in CASA. The w-projection algorithm was used as the gridding algorithm in combination with Multi-scale Multi-term Multi-frequency synthesis (MTMFS) for deconvolution, with nterms = 2 and four pixel scales to model the extended emission (cf. Rau & Cornwell 2011; Bhatnagar et al. 2013; Jagannathan et al. 2017). Two rounds of phase-only self-calibration were carried out along with a final round of amplitude and phase self-calibration. Imaging masks were appropriately adjusted using PyBDSF between major cycles during imaging and self-calibration (Mohan & Rafferty 2015).
The final continuum image of PKS 1830211 constructed using robust=0 weighting has a synthesized beam of with a position angle = . The rms noise in the continuum image is 80 Jy/beam close to the bright radio source at the center and 30 Jy/beam (dynamic range 380000) away from it. The total continuum flux density of the quasar is 11.40 0.01 Jy at the reference frequency of 832 MHz. The quoted uncertainty on the flux density corresponds to errors from the single Gaussian component fitted to the continuum image. Note that the flux density accuracy at these low frequencies is expected to be about 5%. The flux density at 832 MHz is within 1.3% of the flux density of 11.25 Jy measured at 1270 MHz by Gupta et al. (2021) from the MeerKAT L-band data acquired on December 19, 2019. However, note that in general the quasar is known to be variable at radio wavelengths111Over 1996-2016, the flux density at GHz varied between 10-14 Jy (cf. Fig. 7 of Allison et al. 2017). The in-band integrated spectral index is = 0.004 .
3 Results
3.1 OH absorption
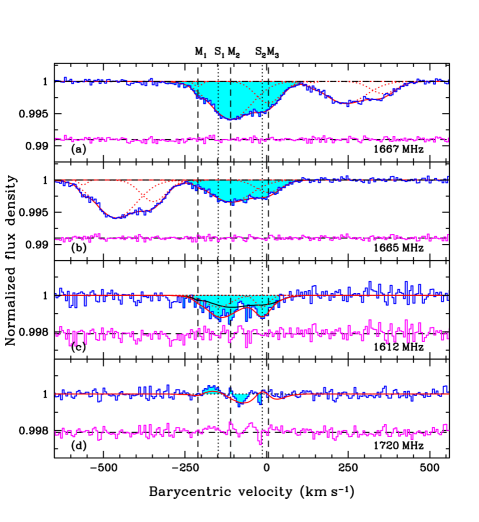
The OH main lines with rest frequencies of 1665 and 1667 MHz are clearly seen in the first MeerKAT UHF-band spectrum (580-1015 MHz) presented here (see Fig. 1). We zoom in on these in the top two panels of Fig. 2. These lines were also detected in the overlapping L-band (900-1670 MHz) spectrum obtained with MeerKAT on December 19, 2019 (Gupta et al. 2021). The absorption obtained from the first UHF spectrum presented here is in good agreement with the L-band profile (see Section 3.3 for details on variability). In our L-band observations, the 1720 MHz line redshifted to 912 MHz was also covered but only tentatively detected due to low-SNR and hence not claimed. The redshifted 1612 MHz line was outside the L-band. With the present UHF-spectrum, we have clearly detected the 1612 MHz line (redshifted to 855 MHz). Combining the L- and the UHF-band spectra with appropriate rms weights, we now also detect the 1720 MHz line at a greater significance. Recall that the redshifted satellite line frequencies are unaffected by RFI (see Section 2). The profiles of the two satellite lines are presented in the bottom two panels of the figure.
This is the first time the OH satellite lines have been detected towards PKS 1830211. This is also the highest redshift so far at which the OH satellite lines have been detected. The detection of all four OH 18-cm lines from the same spectrum allows us to investigate the nature of the absorbing gas without worrying about the line variability. Further, due to the proximity of the 18-cm lines in the frequency space the structure of the background radio continuum illuminating the absorbing gas can be assumed to be the same.
The integrated optical depths of the main i.e., 1665 and 1667 MHz lines are 0.729 0.012 and 1.301 0.013 km s-1, respectively. 90% of the total optical depth () of the 1667 MHz line is contained within 265 km s-1. For an optically thin cloud, the integrated OH optical depth of the 1667 MHz line is related to the OH column density (OH) through
| (1) |
where is the excitation temperature in Kelvin, () is the optical depth of the 1667 MHz line at velocity , and is the covering factor (e.g., Liszt & Lucas 1996). Adopting = 5.14 K i.e., coupled to the cosmic microwave background (CMB), at , we estimate (OH) = () cm-2. Note that this is a surface average, since it is likely that the filling factor is below 1.
| Id. | Centre | ||
| (km s-1) | (km s-1) | () | |
| 1667 MHz absorption | |||
| M1 | -211 3 | 12 4 | 0.8 0.1 |
| M2 | -110 3 | 63 3 | 5.9 0.1 |
| M3 | 6 3 | 40 2 | 3.3 0.3 |
| 1665 MHz absorptiona𝑎aa𝑎aThe centers and widths of corresponding components fitted to the main lines are tied. | |||
| M1 | - | - | 0.2 0.1 |
| M2 | - | - | 3.4 0.1 |
| M3 | - | - | 1.9 0.2 |
| Excess 1612 MHz absorption | |||
| S1 | -148 6 | 39 6 | 0.6 0.1 |
| S2 | -13 5 | 21 5 | 0.6 0.1 |
In local thermodynamic equilibrium (LTE), the relative strengths of 18-cm lines are expected to follow the ratio, 1612:1665:1667:1720 MHz = 1:5:9:1. The total integrated optical depths of the main lines are remarkably consistent with the LTE ratio. To explore this further, we model the two main lines using multiple Gaussian components. Assuming that these lines originate from the same gas, we tie the centers and widths of the corresponding components. The overall profiles are reasonably modeled by a three-component fit (reduced ), which is summarized in Table 2. The individual components marked as M1, M2 and M3, and the resultant fit along with the residuals are plotted in Fig. 2 (see panels (a) and (b)). Unsurprisingly, the total absorption in components M2 and M3 which account for 98% of the total optical depth is consistent with the LTE ratio. The component M1 is weak and it is difficult to probe its excitation character. Note that the excitation temperature of the 1.6 GHz OH transitions could be quite different from , especially in the case of far-infrared and/or collisional pumping (see below), and our assumption is conservative, although supported by the LTE ratios of the main lines.
If the OH ground state levels are indeed thermalized, the gas producing 1667 MHz absorption will have 9 times weaker opacity at the 1612 MHz line velocities. The absorption profile for the 1612 MHz line based on M1 to M3 is represented by solid (black) lines in Fig. 2 (panel (c)). Clearly, the gas that produces absorption in the main lines can only account for 61% of the absorption in the satellite line. The remaining excess absorption can be modelled using two components S1 and S2 given in Table 2. It appears that the satellite lines have a large contribution due to pumping that leads to non-thermal and possibly even inverted level populations. Comparing the two satellite lines, it is clear also that the non-thermal part of the 1612 MHz line has a deficiency of absorption near -80 km s-1, due to emission (see bottom of Fig. 2).
Under certain excitation conditions, in particular pumping from far-infrared radiation around 119m, the OH levels of the ground state (i.e. ) can be inverted. In particular the upper level of the 1720 MHz transition can be highly populated (as the 1612 MHz transition’s lower level), triggering maser emission. Then the satellite OH lines can exhibit ”conjugate” behaviour i.e., as mentioned above the gas exhibiting absorption in one line produces emission in the other. This peculiar feature of the OH levels due to lambda-doubling and hyperfine structure is a precious tool for probing fundamental physical constants (Darling 2003; Chengalur & Kanekar 2003; Kanekar et al. 2018). Despite the limited SNR, the 1720 MHz profile presented in the bottom panel of Fig. 2 shows both emission and absorption features suggesting such a behavior. When the two satellite lines are perfectly conjugate, the sum of their optical depths is zero. The solid red line in the bottom panel of Fig. 2 corresponds to the sum of (i) absorption due to M1, M2 and M3 under LTE, and (ii) absorption due to and assuming perfect conjugate behavior. This simple model provides a reasonable representation of the observed 1720 MHz profile.
Note that the redshifted 1720 MHz line frequency is covered in both the L- and UHF-bands of MeerKAT. Indeed, the spectral features seen in panel (d) of Fig. 2 are also present in our L-band dataset (Gupta et al. 2021). The 1720 MHz profile presented here is already the weighted average of the spectra from the L-band data described in Gupta et al. (2021) and the present UHF-band data. Further investigation into the nature of the satellite lines and the perfection of the conjugate behavior will require a more sensitive spectrum.
However, already the 1720 MHz line profile suggests that the conjugate behavior flips across at approximately -100 km s-1, i.e., at velocities -100 km s-1 it shows emission and at higher velocities absorption. Such flipping has been observed in both galactic and extragalactic systems (see e.g., cases of Centaurus A and NGC 253; van Langevelde et al. 1995; Frayer et al. 1998). The flipping crucially depends on whether the OH molecules are pumped by the rotational intra-ladder transition at 119 m, in which case the 1720 MHz line shows emission and 1612 MHz absorption, or by the cross-ladder rotational transition at 79 m, in which case the opposite happens (see Elitzur 1976, especially Fig. 1). Since, as explained in Frayer et al. (1998), the intra-ladder transition becomes optically thick much sooner ((OH)/V cm-2 km-1 s) than the cross-ladder transition ((OH)/V cm-2 km-1 s), the observed behavior for PKS 1830211 implies that the gas exhibiting conjugate behavior at velocities km s-1 has higher OH column density than at km s-1. Notably, we do not see any significant masing features in 1720 MHz line at velocities km s-1 i.e., closer to the center of the lensing galaxy where denser gas tracers such as CO(5-4) or HCO+(2-1) lines towards the SW image have been detected (Muller et al. 2014).
Finally, the emission component at km s-1, which is barely detected at 3 in the 1720 MHz line, has a total line flux density of 0.0370.011 Jy km s-1. At , this corresponds to an enormous line luminosity of 6100 L⊙, which is 20 times more luminous than the previously brightest known 1720 MHz maser associated with PKS 1413+135 at (Kanekar et al. 2004; Darling 2004). In the latter source, the OH-main lines are detected in absorption, but not at the same velocity as the satellite lines, therefore originating from a different gas component. It is interesting to note that the OH-main lines absorption was not detected at the same time either. Kanekar et al. (2004) observed the satellite lines in June 2003 with the WSRT (Westerbork Synthesis Radio Telescope), and the main lines in October 2001 with the GMRT (Giant Metrewave Radio Telescope). Darling (2004) observed all four lines in December 2003 with the NRAO Green Bank telescope, but did not detect the main lines, indicating a strong variability. We note that the for PKS 1830211, the 1720 MHz line luminosity is among the highest luminosities of all OH-main line megamasers (Darling & Giovanelli 2002).
3.2 H i absorption
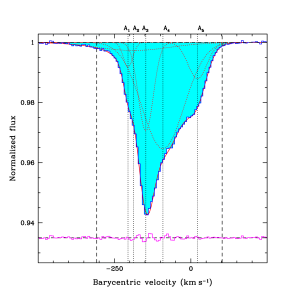
In Fig. 3, we show H i 21-cm absorption at . The integrated H i 21-cm optical depth is dv km s-1, and the width = 258 km s-1. For an optically thin cloud the integrated 21-cm optical depth () is related to the neutral hydrogen column density (H i), spin temperature , and covering factor through,
| (2) |
Using this we get (H i) = () cm-2.
| Id. | Centre | ||
|---|---|---|---|
| (km s-1) | (km s-1) | () | |
| A1 | -205 1 | 15 1 | 8.6 0.6 |
| A2 | -187 40 | 119 11 | 2.7 1.1 |
| A3 | -148 1 | 24 1 | 30.0 0.9 |
| A4 | -91 2 | 68 3 | 35.9 1.4 |
| A5 | 22 1 | 31 1 | 12.2 0.7 |
The bulk of H i absorption can be identified with two components: one centered at 0 and the other at km s-1. These are the velocities associated with mm-wave absorption lines towards the SW and NE components, respectively. Indeed, for the earlier reported 21-cm absorption profiles, which are presented in Figs. 4 of Section 3.3, a two-component Gaussian decomposition provided a reasonable fit. However, the high signal-to-noise ratio of the MeerKAT spectrum requires at least five Gaussian components (A1 to A5; reduced 1.3) as presented in Table 2 and Fig. 3. The remaining structure in the residuals is at the level of 0.0014. It does not necessarily represent discrete physical structures. Therefore, we do not attempt to improve the fit by adding more components.
Further, since the Gaussian components obtained above do not necessarily represent individual physical structures, we can also utilize the velocity components previously used to model the OH lines. But this exercise requires more components because there is an additional spectral feature present in the blue wing of H i 21-cm absorption (see vertical dashed lines in Fig. 3). A rather remarkable result which can be obtained without any component-wise comparison is that the average [OH/HI] column density ratio is slightly higher than the typical ratio () observed in the Galaxy (Li et al. 2018), and also in extra-galactic absorbers (Kanekar & Chengalur 2002; Gupta et al. 2018a). For PKS 1830211 this may be primarily due to the fact that the absorption at 0 km s-1 i.e., towards the SW component originates from gas which is primarily molecular. In Section 3.3 we will provide evidence indicating that all these values are in perfect agreement with previous results, obtained more than 20 years ago (Chengalur et al. 1999; Koopmans & de Bruyn 2005).
3.3 Time variability
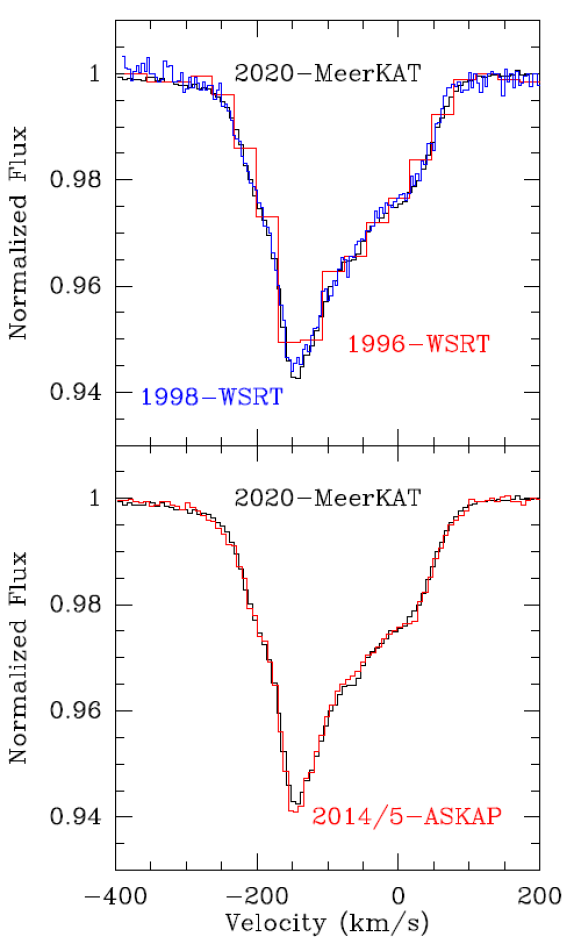
The continuum flux from the background blazar at is significantly varying in time, by factors up to 10 in gamma-rays and 2 at radio wavelengths (e.g., Lovell et al. 1998; Martí-Vidal et al. 2013). These variations are seen in all three lensed components i.e. NE, SW, and ring with time-delays. In X-rays, Oshima et al. (2001) show that the NE/SW flux ratio varies by factors as high as 7, invoking possible micro-lensing effects. While the NE and SW components are images of the blazar core, the ring is mainly due to the jet and a bright knot in the jet (e.g., Jin et al. 2003), and there is an observed jet precession period of one year (Nair et al. 2005). The delay between the two compact (NE and SW) radio components has been measured to be 27 days (e.g., Lovell et al. 1998; Wiklind & Combes 2001; Barnacka et al. 2011). Barnacka et al. (2015) have observed several gamma-ray flares with Fermi-LAT and derived gamma-ray time delays of 230.5 days and 19.71.2 days, which might be consistent with the radio time delay; however this has been debated (see a reanalysis by Abdo et al. 2015). With VLBA observations at 4 GHz, during a period of 44 days Garrett et al. (1997) found highly variable sub-milliarcsecond radio structures in the cores of both lensed images. It is therefore expected that the variations of the different continuum components will be reflected in the shape of the H i and OH absorption lines through time variability.
We have compared all available H i and OH spectra from 1996 with the present MeerKAT ones. In Fig. 4, we show the comparison between all H i spectra. It is striking to see that they are all compatible, especially the last ones with high signal-to-noise ratio. No time variation is visible in the line, while the continuum varied by 40%. The MeerKAT spectrum has a 5-6 times higher signal-to-noise ratio than the old WSRT data by Koopmans & de Bruyn (2005). The slight differences can therefore be completely attributed to the higher noise in the latter. The SNR in the WSRT spectrum is 35 at the peak of the absorption, in channels of 7.9 km s-1. The absorption peaks at 5% of the continuum, and the SNR on the continuum is 700. The average ASKAP spectrum has an SNR1000 for the continuum, and 50 for the line in channels of 7.3 km s-1, and this is the limiting factor in the comparison with our MeerKAT spectrum. There is a slight difference around V=-60 km s-1and V=-150km s-1, of max amplitude of 1.510-3 normalised to the continuum in one channel, and a smaller difference in the two neighboring channels. But after averaging this leads to a difference significant only at the 1.7 level. Similarly, the OH spectra also show no variation. The comparison between the MeerKAT OH-main line spectra from December 19, 2019 (Gupta et al. 2021) and July 13, 2020 (this paper) sets a limit of .
This lack of variation at cm-wavelength contrasts with the variations detected in the mm-wave absorption spectra (Muller & Guélin 2008; Muller et al. 2014). We can interpret the above-mentioned constancy at cm-wavelengths with several arguments: first, given the wider extent of the continuum emission at cm-wavelengths, especially in the Einstein ring, the absorbing regions are much larger, whereas the continuum at mm-wavelength consists mainly of two point sources; second, the absorbing medium in the H i component is more diffuse and less fragmented in the dense clouds (Srianand et al. 2013; Gupta et al. 2018b), such that the motion of possible plasmons (knots) in the background jet will not produce large variations in the absorption signal. Another factor is the height of the gas plane, which is likely much smaller in the dense molecular phase than in the atomic phase. The H i plane in spiral galaxies is quite thick, up to 1 kpc or more in the flaring outer parts (Burton 1976; Olling 1996). This means that the region illuminated by a point source will range up to 1 kpc, crossing the inclined plane, as discussed in Sec. 3.4. Therefore, the H i absorption spectrum gets blurred over a size of , the beam size of some cm-continuum emission studies (Patnaik et al. 1993; Muller et al. 2020)(see also Fig. 10). If the gas surface filling factor is relatively high, all sub-clumps over these regions are averaged out, washing out any spatial variation of the order of 0.2 mas. In addition, due to opacity effects, the cm and mm continuum radiation does not originate from the same volumes: the mm observations probe deeper inside the jet, and hence probably more active regions of the background source.
3.4 Kinematic model of the spectra
Nair et al. (1993) proposed a detailed model for the lensing galaxy: they suggest it to be a spiral galaxy centered 0.3″NE of the SW image, of mass 1011 M⊙ (rotational velocity 260 km s-1), of low eccentricity i.e., nearly face-on, and with a position angle 12∘. The discovery of molecular absorption confirmed that it should be gas rich, and the velocity difference between NE and SW images (150 km s-1) constrained its geometry (Wiklind & Combes 1998). Koopmans & de Bruyn (2005) made a kinematic model, taking into account the redshift of the source (Lidman et al. 1999) and more information about the lens image from Courbin et al. (2002) and Winn et al. (2002). They concluded that the lens is inclined by i=17-32∘ on the sky, with a PA between and 34∘. The model also depends on the velocity width of each absorbing component. Strikingly, the absorption in front of the SW image is rather broad, even relatively in the molecular gas. This could originate from non-circular motions since this region of the lensing galaxy is closer to the center (much closer than the NE image, where the line width is smaller). Even if the background core of the blazar is a point source in the mm regime, the region involved in the lensing galaxy has an extension of h tan(i), where h is the thickness of the plane, and i the inclination of the galaxy. The broadening of the line can therefore be caused by the velocity gradient in this zone.
One of the main uncertainties in the models of Koopmans & de Bruyn (2005) is the position of the center of the lens. Now that a third image, which was postulated by Nair et al. (1993) in the cm-wave radio images, has been detected with ALMA by Muller et al. (2020), the position of the lens is a fixed parameter (very close to the third image position). Thus, it appears that the bright spot towards the center is indeed a star and not the bulge of the lens galaxy, as proposed by Courbin et al. (2002). Koopmans & de Bruyn (2005) found six best fit models, as a function of six positions of the lens center. Now we know that only one of these is close to reality, the one where their coordinates of the lens center with respect to the NE image (or the distance AC in Fig. 5) are (0.5″W, 0.45″S). Their result was then an inclination of i=32∘ for the lens plane and PA=-15∘. In the following we fix i=26∘ and PA=15∘ to better fit the HST morphology of the lensing galaxy. The difference of inclination may explain why Koopmans & de Bruyn (2005) selected a velocity dispersion of 39 km s-1for the H i spectrum, while we need 45 km s-1(see below).
3.4.1 Galaxy model and background continuum
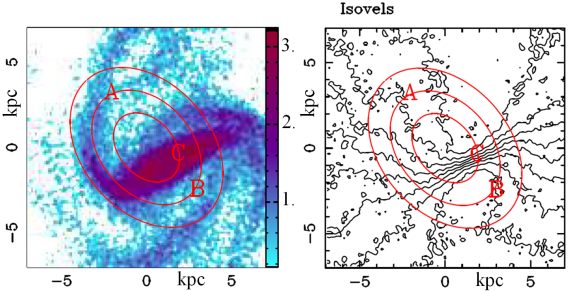
The HST/WFPC2 F814W image published by Courbin et al. (2002) in their Fig. 2 (right) reveals the lensing object as a barred spiral galaxy, with quite a small bulge. Therefore it is a relatively late-type galaxy. To model the lens, we select a snapshot from an N-body simulation, following the development of a bar and spiral arms, in a late-type object, described with stellar, gas and dark matter components, appropriately treating star formation and feedback. We chose the snapshot to have a morphology very similar to the HST image. The initial galaxy is a gSb model, described in Combes (2008) and Chilingarian et al. (2010). We project the model on the sky with an inclination of 26∘ and a PA of 15∘, which are compatible with the above determinations. The resultant gas surface density and the velocity field are plotted in Fig. 5.
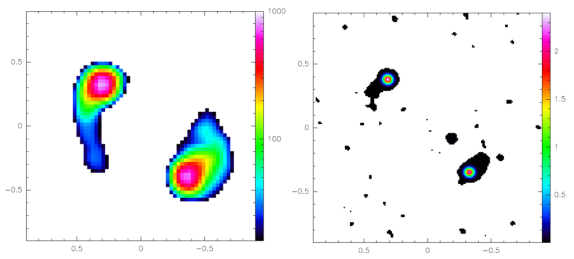
The 5 GHz image obtained using MERLIN (Multi-Element Radio Linked Interferometer Network) is among the best cm-wavelength continuum image of the radio source (Patnaik et al. 1993). Although the redshifted H i and OH line frequencies (750-900 MHz) are much lower, we used this high-resolution map with a synthesized beam of 0.1 arcsec as the base radio continuum model. Fortunately, the spectral index is not very steep between 400 MHz and 5 GHz (see multiple measurements between 4.8 GHz and 408 MHz with the Australia Telescope Compact Array i.e., ATCA and the Parkes telescope, in the NASA/IPAC Extragalactic Database i.e., NED and Section 2), at least for the main images, although it could be steeper for the Einstein ring. We will also compare the absorption spectra obtained at low frequencies with those in the millimeter domain, where the extent of continuum emission is very different due to the weaker Einstein ring component. The three compact images of the background quasar are also detected with ALMA with a beam of 0.056 arcsec (Muller et al. 2020). The adopted continuum maps for our cm- and mm-wave models are presented in the Appendix (Fig. 10).
3.4.2 Computations of absorption maps and spectra
To reproduce the observations with the above continuum models, we built data cubes by projecting the models on the sky, with the fixed inclination and position angles, multiplying at each spatial pixel the gas surface density with the background continuum, and thereby computing the line-of-sight velocity distribution. We select the same spatial pixel sizes as the continuum maps i.e., 0.028 arcsec for the cm-wave, and 0.014 arcsec for the mm one (see Fig. 10). The adopted spectral channels are of width 6.25 km s-1, for both.
The main parameters to vary are related to the radial distribution of the various atomic and molecular species considered in the absorption maps and the spectra. The H i distribution is well known to be depleted at the center of spiral galaxies. There are some extreme examples, such as NGC 628, IC 342, M83, M101 or NGC 7331, with a central H2/H i surface density ratio of 100 as can be seen in the THINGS H i (Walter et al. 2008) and the Heracles CO surveys (Leroy et al. 2009). Some of these radial distributions are computed in Casasola et al. (2017). We therefore selected an H i radial distribution depleted at the center, such that it gives more absorption weight to the NE(A) image with respect to the SW(B) image. Indeed, the distance of A from the center of the lensing galaxy is 5.3 kpc, while B is only at 2.4 kpc from the center (see also Sec. 1). The contribution to the absorption spectrum from B is towards the V=0 km s-1 component while A is contributing to the V=150 km s-1 component. The third image C and the average of the Einstein ring at cm-wavelengths have a continuum contribution of the order of 1% of the flux density of A or B. Recall that the flux densities of A and B are comparable.
For the H i component, we selected a power-law radial distribution, as , with a normalizing scale r0=3.89 kpc, equal to the Einstein ring radius. The gas surface density of the galaxy model was multiplied by this factor f, keeping the underlying bar/spiral structure as shown in Fig. 5. Different radial distributions will lead to different shapes of the total absorption spectrum and in particular different ratios between the two main velocity components. The best fit was obtained with , which is very similar to the distributions selected by Koopmans & de Bruyn (2005).
The velocity widths of H i components are due to two factors: first the intrinsic gas dispersion, and second the averages of all gas rotational velocities in the plane of the lens, seen along the line of sight towards the continuum emission. The strongest continuum sources are the images of the background quasar core, and their angular sizes are quite small (mas), in fact smaller than the synthesized beam sizes. However, the line of sight towards these core images traverses the inclined lens galaxy plane (), which has a thickness h. Consequently, regions along h tan(i) h are illuminated on the plane, with the corresponding velocity gradient. The width of the spectrum can therefore include velocity gradients over 0.1 arcsec, which is the resolution of the MERLIN continuum map. Hence, there is no need to deconvolve the continuum map for the model. Once the velocity gradients are taken into account, the simulated H i components are still too narrow, and it is necessary to add a velocity dispersion of km s-1. This might be due to extra-planar H i gas, frequently observed in nearby spiral galaxies in a few-kpc thick layer, with lagging rotational velocity, and equivalent dispersion up to 30 km s-1 (Marasco et al. 2019).
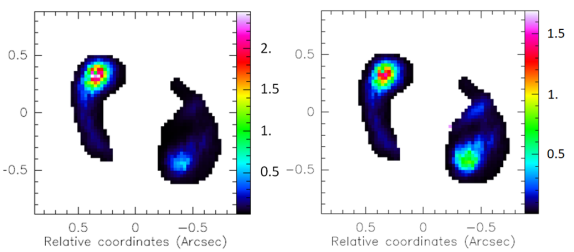
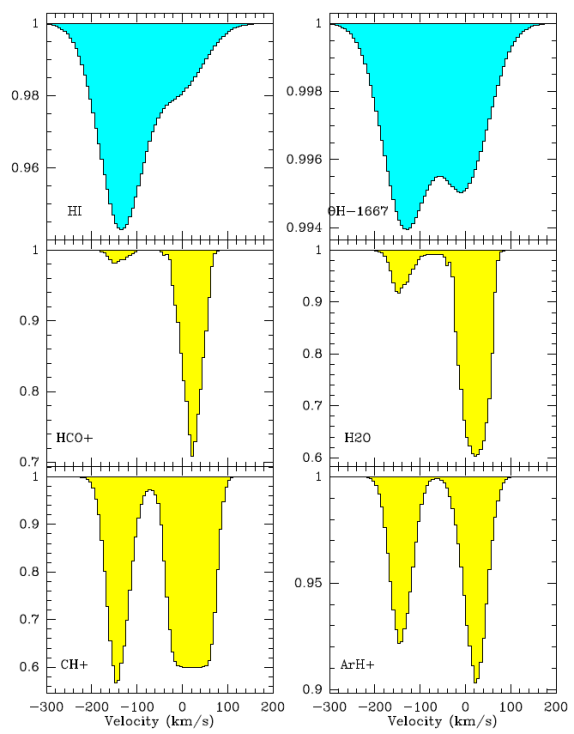
We also performed a similar computation for the OH 18-cm main lines, in particular the stronger 1667 MHz line, but with a more centrally-concentrated radial distribution, using a power-law index . Although the OH does not suffer from the H i depletion towards the center (indeed, there is nothing like the phase change from H i to H2 at high density), the OH radical is still distributed in a thick plane like the HI, a plane which is flaring with radius, and hence increases the velocity coverage of the absorption. This motivates the choice of km s-1 for OH as well and suggests that the OH might also be sharing the extra-planar H i layer. The resulting 2D maps and the spectra are shown in Figs. 6 and 8. The 2D maps indicate in particular the relative contributions of the various continuum regions in the absorption spectra.
Most of the absorption is coming from the lines of sight towards the core of the background source. To test the influence of the Einstein ring, whose flux could be relatively higher at low frequency, we have artificially boosted its continuum emission by factors 3-10 with respect to the core images, but there was no significant impact on the main line components. The various contributions of the different continuum components to the total absorption spectrum are presented in Appendix (11). The ring is contributing a broad component. Although the ring contribution, even at low frequency, should be lower than 10%, it can broaden the H i and OH spectra, and be responsible in part for their wide wings. Another contribution to the wings may be the high velocity clouds, which will be discussed in Sec. 3.5.
3.5 Distribution of the gas absorbing the mm continuum
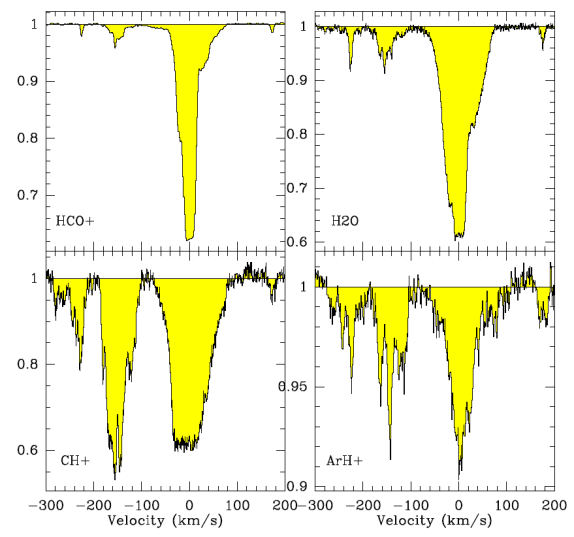
As mentioned earlier, the continuum emission at millimeter wavelengths is much more compact than at cm, with all emission arising from the compact NE and SW images and little contribution from the ring. It is therefore interesting to compare the absorption spectra between the cm and mm domain, as this can give us constraints on the distribution of gas in the disk. For comparison, we take spectra of several species observed with ALMA, namely HCO+, H2O, CH+, and ArH+ (see below and Muller et al. 2014; Müller et al. 2015; Muller et al. 2017).
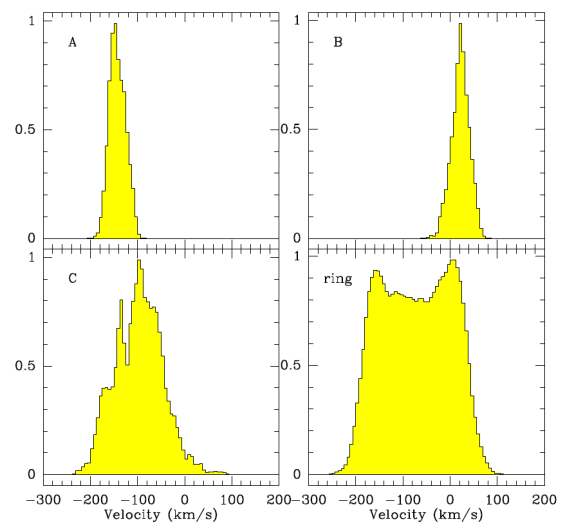
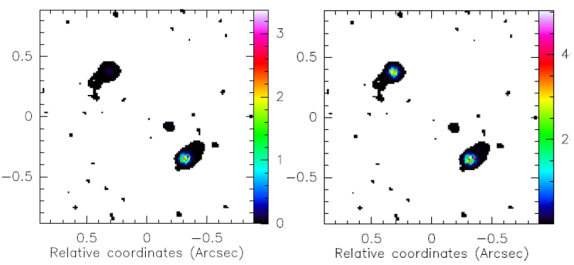
The widths of the various velocity components are much narrower, and this could be due both to the smaller sizes of the core images, and the smaller thickness of the dense molecular gas plane. We therefore computed the model with twice more spatial resolution in linear size i.e., four times in area, using the ALMA continuum map, which fortunately also has a factor of two better spatial resolution (see Fig 10 in Appendix A). To reproduce the observations, the intrinsic dispersion of the gas (6 km s-1) in the N-body hydro simulation is sufficient, and an added convolution is not necessary. We attempt to reproduce absorption from HCO+ which represents a generically mildly optically-thick species, the H2O molecule which is a highly optically thick one, and ArH+ which should be a tracer of the H i but with a different continuum illumination than at cm-wavelengths. The ArH+ absorption appears optically thin, but there is another species, CH+, tracing a gas with intermediate molecular fraction, which is highly optically thick. The ALMA spectra, combined to a beam encompassing all the continuum emission, are represented in Fig. 9. Both HCO+ and H2O have a highly concentrated radial distribution. We therefore selected the exponential profile, with a factor f=exp(- r/r0), with the same r0=3.89 kpc, as before. For the HCO+ and H2O distribution, the best fit was obtained with an exponential law, with =2.5. The main difference in their profiles is due to their different optical thickness. In addition, for H2O, it was necessary to deplete the central gas in front of the third image C, to avoid an excessively broad absorption. Indeed, C is close to the galaxy centre, and the velocity gradient at this location reached the maximum of 220 km s-1 in projection. The resulting 2D maps and the spectra are shown in Figs. 7 and 8.
For the CH+ distribution, the best fit was obtained with an exponential of =1.7, and for ArH+, =0.1. The latter is more extended, with a distribution more similar to the atomic one. In addition, the velocity components are broader, and we selected a convolution width = 15 km s-1. The latter is three times less than the H i dispersion, but still higher than that of the molecular gas.
The profiles of Fig. 9 reveal small extra features with velocities lower than km s-1, or higher than 100 km s-1. These velocities do not exist in our galaxy model, and should come either from high-velocity clouds in the halo of the galaxy, or extra tidal arms coming from a possible galaxy interaction. The line of sight of PKS 1830211 falls at low latitude towards the Galactic center (l,b=12.2∘,-5.7∘), and the region is too crowded to see tidal tails or a possible companion. It is possible that the broad H i components include these high-velocity clouds, and are the cause of the high velocity dispersion required by the model.
In summary, there is a wide range of central concentrations for the various species, between HCO+ the most concentrated and H i the most extended tracer. Furthermore there is a large range of optical thickness and of gas layer height, implying a large range of velocity width, that can explain the various morphologies and intensities of spectral features.
4 Conclusions
The MALS LSP project on the MeerKAT array has carried out its first science verification observations in the UHF-band, covering the 580 to 1015 MHz frequency range. The brightest known radio lens, PKS 1830211 , has been observed and detected with high signal-to-noise ratio (SNR 4000 in channels of 6 km s-1). While the H i 21-cm and OH main lines at were already known, due to the excellent sensitivity of MeerKAT we have also been successful in detecting the OH 18-cm satellite lines. We find that while the strength of the OH main lines is consistent with the LTE ratio, the satellite lines show conjugate behavior indicative of radiative pumping due to far-infrared radiation. The OH emission component in the 1720 MHz line, although at only 3, has the total line luminosity of 6100 L⊙, i.e., 20 times more luminous than the previously brightest known 1720 MHz maser, associated with PKS 1413+135 at (Kanekar et al. 2004; Darling 2004). A detailed radiative model will be investigated further in the future, when the corresponding lines are re-observed with even higher SNRs.
Contrary to the absorption features detected in several molecules at mm wavelengths, peaking at km s-1 (i.e. the SW image), the main absorbing component at cm-wavelengths is at a velocity of -150 km s-1 with respect to , corresponding to the NE image. We compared our spectrum with those previously obtained with the WSRT (SNR 700 with respect to the continuum and 35 at the peak of the line in Koopmans & de Bruyn 2005). The spectra reveal no variation, within an SNR of 35 relative to the depth of the absorption. No variation was seen also with respect to the ASKAP spectrum of Allison et al. (2017) with SNR1000 with respect to the continuum and 50 at the peak of the line.
We have built a realistic lens galaxy model, from an N-body hydro simulation of an Sb-type galaxy, developing a bar and spiral arms. The galaxy is projected to obtain a similar morphology as the HST image. Combining with the cm and mm continuum images of the background quasar obtained with best spatial resolution, we have computed data cubes to simulate the observed absorption features. The H i and OH absorption spectra are well reproduced with the main velocity field of the galaxy model. An intrinsic velocity dispersion of =45 km s-1 has to be added to account for the broad widths, which can be explained by the presence of an extra-planar H i and OH gas, in addition to a thick and flaring plane. For the HCO+ and H2O absorption lines, only the dispersion of 6 km s-1 yielded by the simulated dense molecular gas is sufficient to account for the observed profiles. The molecular gas component is much more centrally concentrated, while the H i-component is depleted in the galaxy center. There is no need for any outflow component coming from the galaxy plane. There exist however some distinct and faint extra features, which can be interpreted as high-velocity clouds. To account for the ArH+ absorption lines, observed with ALMA, a higher velocity dispersion (=15 km s-1) and a more extended distribution, similar to the atomic component, has to be selected.
Acknowledgements.
We heartfully thank the SARAO’s team of engineers and commissioning scientists for years of intense and successful work towards delivering the wonderful MeerKAT telescope. We also thank the referee for helpful comments, that improved the clarity of the paper. The MeerKAT telescope is operated by the South African Radio Astronomy Observatory, which is a facility of the National Research Foundation, an agency of the Department of Science and Innovation. KM acknowledges support from the National Research Foundation of South Africa. The MeerKAT data were processed using the MALS computing facility at IUCAA (https://mals.iucaa.in/releases). The Common Astronomy Software Applications (CASA) package is developed by an international consortium of scientists based at the National Radio Astronomical Observatory (NRAO), the European Southern Observatory (ESO), the National Astronomical Observatory of Japan (NAOJ), the Academia Sinica Institute of Astronomy and Astrophysics (ASIAA), the CSIRO division for Astronomy and Space Science (CASS), and the Netherlands Institute for Radio Astronomy (ASTRON) under the guidance of NRAO. The National Radio Astronomy Observatory is a facility of the National Science Foundation operated under cooperative agreement by Associated Universities, Inc. We made use of the NASA/IPAC Extragalactic Database (NED).References
- Abdo et al. (2015) Abdo, A. A., Ackermann, M., Ajello, M., et al. 2015, ApJ, 799, 143
- Aller et al. (2012) Aller, M. C., Kulkarni, V. P., York, D. G., et al. 2012, ApJ, 748, 19
- Allison et al. (2017) Allison, J. R., Moss, V. A., Macquart, J. P., et al. 2017, MNRAS, 465, 4450
- Barnacka et al. (2015) Barnacka, A., Geller, M. J., Dell’Antonio, I. P., & Benbow, W. 2015, ApJ, 809, 100
- Barnacka et al. (2011) Barnacka, A., Glicenstein, J. F., & Moudden, Y. 2011, A&A, 528, L3
- Bhatnagar et al. (2013) Bhatnagar, S., Rau, U., & Golap, K. 2013, ApJ, 770, 91
- Burton (1976) Burton, W. B. 1976, ARA&A, 14, 275
- Camilo et al. (2018) Camilo, F., Scholz, P., Serylak, M., et al. 2018, ApJ, 856, 180
- Casasola et al. (2017) Casasola, V., Cassarà, L. P., Bianchi, S., et al. 2017, A&A, 605, A18
- Chengalur et al. (1999) Chengalur, J. N., de Bruyn, A. G., & Narasimha, D. 1999, A&A, 343, L79
- Chengalur & Kanekar (2003) Chengalur, J. N. & Kanekar, N. 2003, Phys. Rev. Lett., 91, 241302
- Chilingarian et al. (2010) Chilingarian, I. V., Di Matteo, P., Combes, F., Melchior, A. L., & Semelin, B. 2010, A&A, 518, A61
- Combes (2008) Combes, F. 2008, arXiv e-prints, arXiv:0811.0153
- Courbin et al. (1998) Courbin, F., Lidman, C., Frye, B. L., et al. 1998, ApJ, 499, L119
- Courbin et al. (2002) Courbin, F., Meylan, G., Kneib, J. P., & Lidman, C. 2002, ApJ, 575, 95
- Darling (2003) Darling, J. 2003, Phys. Rev. Lett., 91, 011301
- Darling (2004) Darling, J. 2004, ApJ, 612, 58
- Darling & Giovanelli (2002) Darling, J. & Giovanelli, R. 2002, AJ, 124, 100
- Elitzur (1976) Elitzur, M. 1976, ApJ, 203, 124
- Frayer et al. (1998) Frayer, D. T., Seaquist, E. R., & Frail, D. A. 1998, AJ, 115, 559
- Frye et al. (1997) Frye, B., Welch, W. J., & Broadhurst, T. 1997, ApJ, 478, L25
- Garrett et al. (1997) Garrett, M. A., Nair, S., Porcas, R. W., & Patnaik, A. R. 1997, Vistas in Astronomy, 41, 281
- Guirado et al. (1999) Guirado, J. C., Jones, D. L., Lara, L., et al. 1999, A&A, 346, 392
- Gupta et al. (2021) Gupta, N., Jagannathan, P., Srianand, R., et al. 2021, ApJ, 907, 11
- Gupta et al. (2018a) Gupta, N., Momjian, E., Srianand, R., et al. 2018a, ApJ, 860, L22
- Gupta et al. (2017) Gupta, N., Srianand, R., Baan, W., et al. 2017, ArXiv e-prints [arXiv:1708.07371]
- Gupta et al. (2018b) Gupta, N., Srianand, R., Farnes, J. S., et al. 2018b, MNRAS, 476, 2432
- Jagannathan et al. (2017) Jagannathan, P., Bhatnagar, S., Rau, U., & Taylor, A. R. 2017, AJ, 154, 56
- Jauncey et al. (1991) Jauncey, D. L., Reynolds, J. E., Tzioumis, A. K., et al. 1991, Nature, 352, 132
- Jin et al. (2003) Jin, C., Garrett, M. A., Nair, S., et al. 2003, MNRAS, 340, 1309
- Jonas & MeerKAT Team (2016) Jonas, J. & MeerKAT Team. 2016, in Proceedings of MeerKAT Science: On the Pathway to the SKA. 25-27 May, 2016 Stellenbosch, South Africa (MeerKAT2016), 1
- Kanekar & Chengalur (2002) Kanekar, N. & Chengalur, J. N. 2002, A&A, 381, L73
- Kanekar et al. (2004) Kanekar, N., Chengalur, J. N., & Ghosh, T. 2004, Phys. Rev. Lett., 93, 051302
- Kanekar et al. (2018) Kanekar, N., Ghosh, T., & Chengalur, J. N. 2018, Phys. Rev. Lett., 120, 061302
- Koopmans & de Bruyn (2005) Koopmans, L. V. E. & de Bruyn, A. G. 2005, MNRAS, 360, L6
- Leroy et al. (2009) Leroy, A. K., Walter, F., Bigiel, F., et al. 2009, AJ, 137, 4670
- Li et al. (2018) Li, D., Tang, N., Nguyen, H., et al. 2018, ApJS, 235, 1
- Lidman et al. (1999) Lidman, C., Courbin, F., Meylan, G., et al. 1999, ApJ, 514, L57
- Liszt & Lucas (1996) Liszt, H. & Lucas, R. 1996, A&A, 314, 917
- Lovell et al. (1998) Lovell, J. E. J., Jauncey, D. L., Reynolds, J. E., et al. 1998, ApJ, 508, L51
- Lovell et al. (1996) Lovell, J. E. J., Reynolds, J. E., Jauncey, D. L., et al. 1996, ApJ, 472, L5
- Marasco et al. (2019) Marasco, A., Fraternali, F., Heald, G., et al. 2019, A&A, 631, A50
- Martí-Vidal et al. (2013) Martí-Vidal, I., Muller, S., Combes, F., et al. 2013, A&A, 558, A123
- Mauch et al. (2020) Mauch, T., Cotton, W. D., Condon, J. J., et al. 2020, ApJ, 888, 61
- Mohan & Rafferty (2015) Mohan, N. & Rafferty, D. 2015, PyBDSF: Python Blob Detection and Source Finder
- Müller et al. (2015) Müller, H. S. P., Muller, S., Schilke, P., et al. 2015, A&A, 582, L4
- Muller et al. (2011) Muller, S., Beelen, A., Guélin, M., et al. 2011, A&A, 535, A103
- Muller et al. (2014) Muller, S., Combes, F., Guélin, M., et al. 2014, A&A, 566, A112
- Muller & Guélin (2008) Muller, S. & Guélin, M. 2008, A&A, 491, 739
- Muller et al. (2020) Muller, S., Jaswanth, S., Horellou, C., & Martí-Vidal, I. 2020, A&A, 641, L2
- Muller et al. (2017) Muller, S., Müller, H. S. P., Black, J. H., et al. 2017, A&A, 606, A109
- Nair et al. (2005) Nair, S., Jin, C., & Garrett, M. A. 2005, MNRAS, 362, 1157
- Nair et al. (1993) Nair, S., Narasimha, D., & Rao, A. P. 1993, ApJ, 407, 46
- Olling (1996) Olling, R. P. 1996, AJ, 112, 457
- Oshima et al. (2001) Oshima, T., Mitsuda, K., Ota, N., et al. 2001, ApJ, 551, 929
- Patnaik et al. (1993) Patnaik, A. R., Muxlow, T. W. B., & Jauncey, D. L. 1993, in Liege International Astrophysical Colloquia, Vol. 31, Liege International Astrophysical Colloquia, ed. J. Surdej, D. Fraipont-Caro, E. Gosset, S. Refsdal, & M. Remy, 363
- Pramesh Rao & Subrahmanyan (1988) Pramesh Rao, A. & Subrahmanyan, R. 1988, MNRAS, 231, 229
- Rau & Cornwell (2011) Rau, U. & Cornwell, T. J. 2011, A&A, 532, A71
- Srianand et al. (2013) Srianand, R., Gupta, N., Rahmani, H., et al. 2013, MNRAS, 428, 2198
- Tercero et al. (2020) Tercero, B., Cernicharo, J., Cuadrado, S., de Vicente, P., & Guélin, M. 2020, A&A, 636, L7
- van Langevelde et al. (1995) van Langevelde, H. J., van Dishoeck, E. F., Sevenster, M. N., & Israel, F. P. 1995, ApJ, 448, L123
- Walter et al. (2008) Walter, F., Brinks, E., de Blok, W. J. G., et al. 2008, AJ, 136, 2563
- Wiklind & Combes (1996) Wiklind, T. & Combes, F. 1996, Nature, 379, 139
- Wiklind & Combes (1998) Wiklind, T. & Combes, F. 1998, ApJ, 500, 129
- Wiklind & Combes (2001) Wiklind, T. & Combes, F. 2001, in Astronomical Society of the Pacific Conference Series, Vol. 237, Gravitational Lensing: Recent Progress and Future Go, ed. T. G. Brainerd & C. S. Kochanek, 155
- Winn et al. (2002) Winn, J. N., Kochanek, C. S., McLeod, B. A., et al. 2002, ApJ, 575, 103
- Wolfe et al. (2008) Wolfe, A. M., Jorgenson, R. A., Robishaw, T., Heiles, C., & Prochaska, J. X. 2008, Nature, 455, 638
Appendix A Continuum maps
To model the continuum at cm and mm wavelengths, we adopted the MERLIN 5 GHz image from Patnaik et al. (1993), and the ALMA-Band 5 ( GHz) image from Muller et al. (2020) respectively, which are plotted in Fig.10. The resulting absorption lines depend essentially on the continuum distribution and not their absolute values. There might be some variations with frequency, with a spectral index, which is not quite flat (see NED and Section 2), but these are of second order here.
Appendix B Spectra due to the different continuum components
To better understand relative contributions to absorption from different continuum images of the background quasar, we decompose the spectra in front of the following image components: the three images of the quasar core, and the Einstein ring (see Fig. 11). All spectra in the figure are normalized to 1.