Magnetic field and gravitational waves from the first-order Phase Transition
Abstract
We perform the three dimensional lattice simulation of the magnetic field and gravitational wave productions from bubble collisions during the first-order electroweak phase transition. Except that of the gravitational wave, the power-law spectrum of the magnetic field strength is numerically calculated for the first time, which is of a broken power-law spectrum: for low frequency region of and for high frequency region of in the thin-wall limit, with the peak frequency being Hz at the phase transition temperature 100 GeV. When the hydrodynamics is taken into account, the generated magnetic field strength can reach G at a correlation length pc, which may seed the large scale magnetic fields. Our study shows that the measurements of cosmic magnetic field strength and gravitational waves are complementary to probe new physics admitting electroweak phase transition.
Introduction: Recent lattice simulation confirms that there is no first-order phase transition (PT) in the Standard Model (SM) D’Onofrio et al. (2014). However, a first-order electroweak PT is a general feature in many new physics models beyond the SM, which provide one crucial Sakharov condition for the explanation of the baryon asymmetry of the Universe in the paradigm of electroweak baryogenesisMorrissey and Ramsey-Musolf (2012). New physics models admitting a first-order PT can be explored at future high energy colliders through the probe of the Higgs pair production Arkani-Hamed et al. (2016). The study of first-order PT arises growing interest of particle physicists after the LIGO and Virgo collaborations released their direct detection of gravitational waves (GWs) Abbott et al. (2016), since a general prediction of the first-order PT , i.e., the stochastic gravitational waves backgrounds open a new astronomy window to probe new physics beyond the SM Mazumdar and White (2019); Caprini et al. (2016, 2020). The GWs from the first-order electroweak PT is an important scientific goal of Laser Interferometer Space Antenna (LISA) Amaro-Seoane et al. (2017), Taiji Ruan et al. (2020), TianQin Luo et al. (2016), Big Bang Observer (BBO) Corbin and Cornish (2006), and DECi-hertz Interferometer Gravitational wave Observatory (DECIGO) Yagi and Seto (2011). On the other hand, the ubiquitous existence of the cosmological magnetic fields (MFs) is confirmed by observations Yamazaki et al. (2012); Xu and Han (2019); Han et al. (2018); Han (2017), especially the lower bounds on intergalactic MFs were derived from gamma-ray observations of blazars Dermer et al. (2011); Taylor et al. (2011); Neronov and Vovk (2010). However, the origin of the large scale MFs is still a mystery. The first-order PT is proposed to produce the magnetic fields (MFs) Vachaspati (2001); Durrer and Neronov (2013); Grasso and Rubinstein (2001); Subramanian (2016); Kandus et al. (2011); Caprini et al. (2009a), which may seed the cosmic MFs. Vachapati Vachaspati (2001) proposed to generate the MFs with the non-vanshing gradients of the Higgs fields when the bubbles collide during the first-order electroweak PT.
In this Letter, we intend to numerically study the production of MFs and GWs during the PT process where bubble collision occurs, and investigate the possibility to probe the first-order electroweak PT directly with observations of MFs and GWs. We numerically calculate the MF spectrum and GW energy spectrum, where the effects of the bubble wall thickness and the Higgs gradients contribution to the MFs generation are explored. The previous study of MFs generation in Ref.Zhang et al. (2019) didn’t consider the GW production. We study the generations of the MFs and GWs together for the first time. We perform a three-dimensional lattice simulation of Higgs and electroweak gauge fields rather than solely adopting a scalar theory as the previous GWs simulations Cutting et al. (2020a)111Ref. Lewicki and Vaskonen (2020a, b) studied the bubble collision in the gauge theory.. Our simulations consider the first-order PT admitting GWs production from bubble collisions rather than preheating in the hybrid inflation Diaz-Gil et al. (2008a, b). Since the duration time of the first-order PT is much smaller than the Hubble time, we neglect the effect of expansion of the Universe throughout this work.
The PT model: To study the generation of MFs, we firstly present the relevant Lagrangian in the electroweak theory,
| (1) |
Here and denote Higgs field and the Higgs potential, the covariant derivative is , where () are the Pauli matrices, and the SU(2)L and U(1)Y field strengths are and , respectively. The physical values of the coupling constants are and . A first-order PT can be realized in many models beyond the SM, such as: SM extended with a dimensional-six operator Grojean et al. (2005); Grojean and Servant (2007); Cai et al. (2017), xSM Profumo et al. (2015); Zhou et al. (2020); Bian et al. (2020); Alves et al. (2019); Profumo et al. (2007); Espinosa et al. (2012); Jiang et al. (2016), 2HDM Cline et al. (2011); Dorsch et al. (2013, 2014); Bernon et al. (2018); Andersen et al. (2018); Kainulainen et al. (2019), George-Macheck model Zhou et al. (2019), and NMSSM Bian et al. (2018); Huber et al. (2016). In these models, the Higgs potential embracing a barrier at finite temperature that can trigger a first-order PT proceeding with bubble nucleations and collisions Grojean et al. (2005) that are expected to produce MFs Durrer and Neronov (2013); Kandus et al. (2011); Subramanian (2016) and GWs Grojean and Servant (2007). The correspondence between model parameters of the at the PT temperature and bubble characteristics (mean bubble separation, wall thickness and wall velocity) can be obtained as in Ref. Hindmarsh et al. (2014); Cutting et al. (2020b); Hindmarsh et al. (2015, 2017). The initial conditions are set as , and the profile of generated bubbles is adopted as
| (2) |
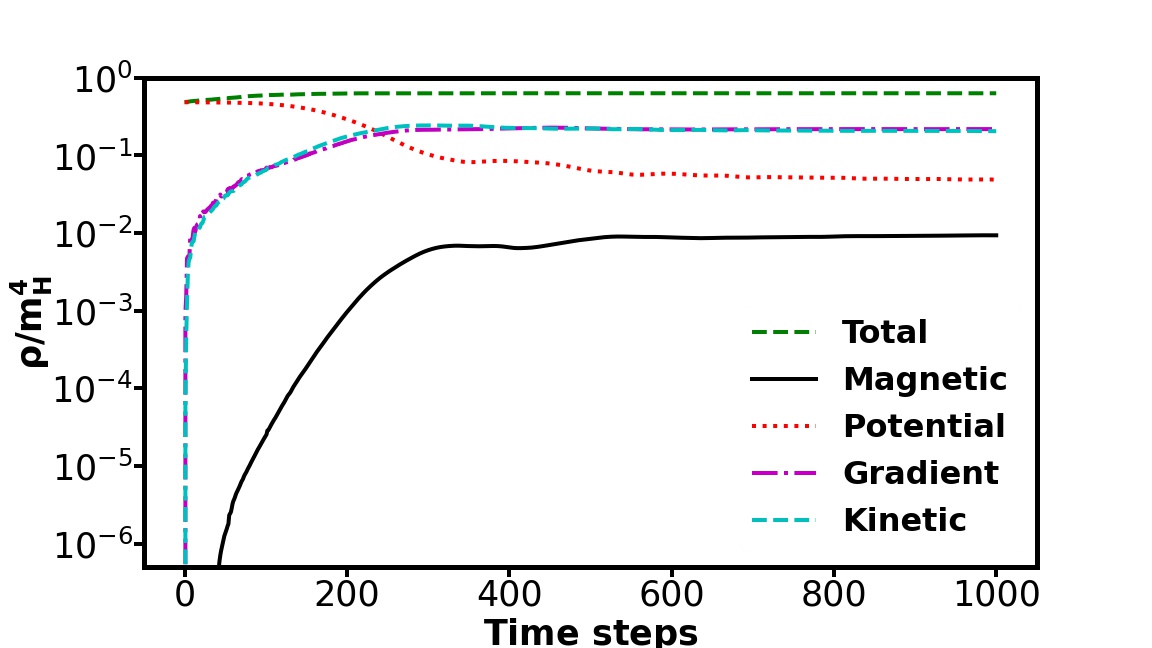
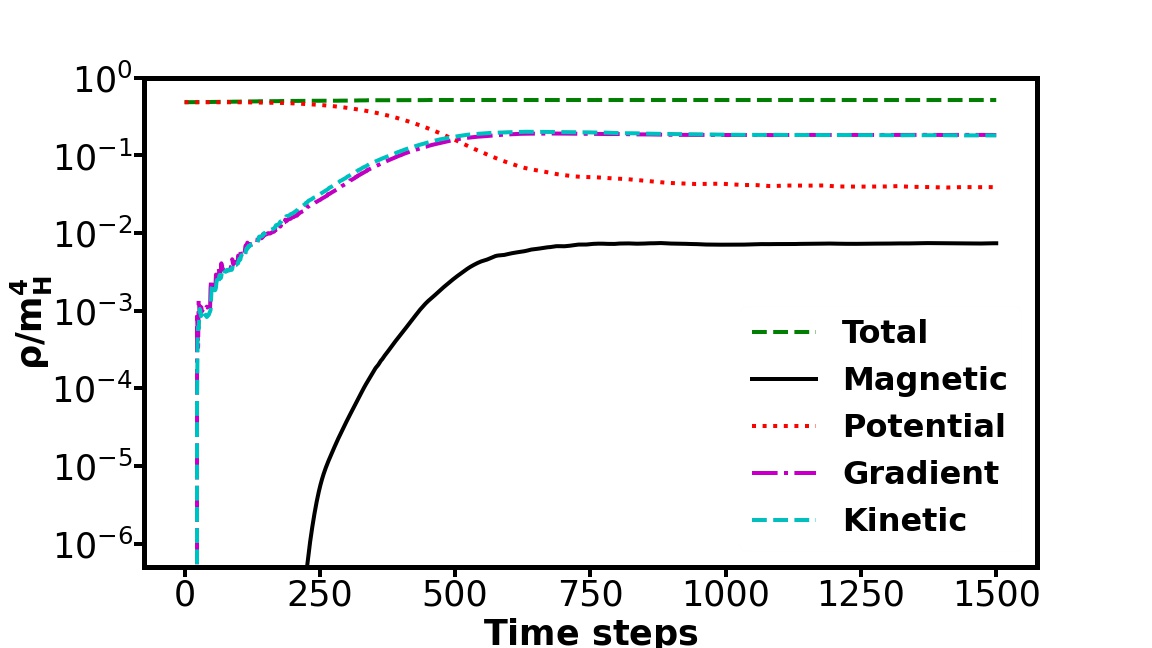
where is the initial bubble radius and is the thickness of the critical bubble wall, which is highly related with the potential barrier when the phase transition occurs. Following Ref. Cutting et al. (2020a), we define the “wall” of the bubble corresponding to the section of the field profile between and where and . Here is the Higgs expectation value of the true vacuum. We consider that the bubbles randomly nucleate in the regions where the symmetry is unbroken to capture the dynamic of the first-order PT, where the bubble nucleation rate is directly connected with the mean bubble separation. 222 See Supplemental Material for the relations between the parameter and particular PT models’ parameter, which includes Refs. Hindmarsh and Hijazi (2019); Cutting et al. (2020a); Cutting et al. (2018); Hindmarsh et al. (2014). We use the temporal gauge, , and evolve the equations of motions (EOMs) for bosonic fields on the lattice as Ref. Rajantie et al. (2001); Zhang et al. (2017) (see supplemental material) to generate the MFs and GWs. We note that in the previous simulations of GWs from first-order PT, the electroweak gauge fields are absent in the EOMs of bosonic fields, our simulation shows that its effect is indeed negligible for GWs production, due to the smallness of the MF energy, as can be found in Fig. 1. Meanwhile, the evolution of gauge fields here seeds the MFs production during the first-order PT.
MF and GW production: We define the electromagnetic fields after the Higgs field leaves the symmetric phase as , where is the weak mixing angle satisfying , and presents the direction of the Higgs field. The corresponding field strength is constructed as ’t Hooft (1974); Vachaspati (1991)
| (3) |
One can see that the field strength tensor (Eq. 3) for the calculation of MF strength includes the contributions from the Higgs gradients, whose effects depend on the bubble collision dynamics that will be investigated latter. Following the conventions in Ref. Brandenburg et al. (2017, 2018), MFs can be described in terms of the equal-time correlation function of , where is the Fourier transformation of (the magnetic component of in Eq. 3). Since parity violation of the Lagrangian is not considered in this Letter, the antisymmetric part of vanishes, with , and the magnetic energy density is obtained as Durrer and Neronov (2013): . The MF strength can be obtained as: . With the “characteristic” correlation length being defined as, , the corresponding root mean square (scale-averaged) MF strength is Brandenburg et al. (2017) .
The GWs sources from the first-order PT mainly include bubble collisions, sound waves, and turbulence. We focus on GWs produced from bubble collisions when the MFs are produced. Recently, significant progress has been made on lattice simulations of the GW production from the first-order PT Giblin and Mertens (2014); Hindmarsh et al. (2014); Cutting et al. (2020b); Hindmarsh et al. (2015, 2017); Cutting et al. (2018); Cutting et al. (2020a); Roper Pol et al. (2020). For the calculation approach, we adopt the straightforward procedure detailed in Ref. Garcia-Bellido et al. (2008) rather than the envelope approximation which is still under improving and cannot tell the whole story, see Ref. Cutting et al. (2018); Cutting et al. (2020a) for recent lattice realization and Ref. Konstandin (2018); Ellis et al. (2020a); Lewicki and Vaskonen (2020a, b) for theoretical studies. The EOM of tensor perturbations reads
| (4) |
Here the superscript denotes the transverse traceless projection, and the energy-momentum tensor is dominated by
| (5) |
where we neglected the contribution from the subdominant MFs, but the MF’s contribution affects the evolution of Higgs field through EOMs. (See supplemental material 333The GWs generated from MFs is neglegible since the energy density of MFs is subdominant. The peak of the energy spectrum of GWs from MFs is estimated as using the method of Ref. Caprini and Durrer (2006), which is much smaller than that from bubble collision, . Ref. Saga et al. (2018) presented the possibility to constraint the small scale MFs with the GWs detection with the pulsar timing array experiments. ). The energy spectrum of GWs is defined as the GW energy density fraction per logarithmic frequency interval,
| (6) |
Numerical results: Our simulations are performed on a cubic lattice with the resolution , and the lattice size is related with the number of bubbles initially placed in the lattice. The time spacing is chosen to be , which is much smaller than the spacial resolution . This choice of lattice spacing gives us enough resolution to ensure that we capture all the dynamics for MFs and GWs productions. The mean bubble separation in the simulations is obtained as with being the number of the generated bubbles at the simulation, which determines the Lorentz factor for a bubble to be , and the wall width as at bubble collision time. We assume the nucleation rate is a constant during the simulation, which is denoted by Garcia Garcia et al. (2018). We simulate the cases of and to investigate the wall thickness effects on the GWs and MFs productions. For the bubble nucleation rate , we have , with the wall velocity being and the mean bubble separation at the time of bubble collision. To reach the thin wall limit, we consider a much lower nucleation rate , which yields: , the wall velocity , and .
The bubble walls are pushed outwards by the vacuum energy after bubble nucleation, and finally collide with each other. Bubbles nucleation scenarios of are presented to show the connection between the magnetic energy density and the bubble nucleation rate. The two panels of Fig. 1 show that a large predicts an early generation and increase of , since the bubbles nucleation and collision for large occur early (See Fig.1 in the supplemental material for the illustration of bubble expansion and collision.). After the PT, constitutes about one percent of the total energy at the end of the simulation, which is much lower than the bounds from the Big-Bang Nucleosynthesis, Mukhanov (2005). To obtain the observables at present, we red-shift the GW energy spectrum and MF spectrum by taking into account the temperature and the duration time of the PT (), which depend on the underlying PT models, and we set them to be free parameters in this work.
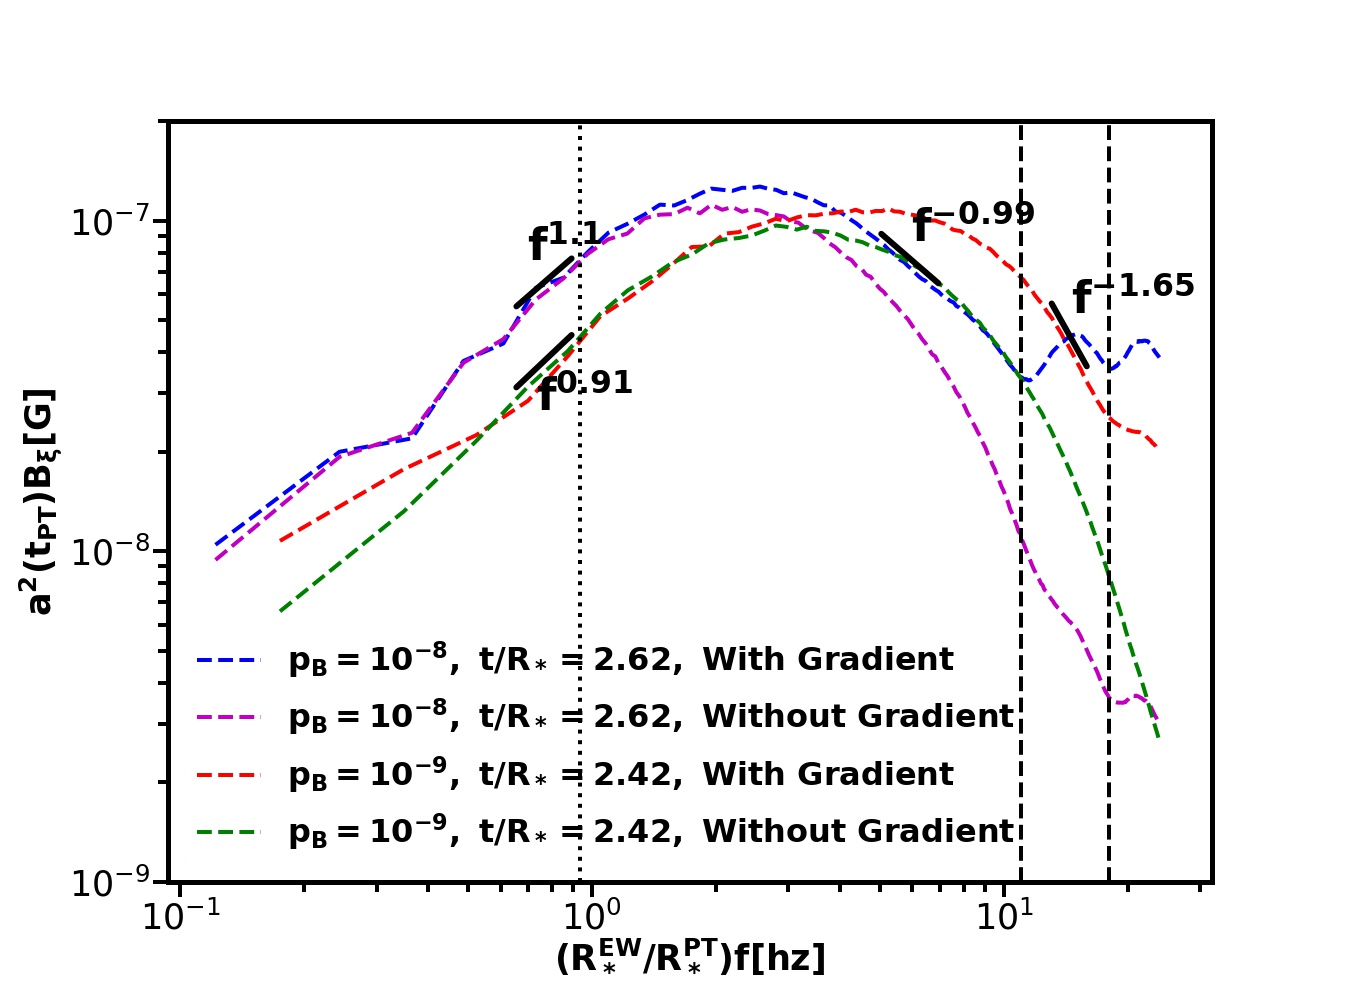

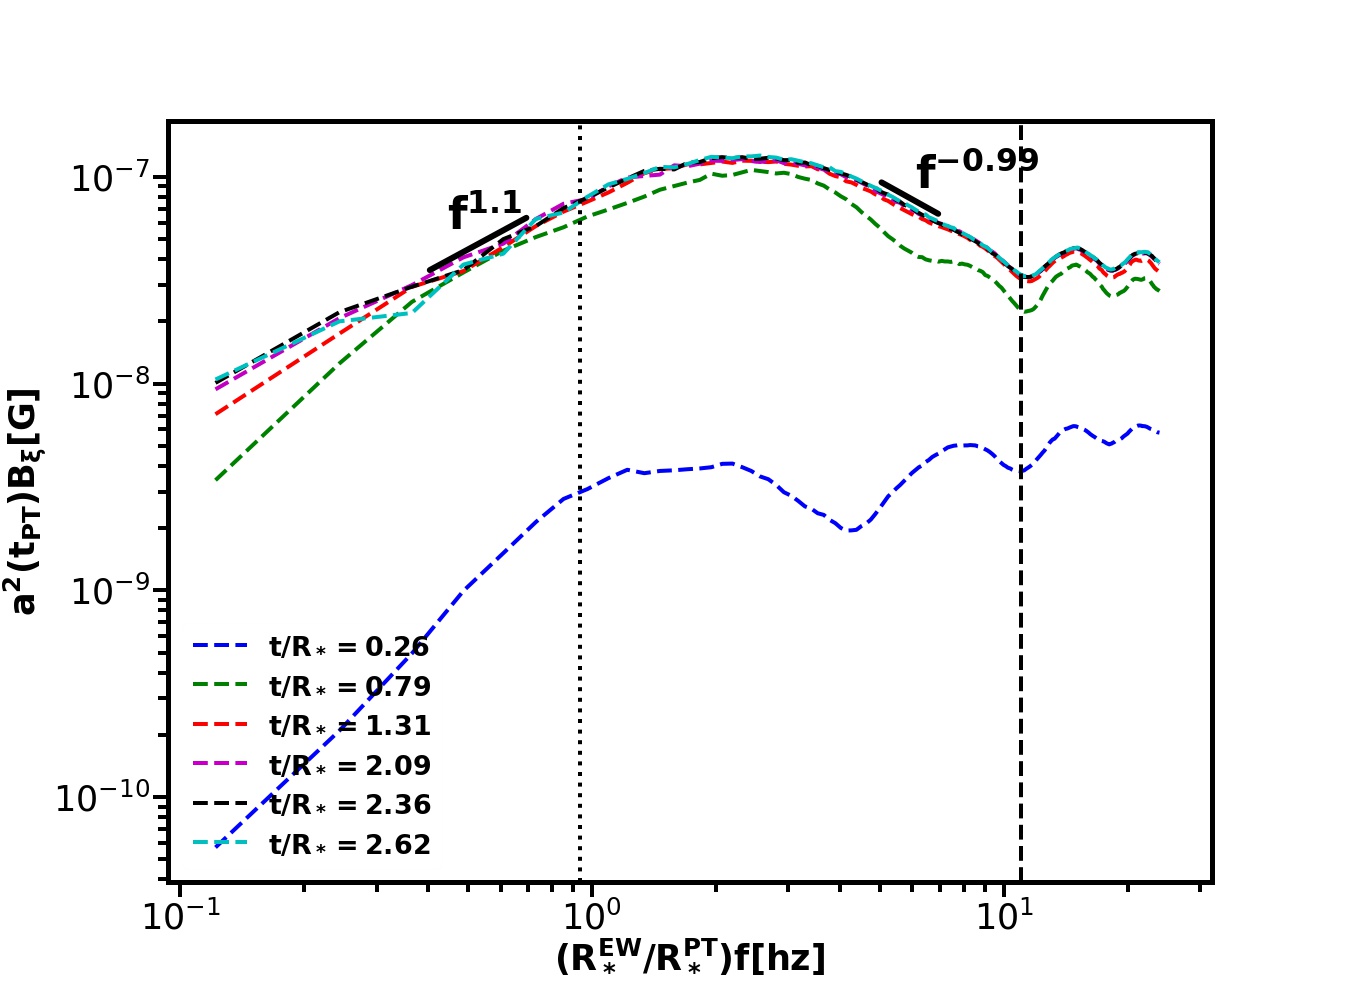
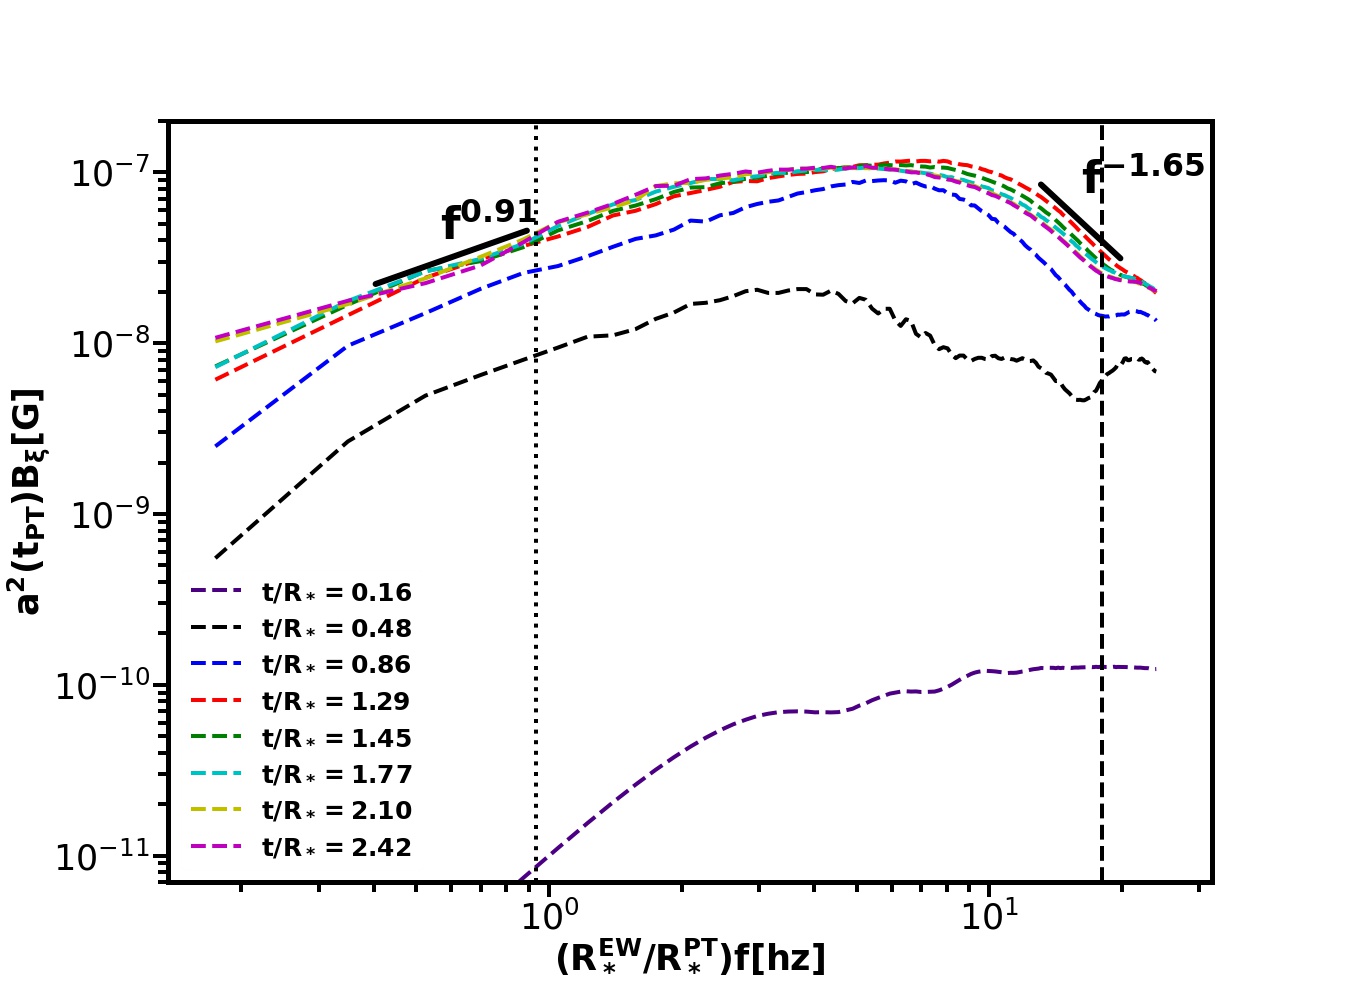
We first numerically calculate the spectrum of the MF strength generated during the first-order electroweak PT when the GWs are produced (we consider the PT temperature GeV). As shown in the top panel of Fig. 2, our simulation results in a broken power-law spectrum, with for (here indicates the peak frequency) and for for with ( with ), which means that the spectra of MFs from PT can be used to differentiate different bubble collision scenarios. In comparison with thicker wall (), the MF spectrum falls off more quickly for thin wall scenario () (See Fig. 2 in the supplemental material for the time evolution of the MF spectra.). The MF strength can reach G at the peak frequency for the thin wall scenario, with the correlation length being pc. The effects of the Higgs gradients contributions (the terms of the second line in Eq. 3) to the MF generation are also shown there, which emerges after collisions, increases and dominates the MFs production in the oscillation phase, with the magnitude of MFs increases by around three times after bubble collisions. This characteristic is observed for the first time and strongly supports the MFs production mechanism proposed by Vachaspati Vachaspati (1991, 2001). The MFs spectrum here is different from Ref. Zhang et al. (2019) where they didn’t consider the effects of the bubble wall thickness. Taking into account the effects of the hydromagnetic turbulence for MFs produced in the electroweak PT allow us to constrain the PT parameter spaces by the cosmic MFs observations. In bottom panel of Fig. 2, we present the bounds on the MFs from the intergalactic MFs blazar observations for the thin wall scenario, where we adopt scaling law that governs the evolution of MFs and the correlation length for the case where MFs do not have enough time to reach the fully helical stage before recombination, as suggested by the numerical simulation of MFs evolution under the Magnetohydrodynamic turbulence Brandenburg et al. (2017): for . We didn’t present the bounds coming from the Big-Bang Nucleosynthesis Kahniashvili et al. (2010); Kawasaki and Kusakabe (2012) and the spectrum and anisotropies of the cosmic microwave background measurements Seshadri and Subramanian (2009); Ade et al. (2016); Jedamzik et al. (2000); Barrow et al. (1997); Durrer et al. (2000); Trivedi et al. (2010), since the two yield null result for the current study.
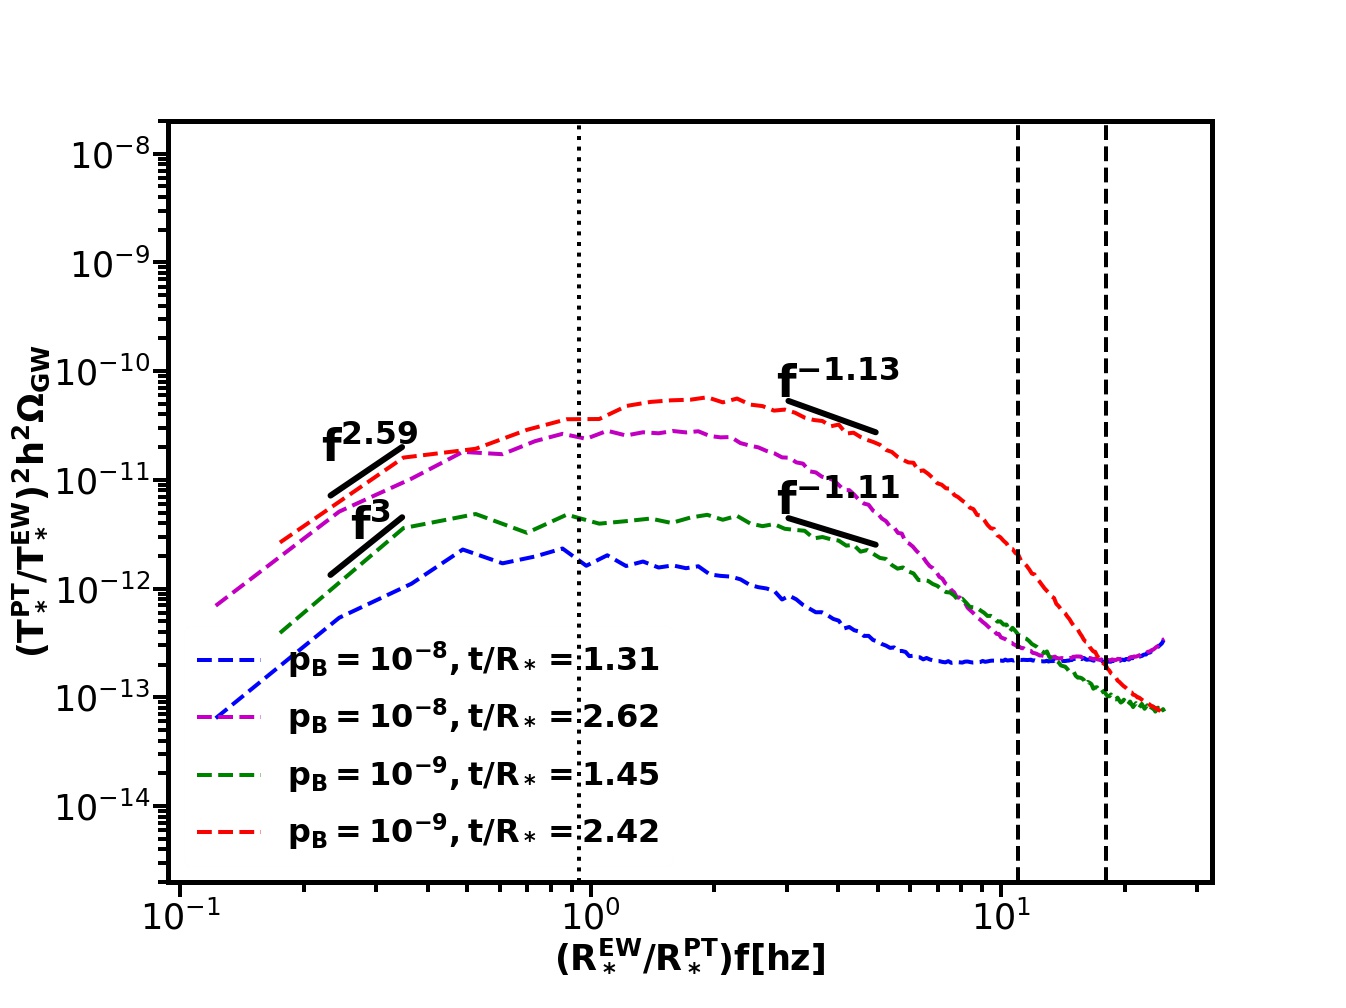

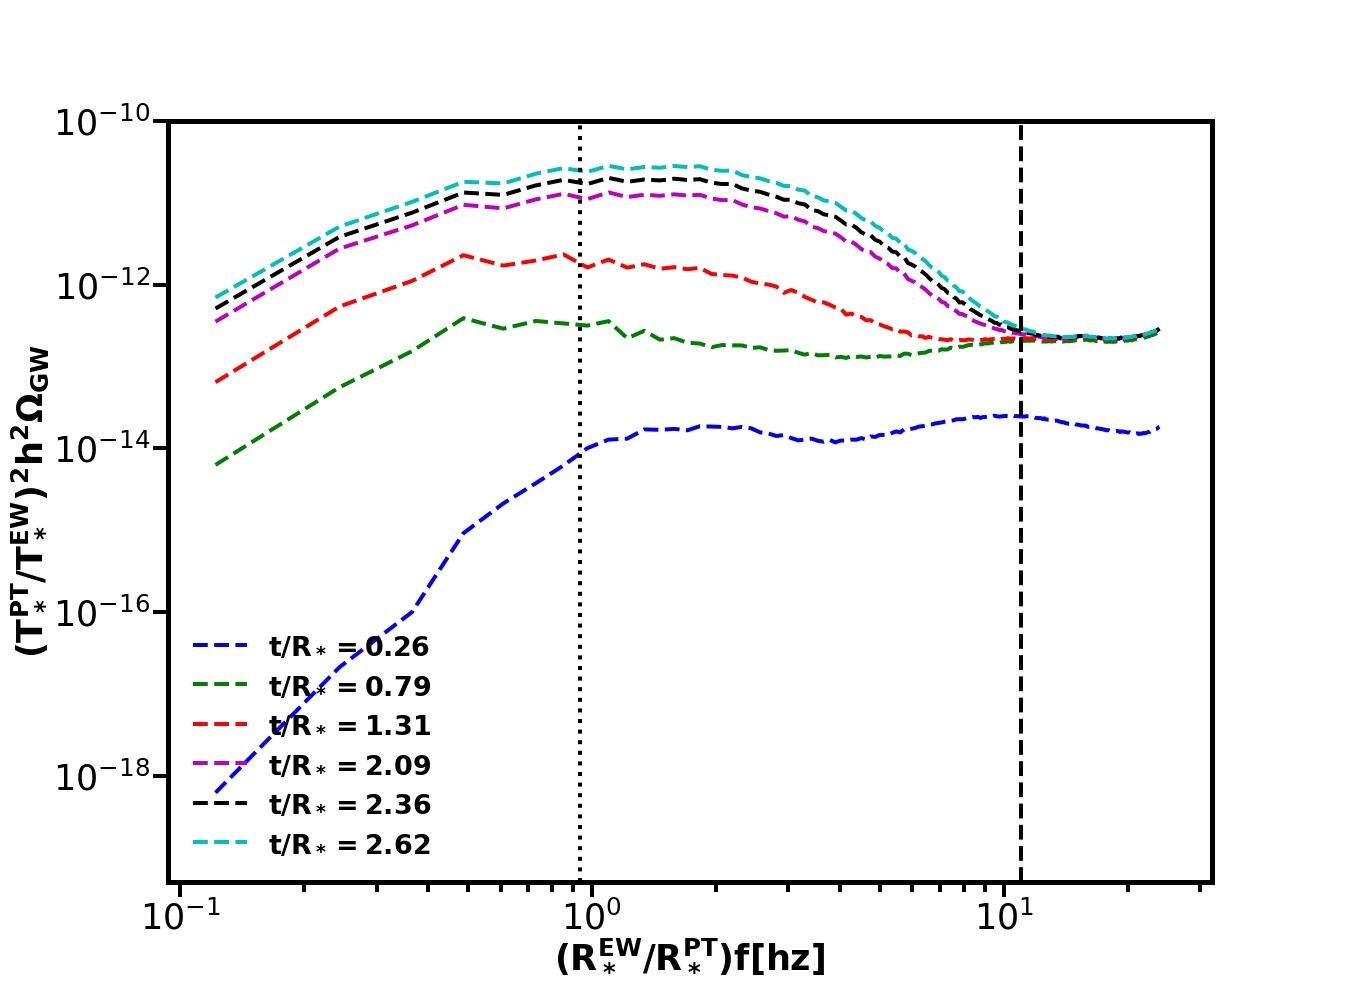
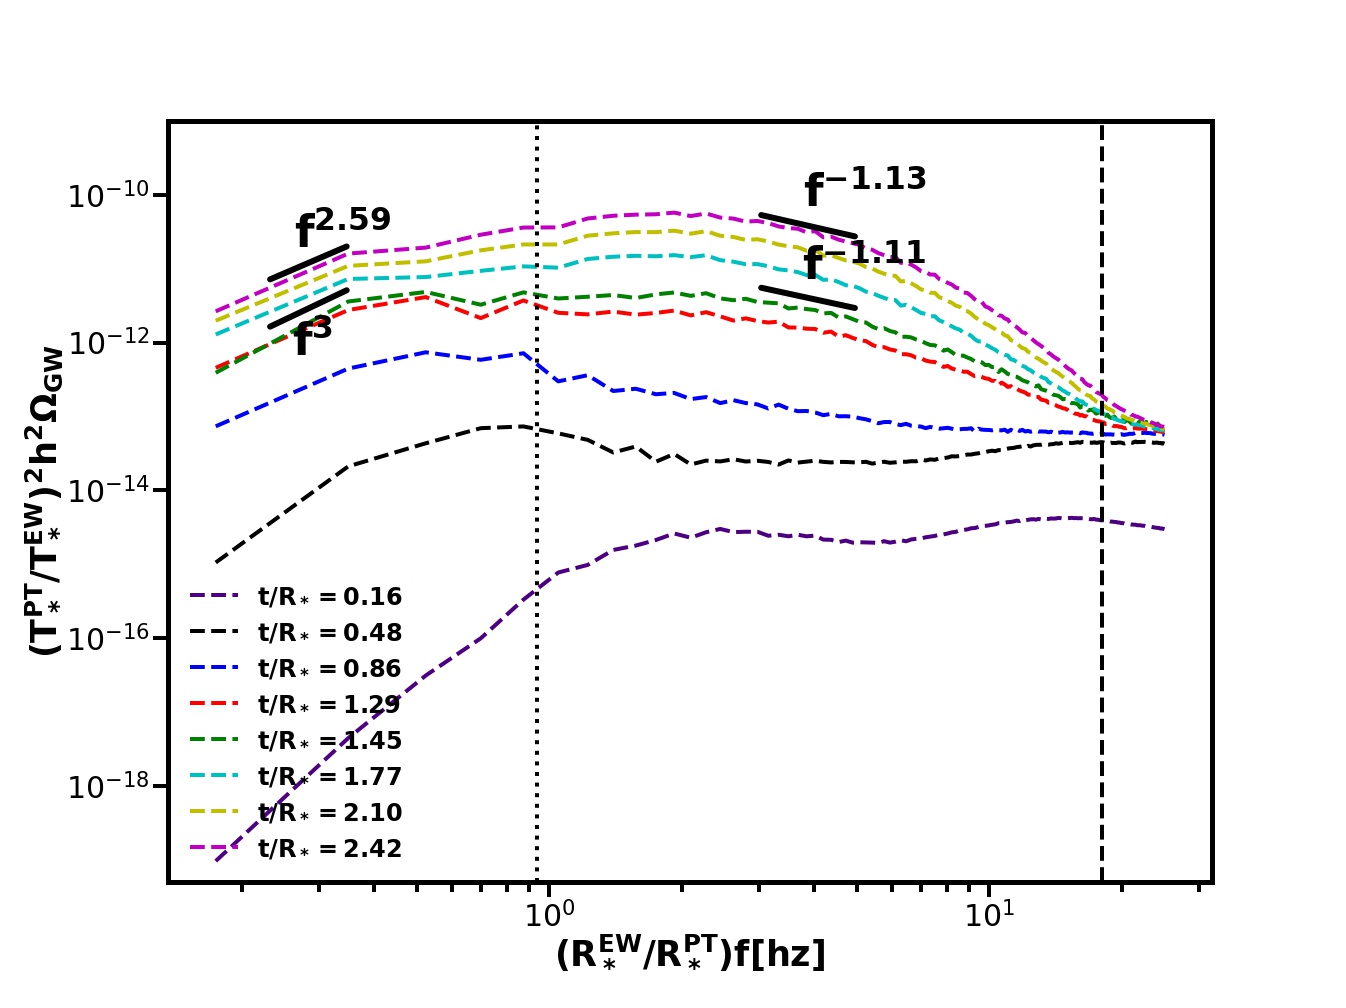
We now turn to study the property of the GW spectrum generated from the first-order electroweak PT. To show the wall width effects on the GW spectra, we present the GW production from the bubble collisions during the first-order PT with in the top panel of Fig. 3. In both two cases, the GW energy densities increase by around one order from bubble collision to the oscillation phase where MFs are generated (See Fig. 3 in the supplemental material for the time evolution of the GW spectra). Our simulation shows that the MFs contribution to the GWs production is negligible. We reconfirm the observation of Ref. Child and Giblin (2012); Cutting et al. (2018); Cutting et al. (2020a): 1) before , the dominant contribution to GWs is from the bubble collisions; 2) after , the GW energy spectrum continues growing and the peak of shifts toward a higher frequency in the oscillation/coalescence phase. We find that the magnitude of the GW spectrum falls into a valley at the length scale of the wall thickness , and we do not find the negligible contribution of GWs corresponds to the wall thickness observed in Ref. Cutting et al. (2018); Cutting et al. (2020a). We find that the GW energy spectrum at (the bubble collision phase) has a broken power-law form with for infrared and large frequency regions when , which is consistent with the previous envelope approximation study for the thin wall limit Kosowsky and Turner (1993); Huber and Konstandin (2008); Caprini et al. (2009b); Konstandin (2018), where the low-frequency behavior reveals the causality requirement Maggiore (2018), and the high-frequency behavior is consistent with the analytical calculations Huber and Konstandin (2008) in which the single bubble contribution is dominant Jinno and Takimoto (2017). At the simulation time of , the GW energy spectrum grows to be in the oscillation phase. Note that in the far infrared region is a universal result as found in Ref. Cai et al. (2020). Since GWs in the infrared region are sourced at the scale larger than , in this case may result from the limited length scale of the lattice, also may come from the fact that we fitted this form in the region not very far from the peak frequency, and we expect could be reproduced with larger resolution simulations and in the lower frequency region. Similar to the MF production, the behavior of the high frequency tail of (top panel of Fig. 3) is affected by the oscillations of the Higgs fields in bubbles overlap regions during the coalescence stage after the bubble collision. Different PT models can be realized in particular particle physics models beyond the SM, with different PT temperatures () and PT duration times (). For example, the electroweak PT can be first-order in xSM model and SMEFT, see Ref. Bian et al. (2020), with TeV and , and the peak frequency of the GW spectrum locates at Hz. To illustrate the sensitivities of variant GW detectors (including LISA Amaro-Seoane et al. (2017), Taiji Ruan et al. (2020), TianQin Luo et al. (2016), DECIGO Yagi and Seto (2011), and BBO Corbin and Cornish (2006), LIGO Abbott et al. (2016); Thrane and Romano (2013); Abbott et al. (2019), Einstein Telescope Hild et al. (2011); Punturo et al. (2010), and Cosmic Explorer Abbott et al. (2017)) for the GWs produced from variant PT models, we plot the bottom panel of Fig. 3, where the GWs are rescaled from the GW spectra generated with at (dashed curves) and (dotted curves).
Conclusions: In this Letter, we performed a simultaneous study of the MFs and GWs production at the first-order electroweak PT. Given the evolution of magnetohydrodynamics turbulence after the PT, we obtain the MFs at the characteristic correlation length Kahniashvili et al. (2013); Brandenburg et al. (2017) that may seed the observed MFs in galaxy clusters. Our simulation suggest that the MFs strength generated from the bubble collisions during the electroweak PT can reach G at a typical characteristic correlation length pc. The signature can be used to distinguish the MFs from the PT from other sources of MFs in the future observations. We note that though the maximum MFs strength here is comparable with the helical MFs generated by sphaleron decay when CP violation shows up Copi et al. (2008); Vachaspati (2001); Cornwall (1997), the MFs spectrum is totally different, which can be probed by future MFs observations. Furthermore, the probe of GWs spectrum at future GW detectors (such as LISA) is expected to discriminate GWs from the PT and other GW sources. We therefore establish the possibility for probing the first-order electroweak PT directly through the observation MFs at the correlation length, and the detection of its predicted GWs at space-based interferometers. This can serve as a inspection of the underlying new physics beyond the Standard model444For practical models studies of intergalactic MFs and GWs, see Ref. Ellis et al. (2019, 2020b)..
In the present study, we didn’t consider the interaction between fields and plasma since we focus on the MFs and GWs generation during the bubble collision stage. For vacuum phase transition where the sound wave absent, one only needs to consider bubble collisions. Generally, with the interaction between Higgs field and plasma, the predicted GW signal might be amplified to some extent in the high frequency region in comparison with the case only considering the bubble collision. For that situation, the sound wave will dominate over the GWs from bubble collisions Caprini et al. (2020). We expect our observation still holds there and left the detailed study to another publications. Different GW sources are distinguished by their different spectra. For GW spectrum produced by the first-order PT, one of key targets in the space-based GW detectors like LISA Amaro-Seoane et al. (2017), it is of typical broken power-law shape with different slopes for low and high frequencies Caprini et al. (2020, 2019); Caprini and Figueroa (2018).
Acknowledgements We thank John T. Giblin, Marek Lewicki, David Weir, Zach Weiner, Yiyang Zhang, and Haipeng An for communications. We are grateful to Francesc Ferrer, and Tanmay Vachaspati for enlightfull duscussions. Ligong Bian was supported by the National Natural Science Foundation of China under the grants Nos.12075041, 11605016, and 11947406, and Chongqing Natural Science Foundation (Grants No.cstc2020jcyj-msxmX0814), and the Fundamental Research Funds for the Central Universities of China (No. 2019CDXYWL0029). RGC is supported by the National Natural Science Foundation of China Grants No.11690022, No.11821505, No. 11991052, No.11947302 and by the Strategic Priority Research Program of the Chinese Academy of Sciences Grant No. XDB23030100 and the Key Research Program of Frontier Sciences of CAS.
Supplemental material The equations of motions (EOMs) are given by:
| (7) |
with the solutions subjected to the Gauss constraints:
| (8) |
The potential energy is given by , which we take the SM potential extended by a dimensional six operator for the evolution of these EOMs, the case of GeV can account for the first-order EWPT Zhou et al. (2020). The gradient energy and kinetic energy are and () with the being the covariant derivative, the two together construct the kinetic term of the electroweak theory.
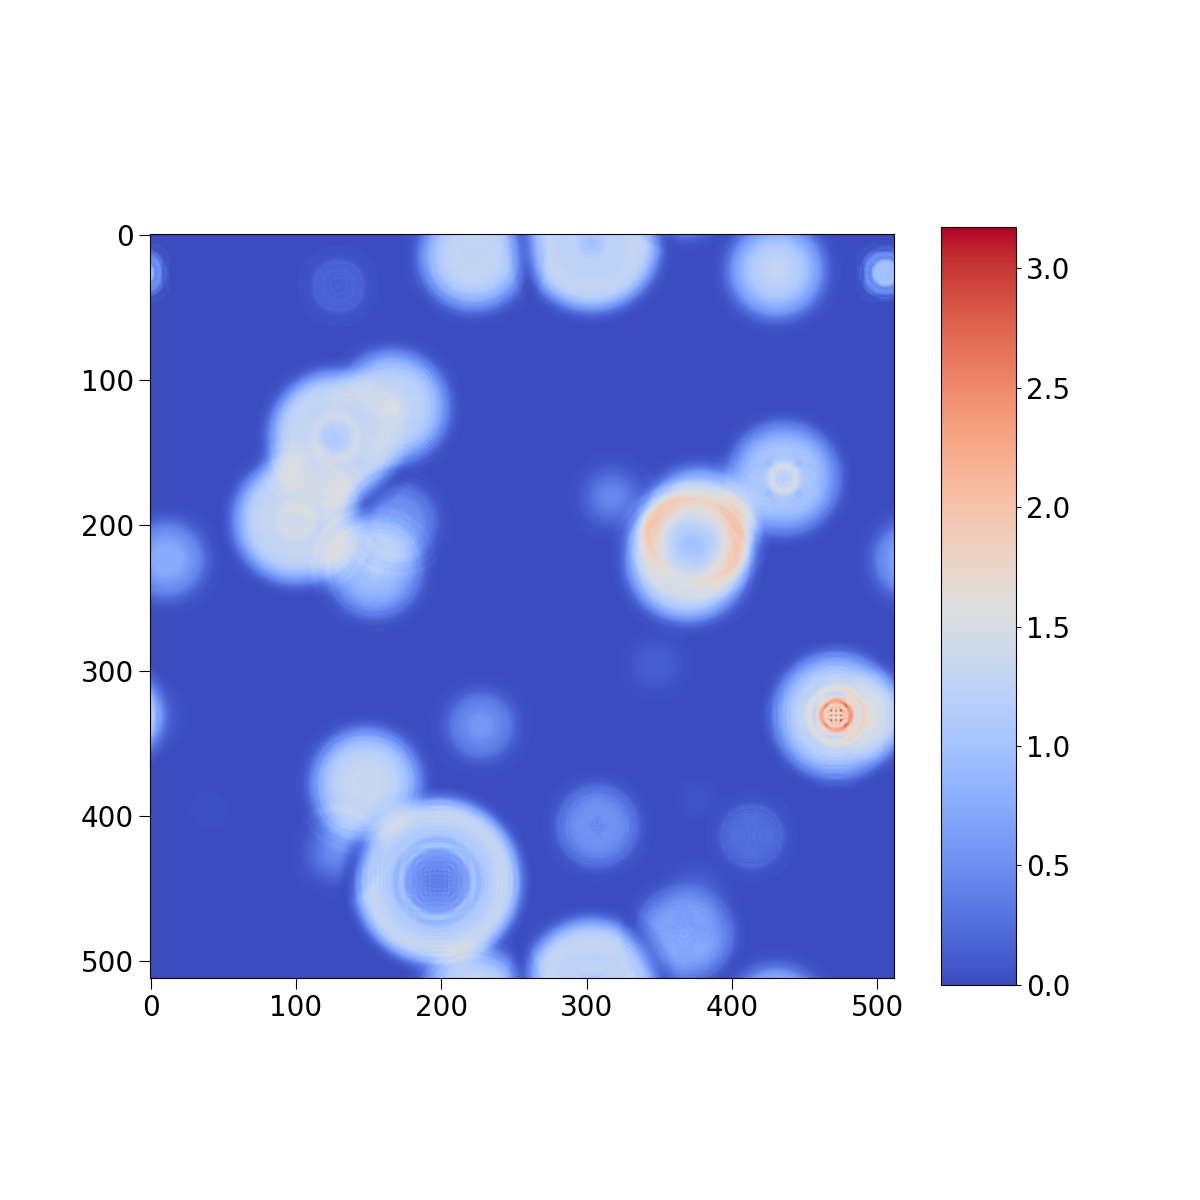
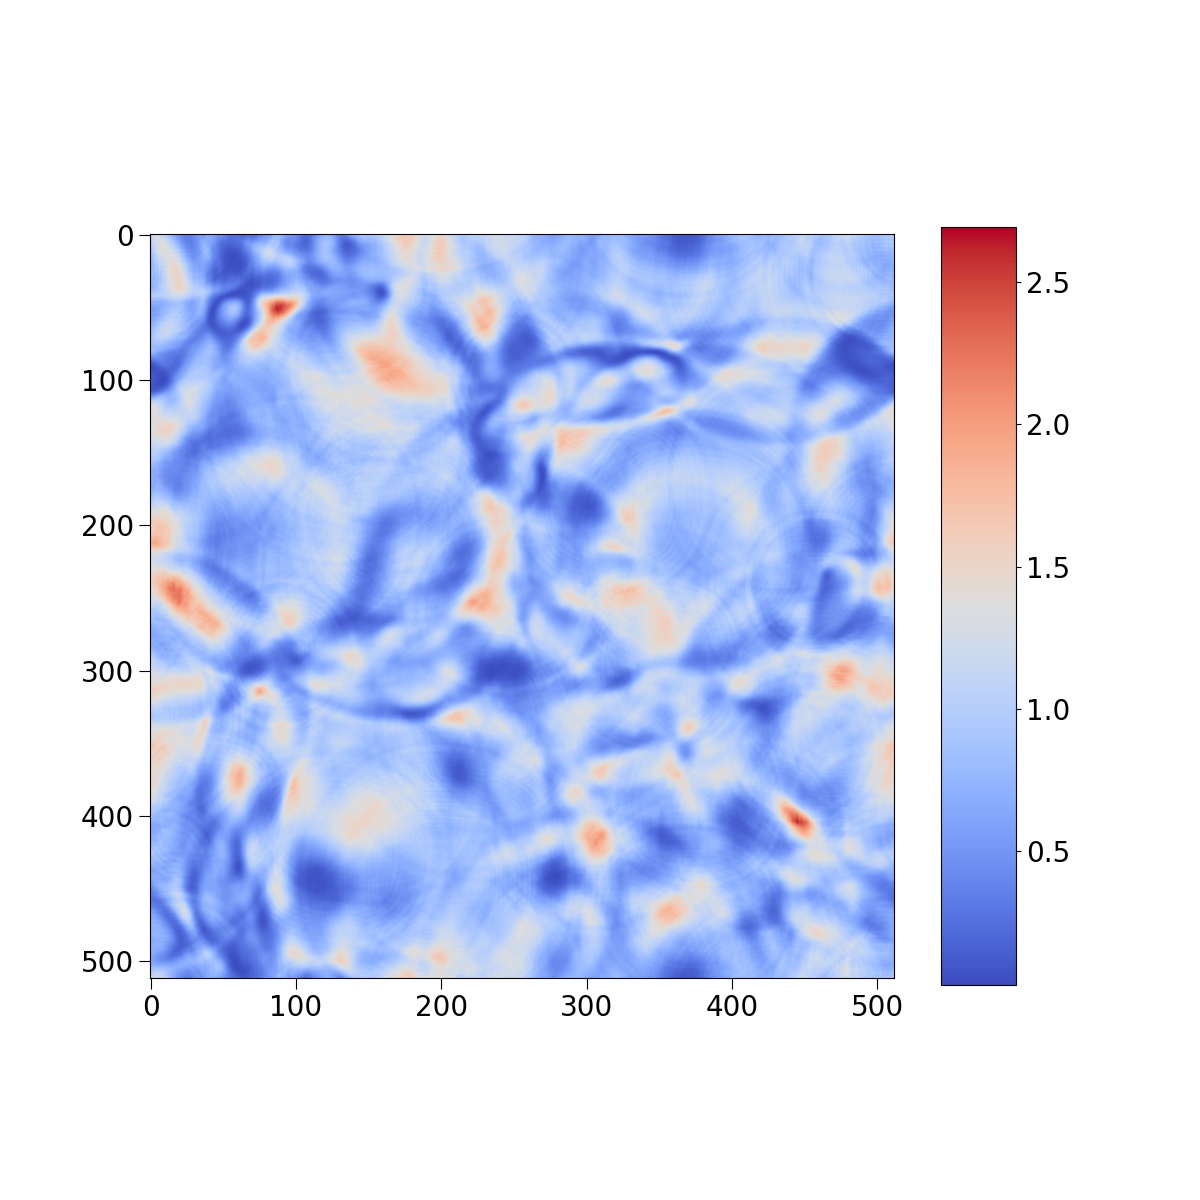
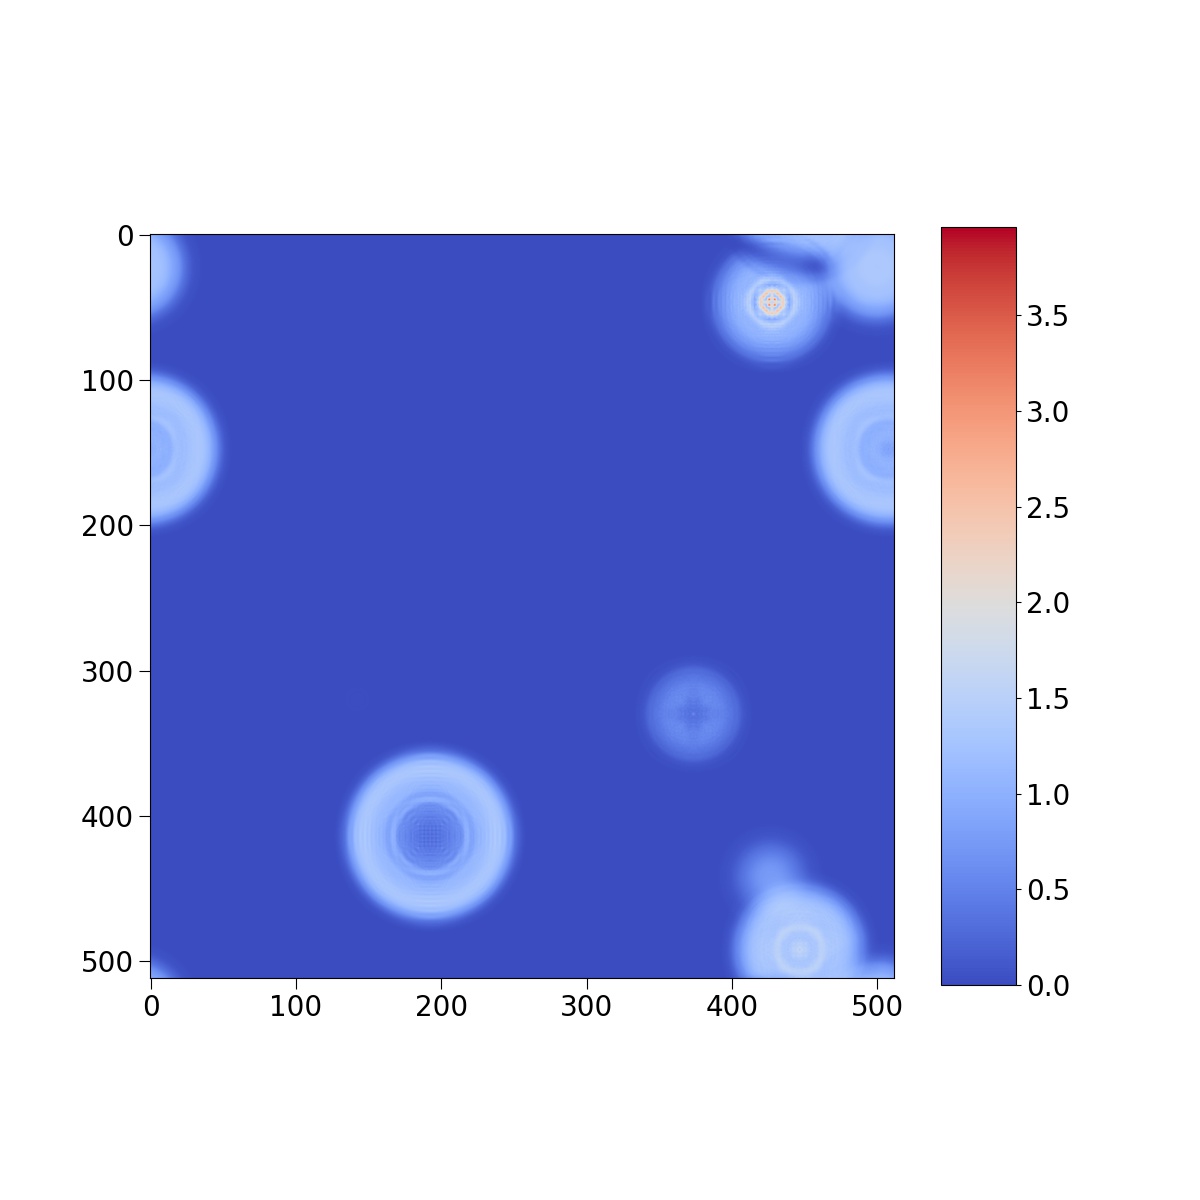
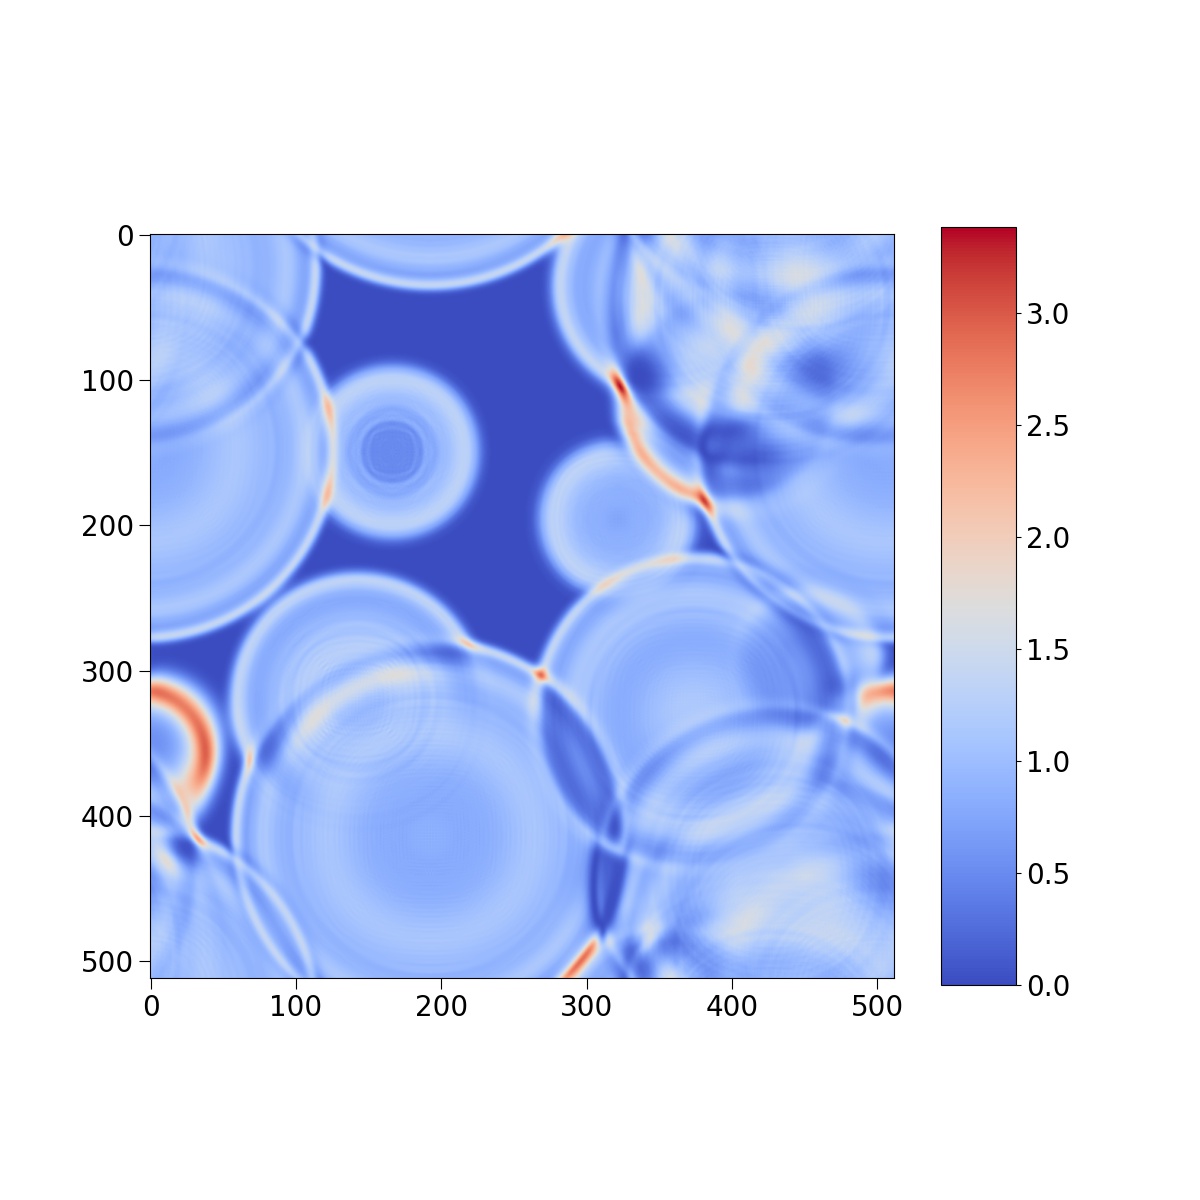
Fig. 4 shows the expansion and collision of the randomly generated bubbles, where we present the cases with bubble nucleation rates . The relation among the bubble velocity, mean bubble separation, and phase transition duration (that can be obtained through a bounce solution of the Euclidean action for nucleating a critical bubble of broken phase at finite temperature Caprini et al. (2020))555The relations among these parameters in particular PT models simulations can be obtained as in Ref Hindmarsh and Hijazi (2019); Cutting et al. (2020a); Cutting et al. (2018); Hindmarsh et al. (2014) . .
In Fig. 5, we plot the time accumulation MF spectra for and scenarios to consider thick and thin wall effects on the MF production. The MF spectra grow slightly during the Higgs oscillation stage. In Fig. 6, we plot the time accumulation GW spectra for and scenarios to consider thick and thin wall effects on the GWs production. We remove simulation artifacts by cut the spectra at around 20. In the right panel, we can find that the amplitude of GWs continually grows and the GW spectra change during the coalescence phase due to the Higgs oscillation in bubble overlap regions. Specially, the scaling of the high frequency tails decreases slightly.
References
- D’Onofrio et al. (2014) M. D’Onofrio, K. Rummukainen, and A. Tranberg, Phys. Rev. Lett. 113, 141602 (2014), eprint 1404.3565.
- Morrissey and Ramsey-Musolf (2012) D. E. Morrissey and M. J. Ramsey-Musolf, New J. Phys. 14, 125003 (2012), eprint 1206.2942.
- Arkani-Hamed et al. (2016) N. Arkani-Hamed, T. Han, M. Mangano, and L.-T. Wang, Phys. Rept. 652, 1 (2016), eprint 1511.06495.
- Abbott et al. (2016) B. P. Abbott et al. (LIGO Scientific, Virgo), Phys. Rev. Lett. 116, 061102 (2016), eprint 1602.03837.
- Mazumdar and White (2019) A. Mazumdar and G. White, Rept. Prog. Phys. 82, 076901 (2019), eprint 1811.01948.
- Caprini et al. (2016) C. Caprini et al., JCAP 04, 001 (2016), eprint 1512.06239.
- Caprini et al. (2020) C. Caprini et al., JCAP 03, 024 (2020), eprint 1910.13125.
- Amaro-Seoane et al. (2017) P. Amaro-Seoane et al. (LISA) (2017), eprint 1702.00786.
- Ruan et al. (2020) W.-H. Ruan, Z.-K. Guo, R.-G. Cai, and Y.-Z. Zhang, Int. J. Mod. Phys. A 35, 2050075 (2020), eprint 1807.09495.
- Luo et al. (2016) J. Luo et al. (TianQin), Class. Quant. Grav. 33, 035010 (2016), eprint 1512.02076.
- Corbin and Cornish (2006) V. Corbin and N. J. Cornish, Class. Quant. Grav. 23, 2435 (2006), eprint gr-qc/0512039.
- Yagi and Seto (2011) K. Yagi and N. Seto, Phys. Rev. D 83, 044011 (2011), [Erratum: Phys.Rev.D 95, 109901 (2017)], eprint 1101.3940.
- Yamazaki et al. (2012) D. G. Yamazaki, T. Kajino, G. J. Mathew, and K. Ichiki, Phys. Rept. 517, 141 (2012), eprint 1204.3669.
- Xu and Han (2019) J. Xu and J. L. Han, MNRAS 486, 4275 (2019).
- Han et al. (2018) J. L. Han, R. N. Manchester, W. van Straten, and P. Demorest, APJS 234, 11 (2018), eprint 1712.01997.
- Han (2017) J. Han, Annual Review of Astronomy and Astrophysics 55, 111 (2017), eprint https://doi.org/10.1146/annurev-astro-091916-055221, URL https://doi.org/10.1146/annurev-astro-091916-055221.
- Dermer et al. (2011) C. D. Dermer, M. Cavadini, S. Razzaque, J. D. Finke, J. Chiang, and B. Lott, Astrophys. J. Lett. 733, L21 (2011), eprint 1011.6660.
- Taylor et al. (2011) A. Taylor, I. Vovk, and A. Neronov, Astron. Astrophys. 529, A144 (2011), eprint 1101.0932.
- Neronov and Vovk (2010) A. Neronov and I. Vovk, Science 328, 73 (2010), eprint 1006.3504.
- Vachaspati (2001) T. Vachaspati, Phys. Rev. Lett. 87, 251302 (2001), eprint astro-ph/0101261.
- Durrer and Neronov (2013) R. Durrer and A. Neronov, Astron. Astrophys. Rev. 21, 62 (2013), eprint 1303.7121.
- Grasso and Rubinstein (2001) D. Grasso and H. R. Rubinstein, Phys. Rept. 348, 163 (2001), eprint astro-ph/0009061.
- Subramanian (2016) K. Subramanian, Rept. Prog. Phys. 79, 076901 (2016), eprint 1504.02311.
- Kandus et al. (2011) A. Kandus, K. E. Kunze, and C. G. Tsagas, Phys. Rept. 505, 1 (2011), eprint 1007.3891.
- Caprini et al. (2009a) C. Caprini, R. Durrer, and G. Servant, JCAP 12, 024 (2009a), eprint 0909.0622.
- Zhang et al. (2019) Y. Zhang, T. Vachaspati, and F. Ferrer, Phys. Rev. D 100, 083006 (2019), eprint 1902.02751.
- Cutting et al. (2020a) D. Cutting, E. G. Escartin, M. Hindmarsh, and D. J. Weir (2020a), eprint 2005.13537.
- Lewicki and Vaskonen (2020a) M. Lewicki and V. Vaskonen, Eur. Phys. J. C 80, 1003 (2020a), eprint 2007.04967.
- Lewicki and Vaskonen (2020b) M. Lewicki and V. Vaskonen (2020b), eprint 2012.07826.
- Diaz-Gil et al. (2008a) A. Diaz-Gil, J. Garcia-Bellido, M. Garcia Perez, and A. Gonzalez-Arroyo, Phys. Rev. Lett. 100, 241301 (2008a), eprint 0712.4263.
- Diaz-Gil et al. (2008b) A. Diaz-Gil, J. Garcia-Bellido, M. Garcia Perez, and A. Gonzalez-Arroyo, JHEP 07, 043 (2008b), eprint 0805.4159.
- Grojean et al. (2005) C. Grojean, G. Servant, and J. D. Wells, Phys. Rev. D 71, 036001 (2005), eprint hep-ph/0407019.
- Grojean and Servant (2007) C. Grojean and G. Servant, Phys. Rev. D 75, 043507 (2007), eprint hep-ph/0607107.
- Cai et al. (2017) R.-G. Cai, M. Sasaki, and S.-J. Wang, JCAP 1708, 004 (2017), eprint 1707.03001.
- Profumo et al. (2015) S. Profumo, M. J. Ramsey-Musolf, C. L. Wainwright, and P. Winslow, Phys. Rev. D 91, 035018 (2015), eprint 1407.5342.
- Zhou et al. (2020) R. Zhou, L. Bian, and H.-K. Guo, Phys. Rev. D 101, 091903 (2020), eprint 1910.00234.
- Bian et al. (2020) L. Bian, H.-K. Guo, Y. Wu, and R. Zhou, Phys. Rev. D 101, 035011 (2020), eprint 1906.11664.
- Alves et al. (2019) A. Alves, T. Ghosh, H.-K. Guo, K. Sinha, and D. Vagie, JHEP 04, 052 (2019), eprint 1812.09333.
- Profumo et al. (2007) S. Profumo, M. J. Ramsey-Musolf, and G. Shaughnessy, JHEP 08, 010 (2007), eprint 0705.2425.
- Espinosa et al. (2012) J. R. Espinosa, T. Konstandin, and F. Riva, Nucl. Phys. B 854, 592 (2012), eprint 1107.5441.
- Jiang et al. (2016) M. Jiang, L. Bian, W. Huang, and J. Shu, Phys. Rev. D 93, 065032 (2016), eprint 1502.07574.
- Cline et al. (2011) J. M. Cline, K. Kainulainen, and M. Trott, JHEP 11, 089 (2011), eprint 1107.3559.
- Dorsch et al. (2013) G. Dorsch, S. Huber, and J. No, JHEP 10, 029 (2013), eprint 1305.6610.
- Dorsch et al. (2014) G. Dorsch, S. Huber, K. Mimasu, and J. No, Phys. Rev. Lett. 113, 211802 (2014), eprint 1405.5537.
- Bernon et al. (2018) J. Bernon, L. Bian, and Y. Jiang, JHEP 05, 151 (2018), eprint 1712.08430.
- Andersen et al. (2018) J. O. Andersen, T. Gorda, A. Helset, L. Niemi, T. V. I. Tenkanen, A. Tranberg, A. Vuorinen, and D. J. Weir, Phys. Rev. Lett. 121, 191802 (2018), eprint 1711.09849.
- Kainulainen et al. (2019) K. Kainulainen, V. Keus, L. Niemi, K. Rummukainen, T. V. Tenkanen, and V. Vaskonen, JHEP 06, 075 (2019), eprint 1904.01329.
- Zhou et al. (2019) R. Zhou, W. Cheng, X. Deng, L. Bian, and Y. Wu, JHEP 01, 216 (2019), eprint 1812.06217.
- Bian et al. (2018) L. Bian, H.-K. Guo, and J. Shu, Chin. Phys. C 42, 093106 (2018), [Erratum: Chin.Phys.C 43, 129101 (2019)], eprint 1704.02488.
- Huber et al. (2016) S. J. Huber, T. Konstandin, G. Nardini, and I. Rues, JCAP 03, 036 (2016), eprint 1512.06357.
- Hindmarsh et al. (2014) M. Hindmarsh, S. J. Huber, K. Rummukainen, and D. J. Weir, Phys. Rev. Lett. 112, 041301 (2014), eprint 1304.2433.
- Cutting et al. (2020b) D. Cutting, M. Hindmarsh, and D. J. Weir, Phys. Rev. Lett. 125, 021302 (2020b), eprint 1906.00480.
- Hindmarsh et al. (2015) M. Hindmarsh, S. J. Huber, K. Rummukainen, and D. J. Weir, Phys. Rev. D 92, 123009 (2015), eprint 1504.03291.
- Hindmarsh et al. (2017) M. Hindmarsh, S. J. Huber, K. Rummukainen, and D. J. Weir, Phys. Rev. D 96, 103520 (2017), [Erratum: Phys.Rev.D 101, 089902 (2020)], eprint 1704.05871.
- Hindmarsh and Hijazi (2019) M. Hindmarsh and M. Hijazi, JCAP 1912, 062 (2019), eprint 1909.10040.
- Cutting et al. (2018) D. Cutting, M. Hindmarsh, and D. J. Weir, Phys. Rev. D 97, 123513 (2018), eprint 1802.05712.
- Rajantie et al. (2001) A. Rajantie, P. Saffin, and E. J. Copeland, Phys. Rev. D 63, 123512 (2001), eprint hep-ph/0012097.
- Zhang et al. (2017) Y. Zhang, F. Ferrer, and T. Vachaspati, Phys. Rev. D 96, 043014 (2017), eprint 1706.00040.
- ’t Hooft (1974) G. ’t Hooft, Nucl. Phys. B 79, 276 (1974).
- Vachaspati (1991) T. Vachaspati, Phys. Lett. B 265, 258 (1991).
- Brandenburg et al. (2017) A. Brandenburg, T. Kahniashvili, S. Mandal, A. Roper Pol, A. G. Tevzadze, and T. Vachaspati, Phys. Rev. D 96, 123528 (2017), eprint 1711.03804.
- Brandenburg et al. (2018) A. Brandenburg, R. Durrer, T. Kahniashvili, S. Mandal, and W. W. Yin, JCAP 08, 034 (2018), eprint 1804.01177.
- Giblin and Mertens (2014) J. T. Giblin and J. B. Mertens, Phys. Rev. D 90, 023532 (2014), eprint 1405.4005.
- Roper Pol et al. (2020) A. Roper Pol, S. Mandal, A. Brandenburg, T. Kahniashvili, and A. Kosowsky, Phys. Rev. D 102, 083512 (2020), eprint 1903.08585.
- Garcia-Bellido et al. (2008) J. Garcia-Bellido, D. G. Figueroa, and A. Sastre, Phys. Rev. D 77, 043517 (2008), eprint 0707.0839.
- Konstandin (2018) T. Konstandin, JCAP 03, 047 (2018), eprint 1712.06869.
- Ellis et al. (2020a) J. Ellis, M. Lewicki, and V. Vaskonen, JCAP 11, 020 (2020a), eprint 2007.15586.
- Caprini and Durrer (2006) C. Caprini and R. Durrer, Phys. Rev. D 74, 063521 (2006), eprint astro-ph/0603476.
- Saga et al. (2018) S. Saga, H. Tashiro, and S. Yokoyama, Phys. Rev. D 98, 083518 (2018), eprint 1807.00561.
- Garcia Garcia et al. (2018) I. Garcia Garcia, S. Krippendorf, and J. March-Russell, Phys. Lett. B 779, 348 (2018), eprint 1607.06813.
- Mukhanov (2005) V. Mukhanov, Physical Foundations of Cosmology (Cambridge University Press, Oxford, 2005), ISBN 978-0-521-56398-7.
- Ackermann et al. (2018) M. Ackermann et al. (Fermi-LAT), Astrophys. J. Suppl. 237, 32 (2018), eprint 1804.08035.
- Kahniashvili et al. (2010) T. Kahniashvili, A. G. Tevzadze, S. K. Sethi, K. Pandey, and B. Ratra, Phys. Rev. D 82, 083005 (2010), eprint 1009.2094.
- Kawasaki and Kusakabe (2012) M. Kawasaki and M. Kusakabe, Phys. Rev. D 86, 063003 (2012), eprint 1204.6164.
- Seshadri and Subramanian (2009) T. R. Seshadri and K. Subramanian, Phys. Rev. Lett. 103, 081303 (2009), eprint 0902.4066.
- Ade et al. (2016) P. A. R. Ade et al. (Planck), Astron. Astrophys. 594, A19 (2016), eprint 1502.01594.
- Jedamzik et al. (2000) K. Jedamzik, V. Katalinic, and A. V. Olinto, Phys. Rev. Lett. 85, 700 (2000), eprint astro-ph/9911100.
- Barrow et al. (1997) J. D. Barrow, P. G. Ferreira, and J. Silk, Phys. Rev. Lett. 78, 3610 (1997), eprint astro-ph/9701063.
- Durrer et al. (2000) R. Durrer, P. G. Ferreira, and T. Kahniashvili, Phys. Rev. D 61, 043001 (2000), eprint astro-ph/9911040.
- Trivedi et al. (2010) P. Trivedi, K. Subramanian, and T. R. Seshadri, Phys. Rev. D 82, 123006 (2010), eprint 1009.2724.
- Child and Giblin (2012) H. L. Child and J. Giblin, John T., JCAP 10, 001 (2012), eprint 1207.6408.
- Kosowsky and Turner (1993) A. Kosowsky and M. S. Turner, Phys. Rev. D 47, 4372 (1993), eprint astro-ph/9211004.
- Huber and Konstandin (2008) S. J. Huber and T. Konstandin, JCAP 09, 022 (2008), eprint 0806.1828.
- Caprini et al. (2009b) C. Caprini, R. Durrer, T. Konstandin, and G. Servant, Phys. Rev. D 79, 083519 (2009b), eprint 0901.1661.
- Maggiore (2018) M. Maggiore, Gravitational Waves. Vol. 2: Astrophysics and Cosmology (Oxford University Press, 2018), ISBN 978-0-19-857089-9.
- Jinno and Takimoto (2017) R. Jinno and M. Takimoto, Phys. Rev. D 95, 024009 (2017), eprint 1605.01403.
- Cai et al. (2020) R.-G. Cai, S. Pi, and M. Sasaki, Phys. Rev. D102, 083528 (2020), eprint 1909.13728.
- Thrane and Romano (2013) E. Thrane and J. D. Romano, Phys. Rev. D 88, 124032 (2013), eprint 1310.5300.
- Abbott et al. (2019) B. Abbott et al. (LIGO Scientific, Virgo), Phys. Rev. D 100, 061101 (2019), eprint 1903.02886.
- Hild et al. (2011) S. Hild et al., Class. Quant. Grav. 28, 094013 (2011), eprint 1012.0908.
- Punturo et al. (2010) M. Punturo et al., Class. Quant. Grav. 27, 194002 (2010).
- Abbott et al. (2017) B. P. Abbott et al. (LIGO Scientific), Class. Quant. Grav. 34, 044001 (2017), eprint 1607.08697.
- Kahniashvili et al. (2013) T. Kahniashvili, A. G. Tevzadze, A. Brandenburg, and A. Neronov, Phys. Rev. D 87, 083007 (2013), eprint 1212.0596.
- Copi et al. (2008) C. J. Copi, F. Ferrer, T. Vachaspati, and A. Achucarro, Phys. Rev. Lett. 101, 171302 (2008), eprint 0801.3653.
- Cornwall (1997) J. M. Cornwall, Phys. Rev. D 56, 6146 (1997), eprint hep-th/9704022.
- Ellis et al. (2019) J. Ellis, M. Fairbairn, M. Lewicki, V. Vaskonen, and A. Wickens, JCAP 09, 019 (2019), eprint 1907.04315.
- Ellis et al. (2020b) J. Ellis, M. Fairbairn, M. Lewicki, V. Vaskonen, and A. Wickens, JCAP 10, 032 (2020b), eprint 2005.05278.
- Caprini et al. (2019) C. Caprini, D. G. Figueroa, R. Flauger, G. Nardini, M. Peloso, M. Pieroni, A. Ricciardone, and G. Tasinato, JCAP 1911, 017 (2019), eprint 1906.09244.
- Caprini and Figueroa (2018) C. Caprini and D. G. Figueroa, Class. Quant. Grav. 35, 163001 (2018), eprint 1801.04268.