The Economics of Variable Renewables and Electricity Storage
Abstract
The transformation of the electricity sector is a main element of the transition to a decarbonized economy. Conventional generators powered by fossil fuels have to be replaced by variable renewable energy (VRE) sources in combination with electricity storage and other options for providing temporal flexibility. We discuss the market dynamics of increasing VRE penetration and their integration in the electricity system. We describe the merit-order effect (decline of wholesale electricity prices as VRE penetration increases) and the cannibalization effect (decline of VRE value as their penetration increases). We further review the role of electricity storage and other flexibility options for integrating variable renewables, and how storage can contribute to mitigating the two mentioned effects. We also use a stylized open-source model to provide some graphical intuition on this. While relatively high shares of VRE are achievable with moderate amounts of electricity storage, the role of long-term storage increases as the VRE share approaches 100%.
keywords:
energy transition, decarbonization, variable renewable energy sources, electricity storage, merit-order effect, cannibalization effect1 Introduction
“Climate change is the mother of all externalities: larger, more complex, and more uncertain than any other environmental problem” (Tol, 2009). Electricity and heat production account for 25% of global emissions (Edenhofer et al., 2014), and all energy-related emissions represent almost three quarters of the total (Friedlingstein et al., 2019). Fast and substantial emissions reductions related to energy use are essential for mitigating climate change. Compared to other sectors, the electricity sector offers particularly attractive low-cost mitigation options, given the availability of low-carbon energy technologies (IEA, 2020a).
The use of renewable energy sources is the major and most promising strategy for fast and deep decarbonization of the electricity sector in terms of sustainability, affordability and availability (abundance of economically viable and secure resources). Beyond today’s power sectors, renewable electricity can also be used to substitute fossil fuels in other sectors, such as heating and transport, a strategy often referred to as sector coupling. Due to limited potentials of dispatchable renewable energy sources, such as bioenergy, hydropower, and geothermal, most countries focus on the expansion of variable renewable energy (VRE) sources. These include solar photovoltaics (PV) as well as onshore and offshore wind power.
Yet integrating high shares of VRE into the electricity sector is not without challenges. Traditional electricity markets were characterized by large, dispatchable electricity generation technologies that adjust production to meet the variable electricity demand at every time. In a deeply decarbonized electricity system with high VRE penetration, however, smaller-scale and distributed VRE generators have to be complemented with options that provide temporal flexibility and geographical balancing. One major option for providing temporal flexibility is electricity storage, which is in the focus of this article. Yet several alternative flexibility options on both the demand and supply sides may complement or partly substitute electricity storage. These include demand-side management, dispatchable generation, and sector coupling. Geographical balancing can also help to address temporal flexibility issues (Section 3.1.4).
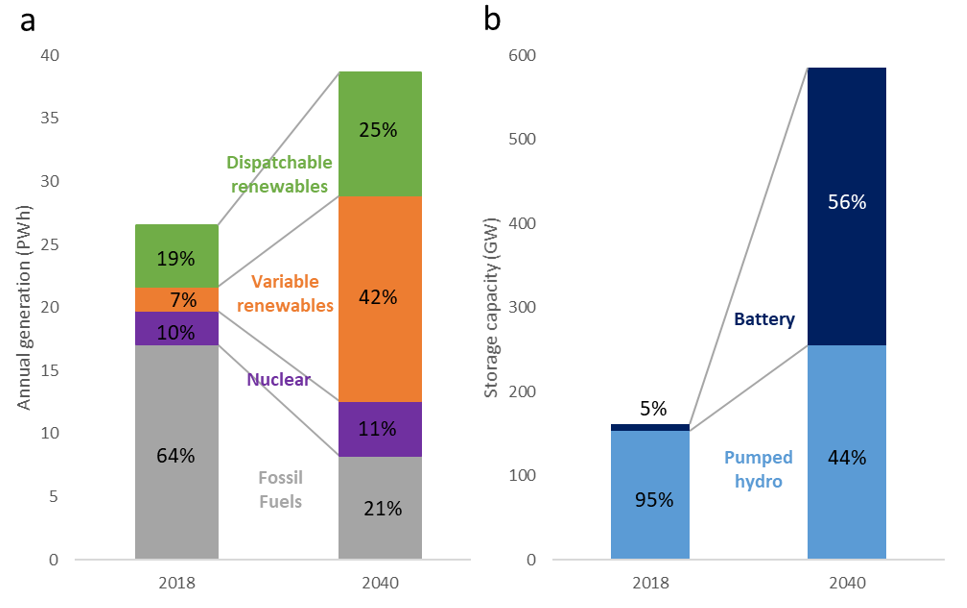
The International Energy Agency (IEA) estimates that in a sustainable development scenario where the Paris Agreement is met, variable renewables should provide 42% of electricity by 2040, compared to the 7% of the generation mix they represented in 2018 (Figure 1). Similarly, whereas the main form of electricity storage is currently pumped hydro, accounting for 95% of the total installed power capacity in 2018, the IEA estimates that battery storage will grow from a capacity of GW in 2018 to GW in 2040, representing thus more than half of the storage power capacity (IEA, 2018, 2019b). Considering that both the IPCC (Creutzig et al., 2017) and the IEA (Hoekstra et al., 2017) tend to underestimate VRE developments in general and solar deployment in particular, these estimations are likely a lower bound of the potential VRE contribution to a decarbonized electricity system. Several studies demonstrate the technical and economic viability of fully renewable electricity supply in Europe (Child et al., 2019) and worldwide (Jacobson et al., 2017).
Given the prominence of variable renewable energy sources and electricity storage technologies in decarbonized electricity systems, we discuss the economics of VRE, storage, and their interactions. Section 2 reviews the economics of VRE compared to conventional dispatchable technologies and highlights their electricity market impacts, in particular the merit-order and cannibalization effects. Section 3 introduces electricity storage and discusses applications and competing sources of flexibility (3.1), reviews the literature on the interaction between VRE and electricity storage (3.2), and provides graphical intuition on the changing role and value of electricity storage under increasing VRE shares (3.3).
2 The economics of variable renewable energy sources
2.1 Why variable renewables?
Fossil fuels (oil, gas and coal) have dominated the energy mix since the industrial revolution, currently accounting for 84.3% of global primary energy supply and 72.8% of global electricity generation (BP, 2020). Fossil fuels have a high energy density and are suitable for multiple applications, but they have high external costs related to emissions, local pollution, and human toxicity, among others (Ecofys, 2014; Karkour et al., 2020).
The Paris Agreement set the goal to reduce emissions to limit global warming “well below” C with respect to pre-industrial levels. Given that the earth has already warmed by C (Masson-Delmotte et al., 2018), this goal entails rapid decarbonization of all economic sectors, in which the electricity sector plays a major role. This rapid decarbonization goal entails that current fossil fuel use must be replaced by low-carbon technologies in a relatively short time. To have a perspective of the scale of this challenge, the International Energy Agency estimates that 740 billion US-$ will have to be invested annually up to 2030 in clean energy technologies in a sustainable development scenario, compared to 480 billion US-$ invested in 2018 (IEA, 2020b).
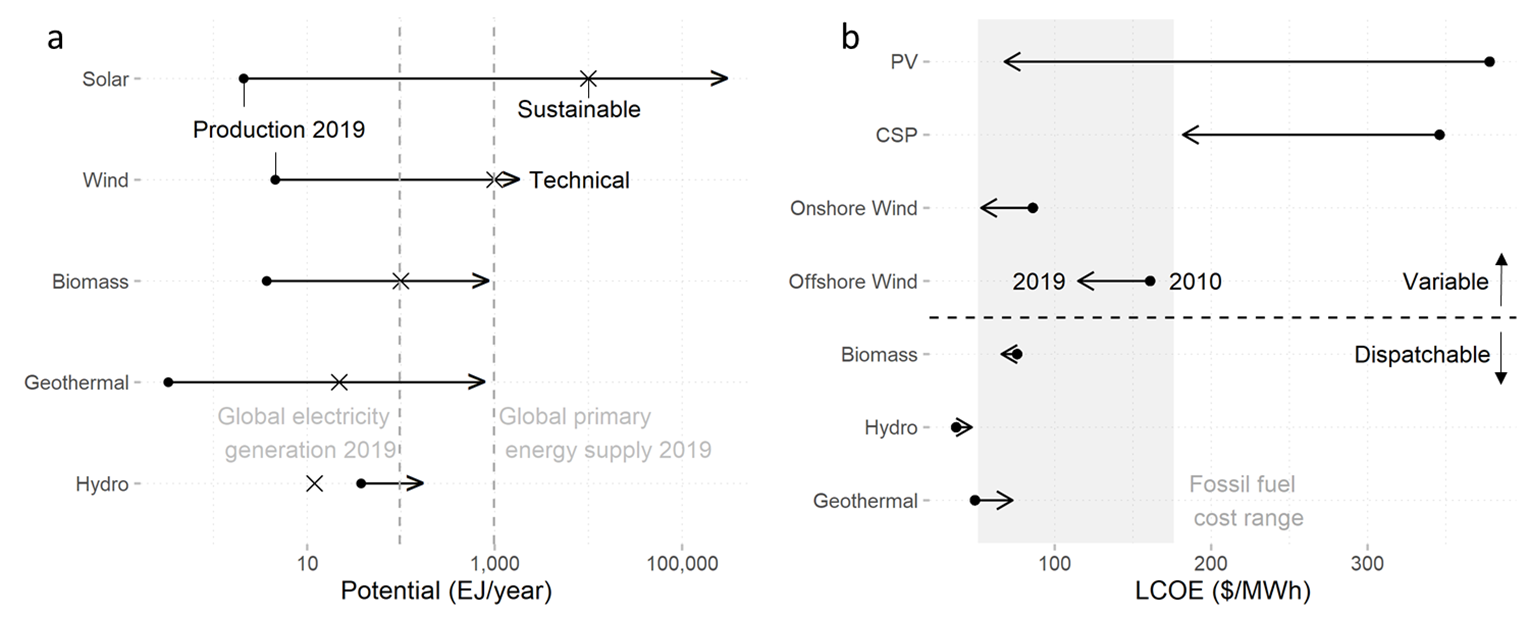
Future energy technologies must address three energy policy targets, which are sometimes traded off against each other: sustainability, availability and affordability. Sustainability entails that new energy technologies must be low-carbon and also come with low other external costs, such as biodiversity loss, safety risks, or local pollution. Availability means that energy resources must be abundant, secure and widely accessible. Opposite to fossil fuels or uranium, renewable energy sources provide an annual flow of energy that is available worldwide, and which energy potential exceeds current and prospective global energy needs (Figure 2). Finally, affordability requires that the technologies that exploit these resources have a reasonable cost in relation to the value they provide and compared to the alternatives. Wind and solar costs have dropped dramatically in the last decade and are already within the cost range of fossil fuels (IRENA, 2020), even without accounting for external costs (Figure 2). Additionally, the declining VRE cost is expected to continue (Mayer et al., 2015; Agora Energiewende, 2017; Vartiainen et al., 2020).
2.2 Dispatchable vs. variable technologies
2.2.1 Dispatchable technologies
The electricity system is characterized by the constraint that supply and demand must be equal at every point in time. In most markets, electricity demand shows substantial temporal variations, but large parts of the demand do not respond to prices in the short term. Accordingly, electricity supply has to continuously adapt to meet demand.
Conventional technologies have different degrees of “dispatchability”, ranging from what is often referred to as “baseload” technologies, such as nuclear, that mostly produce evenly across all hours, to “peak load” technologies, such as gas turbines, that generally offer higher operational flexibility and only produce during hours of high demand. The dispatchability of a technology is determined by the cost structure of a technology. On top, generation technologies differ with respect to their ability of ramping up and down in the short-term as well as related costs (cf. Schill et al., 2017a). Baseload technologies usually have high capital cost and low variable cost, and their output is often relatively inflexible in the short term. Peaking technologies in contrast have lower capital costs and higher variable cost, and they are better able to ramp up or down production in the short term. The composition of the electricity system supply is therefore determined by the operational flexibility and cost structure of the different technologies, which determine their ability to meet demand. This can be summarized in screening curves representing the cost structure of each technology and their equivalent load duration curves showing how each technology covers a segment of demand during a year (Stoft, 2002).
2.2.2 Variable technologies
The economics of wind (van Kooten, 2016) and solar (Baker et al., 2013) power differ from that of dispatchable technologies (cp. also Hirth et al., 2016). The main difference is that variable renewable technologies can only generate when the resource is available, so once a plant is installed, producers do not have any control over production beyond curtailment. They further have a specific cost structure with virtually zero variable cost and relatively high fixed cost. Variability occurs at different timescales and differs for wind power and solar. Very short-term variability, caused for example by clouds for the case of PV, can be easily smoothed out by aggregating installations over larger areas. Diurnal cycles are caused by earth rotation and generally require some form of energy storage. Finally, annual seasonality, caused by earth revolution, is the hardest form of variability as it requires longer-term flexibility across seasons.
As an exemplary illustration of variable renewable patterns, Figure 3 shows normalized (0-1 for each region and technology) wind and solar PV generation in California (Figure 3 a) and Germany (Figure 3 b) during the year 2016. Short-term variability is smoothed out by the country/state-wide spatial aggregation and averaging of the hours of each month (in local time). Solar cycles are homogeneous across regions: solar always generates only by day and more in summer than in winter. Since solar seasonality is smoother as we approach the equator, differences between summer and winter generation are smaller in California than in Germany. Wind power is more location-specific: whereas wind produces more during the night than at noon in both regions, the seasonal peak is in summer in California and winter in Germany.

2.2.3 The value of dispatchable vs. variable generation
Variable renewables do not only differ from dispatchable technologies in terms of costs, but also in terms of value (Joskow, 2011). Lamont (2008) provides an analytical formulation of the difference between the marginal values of VRE and dispatchable technologies. The marginal value () of a dispatchable generator is the sum of the difference between the hourly electricity price () and the generator’s variable cost () (assumed constant) for all the hours when the generator produces at its maximum capacity ().
| (1) |
The marginal value of a variable generator is the average electricity price () times the average capacity factor (actual production as a fraction of peak capacity, ) plus the covariance between the hourly price and hourly capacity factor () for all hours of the year (). The first summand represents the average unit revenues of the generator, whereas the second captures its load-matching capability, i.e., the correlation between demand and supply patterns.
| (2) |
Whereas the marginal value of dispatchable technologies depends on a random variable (price) and constant (variable cost), the marginal value of VRE depends on the covariance between price and capacity factor. Since VRE have zero variable cost, increasing VRE penetration reduces electricity prices due to the merit-order effect (MOE). The covariance between price and capacity factor depends on the share of VRE, as the price will generally be lower the higher VRE penetration, all other factors held constant. The merit-order effect (reduction of prices as VRE penetration increases, see section 2.3) and the cannibalization effect (reduction of VRE value as penetration increases, see section 2.5) have been theoretically explained in the literature and empirically estimated in countries with relatively high VRE penetration. The next sections introduce a graphical conceptualization of these phenomena and review the corresponding empirical findings.
2.3 The merit-order effect
Electricity is a perfectly homogeneous good in three dimensions: time, space, and lead-time between contract and delivery (Hirth et al., 2016). This entails that the market clears at marginal cost for every time, location and market run, but the price may substantially vary across these three dimensions, depending on the market design. Since VRE have zero variable cost, higher penetration of VRE depresses wholesale electricity prices. The equilibrium price and quantity of electricity delivered each hour to the market is given by the intersection between demand and supply.
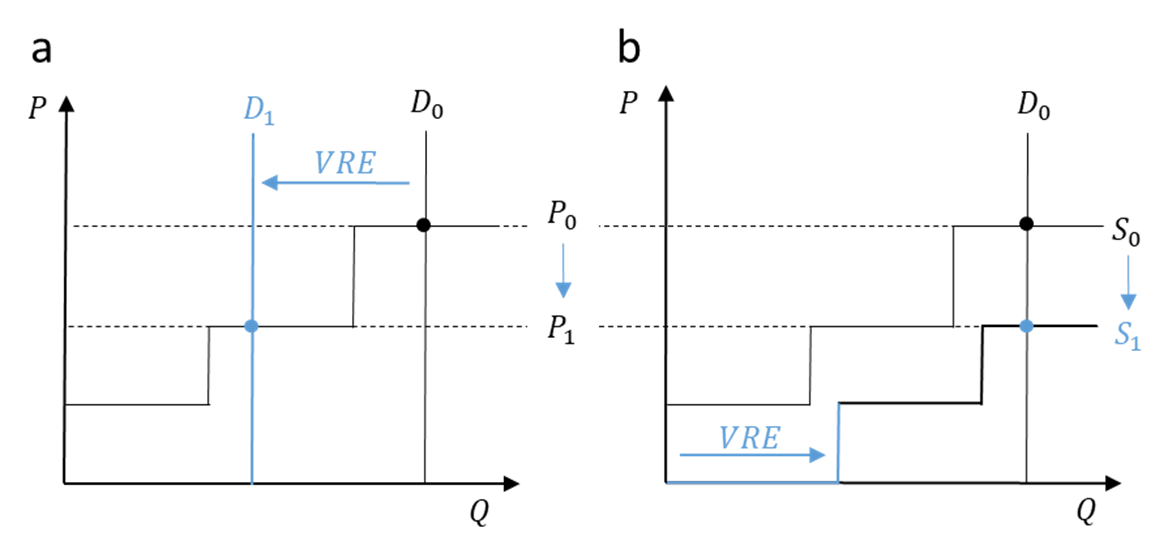
Demand is usually assumed to be perfectly inelastic in the short term, as most consumers so far do not respond to real-time prices. For this reason, it is represented as a vertical straight line in Figure 4. This is not the case in forward markets, as consumers can plan ahead their consumption, and bid accordingly. Additionally, demand elasticity is likely to increase in the future in most markets, as different measures of demand response are likely to be implemented to provide flexibility to the electricity system. Still, we represent demand as perfectly inelastic in Figure 4 for simplicity.
The supply curve is given by the variable cost (or more precisely, the opportunity cost of fuel) of all power plants sorted in ascending order from lower (left) to higher (right). Figure 4 represents a simplified supply curve with three steps representing three technologies with different variable costs. The technology with lower variable costs on the left-hand side of the supply curve could be referred to as a baseload technology, such as lignite or nuclear. The middle step represents a mid-load technology, such as hard coal or combined-cycle gas turbines, and the last step of the supply curve represents a peaking technology, such as open-cycle gas or oil turbines.
In this basic setting of a wholesale electricity market, VRE generation can be interpreted as a lower residual demand, also referred to as net load, (Figure 4 a) or as higher zero variable cost supply (Figure 4 b). From a demand perspective, VRE generation is represented as lower net load. The demand curve shifts to the left (), and therefore the price declines () as the technology setting the price is now the lower-cost mid-load rather than the peak-load technology (Figure 4 a). From a supply perspective, VRE generation shifts the supply curve to the right as new zero variable cost is supplied to the market (). The same price effect comes into play, lowering wholesale electricity prices from to .
The dynamics of the merit-order effect are well explained in the electricity market economics literature (Stoft, 2002; Green and Léautier, 2015; Léautier, 2019), and the effect also has been widely studied in the numerical and empirical literature. The numerical literature provides ex-ante estimations of the MOE with different types of electricity market models. The advantage of such market simulations is that they provide insights on potential future scenarios before they actually happen. Some early examples of this type of ex-ante modelling exercise to quantify the merit-order effect are Sáenz de Miera et al. (2008), who estimate the MOE using a dispatch model in Spain, Sensfuß et al. (2008), who apply an agent-based model to Germany, and Mills and Wiser (2012), who use a dispatch and investment model for California.
As VRE penetration increases, empirical ex-post studies with actual historical market data estimate the MOE in wholesale electricity markets. Most studies find evidence of the depressing effect of VRE penetration on wholesale prices in countries with high penetration such as Germany (Cludius et al., 2014), Italy (Clò et al., 2015), Spain (Gelabert et al., 2011), Australia (Csereklyei et al., 2019), California (Woo et al., 2016), and Texas (Woo et al., 2011). A cross-country analysis of the main European power markets shows consistent negative results across countries (Welisch et al., 2016). Likewise, a review of the MOE in the USA confirms the depressing effect of VRE on wholesale electricity markets, although this effect is relatively small compared to the effect of declining gas prices (Mills et al., 2020), which decreased significantly since 2008. In general, the MOE of solar is stronger than that of wind as its generation pattern is more concentrated during day-time hours (see Figure 3).
2.4 Price volatility
Given the inherent variability of VRE, it is generally understood that increasing VRE penetration increases wholesale price volatility. Seel et al. (2018) find that wholesale price variability increases as solar and (to a lesser extent) wind generation increases across the main US electricity markets using a capacity expansion and unit commitment model.
The empirical evidence on the effect of VRE penetration on price volatility is however mixed. The effects are specific to (i) the considered timeframe (hourly, daily or weekly volatility), (ii) the VRE technology (solar or wind have different generation patterns and therefore differing effects), and (iii) the conditions of the electricity system itself (market design, availability of flexibility options, demand patterns, etc.). For instance, Rintamäki et al. (2017) find that whereas weekly volatility increases in both Germany and Denmark due to increasing wind and solar penetration, the daily volatility patterns differ. Wind decreases daily volatility in Denmark, but increases it in Germany, whereas solar decreases daily volatility in Germany. Similarly, Kyritsis et al. (2017) find that solar energy decreases price volatility in Germany by scaling down the use of peak-load power plants, whereas wind increases the volatility due to increased flexibility needs. Both Rai and Nunn (2020) in Australia and Ballester and Furió (2015) in Spain find that VRE increases volatility, but reduces the persistence of price spikes. Finally, Ciarreta et al. (2020) show that market design and VRE regulation choices may reduce price volatility even as VRE penetration increases.
2.5 The cannibalization effect
Whereas an increase in supply causes a decline in prices in any market, the cannibalization effect is a specific phenomenon of VRE penetration in current electricity markets. This is due to specific properties of the good electricity and the characteristics of VRE.
Since electricity is a perfectly homogeneous good with relatively inelastic, time-varying demand and relatively high bulk storage costs, it is governed by peak-load pricing. Peak-load pricing theory entails that off-peak prices reflect short-run marginal operational costs, whereas fixed costs are recovered through peak-load scarcity prices (Boiteux, 1949; Wenders, 1976). Whereas energy-only markets in theory reflect peak-load pricing, most real-world electricity markets cap prices, such that fixed costs of peak generators are usually recovered through some kind of explicit or implicit capacity payment rather than through scarcity prices (cf. Cramton and Ockenfels, 2012; Cramton, 2017).
Variable renewables have virtually zero short-run marginal cost and their generation potential varies over time. Together with the constraint that supply and demand have to be balanced at every time, these conditions entail that prices drop whenever VRE generation enters the market. Depending on the existence and design of renewable support schemes, as well as on flexibility constraints of other generators, prices can even become negative when VRE supply exceeds demand.
The cannibalization effect can be illustrated through stylized price duration curves, representing prices in the wholesale market for all the 8760 hours of a year in descending order. Figure 5 a represents the merit-order effect observed in the wholesale electricity market. As VRE penetration increases, prices decline (the price duration curve shifts downwards) and the average wholesale electricity price declines from to .
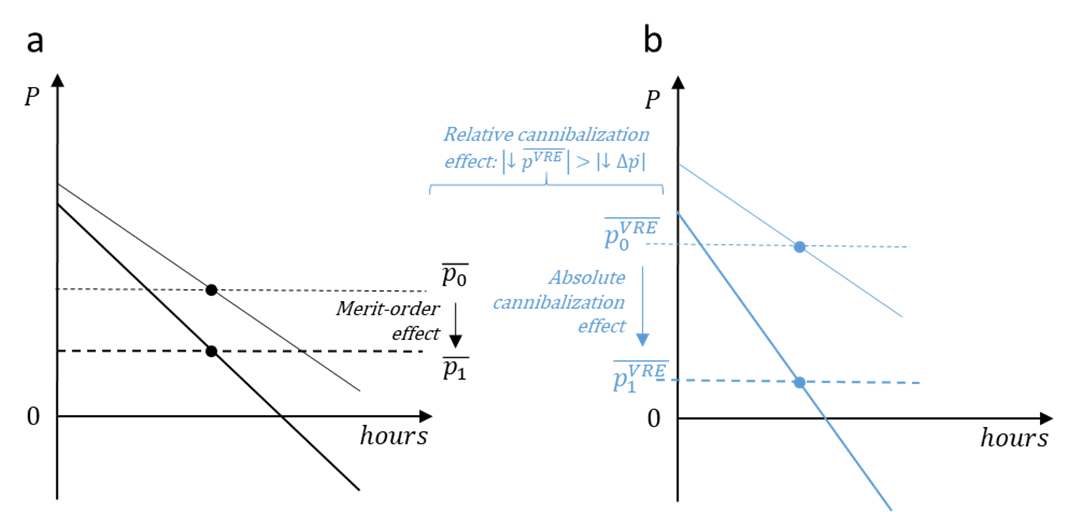
Figure 5 b represents a stylized price duration curve for a VRE technology such as solar PV, i.e, the price received by this VRE generator during every hour of production. Solar is typically correlated with electricity demand and therefore benefits from higher peak-time electricity prices. For this reason, the unit revenue (generation-weighted electricity prices, also called market value) received by solar generators at low penetration is higher than the average wholesale electricity price in this example.
However, as solar penetration increases, the merit-order effect depresses electricity prices. Since the merit-order effect happens primarily during the hours of high solar energy availability, the unit revenues received by solar PV fall , stronger than the average wholesale electricity price. The absolute cannibalization effect is the fall of VRE unit revenues. The relative cannibalization effect refers to the fact that VRE unit revenues fall faster than average wholesale electricity prices, and is represented by the fraction between both. This can also be expressed using the value factor concept. A value factor of 1 (or 100%) means that the unit revenues received by VRE generators are exactly the same as the average wholesale price. The value factor is smaller than 1 when VRE unit revenues fall more than average wholesale prices. Additionally, higher VRE penetration makes the price duration curves steeper (Green and Vasilakos, 2011) because VRE increases the difference between hours with low and high prices. When VRE are producing, the merit-order effect depresses prices. However, given the increased flexibility needs of the electricity system, prices may increase in other times due to the required ramp-up of more flexible generators with higher marginal cost (Bushnell and Novan, 2018).
As with the merit-order effect, there is a rich literature estimating the declining value of variable renewables both ex-ante with numerical models and ex-post with econometric methods. Ex-ante dispatch and investment models are used to estimate the optimal penetration of variable renewables under different scenarios (Hirth, 2015) and the declining market value of wind and solar in different markets and scenarios (Hirth, 2013; Mills et al., 2020; Eising et al., 2020). Additionally, Mills and Wiser (2014) estimate the potential of different strategies to mitigate the cannibalization effect of wind and solar. They find that geographic diversification is the most promising strategy to mitigate the declining value trend of wind power at high penetration, and low-cost storage for PV. The mitigating effect of storage and flexibility is discussed in more detail in Section 3.
From an empirical perspective, several studies report the declining value of wind and solar technologies (Zipp, 2017; Welisch et al., 2016). Clò and D’Adamo (2015) show that increasing solar penetration reduces its own value but increases the value of gas in the Italian wholesale electricity market. López Prol et al. (2020) define and estimate the absolute and relative cannibalization and cross-cannibalization (between VRE technologies) effects in the California wholesale electricity market. Whereas wind decreases its own and solar value, both in relative and absolute terms, solar decreases its own market value and value factor, but increases the wind value factor. Given the findings of Bushnell and Novan (2018), this might be because when the sun sets, more flexible generators with higher marginal cost are necessary to cover declining solar production, thus increasing wholesale prices at the time when wind generation increases.
The literature agrees that increasing VRE penetration decreases their market value (absolute cannibalization) at a faster pace than the fall of wholesale prices (relative cannibalization) due to the merit-order effect. Whereas ex-post estimations show that the cannibalization effect increases for higher VRE penetration (López Prol et al., 2020), ex-ante market models shows that market value tends to stabilize as penetration increases (Hirth, 2013). This reflects the different time frames of both types of methods: whereas econometric models estimate the cannibalization effect in the short term in the existing electricity system, numerical capacity expansion models optimally adapt installed capacities to cope with higher shares of VRE.
2.6 A value perspective of integration costs
Integrating VRE into current electricity systems that have been designed for dispatchable generation technologies entail integration costs derived from the variability (profile costs), uncertainty (balancing costs) and location specificity (grid costs) of VRE resources (Ueckerdt et al., 2013). Hirth et al. (2015) show that integration costs can be estimated from a cost perspective as the additional system costs caused by VRE integration, or from a value perspective as the difference between wholesale prices and VRE market values. Since the value factor is the ratio between a technology’s market value (unit revenues) and wholesale electricity prices, the evolution of the value factor (the relative cannibalization effect) can be interpreted as a value estimation of the technology-specific integration cost.
3 The economics of electricity storage for VRE integration
3.1 Why electricity storage?
3.1.1 General effects of electricity storage
The use of electricity storage is an important option for addressing the variability challenges of wind and solar power discussed above. Electricity storage may be broadly defined as a technology that takes up electrical energy at a given point in time, and releases electrical energy again at a later point in time, irrespective of the form in which energy is stored in between. Electricity storage can balance the variable patterns of renewable supply and demand and thus mitigate both the merit-order and the cannibalization effects.
3.1.2 Technologies
A wide range of electricity storage technologies is available (Luo et al., 2015; World Energy Council, 2016; Gür, 2018). These differ with respect to various techno-economic parameters, such as round-trip efficiency, specific investment costs for power and energy capacity, variable costs, and technical lifetime. Driven by these parameter differences, typical energy-to-power (E/P) ratios emerge for each technology, the inverse of which is also referred to as “C-rate”. For example, the E/P ratio is only a few hours for stationary Li-ion batteries, may exceed ten hours for pumped hydro storage plants, and can surpass several weeks for hydrogen-based electricity storage. Further, electricity storage technologies come at very different scales. For example, stationary batteries are highly modular and can be deployed at the scale of individual households with energy capacities of only a few kWh, but also at the grid scale in the multi-MWh range. Pumped hydro plants, in contrast, are usually both lumpier and much larger, with energy capacity in the GWh range. Future hydrogen storage may well reach the TWh range.
In recent years, substantial research and development activities as well as scaling up of production has led to substantial cost decreases of electrochemical storage technologies, which are expected to continue also in the future (Schmidt et al., 2017; Lazard, 2019; Schmidt et al., 2019). In the medium run, Li-ion batteries may become the dominating storage technology (Beuse et al., 2020). Various storage technologies are already available and technologically proven today, although they are not necessarily economic in current power markets (Brown et al., 2018a). This is partly because of economic and regulatory barriers in many markets, which prevent storage from being fully compensated for the many services it could deliver to the electricity system (Sioshansi et al., 2012; Castillo and Gayme, 2014).
3.1.3 Applications
There are many different applications for electricity storage (Palizban and Kauhaniemi, 2016). A well-known and widely used application is bulk electricity storage, i.e., shifting substantial quantities of electricity from one point in time to another point in time. This business model is also referred to as energy arbitrage in wholesale electricity markets, which entails buying and storing electricity in periods of low prices and selling it again in higher-price periods. In doing so, the price difference has to pay for the variable storage costs, including the roundtrip losses. From an overall system perspective, bulk electricity storage allows increasing the use of generators with low variable costs and decreasing the use of generators with high variable costs. With increasing shares of VRE, this becomes more relevant, in particular in case of temporary renewable surplus generation which would otherwise have to be curtailed (Denholm et al., 2013).
Aside from energy arbitrage, there are many other potential applications for electricity storage, which are not necessarily organized by markets (Denholm et al., 2010; Castillo and Gayme, 2014). These include: (i) reduction of residual load gradients, which translates into reduced ramping needs of thermal generators; (ii) provision of different types of ancillary services, in particular balancing power; (iii) provision of peak or firm generation capacity; (iv) supplementation or deferral of investments into transmission or distribution grid infrastructure; (v) multiple end-user applications, including energy supply cost optimization and power quality or stability. These applications can be translated into different types of value created by electricity storage in the energy sector, such as arbitrage, flexibility, reserve, capacity or grid-related values. Importantly, storage facilities may be able to combine several of these applications at least to some extent (Stephan et al., 2016; Staffell and Rustomji, 2016). Many model-based studies nonetheless focus on only one or two sources of storage value, and hardly any cover all of them.
3.1.4 Alternative flexibility options
Aside from electricity storage, there are many other, and partially competing, options for providing temporal flexibility to the electricity sector (Lund et al., 2015). These belong either to the supply side or to the demand side and may be grouped into different categories. Depending on electricity flowing into and/or out of the flexibility option, we distinguish the categories Power-to-Power, X-to-Power, or Power-to-X, following Schill et al. (2015) and Schill (2020). Electricity storage by definition belongs to the Power-to-Power category.
Power-to-Power: Demand-side management measures can have similar electricity sector impacts as electricity storage (Hale et al., 2018). If a part of the electricity demand is shifted from hour to hour (by decreasing the load in hour and correspondingly increasing it in hour ), this has a similar power sector effect as discharging an electricity storage facility in hour , and charging it again in hour . Realizing demand-side flexibility may require digitalization (IEA, 2017) to automatize demand response to prices, and market design changes to allow agents to capture the value they generate to the system by providing flexibility (Joskow, 2019; Leslie et al., 2020). For clarity, here we only include shifting of such electricity demand that already exists in traditional power sectors, e.g., in residential applications or industrial processes, and not additional future loads related to increased sector coupling.
X-to-Power: This category includes any technologies that generate electricity at the time of demand. This comprises conventional dispatchable generators, and also measures to operate flexibility-constrained assets such as combined heat and power generation plants in a more flexible way. VRE overcapacity with curtailment may also be categorized here.
Power-to-X: This group of options includes new and potentially flexible electric loads related to the coupling of the power sector and other sectors. Such sector coupling is a major option to facilitate deeply decarbonized future energy systems (de Coninck et al., 2018). For example, electricity can be used in the heating sector via heat pumps or direct resistive heating (Bloess et al., 2018; Madeddu et al., 2020), in the mobility sector via battery-electric vehicles (Armaroli and Balzani, 2011), or in various transportation or industrial applications, which are harder to electrify, via electrolysis-based hydrogen or synthetic liquid fuels (Schiebahn et al., 2015; Mansilla et al., 2018; Runge et al., 2019; IEA, 2019a). Such sector coupling allows making use of other, and potentially cheaper, energy storage options than stationary electricity storage, such as thermal energy storage, electric vehicle batteries, or storage of hydrogen or derived synthetic liquid fuels. Note that we define Power-to-X as any process where electricity permanently flows out of the power sector. In case of later reconversion to electricity, e.g., if electricity is generated from hydrogen or synthetic liquid fuels again, this is treated as a Power-to-Power option (cp. Yan et al., 2019). Battery-electric vehicles that discharge electricity back to the grid (“Vehicle-to-Grid”) provide both Power-to-X (the part of electricity used for driving) and Power-to-Power (the part of electricity fed back to the grid) functionalities (cp. Taljegard et al., 2019).
Geographical balancing is another option to provide temporal flexibility for variable renewable integration(Fürsch et al., 2013; Steinke et al., 2013), as illustrated for the US (MacDonald et al., 2016) and Europe (Schlachtberger et al., 2017). This is because the time patterns of renewable availability and electricity demand are usually not perfectly correlated between different locations (Engeland et al., 2017). Transmission expansion can thus facilitate balancing of renewable supply and demand over wide areas. In theory, annual and diurnal solar cycles could be balanced using inter-hemispheric connections to offset seasonal patterns (Grossmann et al., 2014; Aghahosseini et al., 2019), yet the practical feasibility of this option remains unclear.
3.2 Modeling the interaction between storage and variable renewables
A broad literature has investigated the role and value of electricity storage in electricity sectors with variable renewable energy sources. Analyses vary not only in terms of the geographical coverage and time horizon, but also with respect to the methodological approaches used (Zerrahn and Schill, 2017; Blanco and Faaij, 2018). Several earlier studies use price-taking arbitrage models, drawing on historic electricity market prices. Another strand of the literature uses models based on time series of variable renewable availability and load; and a third strand uses electricity sector models, often with a capacity expansion approach. The latter may be considered the state-of-the-art approach to quantify the value of electricity storage in future scenarios with very high shares of variable renewables. Bistline et al. (2020) review and discuss the representation of energy storage in respective long-term models.
3.2.1 Price-taker arbitrage models
Several studies have investigated the value of electricity storage using price-taker models and historic wholesale price data. Such studies generally focus on the arbitrage value of storage and, by design, cannot say much about the long-run value of storage in settings with higher renewable penetration. Sioshansi et al. (2009) explore the value of electricity storage using historical price data from the PJM market in the USA and find a generally increasing arbitrage value between 2002 and 2007, but also large regional differences. Bradbury et al. (2014) use historic market prices of seven US markets to optimize the sizing and dispatch of various energy storage technologies. They find very low E/P ratios for most storage technologies, and up to eight hours for pumped hydro and compressed air storage. McConnell et al. (2015) analyze the value of electricity storage in the Australian National Energy Market and find that it hardly increases any more for E/P ratios above six hours.
3.2.2 Time series-based models
Analyses based on time series of renewable availability and load allow a more forward-looking investigation of the role of electricity storage for renewable integration. Heide et al. (2010) investigate the seasonal balancing of wind and solar in a pan-European 100% renewable scenario, under the assumption of substantial transmission infrastructure being in place. Seasonal long-term storage with a capacity equalling – times the average monthly load is needed to balance excess PV generation in summer with excess wind generation in winter. In a comparable setting, Rasmussen et al. (2012) find that a mix of short-term storage and long-term power-to-gas-to-power storage with an energy capacity of less than 1% of the yearly load suffices for achieving a fully renewable energy supply in Europe.
For Germany, Weitemeyer et al. (2015) show that electricity storage may not be required up to a VRE share of 50%. Above that, storage needs increase, which is especially true for long-term storage in settings beyond 80% renewable penetration. Also using a time series-based approach, Raynaud et al. (2018) analyze the occurrence of energy droughts from variable renewables in Europe, i.e., periods of high residual load. They find that relatively small electricity storage capacity suffices to mitigate such energy draughts.
3.2.3 Capacity expansion models
In another strand of literature, detailed power sector models are used to analyze the role of electricity storage in future VRE scenarios. In general, such models are able to consider both the arbitrage and capacity values of storage. Some models further allow covering additional system values, such as the contribution of storage to the provision of balancing reserves.
The literature agrees that storage power capacity remains moderate even in scenarios with substantial carbon emissions reductions. However, the need for longer-term storage significantly increases as VRE penetration approaches 100% and in the absence of other flexibility options. Schill and Zerrahn (2018) show this for Germany, Safaei and Keith (2015) and de Sisternes et al. (2016) for Texas, Tong et al. (2020) for the contiguous USA, and Ziegler et al. (2019) for four US regions. Dowling et al. (2020) likewise highlight the importance of long-duration electricity storage for fully VRE-based power sectors.
The “system value” of storage, defined as the reduction of the total system costs caused by its incremental deployment, decreases with increasing storage capacity deployment (Heuberger et al., 2017). Mallapragada et al. (2020) show that the value of electricity storage is largely related to the deferral of generation and transmission capacity in the long run. They also find that variable renewables and storage are complements, as the penetration of one increases the value of the other, and at the same time competitors, as storage can be replaced by VRE overcapacity and curtailment. That means that although both VRE and storage values decrease as their penetration increase, ceteris paribus, their combined deployment mitigates this decline in their system value.
3.2.4 Interaction of electricity storage and renewable curtailment
Many analyses, including several of the ones above, deal with the interaction of renewable curtailment and electricity storage. In an early article, Denholm and Hand (2011) investigate this for future scenarios of Texas. With medium penetration of variable renewable energy sources, only small storage capacities are needed to keep renewable curtailment low; yet if the VRE share increases to 80%, more substantial electricity storage with a capacity of about one day of average demand is required to keep renewable curtailment below 10%.
Using a simple dispatch model, Schill (2014) derives similar findings for mid- to long-term scenarios for Germany. He shows that electricity storage needs substantially decrease if small levels of VRE curtailment are allowed. If, on the contrary, renewable curtailment is restricted, electricity storage needs vastly increase. This is because the most extreme renewable surplus events come with very high power and energy, which then determine storage dimensioning. Similarly, avoiding must-run of thermal generators also substantially mitigates electricity storage needs.
Sinn (2017) revisited this issue, a priori ruling out the possibility of renewable curtailment. Using a German time series of wind, solar and load, he illustrates that storage needs in such a setting would very substantially increase with increasing VRE curtailment, and argues that this may put the viability of the renewable energy transition into question. In an open-source replication study, Zerrahn et al. (2018) show that storage needs strongly decrease if renewable curtailment is not artificially constrained. With a stylized optimization model, they further show that a mix of VRE curtailment and storage deployment minimizes overall system costs, and that optimal electricity storage capacities may decrease further if flexible Power-to-X options are also considered.
3.3 Graphical intuition on the changing role and value of electricity storage
In the following, we aim to provide some graphical intuition on the changing role of electricity storage under increasing VRE shares. We do so with residual load duration curves, price duration curves, and market values calculated with a stylized open-source capacity expansion model. This model is a much-reduced version of the model DIETER, which was first presented by Zerrahn and Schill (2017) and subsequently expanded and applied in various other papers, as listed in Gaete-Morales et al. (2020). The reduced model version, which has been used for high-level illustrations before (Zerrahn et al., 2018; Schill, 2020), determines cost-minimal generation and storage capacities as well as their optimal dispatch for different shares of VRE in final yearly demand, which is enforced by a respective constraint. This can be interpreted as a setting in which renewable generators receive an energy-based premium on top of their wholesale market revenues, such that the desired VRE share is perfectly met. The model only considers five generation technologies (hard coal, open- and closed-cycle gas turbines, solar PV, and wind power), one stylized storage technology (parameterized as pumped hydro storage), and a single region (Germany, one node). Hourly electricity demand is assumed to be fully price-inelastic. The model is freely available under a permissive license (Schill and Zerrahn, 2020). Given the stylized nature of this model, the focus is not on the numbers, but on qualitative insights and the general mechanisms at play.
For a description of the full DIETER model’s general setup see Zerrahn and Schill (2017). For exemplary applications see Schill et al. (2017b), Schill and Zerrahn (2018), or Say et al. (2020). Here we use a stylized version that builds on Zerrahn et al. (2018) and Schill (2020). It is a linear model that minimizes overall electricity sector costs, consisting of investment and variable costs. Its results reflect a frictionless market in a long-run equilibrium. The model is solved for all consecutive hours of a full year, using GAMS / CPLEX. The optimization is subject to a number of constraints, such as generation capacity and storage restrictions as well as an energy balance. A restriction forces the model to exactly cover a predefined share of overall yearly electricity demand by variable renewable energy sources. Note that the VRE shares reported in the paper refer to the share in overall final demand, given that storage losses are completely covered by VRE. For more details, see the model code.
Endogenous model outputs include overall costs, capacity deployment and dispatch of all generation and electricity storage technologies, and the dual variable of the energy balance, which we interpret as wholesale prices. Exogenous input data include time series of electricity demand and renewable availability, which are taken from the Open Power System Data platform (Wiese et al., 2019), as well as fixed and variable costs and efficiencies of generation and storage technologies. All inputs are loosely calibrated to a German mid-term scenario, using a greenfield approach. Input data is freely available together with the open-source code in the Zenodo repository https://doi.org/10.5281/zenodo.4383288.
3.3.1 Residual load and price duration curves
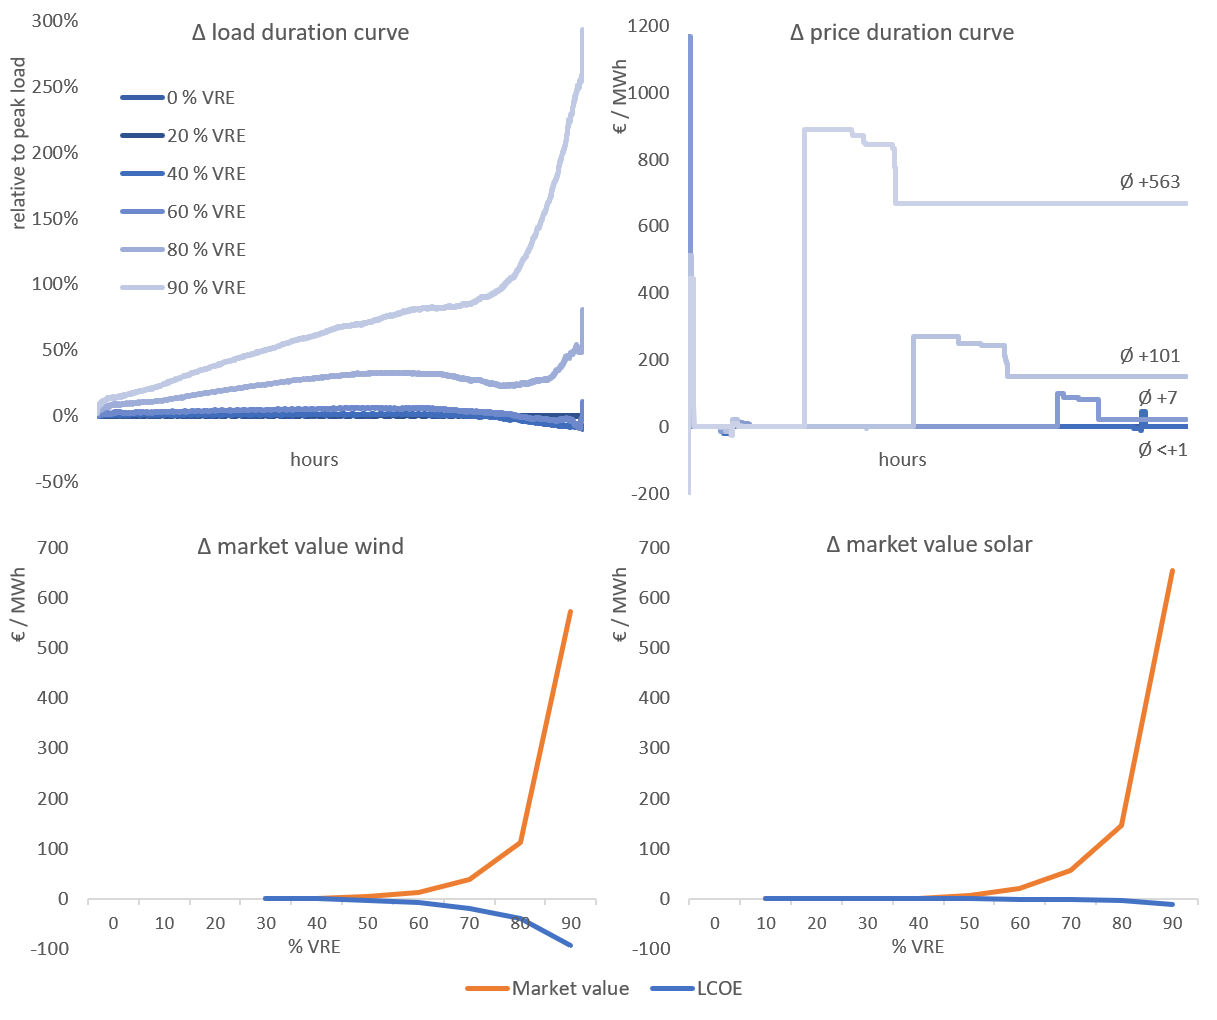
Panel a of Figure 6 illustrates how the residual load duration curve (RLDC) changes with increasing shares of variable renewable energy sources (cp. Ueckerdt et al., 2015). As VRE penetration increases, the RLDC shifts downwards on its right-hand side. The number of hours during which the residual load is negative, i.e., the VRE generation potential exceeds the electric load, increases substantially beyond a renewable share of 20%, and the magnitude of peak negative residual load also increases strongly (cp. also Schill, 2014). The left-hand side of the RLDC hardly decreases with increasing renewable penetration, which reflects the small contribution of wind power and solar PV to the provision of firm capacity. If the VRE share increases to 90%, renewable surplus energy occurs in nearly every second hour of the year. The shape of the RLDC also changes, which is driven by different cost-minimizing shares of wind and solar power for different VRE penetrations. In the parameterization used here, only PV is deployed in the 20% setting, which regularly leads to low residual load values during summer days and explains the bend on the right-hand side. In settings with higher VRE shares, wind power with smoother generation profiles is increasingly deployed.
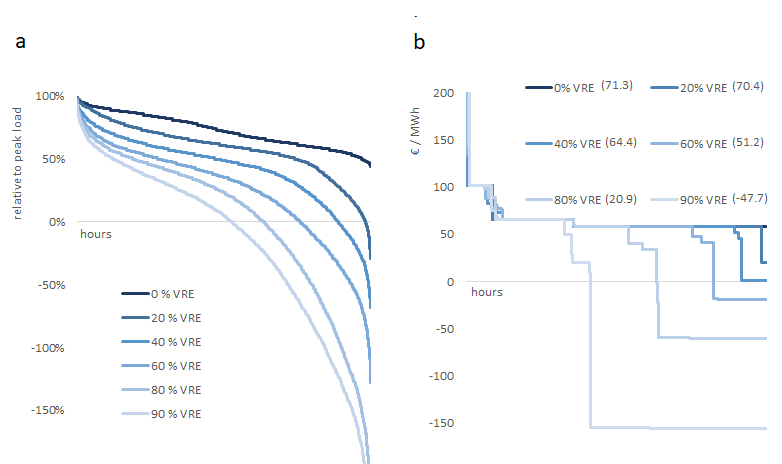
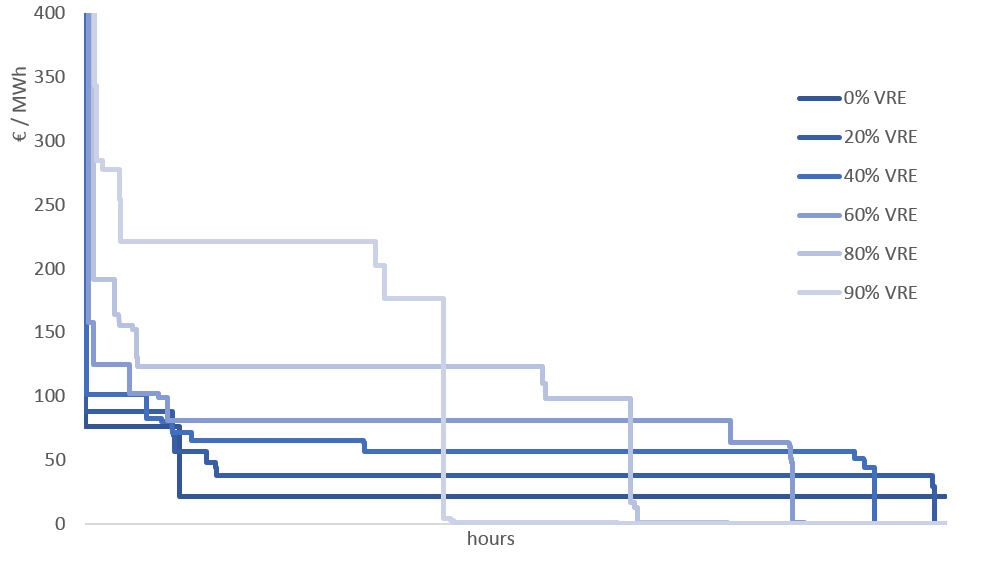
Panel b of Figure 6 shows price duration curves (PDCs) for the same illustrative example, as well as weighted average wholesale prices. The ordinate is capped, leaving out high peak prices in a few hours to improve visibility. Using a cost-minimization approach, we do not explicitly model market prices, but interpret the dual variable of the energy constraint as a wholesale price, as often done in model-based energy economic analyses (Brown and Reichenberg, 2020). With increasing VRE penetration, the PDC shifts downward on the right-hand side, similarly to the RLDC, which corresponds to higher renewable surplus generation. Prices may even become negative, which reflects the fact that the objective value, i.e., overall system costs, would decrease if more electricity would be consumed in this hour. This is because the binding VRE constraint could be easier achieved if consumption increased during hours of renewable curtailment. In an alternative setting, where VRE deployment is not driven by a constraint (i.e., by energy-based support), but by pricing, wholesale prices never turn negative (Figure 7). When interpreting this results, the reader should also keep in mind that electricity consumers usually also have to carry the costs of renewable support, so electricity bills never become negative. We further assume a fully price-inelastic demand, and that the total system costs only partially include the external costs of conventional generators.
3.3.2 The changing role of storage
Figure 8 shows the changing use of electricity storage with increasing VRE penetration. In the stylized setting used here, no storage is deployed below a VRE share of 30%. For medium VRE shares, optimal storage investments are moderate, but they increase disproportionately with higher variable renewable penetration. For 40% VRE, the optimal storage power rating corresponds to 9% of the annual peak load. If the VRE share increases to 60%, 80% or 90%, storage power increases to 27%, 75% and 78% of the peak load. The optimal storage energy capacity increases even more, from 0.01% of the yearly electricity demand in the 40% VRE case to 0.03% (60%), 0.11% (80%), and 0.21% (90%).
Accordingly, storage is increasingly used with higher VRE penetration, as shown in Figure 8. Importantly, storage is never deployed to fully take up renewable surplus generation in a least-cost solution, as this would require excessive and under-utilized investments into storage power and, even more so, storage energy capacity (cp. Schill, 2014; Zerrahn et al., 2018). In a cost-minimizing solution, there will accordingly always be some level of renewable curtailment, absent geographical balancing, flexible Power-to-X, or other low-cost flexibility options (cp. Schill, 2020). Figure 8 also shows that storage is used to smooth the generation of the three dispatchable technologies modeled here, i.e., to optimize their full-load hours, depending on their fixed and variable cost structure (cp. section 2.2). The use of hard coal, which is the “baseload” technology in this setting, decreases with increasing renewable penetration and is completely crowded out in the 90% VRE case.
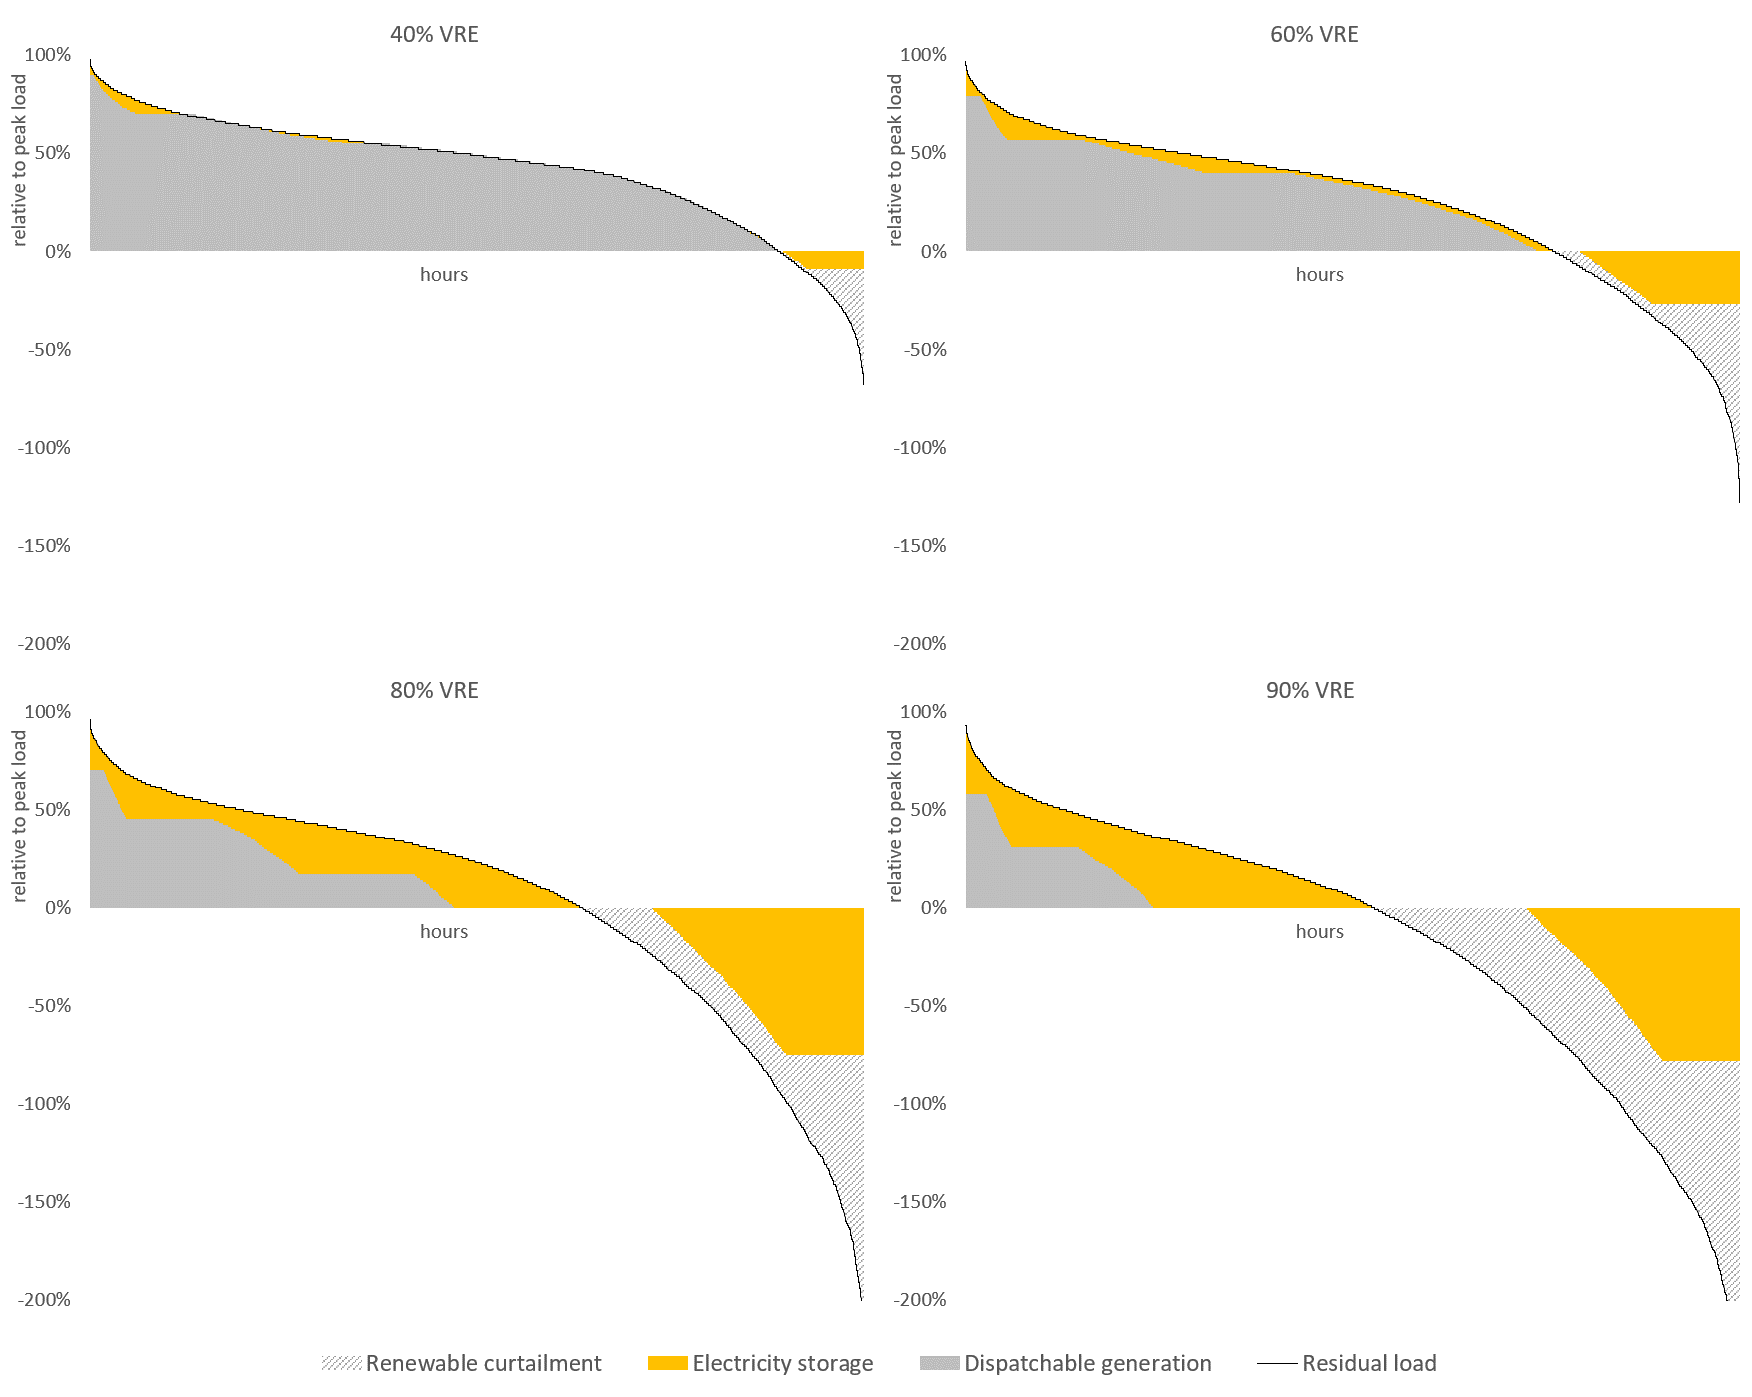
Electricity storage hardly contributes to peak residual load supply in settings with moderate VRE shares. Instead, storage deployment is driven mainly by taking up renewable surplus energy in the 40% and 60% VRE cases, i.e., by the right-hand side of the RLDC. This changes for very high VRE shares, where storage is increasingly used to also supply peak residual load on the right-hand side of the RLDC. This also requires larger investments in storage energy capacity, as increasing amounts of renewable surplus energy have to be shifted over longer periods of time. In 100% VRE settings, where no other X-to-Power options are left, electricity storage would have to supply the total peak residual load and fully balance seasonal fluctuations.
3.3.3 Wind and solar cost and value
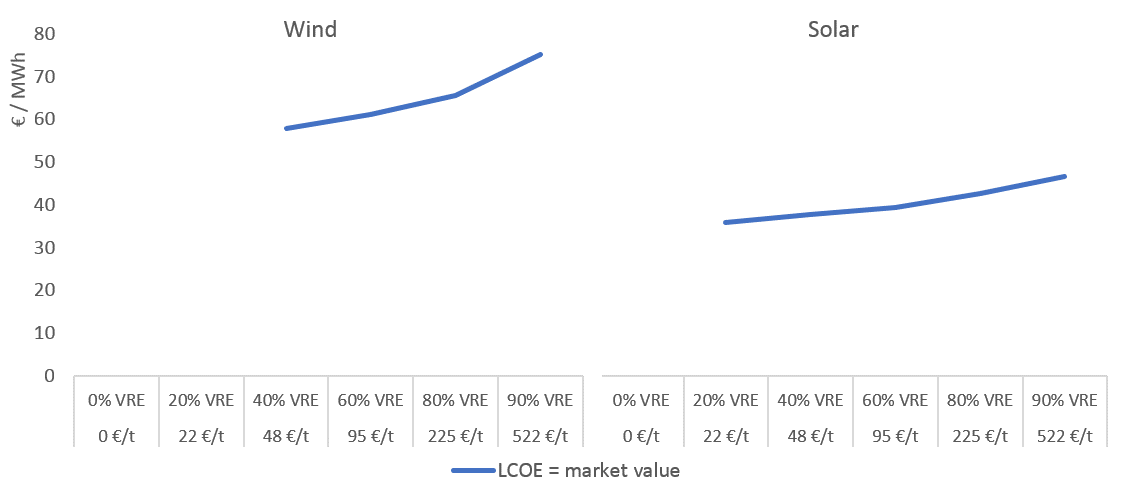
Figure 9 illustrates the market values and LCOE for wind power and solar PV for the same stylized example as above and also in an equivalent setting without storage. The cannibalization effect is clearly visible: with increasing VRE penetration, the market values of wind and solar deteriorate. This is particularly true for solar PV, driven by regular diurnal generation patterns. This finding is in line with the empirical literature discussed in section 2.5, as for example shown by López Prol et al. (2020).
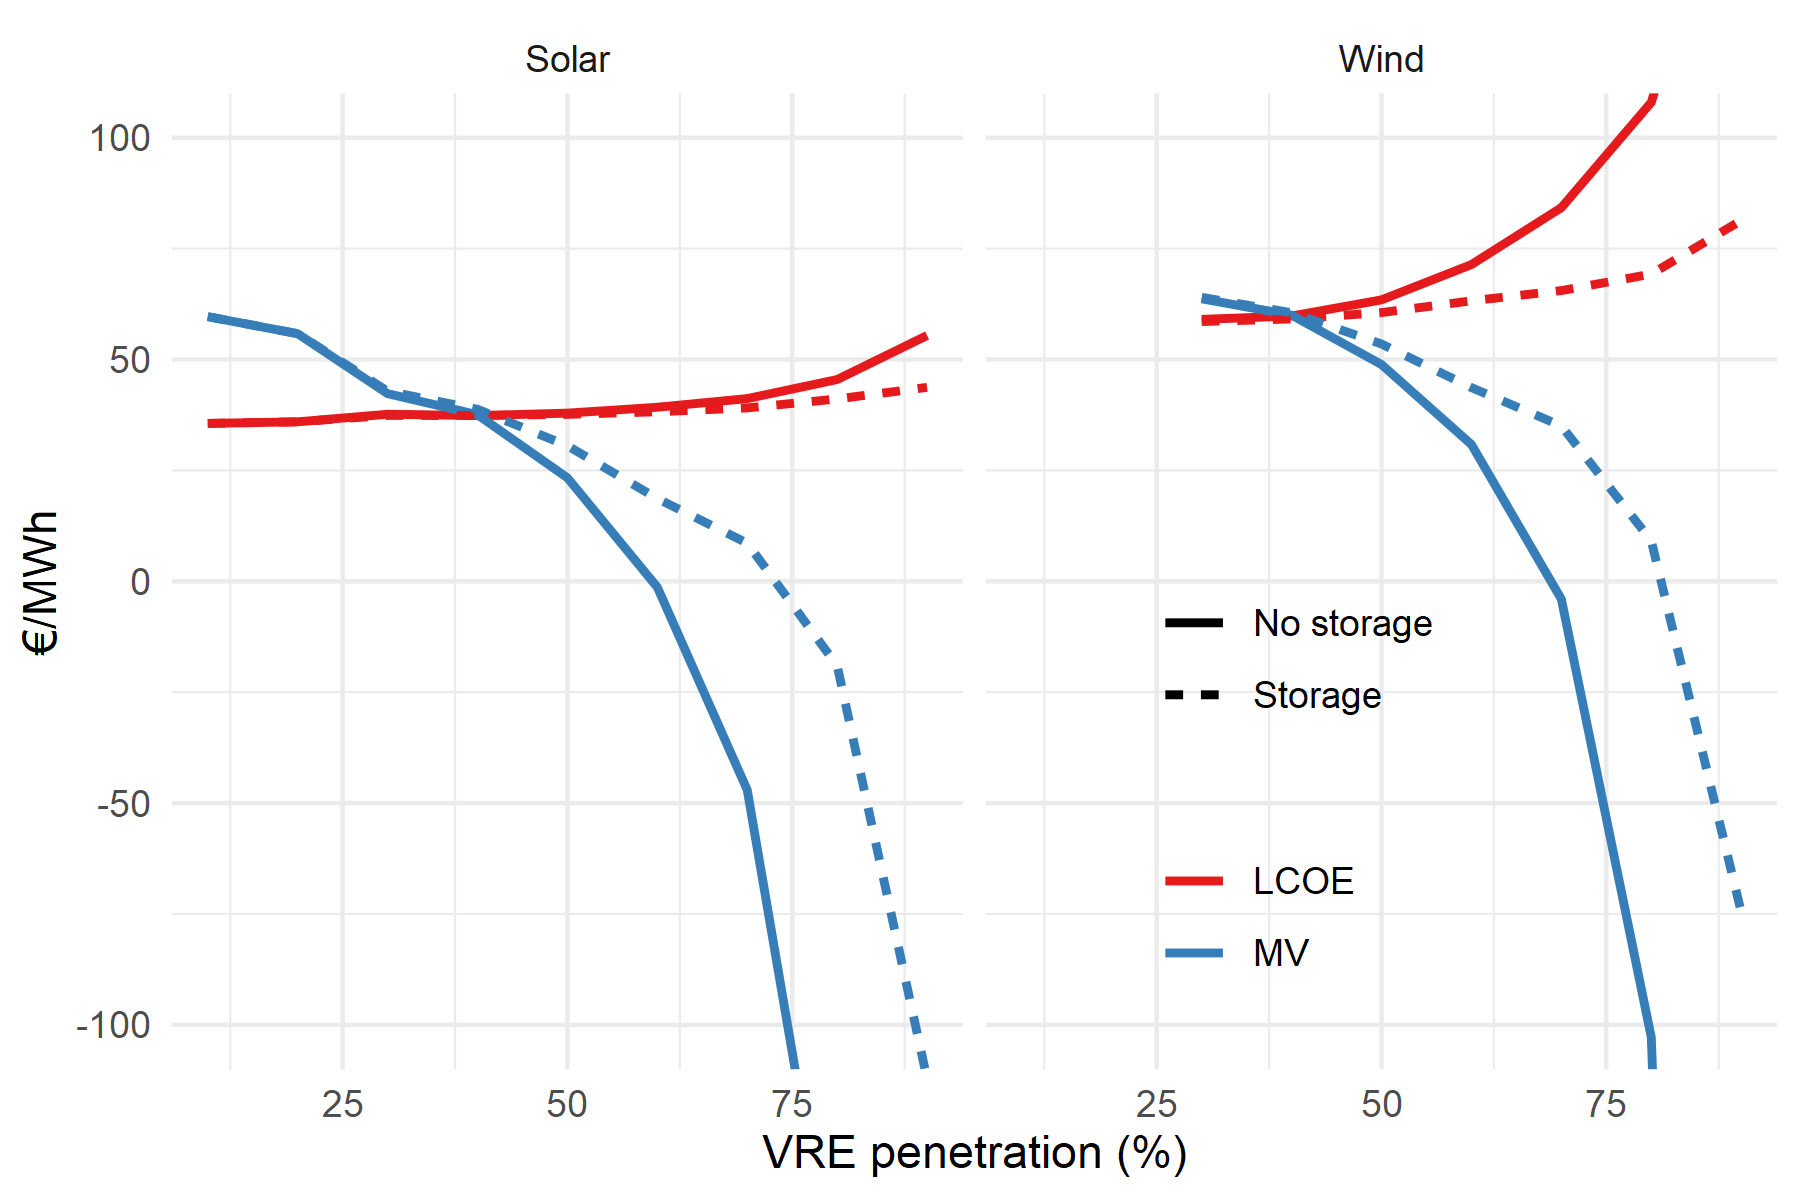
At the same time, the levelized costs of wind and solar energy increase, reflecting increasing levels of curtailment. The difference between the market value and the LCOE can be interpreted as the required renewable support per unit, which also equals the dual of the VRE constraint in the optimization model. Note that up to 40% VRE, the market value of wind an solar is greater than their LCOE, which reflects the fact that the cost-minimizing renewable share (only partially considering the externalities of conventional generators) in this stylized parameterization is somewhat above 40%. It should be noted that the decreasing market value is driven by negative prices caused by the binding VRE constraint in the model. In an alternative model setting, in which increasing VRE shares are not driven by a respective constraint, but by increasing pricing, wholesale prices never become negative. Likewise, the market values of wind and solar do not deteriorate in such a setting with increasing VRE shares, but always correspond to the respective levelized costs. This is shown by Brown and Reichenberg (2020), and we also illustrate this in Figure 10. This is because increasing prices internalizes climate change costs and therefore allow VRE to capture that mitigation value, compensating thus the cannibalization effect of their increasing penetration.
The comparison between the market values of wind and solar with and without storage reveals the effect of storage on mitigating the cannibalization effect. Figure 11 illustrates the effects of storage on residual load and price duration curves and VRE market values in more detail. The decline of VRE unit revenues, particularly for solar, would be stronger in the absence of storage. Likewise, their levelized cost would increase faster as penetration increases due to higher curtailment.
3.4 Beyond stationary grid-scale electricity storage
While we have focused on stationary grid-scale electricity storage, decentralized small-scale electricity storage is becoming more and more relevant in many markets. Decentralized PV-battery systems allow households and commercial electricity consumers to increase their levels of PV self-consumption. This can be beneficial if the self-generated electricity is cheaper than the retail tariff of the grid electricity it substitutes (Schill et al., 2017b), as it is already the case in many countries (Lang et al., 2016; López Prol and Steininger, 2020). Yet the power sector implications of widespread PV-battery adoption and their interaction with grid-scale electricity storage are only partially understood so far (Say et al., 2020).
Battery electric vehicles are a particularly interesting case, as they entail new and potentially flexible loads in the power sector that could also feed back electricity to the grid. The latter concept has been discussed for many years under the label Vehicle-to-Grid (Kempton and Tomić, 2005). Accordingly, battery-electric vehicles potentially combine Power-to-X and Power-to-Power properties. Due to technical, economic and social barriers, Vehicle-to-Grid is hardly used in practice so far. Yet this may change in the near future, considering the current massive roll-out of battery-electric vehicles in many countries.
In general, various future sector coupling options could supply additional flexibility to the electricity system. For example, Brown et al. (2018b) find that flexible charging of electric vehicle batteries could balance daily PV fluctuations, and Power-to-Heat applications with thermal energy storage could balance longer-duration wind power variability. Likewise, Schill (2020) illustrates that flexible sector coupling may substantially reduce the need for electricity storage in settings with medium VRE penetration, as it reduces renewable surplus energy on the right-hand side of the RLDC. Yet in 100% VRE settings, this storage-mitigating effect of flexible Power-to-X options vanishes, as electricity storage is still required to supply positive residual load on the left-hand side of the RLDC. Temporally inflexible sector coupling, in contrast, would increase the flexibility needs of the power sector.
4 Conclusions
We have discussed the literature on the interactions between increasing variable renewable energy penetration, electricity storage, and electricity prices. Increasing penetration of VRE lowers wholesale electricity prices due to the merit-order effect. Since this happens at times of high VRE penetration, VRE market values fall (absolute cannibalization effect), and they fall even faster than electricity prices, causing a decline of technology-specific value factors (unit revenues divided by average wholesale electricity prices). The decreasing value factor (relative cannibalization effect) can be interpreted as the evolution of VRE integration costs from a value perspective.
Although VRE penetration is generally thought to increase price volatility, empirical evidence is mixed. Effects of VRE on price volatility depend on the generation pattern of the VRE technology, the considered time scale, and the characteristics of the electricity system itself, such as availability of flexibility, demand patterns and market design.
Electricity storage and other flexibility options mitigate the cannibalization effect of VRE and stabilize electricity prices. VRE and electricity storage are complementary in the sense that higher penetration of one increases the value of the other. However, they are to some degree also substitutes as storage can be replaced by VRE overcapacity and curtailment. Storage also shows diminishing marginal returns as each additional unit of capacity provides lower value to the system.
Whereas we have focused here on electricity storage, several other forms of power sector flexibility can contribute to integrating high shares of variable renewables. This includes Power-to-Power options such as demand response, Power-to-X options related to sector coupling, as well as geographical balancing. Both the optimal mix of such flexibility options and their market interactions are not fully understood so far.
Future research should thus address in more detail the interactions between grid-scale and decentralized electricity storage, as well as various sector coupling options. This also requires taking the operational characteristics of decentralized batteries into account, which heavily depend on end-user behaviour as well as on retail market design. Likewise, the flexibility potentials and constraints of various Power-to-X processes and their repercussions on electricity storage and VRE market dynamics should be studied in more detail.
Further, market design and regulatory frameworks may have to be adjusted in order to enable all flexibility options to capture the various values they may provide to the system. This is necessary to achieve welfare-optimal deployment of each technology in the real world. Yet the necessary adjustments may differ strongly between markets and jurisdictions, and are also subject to further research.
Acknowledgments
Javier López Prol acknowledges funding of the Austrian Science Fund (FWF) via the Schrödinger Fellowship “Cannibalization” (grant number J 4301-G27). Wolf-Peter Schill acknowledges research grants by the German Federal Ministry of Education and Research via the project “Future of Fossil Fuels in the wake of greenhouse gas neutrality” (grant number FKZ 01LA1810B), and by the German Federal Ministry for Economic Affairs and Energy via the project “MODEZEEN” (grant number FKZ 03EI1019D).
References
- Aghahosseini et al. (2019) Aghahosseini, A., Bogdanov, D., Barbosa, L.S., Breyer, C., 2019. Analysing the feasibility of powering the Americas with renewable energy and inter-regional grid interconnections by 2030. Renew. Sustain. Energy Rev. 105, 187–205. doi:10.1016/j.rser.2019.01.046.
- Agora Energiewende (2017) Agora Energiewende, 2017. Future Cost of Onshore Wind. Recent auction results, long-term outlook and implications for upcoming German auctions. Technical Report. URL: https://www.agora-energiewende.de/fileadmin2/Projekte/2017/Future_Cost_of_Wind/Agora_Future-Cost-of-Wind_WEB.pdf.
- Armaroli and Balzani (2011) Armaroli, N., Balzani, V., 2011. Towards an electricity-powered world. Energy & Environmental Science 4, 3193–3222. doi:10.1039/C1EE01249E.
- Baker et al. (2013) Baker, E., Fowlie, M., Lemoine, D., Reynolds, S.S., 2013. The Economics of Solar Electricity. Annu. Rev. Resour. Econ. 5, 387–426. doi:10.1146/annurev-resource-091912-151843.
- Ballester and Furió (2015) Ballester, C., Furió, D., 2015. Effects of renewables on the stylized facts of electricity prices. Renewable and Sustainable Energy Reviews 52, 1596–1609. doi:10.1016/j.rser.2015.07.168.
- Beuse et al. (2020) Beuse, M., Steffen, B., Schmidt, T.S., 2020. Projecting the Competition between Energy-Storage Technologies in the Electricity Sector. Joule 4, 2162–2184. doi:10.1016/j.joule.2020.07.017.
- Bistline et al. (2020) Bistline, J., Cole, W., Damato, G., DeCarolis, J., Frazier, W., Linga, V., Marcy, C., Namovicz, C., Podkaminer, K., Sims, R., Sukunta, M., Young, D., 2020. Energy storage in long-term system models: a review of considerations, best practices, and research needs. Progress in Energy 2, 032001. doi:10.1088/2516-1083/ab9894.
- Blanco and Faaij (2018) Blanco, H., Faaij, A., 2018. A review at the role of storage in energy systems with a focus on Power to Gas and long-term storage. Renewable and Sustainable Energy Reviews 81, 1049 – 1086. doi:10.1016/j.rser.2017.07.062.
- Bloess et al. (2018) Bloess, A., Schill, W.P., Zerrahn, A., 2018. Power-to-heat for renewable energy integration: A review of technologies, modeling approaches, and flexibility potentials. Applied Energy 212, 1611 – 1626. doi:10.1016/j.apenergy.2017.12.073.
- Boiteux (1949) Boiteux, M., 1949. Peak-Load Pricing. J. Bus. 33, 157–179. doi:10.2307/2351015.
- BP (2020) BP, 2020. BP Statistical Review of World Energy 2020. Technical Report. URL: https://www.bp.com/content/dam/bp/business-sites/en/global/corporate/pdfs/energy-economics/statistical-review/bp-stats-review-2020-full-report.pdf.
- Bradbury et al. (2014) Bradbury, K., Pratson, L., Patino-Echeverri, D., 2014. Economic viability of energy storage systems based on price arbitrage potential in real-time U.S. electricity markets. Applied Energy 114, 512 – 519. doi:10.1016/j.apenergy.2013.10.010.
- Brown et al. (2018a) Brown, T., Bischof-Niemz, T., Blok, K., Breyer, C., Lund, H., Mathiesen, B., 2018a. Response to ’burden of proof: A comprehensive review of the feasibility of 100% renewable-electricity systems’. Renewable and Sustainable Energy Reviews 92, 834 – 847. doi:10.1016/j.rser.2018.04.113.
- Brown and Reichenberg (2020) Brown, T., Reichenberg, L., 2020. Decreasing market value of variable renewables is a result of policy, not variability. arXiv:2002.05209.
- Brown et al. (2018b) Brown, T., Schlachtberger, D., Kies, A., Schramm, S., Greiner, M., 2018b. Synergies of sector coupling and transmission reinforcement in a cost-optimised, highly renewable European energy system. Energy 160, 720 – 739. doi:10.1016/j.energy.2018.06.222.
- Bushnell and Novan (2018) Bushnell, J., Novan, K., 2018. Setting with the Sun: The Impacts of Renewable Energy on Wholesale Power Markets. Working Paper. National Bureau of Economic Research. doi:10.3386/w24980.
- Castillo and Gayme (2014) Castillo, A., Gayme, D.F., 2014. Grid-scale energy storage applications in renewable energy integration: A survey. Energy Conversion and Management 87, 885 – 894. doi:10.1016/j.enconman.2014.07.063.
- Child et al. (2019) Child, M., Kemfert, C., Bogdanov, D., Breyer, C., 2019. Flexible electricity generation, grid exchange and storage for the transition to a 100% renewable energy system in Europe. Renewable Energy 139, 80 – 101. doi:10.1016/j.renene.2019.02.077.
- Ciarreta et al. (2020) Ciarreta, A., Pizarro-Irizar, C., Zarraga, A., 2020. Renewable energy regulation and structural breaks: An empirical analysis of Spanish electricity price volatility. Energy Econ. 88, 104749. doi:10.1016/j.eneco.2020.104749.
- Clò et al. (2015) Clò, S., Cataldi, A., Zoppoli, P., 2015. The merit-order effect in the Italian power market: The impact of solar and wind generation on national wholesale electricity prices. Energy Policy 77, 79–88. doi:10.1016/j.enpol.2014.11.038.
- Clò and D’Adamo (2015) Clò, S., D’Adamo, G., 2015. The dark side of the sun: How solar power production affects the market value of solar and gas sources. Energy Econ. 49, 523–530. doi:10.1016/j.eneco.2015.03.025.
- Cludius et al. (2014) Cludius, J., Hermann, H., Matthes, F.C., Graichen, V., 2014. The merit order effect of wind and photovoltaic electricity generation in Germany 2008-2016: Estimation and distributional implications. Energy Econ. 44, 302–313. doi:10.1016/j.eneco.2014.04.020.
- de Coninck et al. (2018) de Coninck, H., Revi, A., Babiker, M., Bertoldi, P., Buckeridge, M., Cartwright, A., Dong, W., Ford, J., Fuss, S., Hourcade, J.C., Ley, D., Mechler, R., Newman, P., Revokatova, A., Schultz, S., Steg, L., Sugiyama, T., 2018. Strengthening and implementing the global response, in: Global Warming of 1.5∘C. An IPCC Special Report on the impacts of global warming of 1.5∘C above pre-industrial levels and related global greenhouse gas emission pathways, in the context of strengthening the global response to the threat of climate change, sustainable development, and efforts to eradicate poverty. URL: https://www.ipcc.ch/site/assets/uploads/sites/2/2019/02/SR15_Chapter4_Low_Res.pdf.
- Cramton (2017) Cramton, P., 2017. Electricity market design. Oxford Rev. Econ. Policy 33, 589–612. doi:10.1093/oxrep/grx041.
- Cramton and Ockenfels (2012) Cramton, P., Ockenfels, A., 2012. Economics and design of capacity markets for the power sector. Zeitschrift für Energiewirtschaft 36, 113–134. doi:10.1007/s12398-012-0084-2.
- Creutzig et al. (2017) Creutzig, F., Agoston, P., Goldschmidt, J.C., Luderer, G., Nemet, G., Pietzcker, R.C., 2017. The underestimated potential of solar energy to mitigate climate change. Nat. Energy 2, 1–9. doi:10.1038/nenergy.2017.140.
- Csereklyei et al. (2019) Csereklyei, Z., Qu, S., Ancev, T., 2019. The effect of wind and solar power generation on wholesale electricity prices in Australia. Energy Policy 131, 358–369. doi:10.1016/j.enpol.2019.04.007.
- Denholm et al. (2010) Denholm, P., Ela, E., Kirby, B., Milligan, M., 2010. The Role of Energy Storage with Renewable Electricity Generation. Technical Report NREL/TP-6A2-47187. National Renewable Energy Lab.(NREL), Golden, CO (United States). doi:10.2172/972169.
- Denholm and Hand (2011) Denholm, P., Hand, M., 2011. Grid flexibility and storage required to achieve very high penetration of variable renewable electricity. Energy Policy 39, 1817 – 1830. doi:10.1016/j.enpol.2011.01.019.
- Denholm et al. (2013) Denholm, P., Jorgenson, J., Hummon, M., Palchak, D., Kirby, B., Ma, O., O’Malley, M., 2013. The Impact of Wind and Solar on the Value of Energy Storage. Technical Report NREL/TP-6A20-60568. National Renewable Energy Laboratory. 15013 Denver West Parkway, Golden, CO 80401. URL: https://www.nrel.gov/docs/fy14osti/60568.pdf.
- Dowling et al. (2020) Dowling, J.A., Rinaldi, K.Z., Ruggles, T.H., Davis, S.J., Yuan, M., Tong, F., Lewis, N.S., Caldeira, K., 2020. Role of long-duration energy storage in variable renewable electricity systems. Joule 4, 1907–1928. doi:10.1016/j.joule.2020.07.007.
- Ecofys (2014) Ecofys, 2014. Subsidies and costs of EU energy. Technical Report. URL: https://ec.europa.eu/energy/sites/ener/files/documents/ECOFYS%202014%20Subsidies%20and%20costs%20of%20EU%20energy_11_Nov.pdf.
- Edenhofer et al. (2014) Edenhofer, O., Sokona, Y., Minx, J.C., Farahani, E., Kadner, S., Seyboth, K., Adler, A., Baum, I., Brunner, S., Kriemann, B., Savolainen Web Manager Steffen Schlömer, J., von Stechow, C., Zwickel Senior Scientist, T., 2014. Climate Change 2014 Mitigation of Climate Change Working Group III Contribution to the Fifth Assessment Report of the Intergovernmental Panel on Climate Change Edited by. Technical Report. URL: www.cambridge.org.
- Eising et al. (2020) Eising, M., Hobbie, H., Möst, D., 2020. Future wind and solar power market values in Germany — Evidence of spatial and technological dependencies? Energy Econ. 86, 104638. doi:10.1016/j.eneco.2019.104638.
- Engeland et al. (2017) Engeland, K., Borga, M., Creutin, J.D., François, B., Ramos, M.H., Vidal, J.P., 2017. Space-time variability of climate variables and intermittent renewable electricity production – a review. Renewable and Sustainable Energy Reviews 79, 600 – 617. doi:10.1016/j.rser.2017.05.046.
- Friedlingstein et al. (2019) Friedlingstein, P., Jones, M.W., O’Sullivan, M., Andrew, R.M., Hauck, J., Peters, G.P., Peters, W., Pongratz, J., Sitch, S., Le Quéré, C., DBakker, O.C., Canadell1, J.G., Ciais1, P., Jackson, R.B., Anthoni1, P., Barbero, L., Bastos, A., Bastrikov, V., Becker, M., Bopp, L., Buitenhuis, E., Chandra, N., Chevallier, F., Chini, L.P., Currie, K.I., Feely, R.A., Gehlen, M., Gilfillan, D., Gkritzalis, T., Goll, D.S., Gruber, N., Gutekunst, S., Harris, I., Haverd, V., Houghton, R.A., Hurtt, G., Ilyina, T., Jain, A.K., Joetzjer, E., Kaplan, J.O., Kato, E., Goldewijk, K.K., Korsbakken, J.I., Landschützer, P., Lauvset, S.K., Lefèvre, N., Lenton, A., Lienert, S., Lombardozzi, D., Marland, G., McGuire, P.C., Melton, J.R., Metzl, N., Munro, D.R., Nabel, J.E., Nakaoka, S.I., Neill, C., Omar, A.M., Ono, T., Peregon, A., Pierrot, D., Poulter, B., Rehder, G., Resplandy, L., Robertson, E., Rödenbeck, C., Séférian, R., Schwinger, J., Smith, N., Tans, P.P., Tian, H., Tilbrook, B., Tubiello, F.N., Van Der Werf, G.R., Wiltshire, A.J., Zaehle, S., 2019. Global carbon budget 2019. Earth Syst. Sci. Data 11, 1783–1838. doi:10.5194/essd-11-1783-2019.
- Fürsch et al. (2013) Fürsch, M., Hagspiel, S., Jägemann, C., Nagl, S., Lindenberger, D., Tröster, E., 2013. The role of grid extensions in a cost-efficient transformation of the European electricity system until 2050. Applied Energy 104, 642 – 652. doi:10.1016/j.apenergy.2012.11.050.
- Gaete-Morales et al. (2020) Gaete-Morales, C., Kittel, M., Roth, A., Schill, W.P., Zerrahn, A., 2020. DIETERpy: a Python framework for The Dispatch and Investment Evaluation Tool with Endogenous Renewables. arXiv:2010.00883.
- Gelabert et al. (2011) Gelabert, L., Labandeira, X., Linares, P., 2011. An ex-post analysis of the effect of renewables and cogeneration on Spanish electricity prices. Energy Econ. 33, S59–S65. doi:10.1016/j.eneco.2011.07.027.
- German Advisory Council on Global Change (2011) German Advisory Council on Global Change, 2011. World in Transition. A Social Contract for Sustainability. Technical Report. URL: https://www.wbgu.de/en/publications/publication/world-in-transition-a-social-contract-for-sustainability#section-downloads.
- Green and Vasilakos (2011) Green, R., Vasilakos, N., 2011. The long-term impact of wind power on electricity prices and generating capacity, in: IEEE Power Energy Soc. Gen. Meet. doi:10.1109/PES.2011.6039218.
- Green and Léautier (2015) Green, R.J., Léautier, T.O., 2015. Do costs fall faster than revenues ? Dynamics of renewables entry into electricity markets. TSE Working Papers 15-591. Toulouse School of Economics. URL: https://ideas.repec.org/p/tse/wpaper/29543.html.
- Grossmann et al. (2014) Grossmann, W.D., Grossmann, I., Steininger, K.W., 2014. Solar electricity generation across large geographic areas, Part II: A Pan-American energy system based on solar. Renew. Sustain. Energy Rev. 32, 983–993. doi:10.1016/j.rser.2014.01.003.
- Gür (2018) Gür, T.M., 2018. Review of electrical energy storage technologies, materials and systems: challenges and prospects for large-scale grid storage. Energy & Environmental Science 11, 2696–2767. doi:10.1039/C8EE01419A.
- Hale et al. (2018) Hale, E., Bird, L., Padmanabhan, R., Volpi, C., 2018. Potential Roles for Demand Response in High-Growth Electric Systems with Increasing Shares of Renewable Generation. Technical Report. URL: www.nrel.gov/publications.
- Heide et al. (2010) Heide, D., von Bremen, L., Greiner, M., Hoffmann, C., Speckmann, M., Bofinger, S., 2010. Seasonal optimal mix of wind and solar power in a future, highly renewable europe. Renewable Energy 35, 2483 – 2489. doi:10.1016/j.renene.2010.03.012.
- Heuberger et al. (2017) Heuberger, C.F., Staffell, I., Shah, N., Dowell, N.M., 2017. A systems approach to quantifying the value of power generation and energy storage technologies in future electricity networks. Computers & Chemical Engineering 107, 247 – 256. doi:10.1016/j.compchemeng.2017.05.012.
- Hirth (2013) Hirth, L., 2013. The market value of variable renewables. The effect of solar wind power variability on their relative price. Energy Econ. 38, 218–236. doi:10.1016/j.eneco.2013.02.004.
- Hirth (2015) Hirth, L., 2015. The optimal share of variable renewables: How the variability of wind and solar power affects their welfare-optimal deployment. Energy J. 36, 149–184. doi:10.5547/01956574.36.1.6.
- Hirth et al. (2015) Hirth, L., Ueckerdt, F., Edenhofer, O., 2015. Integration costs revisited - An economic framework for wind and solar variability. Renew. Energy 74, 925–939. doi:10.1016/j.renene.2014.08.065.
- Hirth et al. (2016) Hirth, L., Ueckerdt, F., Edenhofer, O., 2016. Why wind is not coal: On the economics of electricity generation. Energy J. 37, 1–27. doi:10.5547/01956574.37.3.lhir.
- Hoekstra et al. (2017) Hoekstra, A., Steinbuch, M., Verbong, G., 2017. Creating agent-based energy transition management models that can uncover profitable pathways to climate change mitigation. Complexity 2017. doi:10.1155/2017/1967645.
- IEA (2017) IEA, 2017. Digitalization & Energy. Technical Report. International Energy Agency. URL: www.iea.org/t{&}c/.
- IEA (2018) IEA, 2018. World Energy Outlook 2018. Technical Report. International Energy Agency. URL: https://www.iea.org/reports/world-energy-outlook-2018.
- IEA (2019a) IEA, 2019a. The Future of Hydrogen. Technical Report. International Energy Agency. URL: https://www.iea.org/reports/the-future-of-hydrogen, doi:10.1787/1e0514c4-en.
- IEA (2019b) IEA, 2019b. World Energy Outlook 2019. Technical Report. International Energy Agency. URL: https://www.iea.org/reports/world-energy-outlook-2019. international Energy Agency.
- IEA (2020a) IEA, 2020a. Energy Technology Perspectives 2020. Technical Report. International Energy Agency. URL: www.iea.org/t{&}c/.
- IEA (2020b) IEA, 2020b. World Energy Investment 2020. Technical Report. International Energy Agency. URL: www.iea.org/t{&}c/.
- IRENA (2020) IRENA, 2020. Renewable Power Generation Costs in 2019. Technical Report. International Renewable Energy Agency. Abu Dhabi. URL: https://www.irena.org/-/media/Files/IRENA/Agency/Publication/2018/Jan/IRENA_2017_Power_Costs_2018.pdf.
- Jacobson et al. (2017) Jacobson, M.Z., Delucchi, M.A., Bauer, Z.A., Goodman, S.C., Chapman, W.E., Cameron, M.A., Bozonnat, C., Chobadi, L., Clonts, H.A., Enevoldsen, P., Erwin, J.R., Fobi, S.N., Goldstrom, O.K., Hennessy, E.M., Liu, J., Lo, J., Meyer, C.B., Morris, S.B., Moy, K.R., O’Neill, P.L., Petkov, I., Redfern, S., Schucker, R., Sontag, M.A., Wang, J., Weiner, E., Yachanin, A.S., 2017. 100% clean and renewable wind, water, and sunlight all-sector energy roadmaps for 139 countries of the world. Joule 1, 108 – 121. doi:10.1016/j.joule.2017.07.005.
- Joskow (2011) Joskow, B.P.L., 2011. Comparing the Costs of Intermittent and Dispatchable Electricity Generating Technologies. Am. Econ. Rev. Pap. Proc. 101.
- Joskow (2019) Joskow, P.L., 2019. Challenges for wholesale electricity markets with intermittent renewable generation at scale: The US experience. Oxford Rev. Econ. Policy 35, 291–331. doi:10.1093/oxrep/grz001.
- Karkour et al. (2020) Karkour, S., Ichisugi, Y., Abeynayaka, A., Itsubo, N., 2020. External-cost estimation of electricity generation in G20 countries: Case study using a global life-cycle impact-assessment method. Sustain. 12. doi:10.3390/su12052002.
- Kempton and Tomić (2005) Kempton, W., Tomić, J., 2005. Vehicle-to-grid power fundamentals: Calculating capacity and net revenue. Journal of Power Sources 144, 268 – 279. doi:10.1016/j.jpowsour.2004.12.025.
- van Kooten (2016) van Kooten, G.C., 2016. The Economics of Wind Power. Annu. Rev. Resour. Econ. 8, 181–205. doi:10.1146/annurev-resource-091115-022544.
- Kyritsis et al. (2017) Kyritsis, E., Andersson, J., Serletis, A., 2017. Electricity prices, large-scale renewable integration, and policy implications. Energy Policy 101, 550–560. doi:10.1016/j.enpol.2016.11.014.
- Lamont (2008) Lamont, A.D., 2008. Assessing the long-term system value of intermittent electric generation technologies. Energy Econ. 30, 1208–1231. doi:10.1016/j.eneco.2007.02.007.
- Lang et al. (2016) Lang, T., Ammann, D., Girod, B., 2016. Profitability in absence of subsidies: A techno-economic analysis of rooftop photovoltaic self-consumption in residential and commercial buildings. Renewable Energy 87, 77–87. doi:10.1016/j.renene.2015.09.059.
- Lazard (2019) Lazard, 2019. Lazard’s levelized cost of storage analysis version 5.0. Technical Report. URL: https://www.lazard.com/perspective/lcoe2019.
- Léautier (2019) Léautier, T.O., 2019. Imperfect Markets and Imperfect Regulation: An Introduction to the Microeconomics and Political Economy of Power Markets. URL: https://mitpress.mit.edu/books/imperfect-markets-and-imperfect-regulation.
- Leslie et al. (2020) Leslie, G.W., Stern, D.I., Shanker, A., Hogan, M.T., 2020. Designing electricity markets for high penetrations of zero or low marginal cost intermittent energy sources. Electr. J. 33, 106847. doi:10.1016/j.tej.2020.106847.
- López Prol and Steininger (2020) López Prol, J., Steininger, K.W., 2020. Photovoltaic self-consumption is now profitable in Spain. Effects of the new regulation on prosumers’ internal rate of return. Energy Policy 146, 111793. doi:10.1016/j.enpol.2020.111793.
- López Prol et al. (2020) López Prol, J., Steininger, K.W., Zilberman, D., 2020. The cannibalization effect of wind and solar in the California wholesale electricity market. Energy Econ. 85, 104552. doi:10.1016/j.eneco.2019.104552.
- Lund et al. (2015) Lund, P.D., Lindgren, J., Mikkola, J., Salpakari, J., 2015. Review of energy system flexibility measures to enable high levels of variable renewable electricity. Renewable and Sustainable Energy Reviews 45, 785 – 807. doi:10.1016/j.rser.2015.01.057.
- Luo et al. (2015) Luo, X., Wang, J., Dooner, M., Clarke, J., 2015. Overview of current development in electrical energy storage technologies and the application potential in power system operation. Applied Energy 137, 511 – 536. doi:10.1016/j.apenergy.2014.09.081.
- MacDonald et al. (2016) MacDonald, A.E., Clack, C.T.M., Alexander, A., Dunbar, A., Wilczak, J., Xie, Y., 2016. Future cost-competitive electricity systems and their impact on US CO2 emissions. Nature Climate Change 6, 526–531. doi:10.1038/nclimate2921.
- Madeddu et al. (2020) Madeddu, S., Ueckerdt, F., Pehl, M., Peterseim, J., Lord, M., Kumar, K.A., Krüger, C., Luderer, G., 2020. The co2 reduction potential for the European industry via direct electrification of heat supply (power-to-heat). Environmental Research Letters 15, 124004. doi:10.1088/1748-9326/abbd02.
- Mallapragada et al. (2020) Mallapragada, D.S., Sepulveda, N.A., Jenkins, J.D., 2020. Long-run system value of battery energy storage in future grids with increasing wind and solar generation. Applied Energy 275, 115390. doi:10.1016/j.apenergy.2020.115390.
- Mansilla et al. (2018) Mansilla, C., Bourasseau, C., Cany, C., Guinot, B., Duigou, A.L., Lucchese, P., 2018. Hydrogen applications: Overview of the key economic issues and perspectives, in: Hydrog. Supply Chain Des. Deploy. Oper.. Elsevier, pp. 271–292. doi:10.1016/B978-0-12-811197-0.00007-5.
- Masson-Delmotte et al. (2018) Masson-Delmotte, V., Zhai, P., Pörtner, H.O., Roberts, D., Skea, J., Shukla, P.R., Pirani, A., Moufouma-Okia, W., Péan, C., Pidcock, R., Connors, S., Matthews, J.B.R., Chen, Y., Zhou, X., Gomis, M.I., Lonnoy, E., Maycock, T., Tignor, M., Waterfield, T., 2018. Global warming of 1.5∘C. An IPCC Special Report on the impacts of global warming of 1.5∘C above pre-industrial levels and related global greenhouse gas emission pathways, in the context of strengthening the global response to the threat of climate change. Technical Report.
- Mayer et al. (2015) Mayer, J.N., Philipps, S., Hussein, N.S., Schlegl, T., Senkpiel, C., 2015. Current and Future Cost of Photovoltaics Long-term Scenarios for Market Development, System Prices and LCOE of Utility-Scale PV Systems. Technical Report. Agpora Energiewende. URL: https://www.ise.fraunhofer.de/content/dam/ise/de/documents/publications/studies/AgoraEnergiewende_Current_and_Future_Cost_of_PV_Feb2015_web.pdf.
- McConnell et al. (2015) McConnell, D., Forcey, T., Sandiford, M., 2015. Estimating the value of electricity storage in an energy-only wholesale market. Applied Energy 159, 422 – 432. doi:10.1016/j.apenergy.2015.09.006.
- Mills and Wiser (2014) Mills, A., Wiser, R., 2014. Strategies for Mitigating the Reduction in Economic Value of Variable Generation with Increasing Penetration Levels. Ernest Orlando Lawrence Berkeley Natl. Lab. 36, 119–127. doi:10.1016/j.exphem.2007.09.002.
- Mills et al. (2020) Mills, A.D., Levin, T., Wiser, R., Seel, J., Botterud, A., 2020. Impacts of variable renewable energy on wholesale markets and generating assets in the United States: A review of expectations and evidence. Renew. Sustain. Energy Rev. 120, 109670. doi:10.1016/j.rser.2019.109670.
- Mills and Wiser (2012) Mills, A.D., Wiser, R.H., 2012. Changes in the economic value of photovoltaic generation at high penetration levels: A pilot case study of California, in: Conf. Rec. IEEE Photovolt. Spec. Conf. doi:10.1109/PVSC-Vol2.2013.6656763.
- Palizban and Kauhaniemi (2016) Palizban, O., Kauhaniemi, K., 2016. Energy storage systems in modern grids – matrix of technologies and applications. Journal of Energy Storage 6, 248 – 259. doi:10.1016/j.est.2016.02.001.
- Rai and Nunn (2020) Rai, A., Nunn, O., 2020. On the impact of increasing penetration of variable renewables on electricity spot price extremes in Australia. Econ. Anal. Policy 67, 67–86. doi:10.1016/j.eap.2020.06.001.
- Rasmussen et al. (2012) Rasmussen, M.G., Andresen, G.B., Greiner, M., 2012. Storage and balancing synergies in a fully or highly renewable pan-European power system. Energy Policy 51, 642 – 651. doi:10.1016/j.enpol.2012.09.009.
- Raynaud et al. (2018) Raynaud, D., Hingray, B., François, B., Creutin, J., 2018. Energy droughts from variable renewable energy sources in European climates. Renewable Energy 125, 578 – 589. doi:10.1016/j.renene.2018.02.130.
- Rintamäki et al. (2017) Rintamäki, T., Siddiqui, A.S., Salo, A., 2017. Does renewable energy generation decrease the volatility of electricity prices? An analysis of Denmark and Germany. Energy Econ. 62, 270–282. doi:10.1016/j.eneco.2016.12.019.
- Runge et al. (2019) Runge, P., Sölch, C., Albert, J., Wasserscheid, P., Zöttl, G., Grimm, V., 2019. Economic comparison of different electric fuels for energy scenarios in 2035. Applied Energy 233-234, 1078–1093. doi:10.1016/j.apenergy.2018.10.023.
- Sáenz de Miera et al. (2008) Sáenz de Miera, G., del Río González, P., Vizcaíno, I., 2008. Analysing the impact of renewable electricity support schemes on power prices: The case of wind electricity in Spain. Energy Policy 36, 3345–3359. doi:10.1016/J.ENPOL.2008.04.022.
- Safaei and Keith (2015) Safaei, H., Keith, D.W., 2015. How much bulk energy storage is needed to decarbonize electricity? Energy & Environmental Science 8, 3409–3417. doi:10.1039/C5EE01452B.
- Say et al. (2020) Say, K., Schill, W.P., John, M., 2020. Degrees of displacement: The impact of household PV battery prosumage on utility generation and storage. Applied Energy 276, 115466. doi:10.1016/j.apenergy.2020.115466.
- Schiebahn et al. (2015) Schiebahn, S., Grube, T., Robinius, M., Tietze, V., Kumar, B., Stolten, D., 2015. Power to gas: Technological overview, systems analysis and economic assessment for a case study in germany. International Journal of Hydrogen Energy 40, 4285 – 4294. doi:10.1016/j.ijhydene.2015.01.123.
- Schill (2014) Schill, W.P., 2014. Residual load, renewable surplus generation and storage requirements in Germany. Energy Policy 73, 65 – 79. doi:10.1016/j.enpol.2014.05.032.
- Schill (2020) Schill, W.P., 2020. Electricity storage and the renewable energy transition. Joule 4, 2059–2064. doi:10.1016/j.joule.2020.07.022.
- Schill et al. (2015) Schill, W.P., Diekmann, J., Zerrahn, A., 2015. Power storage: An important option for the german energy transition. DIW DIW Economic Bulletin 10, 137 – 146.
- Schill et al. (2017a) Schill, W.P., Pahle, M., Gambardella, C., 2017a. Start-up costs of thermal power plants in markets with increasing shares of variable renewable generation. Nature Energy 2, 17050. doi:10.1038/nenergy.2017.50.
- Schill and Zerrahn (2018) Schill, W.P., Zerrahn, A., 2018. Long-run power storage requirements for high shares of renewables: Results and sensitivities. Renewable and Sustainable Energy Reviews 83, 156–171. doi:10.1016/j.rser.2017.05.205.
- Schill and Zerrahn (2020) Schill, W.P., Zerrahn, A., 2020. Reduced version of the model DIETER. Zenodo. doi:10.5281/zenodo.4383288.
- Schill et al. (2017b) Schill, W.P., Zerrahn, A., Kunz, F., 2017b. Prosumage of solar electricity: Pros, cons, and the system perspective. Economics of Energy & Environmental Policy 6, 7 – 31. doi:10.5547/2160-5890.6.1.wsch.
- Schlachtberger et al. (2017) Schlachtberger, D., Brown, T., Schramm, S., Greiner, M., 2017. The benefits of cooperation in a highly renewable European electricity network. Energy 134, 469 – 481. doi:10.1016/j.energy.2017.06.004.
- Schmidt et al. (2017) Schmidt, O., Hawkes, A., Gambhir, A., Staffell, I., 2017. The future cost of electrical energy storage based on experience rates. Nature Energy 2, 17110. doi:10.1038/nenergy.2017.110.
- Schmidt et al. (2019) Schmidt, O., Melchior, S., Hawkes, A., Staffell, I., 2019. Projecting the Future Levelized Cost of Electricity Storage Technologies. Joule 3, 81–100. doi:10.1016/j.joule.2018.12.008.
- Seel et al. (2018) Seel, J., Mills, A., Wiser, R., Deb, S., Asokkumar, A., Hassanzadeh, M., Aarabali, A., 2018. Impacts of High Variable Renewable Energy Futures on Wholesale Electricity Prices, and on Electric-Sector Decision Making. Technical Report May. URL: https://emp.lbl.gov/publications/impacts-high-variable-renewable.
- Sensfuß et al. (2008) Sensfuß, F., Ragwitz, M., Genoese, M., 2008. The merit-order effect: A detailed analysis of the price effect of renewable electricity generation on spot market prices in Germany. Energy Policy 36, 3076–3084. doi:10.1016/j.enpol.2008.03.035.
- Sinn (2017) Sinn, H.W., 2017. Buffering volatility: A study on the limits of Germany’s energy revolution. European Economic Review 99, 130 – 150. doi:10.1016/j.euroecorev.2017.05.007.
- Sioshansi et al. (2012) Sioshansi, R., Denholm, P., Jenkin, T., 2012. Market and policy barriers to deployment of energy storage. Economics of Energy & Environmental Policy 1, 47–64.
- Sioshansi et al. (2009) Sioshansi, R., Denholm, P., Jenkin, T., Weiss, J., 2009. Estimating the value of electricity storage in PJM: Arbitrage and some welfare effects. Energy Economics 31, 269 – 277. doi:10.1016/j.eneco.2008.10.005.
- de Sisternes et al. (2016) de Sisternes, F.J., Jenkins, J.D., Botterud, A., 2016. The value of energy storage in decarbonizing the electricity sector. Applied Energy 175, 368 – 379. doi:10.1016/j.apenergy.2016.05.014.
- Staffell and Rustomji (2016) Staffell, I., Rustomji, M., 2016. Maximising the value of electricity storage. Journal of Energy Storage 8, 212 – 225. doi:10.1016/j.est.2016.08.010.
- Steinke et al. (2013) Steinke, F., Wolfrum, P., Hoffmann, C., 2013. Grid vs. storage in a 100% renewable Europe. Renewable Energy 50, 826 – 832. doi:10.1016/j.renene.2012.07.044.
- Stephan et al. (2016) Stephan, A., Battke, B., Beuse, M., Clausdeinken, J., Schmidt, T., 2016. Limiting the public cost of stationary battery deployment by combining applications. Nature Energy 1, 16079. doi:10.1038/nenergy.2016.79.
- Stoft (2002) Stoft, S., 2002. Power System Economics: Designing Markets for Electricity. URL: https://www.wiley.com/en-us/Power+System+Economics%3A+Designing+Markets+for+Electricity-p-9780471150404.
- Taljegard et al. (2019) Taljegard, M., Walter, V., Göransson, L., Odenberger, M., Johnsson, F., 2019. Impact of electric vehicles on the cost-competitiveness of generation and storage technologies in the electricity system. Environmental Research Letters 14, 124087. doi:10.1088/1748-9326/ab5e6b.
- Tol (2009) Tol, R.S.J., 2009. The Economie Effects of Climate Change. J. Econ. Perspect. 23, 29–51. doi:10.1257/jep.23.2.29.
- Tong et al. (2020) Tong, F., Yuan, M., Lewis, N.S., Davis, S.J., Caldeira, K., 2020. Effects of deep reductions in energy storage costs on highly reliable wind and solar electricity systems. iScience 23, 101484. doi:10.1016/j.isci.2020.101484.
- Ueckerdt et al. (2015) Ueckerdt, F., Brecha, R., Luderer, G., Sullivan, P., Schmid, E., Bauer, N., Böttger, D., Pietzcker, R., 2015. Representing power sector variability and the integration of variable renewables in long-term energy-economy models using residual load duration curves. Energy 90, 1799 – 1814. doi:10.1016/j.energy.2015.07.006.
- Ueckerdt et al. (2013) Ueckerdt, F., Hirth, L., Luderer, G., Edenhofer, O., 2013. System LCOE: What are the costs of variable renewables? Energy 63, 61–75. doi:10.1016/j.energy.2013.10.072.
- Vartiainen et al. (2020) Vartiainen, E., Masson, G., Breyer, C., Moser, D., Román Medina, E., 2020. Impact of weighted average cost of capital, capital expenditure, and other parameters on future utility-scale PV levelised cost of electricity. Prog. Photovoltaics Res. Appl. 28, 439–453. doi:10.1002/pip.3189.
- Weitemeyer et al. (2015) Weitemeyer, S., Kleinhans, D., Vogt, T., Agert, C., 2015. Integration of renewable energy sources in future power systems: The role of storage. Renewable Energy 75, 14 – 20. doi:10.1016/j.renene.2014.09.028.
- Welisch et al. (2016) Welisch, M., Ortner, A., Resch, G., 2016. Assessment of RES technology market values and the merit-order effect - An econometric multi-country analysis. Energy Environ. 27, 105–121. doi:10.1177/0958305X16638574.
- Wenders (1976) Wenders, J.T., 1976. Peak load pricing in the electric utility industry. Bell J. Econ. 7, 232–241. doi:10.2307/3003198.
- Wiese et al. (2019) Wiese, F., Schlecht, I., Bunke, W.D., Gerbaulet, C., Hirth, L., Jahn, M., Kunz, F., Lorenz, C., Mühlenpfordt, J., Reimann, J., Schill, W.P., 2019. Open Power System Data – Frictionless data for electricity system modelling. Appl. Energy 236, 401–409. doi:10.1016/j.apenergy.2018.11.097.
- Woo et al. (2011) Woo, C.K., Horowitz, I., Moore, J., Pacheco, A., 2011. The impact of wind generation on the electricity spot-market price level and variance: The Texas experience. Energy Policy 39, 3939–3944. doi:10.1016/j.enpol.2011.03.084.
- Woo et al. (2016) Woo, C.K., Moore, J., Schneiderman, B., Ho, T., Olson, A., Alagappan, L., Chawla, K., Toyama, N., Zarnikau, J., 2016. Merit-order effects of renewable energy and price divergence in California’s day-ahead and real-time electricity markets. Energy Policy 92, 299–312. doi:10.1016/j.enpol.2016.02.023.
- World Energy Council (2016) World Energy Council, 2016. E-storage : Shifting from cost to value. Wind and solar applications. World Energy Resources. URL: https://www.worldenergy.org/assets/downloads/Resources-E-storage-report-2016.02.04.pdf.
- Yan et al. (2019) Yan, Z., Hitt, J.L., Turner, J.A., Mallouk, T.E., 2019. Renewable Electricity Storage Using Electrolysis. Proceedings of the National Academy of Sciences 117, 12558–12563. doi:10.1073/pnas.1821686116.
- Zerrahn and Schill (2017) Zerrahn, A., Schill, W.P., 2017. Long-run power storage requirements for high shares of renewables: review and a new model. Renewable and Sustainable Energy Reviews 79, 1518 – 1534. doi:10.1016/j.rser.2016.11.098.
- Zerrahn et al. (2018) Zerrahn, A., Schill, W.P., Kemfert, C., 2018. On the economics of electrical storage for variable renewable energy sources. European Economic Review 108, 259 – 279. doi:10.1016/j.euroecorev.2018.07.004.
- Ziegler et al. (2019) Ziegler, M.S., Mueller, J.M., Pereira, G.D., Song, J., Ferrara, M., Chiang, Y.M., Trancik, J.E., 2019. Storage requirements and costs of shaping renewable energy toward grid decarbonization. Joule 3, 2134 – 2153. doi:10.1016/j.joule.2019.06.012.
- Zipp (2017) Zipp, A., 2017. The marketability of variable renewable energy in liberalized electricity markets – An empirical analysis. Renew. Energy 113, 1111–1121. doi:10.1016/j.renene.2017.06.072.