On the Motion of Stars in the Pleiades according to Gaia DR2 Data
Abstract
We used Gaia DR2 data on the coordinates, proper motions, and radial velocities of stars in regions with radius and size around the cluster center in order to estimate several parameters of the Pleiades cluster. With the data on stars of magnitudes , we constructed the density maps and profile, luminosity and mass functions of the cluster, determined the cluster radius, ( pc), and the radius of its core, ( pc), and obtained estimates for the number of stars in the cluster, , and their mass, ; numbers of stars in the core of the cluster, , and their mass . Distribution of stars with at distances from the cluster center in three-dimensional space of pc and at – pc contains radial density waves. Based on the data on stars with , we determined the average rotation velocity of the core of the cluster km s-1 at distances in the sky plane pc from its center. The rotation is “prograde”, the angle between the projection of the axis of rotation of the cluster core onto the sky plane and the direction to the North Pole of the Galaxy is , the angle between the axis of rotation of the cluster core and the sky plane is , the rotation velocity of the cluster core at a distance of pc from its center is close to zero: km s-1. According to the data on stars with , the velocity of the “retrograde” rotation of the cluster at a distance of pc from its center is km s-1, the angle . The dependences of moduli of the tangential and radial components of the velocity field of the stars of the cluster core in the sky plane on the distance to the center of the cluster contain a number of periodic oscillations. The dispersions of the velocities of the stars in the cluster core increase on average with an increase in , which, like the radial density waves and the waves of oscillations of the velocity field in the sky plane, indicates the non-stationarity of the cluster in the field of regular forces. The Jeans wavelength in the cluster core decreases, and the velocity dispersion of the stars in the core under the Jeans instability increases after taking into account the influence of the external field of the Galaxy on the cluster. The region of gravitational instability in the Pleiades cluster is located in the interval = – pc and contains –% of the total number of stars in the considered samples of cluster stars. Estimates of the Pleiades dynamic mass and tidal radius are obtained.
It is a preprint of an article accepted for publication in Astrophysical Bulletin ©2020 Pleiades Publishing, Ltd. http://pleiades.online/
1 INTRODUCTION
The collection of sufficiently accurate and complete data on the motions and coordinates of stars in the Galaxy, recently obtained within the framework of the Gaia project, makes it possible to verify the theoretical conclusions formulated some time ago in stellar dynamics (Danilov, 2008; Danilov and Putkov, 2017) on the non-stationarity of open star clusters (OSC), on gravitational instability of cluster cores on the example of the nearby Pleiades cluster. Among the important tasks is the study of the structure and internal kinematics of the Pleiades, since diagnostics of the dynamic state of an OSC is based on the results of statistical and kinematic studies of OSCs, on the estimates of the general and local dispersions of stellar velocities, tidal radii, and total and virial masses of OSCs.
The internal kinematics of OSCs is poorly studied, which is mainly due to the low accuracy of the previously used data on proper motions, radial velocities and distances of member stars of OSCs from the Sun. Let us note here several works. Based on data on proper motions of stars in eight OSCs, Sagar and Bhatt (1989) considered the dependences of the stellar velocity dispersion on the average mass and radial distance from the cluster center. In most clusters, such dependences were not found, isotropy of velocities in the sky plane was observed in all considered clusters, excluding NGC 2516, in which the radial and tangential components of the stellar velocity dispersion differ in the outer ( pc) regions of the cluster. Typical errors of the root-mean-square deviations of proper motions of stars from the mean for the considered OSCs ranged from to for 100 years (see Table 2 from Sagar and Bhatt (1989)).
The Pleiades and Praesepe clusters were studied in Adams et al. (2001, 2002), respectively. After identifying the members of the cluster (with probability ), it was found that the mass of the Pleiades cluster is (taking into account the contribution of binary stars not resolved by observations, the value of which was estimated at 15% of the ”observed” cluster mass obtained after a constructing the cluster mass function (MF)). According to Adams et al. (2001) for the Pleiades, the tidal radius is 13.1 pc. MF of the cluster turned out to be flatter in the core than in the halo (see Fig. 10 from Adams et al. (2001)). This fact indicates a decrease in the fraction of low-mass stars with due to their dissipation during stellar approaches, but needs to be confirmed using more accurate information about the membership of stars to a cluster at large distances from its center. The same calculations for the Praesepe cluster performed in Adams et al. (2002) lead to the estimates , pc for (the contribution of unresolved binary stars was not taken into account); MF in the stellar mass interval – is approximately similar to the MF for the Pleiades (see Fig. 12 from Adams et al. (2002)), the differences in MF in the core and halo of the Praesepe cluster also indicate to reduce the proportion of low-mass stars in the cluster core compared to the halo (as in the Pleiades cluster). When considering the stars—the most probable members of the OSC, the papers Adams et al. (2001, 2002) also noted the ellipticity of the outer parts of the Pleiades and Praesepe clusters, which indicates the influence of the tidal field of the Galaxy at their periphery.
The internal kinematics of the OSC Perseus was considered in Makarov (2006) from the data on the proper motions and coordinates of the star-members of the cluster. A conclusion is made about the general compression of the cluster, an estimate of the critical value of its tidal density is given pc3. About half of the most massive cluster stars (with spectral types earlier than G) are located inside a sphere with a radius of 10.3 pc. Arguments in favor of the gravitational coupling of this OSC are presented.
Vereshchagin et al. (2013) used the Hipparcos catalog data on proper motions and parallaxes known for the cluster members with an accuracy of at least 5 milliseconds of arc per year and 3 milliseconds of arc, respectively, to study the internal kinematics of the Hyades cluster. A correlation was noted between the tangential velocity component and parallax, which indicates a possible rotation of the cluster. The axis of rotation is perpendicular to the direction of the Hyades apex on the celestial sphere.
Danilov and Loktin (2015) investigated the internal kinematics of the Pleiades, Praesepe and M 67 clusters by the data on the coordinates in the sky plane and the proper motions of the cluster member stars. Periodic oscillations are identified on the constructed radial dependences of the values of the moduli of the tangential and radial projections of the velocities of the stars relative to the cluster center. An increase in these moduli with distance to the center of the cluster, as well as the presence of waves of oscillations of the velocity field in the spectra of oscillations of the OSCs, considered in Danilov and Loktin (2015), indicates the nonstationarity of these clusters in the field of regular forces. The parameters of the selected oscillations were used to estimate the total masses of the Pleiades, Praesepe and M 67. For the Pleiades cluster in Danilov and Loktin (2015), the following estimates were obtained by this method: 0.5 pc, .
When studying the parameters of the oscillation generation regions in the OSC models, as well as in the Pleiades, Praesepe and M 67 clusters, Danilov and Putkov (2017) used the condition of gravitational instability of the cores of star clusters written for an isolated cluster. It is of interest to refine this condition for the case of OSCs moving in the field of forces of the Galaxy. It may also be interesting to discuss the reasons for the formation of “cool” nuclei in the OSCs.
The goals and objectives of this work are to study the structure of the open star cluster Pleiades in the spaces of coordinates and velocities of stars, diagnose the dynamic state of this cluster based on the data of studying its spatial structure and internal kinematics, as well as estimating the general and local dispersions of stellar velocities, tidal radii, total and dynamic masses of the Pleiades cluster for samples of its members with different limiting magnitudes: .
The results obtained will make it possible to elucidate the structural features of the Pleiades in coordinate and velocity spaces, check a number of theoretical conclusions about the OSCs made in stellar dynamics, and outline further directions of research on the structure, internal kinematics, and dynamics of the OSCs.
2 BASIC FORMULAS AND CALCULATION TECHNIQUES
King (1994) obtained his formula (7.2) for the Jeans wavelength of an isolated homogeneous spherical cluster of stars from the condition that the time of the compression of a cold spherical region of radius under the action of gravitational forces is equal to the time of the exit of a star from such a region with the velocity dispersion . This formula was used in Danilov and Putkov (2017) to estimate the Jeans mass in the cluster core related to the mass of its core (const), and to calculate at a distance of from the center of the cluster. According to Danilov and Putkov (2017):
| (1) |
where was taken to be equal to the distance from the center of the cluster, at which the modulus of the gradient of the spatial density of the number of stars (and mass density) of the cluster sharply decreases when passing along from the core to the halo or to an intermediate zone of increased density in the cluster, is the gravitational constant, is the mass density at a distance from the cluster center, values for six OSC models are given in Table 1 of Danilov and Putkov (2017), is the mass of the cluster core, taken equal to the sum of the masses of stars with distances from the center of the cluster.
Let be the frequency of small homological oscillations of the model of a spherical homogeneous cluster of stars moving in the force field of the Galaxy in a circular orbit with an angular velocity relative to the galactic center. According to Danilov and Putkov (2012),
Here , where ,
are the constants characterizing the force field
of the Galaxy in the vicinity of the circular orbit
of the cluster (Chandrasekhar, 1942), ,
the value ,
;
is the mass of the cluster, and are the radius and moment of inertia of the considered
cluster model, respectively. The quantities , , are
determined in our work using the model of the Galaxy potential (Kutuzov and Osipkov, 1980).
Let , where is the compression time in the vicinity of the cluster center of the cold region with radius in the total field of forces of stars in this region and the Galaxy. Note that , where is the frequency of small homologous oscillations of an isolated cluster ( at ). The estimate of the parameters of the Jeans instability is closely related to the estimates of the frequency of the resulting oscillations of the gravitating system, which are formed as a result of the development of such instability. Let be the initial time of violent relaxation of the cluster. The value Is obtained according to the formula from (Aarseth, 1974): , where is the average initial time of a star crossing the cluster. Small perturbations of the phase density in the cluster core under the influence of such instability increase rather quickly, during the time (see, for example, the second column of Table 2 and the figure from Danilov and Dorogavtseva (2003) for the time dependences of the relative perturbations of the coarse-grained phase density in OSC models 2, 4, 6 at ), capturing more and more parts of the cluster and passing into stable oscillations of the entire system as a whole (see the transition of the dependencies to the “plateau” at in OSC models 2, 4, 6 from Danilov and Dorogavtseva (2003), Fig. 5 for the dependences in OSC models 2, 4 at from Danilov and Dorogavtseva (2008), as well as theoretical estimates of the frequencies of stable homological and nonhomological oscillations of OSC models in Danilov and Putkov (2012); Danilov (2008)).
From the condition we find: and . Because , then after taking into account the action of the Galactic field on the cluster, decreases, and increases. Taking into account the condition and repeating the calculations performed in Danilov and Putkov (2017), for a non-isolated cluster we find:
| (2) |
When using the data on the considered samples of the Pleiades cluster stars up to different limiting magnitudes , the value –. The value increases with the size of the cluster’s gravitational instability region. According to formula (11) from Danilov and Putkov (2012), the following equation can be written to estimate the dynamic dispersion of stellar velocities in the OSC from the data on the structural parameters of the cluster:
| (3) |
where , and are the potential energy of the cluster, its moment of inertia and the potential at the center of the cluster, respectively. Estimating the value of takes into account the influence of the force fields of the cluster and the Galaxy, as well as the nonstationarity of the cluster on the velocity dispersion of stars in the cluster. Assuming the value equal to the same value obtained for the cluster model in the form of a homogeneous ball with cluster mass, we find the equation for calculating the radius of this ball:
| (4) |
This equation has three real roots, which are easily found by Cardano’s formulas (Korn and Korn, 1968). The smallest positive root is used to calculate the frequencies , and the value (see above). When using the data on the considered samples of the Pleiades cluster stars up to different limiting magnitudes , the values and take the following values: – pc and –, respectively, where is the potential energy of a homogeneous ball with radius and mass .
To estimate the dynamic mass of a non-stationary and non-isolated Pleiades cluster, we used the formula (2) from Danilov and Putkov (2017), received earlier (Danilov, 2010) based on data from numerical experiments and in the work of Danilov and Loktin (2015) converted to the more computationally convenient form:
| (5) |
where is the velocity dispersion of stars in the cluster, is the average radius of the cluster (the average distance between two stars in the cluster; averaging was performed over all pairs of stars in the cluster), , is the distance of a star from the cluster center of mass (angle brackets mean averaging over all cluster stars), is the mean square of the star’s distance from the center of the cluster. The value used in (5) can be obtained both from observational data on the peculiar motions of stars, and using the relation (taking into account the results of numerical modeling of the dynamics of the OSC). In the case of formulas (3) and (5) allow solving the problem of determining the total mass of the OSC without using data on the velocities of the stars—members of the cluster.
To construct the radial dependences of the moduli of the tangential and radial projections of the velocities of the stars and , obtained from the data on the proper motions of these stars relative to the center of the Pleiades cluster in the sky plane, we used the formulas and methods from Danilov and Loktin (2015).
The radial dependences of the quantities , and the apparent density of the number of stars in the cluster, as in Danilov and Loktin (2015), were obtained from the stars closest to the circle of radius in the sky plane centered at the center of the cluster. To calculate the values , , for = const with a step along the angle relative to the center of the cluster in the sky plane, the coordinates of the nodal points were determined. Then, using six stars closest to each nodal point (for ), we determined the values , and . Further, these values were calculated as averages over all nodal points (the errors of these averages are equal to the errors of the values , and ). As in Danilov and Loktin (2015), the distributions were smoothed by the local weighted regression method (Cleveland and Devlin, 1988) until they were reduced to the form of functions monotonically decreasing in , the values of which were taken to be zero for , where is the radius of the region in which the velocity field of the cluster stars is studied. To pass from the distribution to the spatial density distribution , we used the assumption of the spherical symmetry of the distribution of stars (and mass) in the cluster, as well as the solution (8.7) of the Abel integral equation for the function in the book of Kholopov (1981).
The radial dependences on of the dispersions of the three-dimensional velocities of the stars at the distances from the cluster center were determined from the data on the equatorial coordinates, parallaxes, and proper motions of stars relative to the center of the Pleiades cluster. The values were calculated by the formula under the assumption of spherical symmetry of the stellar velocity distribution in the cluster, where is the dispersion of two-dimensional velocities of motion of stars in the sky plane.
To determine the structural parameters of the cluster and their errors in Section 6, we used the method described in the works of Danilov and Loktin (2015); Danilov (2010), according to which the spatial positions of stars were set using a random number generator in the spherical coordinate system of the cluster stars. The function was used to calculate the probability distribution density of a star hitting the interval . Discrete random variable with a given density was distributed in the interval according to the method from Sobol’, 1985, p. 26, and the values and —in the intervals and with densities that ensure a uniform distribution of stars by the angles and for each fixed value . As a result, sets of values , . were obtained. Each of the six sets of coordinates of stars imitate this cluster of stars. When evaluating the structural parameters of the OSC, we calculated the average values of these parameters and the standard deviations from the average over six sets of coordinates of stars.
The Pleiades are a fairly close cluster. Distance to the cluster is pc, modulus of the cluster velocity in the sky plane is km s-1 (according to average parallax and average proper motion of cluster stars according to Gaia data). In this case, the component of the motion of the cluster, perpendicular to the line of sight, distorts the radial velocities of the stars in the leading and lagging parts of the cluster (respectively to this motion), forming, respectively, positive and negative increments of the radial velocities of stars from these regions of the cluster. These increments create the apparent effect of rotation of the cluster about an axis perpendicular to the direction of motion of the cluster. Similar distortions can sometimes be seen in the proper motions of stars due to the motion of the cluster along the line of sight (the formation of the radiant and apex in the proper motions of the stars). Let be the projection of the OSC velocity vector onto the sky plane. To estimate the increments of the radial velocities of stars due to the motion of the OSC perpendicular to the line of sight, we consider the right-hand Cartesian coordinate system , , , the origin of the axes of which (point ) is at the center of the cluster, the axis is directed along the vector , the axis is perpendicular to the vector, and the axis is directed from the observer located at the point ; the plane coincides with the sky plane. In Fig. 1 the circle with the center at the point denotes the line of intersection of the spherical surface enveloping the cluster with the plane , the triangle is right-angled with a right angle at the vertex . Directional cosines of the vector relative to the axes , , are equal to: , , respectively, see Fig. 1. Let be the distance to the star , . The directional cosines of the vector satisfy the following relations: , , , see Fig. 1, as well as formulas (3.1–8) from Korn and Korn (1968). According to (3.1–11) from Korn and Korn (1968), , where is the angle between the vectors and in a right-angled triangle with a right angle at the vertex , and , where , (Fig. 1). Therefore, . For – pc for the Pleiades cluster – km s-1. When the sign of changes, the sign of also changes. Therefore, at the opposite (in ) edges of the cluster, the difference in the radial velocities of the stars due to the effect considered here reaches values – km s-1.
Data on the rotation of the outer regions of the Pleiades cluster can be obtained using the radial velocities of the cluster’s member stars located on opposite edges of the cluster near its equator. The rotation of the cluster core can be studied using the average proper motions of stars located closer and further from the cluster center relative to the observer, as well as stars located in the sky plane to the left and right (for and ), as well as above and below its center (for and ), for example, in the galactic coordinate system and , where , are the coordinates of the cluster center. Based on the data on the radial velocities of stars, such an approach gives the possibility to estimate the angular velocities , , of the rotation of the cluster core along the coordinate axes , , (the largest contribution to the average proper motions of such groups of stars are contributed by the stars of the core, since the apparent and spatial stellar density in the core is much higher than in the halo and corona of the cluster).
Let the axes and of a rectangular coordinate system centered at the center of the cluster are directed towards increasing coordinates and , respectively, the axis is directed away from the observer, is the sky plane. Because the vector of the angular velocity of rotation of the cluster is directed along the axis of rotation of the cluster, and the equation of the sky plane is , then the angle between the vector and the sky plane, according to (3.4–6) from Korn and Korn (1968), can be determined by the formula
| (6) |
where , , are the projections of the vector on the coordinate axes , , respectively. If the average radii , , of the circular motion of groups of stars about the axes , , are equal to each other, then the values , , for these groups can be replaced by average velocities , , of the circular motion of groups of stars relative to the axes , , , respectively (since the multiplication of the numerator and denominator on the right side of expression (6) by the radius of the circle along which the stars move relative to the coordinate axes does not change the value of ). If the values , , are not equal, then in formula (6) it is necessary to use the velocities of the stars in the samples, leading to approximately the same values of , , .
The value of can be estimated from the data on proper motions (and the corresponding velocities , of motion in the sky plane) of cluster stars with distances and : , , where , is defined similarly after replacing the index with in the expression for . The overline in and denotes averaging over stars with and . Estimates of the values of , are possible using proper motions, radial velocities and distances of cluster stars: , , where , , , where . The overline in denotes averaging over stars with coordinates and , satisfying the constraints specified in the corresponding formulas for . The values , , are the coordinates of the cluster center in the coordinate system.
In Fig. 2 the center of the cluster and the observer are located at the points and , respectively; is the length of the arc of a circle centered at point and radius , the triangle is right-angled with a right angle at the vertex , the line lies in the sky plane. Let us estimate the value . According to Fig. 2, , , where is the angle in radians. Therefore, , .
Let pc. Then with – the value – pc, – pc, –, and with , we find that pc, pc, . Thus, for the Pleiades cluster, the values and are sufficiently small for the values of considered in our work and the use of the sky plane approximation for estimation of the structural and dynamic parameters of the cluster seems quite acceptable.
3 STAR COUNTING IN THE PLEIADES
Two different approaches are possible when studying star clusters on the base of the Gaia space mission data (Gaia Collaboration et al., 2018, 2016). The first is to select stars that have a high accuracy in determining parallaxes and proper motions. In this case, the calculated data quality criteria (filters) published in the Gaia DR2 catalog are used. This approach makes it possible to study the structural features of clusters (for example, tidal tails), the internal kinematics and dynamics of clusters, and determine such characteristics of clusters as age, distance, and color excess. Unfortunately, this approach loses a significant part of the cluster members, which have large errors in determining the parameters. This approach will always give an undersampling of the cluster members.
The second approach consists of statistical study of the clusters. It uses the Gaia DR2 catalog as a complete survey of the whole sky (it can be considered complete up to the magnitude ). In this case, careful selection of the likely cluster members is not required. The only purpose of restrictions on the parameters of stars with this approach is to reduce the sample size and to reduce the fluctuations introduced by the field stars into the statistically determined distribution functions. The necessary condition is that the imposed constraints should not discard members of the cluster. The obtained samples, containing field stars and almost all members of the cluster, are processed by statistical methods; as a result, we have a density profile, surface density maps, a luminosity function, and a mass function. Both of these approaches were used in the study of the open cluster Ruprecht 147 (Yeh et al., 2019).
To perform star counts in the Pleiades cluster within the framework of the second approach, from the Gaia DR2 catalog (Gaia Collaboration et al., 2018, 2016), we selected data on 47195 stars, the parameters of which satisfied the following restrictions. The coordinates of the stars are: right ascension and declination . Trigonometric parallaxes milliarcseconds (hereinafter mas), proper motion in right ascension milliseconds of arc per year (hereinafter mas year-1), proper motion in declination mas year-1. No Gaia quality filters were used.
Selection by coordinates and parallaxes gave us a region of space, which is a fragment of a spherical layer with dimensions of approximately parsec, in the center of which the Pleiades cluster is located. The selection by proper motions corresponds to the scatter of stellar velocities in the sky plane approximately 7 km/s relative to the average velocity of the cluster. It can be concluded that our sample includes all the stars of the Pleiades cluster up to the limiting magnitude , with the possible exception of distant parts of its tidal tails and stars with very erroneous parallax and proper motion.
How strongly can the parameters of stars differ from the average values for a cluster due to errors of Gaia DR2? This can be estimated, for example, by the brightest stars in the Pleiades. According to parallaxes, the difference reaches approximately 2.2 mas, according to proper motions—about 5.3 mas year-1. The half-width of the intervals for parallaxes and proper motions used by us to obtain the sample is much larger than these values. It can be concluded that our sample contains all the Pleiades stars up to even taking into account possible crude errors in the parameters of the stars.
The number of stars in the Pleiades decreases sharply at (this corresponds approximately to the mass of the star ). A few cluster stars are visible up to magnitudes of , fainter stars are practically absent. This is clearly seen in the diagrams “–”, “–” and “–”.
First, we specified the position of the cluster center for the resulting sample. In this case, the “kernel density estimator” (KDE) method was used in a one-dimensional version, applied separately to the equatorial coordinates of the stars in the sample. In fact, this method is similar to the classical Plummer method (counting stars in parallel stripes).
With kernel halfwidth for stars with the coordinates and were obtained for the cluster center, which is different from the values from the database WEBDA111https://webda.physics.muni.cz/ ( and ). Note that the position of the center depends on the limiting magnitude of the stars and can vary by tens of arc minutes (this is clearly seen in Fig. 3, which shows the surface density maps of the central part of the cluster core for stars of various limiting brightness). In our case, it makes sense to refine the center to build a radial density profile (to avoid a decrease in density in the center of the cluster).
The obtained coordinates of the cluster center were used to pass to the tangential coordinate system and , having a pole at the point (Hiltner, 1962, Chapter 20, Section 4.2). Tangential coordinates are used to obtain distribution functions of stars, from density profiles to luminosity functions (Seleznev, 1998; Carraro and Seleznev, 2012; Carraro et al., 2016; Seleznev, 2016b; Carraro et al., 2017).
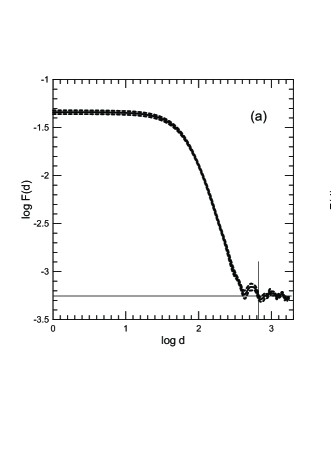
Fig. 3 shows the surface density maps for the central part of the cluster core, the region (). Fig. 3a corresponds to the distribution of stars with magnitude , Fig. 3b also includes fainter stars up to magnitude . It can be seen that when passing to brighter stars, the center of the cluster changes its position by about in and . The density inhomogeneities in these maps are solely due to the cluster stars, as the lowest density gradation in these maps is 0.002 stars per square arc minute, and the average background star density for our sample is 0.000562 stars per square arc minute (see below). Note the complex irregular structure of the cluster core (Fig. 3), which is more complicated for the subsystem of brighter stars with , which indicates large deviations of the cluster core from equilibrium in regular field.
Fig. 4 shows surface density maps for the vicinity of the Pleiades cluster. Fig. 4a shows the region ; the density step is chosen in such a way that the areas external to the cluster appear better and the cluster’s corona becomes noticeable. This map was built using the KDE 2D method (Seleznev, 2016a) with the parameter . The density fluctuations on this map are mainly due to the field stars. Fig. 4b shows the region , this is the cluster core and the inner part of its corona. When constructing this map, the parameter was used. It can be seen that the corona of the cluster is elongated approximately from southeast to northwest at an angle close to 45. When passing to denser parts of the corona (Fig. 4b), the general direction of elongation is preserved, but the angle becomes somewhat steeper, closer to 60. The direction of elongation is in good agreement with the average direction of motion of the cluster, which is shown by the arrow (Lodieu et al., 2019). The density level gradation on this map is chosen to show the contribution of the cluster stars and weaken the influence of the field stars.
To determine the average density of the number of field stars and the radius of the cluster, the surface density profiles were constructed following the technique described in Seleznev (2016b). Fig. 5 shows surface density profiles obtained with the parameter . The choice of the value of was also made by the method described in Seleznev (2016b). In Fig. 5a the density profile of the cluster is given in the axes “decimal logarithm of distance from the center—decimal logarithm of density”. Fig. 5b illustrates the determination of the cluster radius and the average density of the number of background stars: pc) and stars per square arc minute, respectively. Only the region near the cluster boundary is shown. The thick solid line is the density profile, and the thick dashed lines are the confidence interval. The thin dashed line shows the density profile plotted at . It demonstrates the correctness of the choice of the parameter , since the density profile at this value of the parameter follows the average trend of the profile plotted at a much lower half-width. In this case, a change in the parameter does not lead to a noticeable change in the estimate of the cluster radius (the line corresponding to the profile with intersects the line of average background density at a distance from the cluster radius that is less than the error in determining the radius). We also estimated the radius of the cluster core as the outer radius of the zone of the maximum in absolute value gradient of the surface density profile: pc).
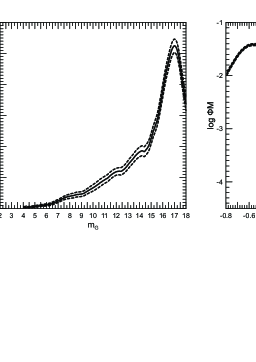
After that, the luminosity function (LF) of the cluster was obtained by the statistical method described in Seleznev (1998, 2016a); Seleznev et al. (2017). A ring with an inner radius of and an area equal to the area of a circle with a radius of was taken as the comparison area. The one-dimensional KDE method with the half-width parameter was used. Luminosity functions for the cluster core and corona were obtained in a similar way. The cluster luminosity function is shown in Fig. 6a.
We used the luminosity function and the mass-luminosity ratio from the isochrone tables (Marigo et al., 2017) to determine the mass function (MF) according to the method described in Seleznev et al. (2017). The MF was obtained for a unit mass interval of a star and per unit volume. The MF for the cluster on a logarithmic scale is shown in Fig. 6b. Fig. 6 shows the mass functions for the cluster core and corona, normalized to unity. It is seen that the relative abundance of stars with in the corona is lower in comparison with the cluster core. In turn, the relative abundance of stars with in the cluster’s corona is higher than in its core.
Integration of the mass function gives the number of stars in the cluster and its mass . For the cluster core , . The mass–luminosity dependence by Marigo et al. (2017) can be used only for stars with magnitudes , therefore, for the 6 brightest stars in the Pleiades, the mass estimate was obtained through average mass of the star , also determined from the isochron tables (Marigo et al., 2017). The obtained estimate of the number of stars in the cluster can be considered as the total number of Pleiades stars within the radius of the cluster corona up to the limiting value . Incompleteness can only be associated with the incompleteness of the Gaia data or with large errors in the parameters of the stars, as a result of which the star could not be included in our sample.
We estimated the slope of the MF. For stars with mass it turned out to be equal to 0.03, for stars with mass —. In the region of bright stars, the slope is much greater than that of the initial Salpeter MF (), but, nevertheless, both values are quite consistent with the initial mass function of Kroupa (2001). It should be noted that a large slope of the Pleiades MF for bright stars was also obtained earlier: (Taff, 1974) and (van Leeuwen, 1980).
To study the three-dimensional structure and kinematics of the Pleiades cluster, on the basis of an initial sample of 47 195 stars, a sample of stars of probable cluster members was selected. The procedure was as follows. We narrowed the intervals for parallaxes and proper motions, controlling the appearance of the color–magnitude diagram (CMD). At the same time, as few stars of the field should remain on the CMD as possible, while retaining the largest possible number of cluster stars (that is, stars on the general sequences on the diagram). The following restrictions were finally adopted on the values of trigonometric parallaxes and the components of proper motion of stars: mas, proper motion in right ascension mas year-1, proper motion in declination mas year-1. The width of the intervals was chosen in such a way that the six brightest stars of the Pleiades got there, the parallaxes and components of proper motion of which significantly differ from the average values (see above). The stars were selected within a circle with a radius at . In addition, some stars were excluded from the sample based on their positions on the CMD below the main sequence of the cluster. The resulting sample contains 1391 stars. This number is less than the statistical estimate of the total number of stars in the Pleiades (see above). Probably, due to large errors, some of the stars—cluster members have parallaxes and proper motions outside the indicated intervals.
In order to estimate the cluster membership probability of the selected stars, the same selection criteria were applied to the entire original sample of stars. As a result, 1965 stars were selected. This means that there are stars outside the cluster’s circle. An area of the figure, bounded by the initial values of the equatorial coordinates, was determined by the Monte Carlo method with uniformly throwing points on the sphere (we were throwing one million points) and turned out to be equal to 0.47152 steradians. The area occupied by the cluster was defined as the surface area of a sphere segment, equal to 0.11336 steradians. Thus, the stars outside the cluster circle are located on an area of 0.35816 steradians, which gives an average density of field stars equal to 1602.64 stars per steradian. Now we can estimate the number of field stars inside the circle of the cluster with the used selection criteria, it is equal to 182. Our estimate of the cluster membership probability for stars selected within the circle of the cluster is: .
Thus, our sample of likely cluster members contains approximately % of field stars. On the other hand, this sample did not include approximately % of the 1542 members of the cluster (see above). The relative abundance of the field stars changes with distance from the center of the cluster. In the core, it is much less than in the corona. It is interesting to compare our sample with the sample of Lodieu et al. (2019), also obtained from Gaia DR2 data. This sample contains 1412 stars within a circle of radius at . Analysis of the samples showed that they contain 1243 common stars. Consequently, the samples coincide by approximately %. The difference is mainly caused by different selection criteria and different values of the coordinates of the cluster center. Nevertheless, our sample can be considered as substantially complete (% of “lost stars”) and substantially “clean” (% of field stars). Further, we will use subsamples from this sample, selecting stars in a smaller volume of space and with more accurate determinations of velocities and distances to stars in accordance with the first approach (see above). This will always lead to a reduction in the absolute and relative number of field stars.
4 DATA ON STARS—PROBABLE MEMBERS OF THE OSC PLEIADES
In order to study the cluster kinematics, we selected the subsamples from the sample containing 1391 stars in the vicinity of the Pleiades cluster and described in the previous section. Firstly, we selected members of the cluster (with magnitudes at distances from the center of the cluster). In this sample, the errors of velocities do not exceed 2.36 km s-1, which for the Pleiades cluster corresponds to 3.65 mas year-1. Secondly, we selected stars with errors km s-1 from the sample. These turned out to be stars with and errors pc in the distances . Average errors are pc in the sample stars and pc in the sample stars. In the sample member stars of the cluster, according to Gaia DR2 data, we have selected 74 stars with radial velocities , the errors of which are km s-1. Average radial velocity of the stars in the cluster core for these 74 objects is km s-1; after the correction of for the effect of the transverse motion of the cluster turned out to be km s-1.
Thirdly, from the sample of 1391 member stars of the cluster with magnitudes at distances from the cluster center, for which km s-1 and pc, we selected stars with , km s-1, pc, pc. In the sample member stars of the cluster, according to Gaia DR2 data, we have selected 97 stars with radial velocities, the errors of which are km s-1. Average radial velocity of cluster stars for these 97 objects = km s-1; after correcting for the effect of transverse motion of the cluster— km s-1. Thus, the correction of for the effect of the transverse motion of the cluster changes the value of only within the error, which is due to the symmetry of the cluster and the corrections of the radial velocities of the stars about the axis perpendicular to the direction of motion of the cluster in projection onto the sky plane, see Fig. 1 (74 stars from with km s-1 are located in the sky plane more symmetrically about the axis than 97 stars from ). The values km s-1 and km s-1. The indices of the star samples and used in the calculation of and are indicated in brackets. Probably, the field stars in the considered samples only insignificantly affect the estimates of the values and because field star contamination in the and samples are less than 1% and less than 8%, respectively (see below).
The equality of the values and indicates the symmetry in the arrangement of the stars under consideration relative to the axis and the relative motion along the line of sight of the selected groups of stars in the samples and with the velocity . Since in our case km s-1, it seems reasonable to consider the relative radial velocity of these two groups of stars to be equal: km s-1 (the cluster core is moving away from the Sun faster than the cluster corona). The average radial velocity of the entire cluster is km s-1. In the work of Lodieu et al. (2019), this value for practically complete sample of stars-members of the Pleiades cluster is obtained equal to km s-1. Probably, the large error of in Lodieu et al. (2019) is caused by large errors in the radial velocities of the stars under consideration (since the sample is complete) and the neglect of the contribution to of the transverse motion of the cluster in the sky plane. Note that the gravitational potential and the equations of motion of stars in the OSC are nonlinear, and the dynamic evolution of the OSC is determined by various types of instabilities. Therefore, the use of the most accurate data on the coordinates and velocities of stars is the only possible way to obtain correct results on the dynamic mechanisms operating in the OSC (for example, inaccuracies in determining the parameters of just one dynamically active pair of stars in the OSC can affect the predicted evolution of the entire cluster, consisting of several hundred stars; instead of the cluster expansion, one can get a forecast of its contraction (Danilov, 1977)).
The 97 stars with km s-1 considered here from the sample are located in the sky plane at distances from the cluster center.
We accepted the estimate of the distance to the cluster pc (see above), the distance modulus (Loktin and Popova, 2017), complete absorption (Loktin and Popova, 2017). The relationship between and the total absorption in the band was taken from http://stev.oapd.inaf.it/cgi-bin/cmd_3.3, where it was defined on basis of the work of Cardelli et al. (1989). In this case, the average masses of stars in the considered samples were obtained equal to , , , which corresponds to the total masses of the selected stars , , , respectively. The quantities and ) were used to calculate the cluster parameters included in formula (3) and in the coefficients of equation (4).
When studying the stars of the sample , we noticed a linear dependence /pc, where the distance of a star from the center of the cluster is pc, which indicates the segregation of the most massive stars in the Pleiades by in three-dimensional space and the decrease in the masses of such stars with distance from the center of the cluster (the sample contamination with field stars is less than 1%, see below).
5 ESTIMATES OF THE ROTATION PARAMETERS OF THE OSC PLEIADES
Let and be the axes of the tangential coordinate system centered at the center of the cluster (Hiltner, 1962). The projections of the velocity vectors of the stars in the Pleiades cluster core onto the plane are obtained from the data on the coordinates and the proper motions of stars of the sample (see Section 4); the radius of the area occupied by sample stars relative to the center of the cluster on the celestial sphere is ; calculations of , similar to those performed in Section 3, for a sample of Pleiades stars with result in probability . Thus, the sample considered here is practically not contaminated with field stars. The total number of cluster stars in an area with a radius of according to the method from Section 3 is obtained equal to 958, the completeness of the sample is ; for the sample —; in the case of the sample , the value , the number of member stars of the cluster in this sample () is 1347, therefore .
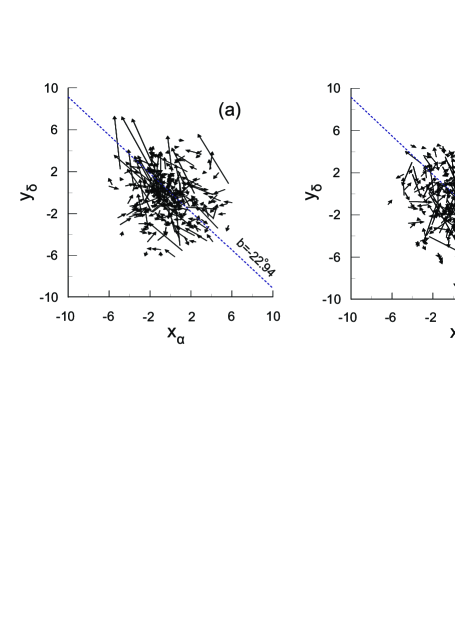
The average motion of stars with and in Fig. 7 is directed on the plane in opposite directions, the rotation of the core of the Pleiades cluster is “prograde” (directed in the same direction as the rotation of the Galaxy). Passing to the coordinate system (see explanations before formula (6)), we calculate the values , and find for the cluster core km s-1, km s-1 and the value km s-1 at the average distance pc from the cluster center in the sky plane (when determining the sign of the values and , we used data on the motion of stars in the cluster core relative to the axis in the plane and screw-gimlet rule, see Landau and Lifshitz (1991) p. 31). The angle between the positive direction of the axis and the projection of the axis of rotation of the cluster core onto the plane is equal to . The value can be called the equatorial rotation velocity of the cluster core (the corresponding vector is located in a plane perpendicular to the rotation axis of the cluster core; this can be verified by rotating the axes , by an angle relative to the axis, leading to a system of axes , , , in which the vector is parallel to the axis (or antiparallel to it, see Fig. 7a,b), and the next rotation of the , axes by the angle relative to the axis results in the coordinate system , , , in which the plane is equatorial).
According to formula (6), the angle of inclination of the axis of rotation of the core of the Pleiades OSC to the sky plane is . Used in (6) to estimate , the values km s-1, km s-1 have been obtained from the data on the radial velocities (corrected for the motion of the OSC in the sky plane) with errors km s-1 for 74 stars from the sample . Note that the average for these stars is pc (see above). The cluster core in the sky plane has a shape close to spherical one (Fig. 7). Therefore, in formula (6), we replaced the angular velocities of the stars by circular ones. In this case km s-1 and km s-1.
Linear regression dependencies on and of the radial velocities of stars , corrected for the motion of the OSC core in the sky plane, for pc lead to the values km s-1 and km s-1, respectively. Then the equatorial velocity is km s-1. Thus, at distances from the center of the cluster of the order of pc, the core rotation velocity is close to zero (some of the core stars participate in the “prograde”, and some—in the “retrograde” motion about the axis of rotation). Similar calculations for 97 stars with km s-1 from the sample of the cluster lead to the velocity of the “retrograde” rotation of the cluster km s-1 at the distance pc from its center. The angle between the projection of the cluster’s rotation axis onto the sky plane and the direction of increasing galactic latitude is . Thus, with an increase in the distance from the center of the Pleiades cluster for pc, the rotation of the cluster becomes “retrograde”, which indicates the possible stability of the trajectories of motion of some stars on the cluster periphery in the joint field of forces of the cluster and the Galaxy. Note that in the halo of OSC models (Danilov and Dorogavtseva, 2008), see Fig. 1 from Danilov and Dorogavtseva (2008), the “retrograde” motions of the cluster stars also dominate.
6 ESTIMATES OF THE VELOCITY DISPERSIONS OF STARS IN THE PLEIADES
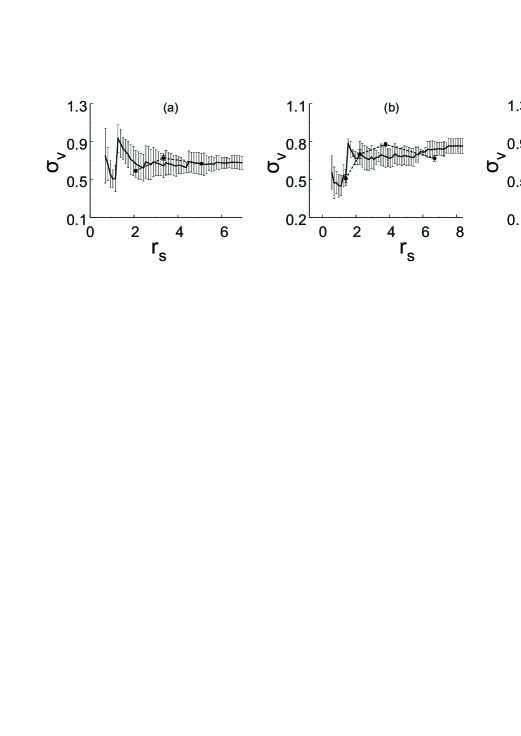
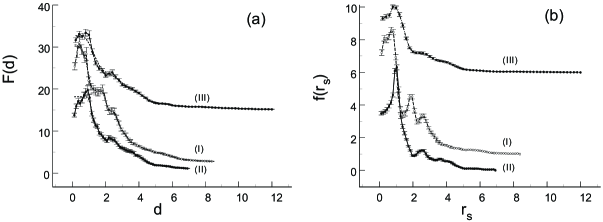
When constructing the dependences of the root-mean-square velocities (Fig. 8), the values pc, 8.4 pc, 12.0 pc were used (see Section 2 and data on the parameters of stars in the samples , , , respectively). The condition of gravitational instability in the cluster is satisfied in the regions with pc in Fig. 8a and pc in Fig. 8. In these ranges of , approximately % of the stars in the sample (the brightest and most massive stars of the cluster), approximately % of the stars in the sample , and about of the stars in the sample are contained. Near the center of the cluster, the values of change noticeably with increasing , and it is impossible to obtain data on the gravitational instability due to the highly irregular structure of the cluster, large deviations of the cluster from the equilibrium state, and large errors in the velocities of the stars in this region. At pc, the core of the Pleiades cluster by the time of observation is formed from approximately spherical layers with a common center and different values of of stars in the layers adjacent to . It is possible that a wave process of transfer of kinetic energy of stellar motions in the radial direction takes place in the cluster. In OSC models (Danilov, 2011) such a process could not be noticed, since in this article Danilov, 2011, Fig. 1b,c, Tables 1b,c only the average values of over the oscillation period of the regular field of the cluster were considered. The wave process of the transfer of the kinetic energy of stars in the radial direction in a non-stationary cluster is described in more detail in Danilov and Ryazanov (1985) within the framework of the collisionless “water bag” model using numerical integration of the Vlasov system of equations for an isolated spherically symmetric cluster of stars.
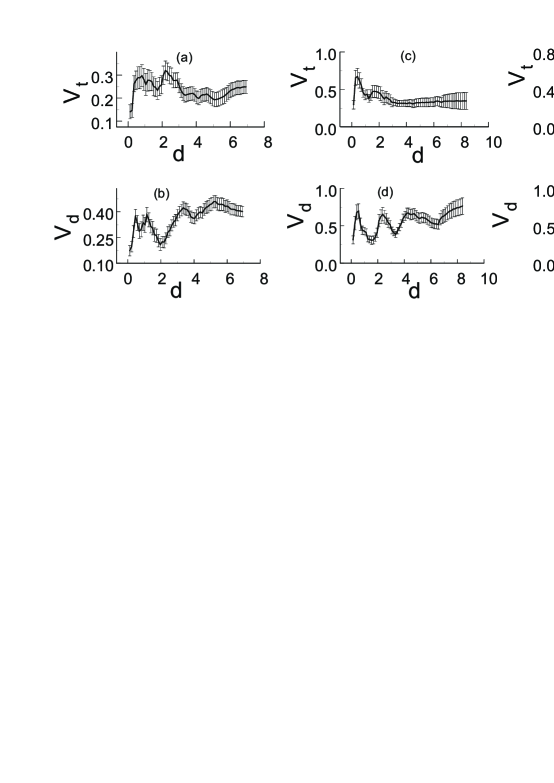
According to Fig. 8, for pc the values of in the considered samples of stars, on average, increase with increasing , which indicates the nonstationarity of the cluster in the field of regular forces. The dependences of the modules and on in Fig. 9 contain a number of periodic oscillations that go beyond the errors of and by an amplitude, which also indicates the nonstationarity of the cluster in the field of regular forces.
In the process of evolution of non-isolated and nonstationary (in a regular field) models in a regular field of OSCs at –, entropy is produced not in the core, but on the cluster periphery (see Fig. 1 from Danilov and Putkov (2017)) due to numerous weak stellar encounters. In the cores of nonstationary OSCs, evolution is determined by the interactions of stars with an alternating force field of the cluster, the action of gravitational instability, which leads to an increase in the correlation of stellar motions (Danilov and Putkov, 2017). Stars with the highest energies that have received additional energy during violent relaxation in the core enter the periphery of the cluster, where, under the influence of approaches with stars of a rather densely populated halo, they acquire additional angular momentum and lose the opportunity to return to the cluster core (in contrast to quasi-stationary and isolated systems close to virial equilibrium, in which entropy is produced mainly due to close stellar encounters in the cluster core). As a result, stars with the highest energies leave the core, which leads to the cooling of the core of the nonstationary cluster.
According to Fig. 10, the brightest and most massive cluster stars from the samples and near the cluster center are distributed most unevenly, the centers of their distributions do not coincide, local maxima of the apparent density in the sky plane around the cluster center are achieved near some closed curves, which indicates a deviation from the equilibrium state and nonstationarity of the cluster in the field of regular forces. Equatorial coordinates of the center of distribution of stars in the sample : , , for stars of the sample : , , for stars of the sample : , , respectively (when determining the values of , , we used the method described in Section 3 of this article). Note that the difference in the coordinates of the center of distribution of stars by in the case of the Pleiades corresponds to a distance of about pc from the center of the cluster in the sky plane. The depression of the density in the center of the M 37 cluster, which is very close in appearance to that shown in Fig. 10b for the sample , was noted in the book of Kholopov (1981, p. 317).
| km s-1 | pc | pc | pc2 | pc | pc | ||
|---|---|---|---|---|---|---|---|
| (1) | (2) | (3) | (4) | (5) | (6) | (7) | (8) |
Density waves in Fig. 10, which exceed by an oscillation amplitude the error limits of the values and , also indicate the nonstationarity of the Pleiades cluster in the field of regular forces.
The radial distributions of the spatial density of the number of stars and the mass in the Pleiades were used here to find the values , , and by formula (2) for a range of values in the vicinity of the cluster core boundary (see intervals of values of for dashed lines in Fig. 8). We believe that more accurate , obtained using the coordinates of stars in the plane and the assumption of spherical symmetry of the cluster, are more preferable than the values , which are obtained from the data on the three spatial coordinates of the stars, since the errors in distances to stars are comparable to the scale of inhomogeneities in and in and , respectively, see Section 4 and Fig. 10, and when estimating the dynamic state of the OSC, the force fields arising in the core between stars and groups of stars are important (see local maxima of the apparent density near the center of the cluster in Fig. 4).
For the Pleiades cluster, the estimates of the structural and dynamic parameters were acquired according to data obtained from the considered samples of stars. These parameters are listed in Table 1. The methodology from works of Danilov and Loktin (2015); Danilov (2010), briefly described in Section 2 of our article, and formulas (3) and (5) have been used. The value have been obtained from the estimate of the dynamic mass of the cluster for the OSC in a circular orbit in the field of forces of the Galaxy according to formula (11.13) from King (1994); the distance of the Pleiades from the center of the Galaxy is obtained equal to pc, the distance of the Sun from the center of the Galaxy is taken equal to pc (Danilov and Loktin, 2015; Kerr and Lynden-Bell, 1986), the error in calculating is taken equal to (Danilov and Loktin, 2015), the values of and were determined according to the model of the Galaxy potential (Kutuzov and Osipkov, 1980).
Note that with an increase in the limiting values of from to and the radius of the investigated region , the sample of stars includes larger number of stars of the cluster corona, therefore its dynamic mass increases (probably, the values indicated in Table 1 can be considered as lower estimates of the mass of the cluster and its corona). For , according to the data obtained in Section 3 of this article, for by formula (11.13) from King (1994), we find: pc. In the works of Adams et al. (2001); Raboud and Mermilliod (1998); Kharchenko et al. (2013), and Lodieu et al. (2019) for the Pleiades, the following estimates for had obtained: 13.1 pc, 16 pc, pc and 11.6 pc, respectively. Note that the estimates of the value of in the papers of Raboud and Mermilliod (1998); Kharchenko et al. (2013); Lodieu et al. (2019) are based on the approximation by of the radial profile of the cluster surface density by the King’s formula. Our estimate of is obtained using the cluster mass function. Determining the values of by different methods may well give slightly different results.
In Danilov et al. (2014), corona models were constructed for six numerical dynamic models of OSCs. According to this work, the retrograde stellar motions predominate in the coronas; in the interval of distances from the center of the cluster model , the formation of the density and phase density distributions close to equilibrium is noted. The temporal equilibrium of the coronas is due to the balance of the number of stars entering the corona from the central regions of the cluster and leaving to the periphery of the corona or beyond. According to Danilov et al., 2014, Table 3, by the time years the coronas of the OSC models contain – of the total number of stars in the cluster. Up to the distances from the center of the cluster model, the presence of close to periodic retrograde average motions of a large number of corona stars is noted, and at the lifetime intervals of the cluster (91–99)% of corona stars satisfy the criterion of gravitational coupling (Ross et al., 1997). The radius ( pc) and the mass of the Pleiades cluster, which exceed its tidal radius and dynamic mass, obtained as a result of star counts in Section 3 of this article, are quite consistent with numerical data on the parameters of the coronas of the OSC models (Danilov et al., 2014).
7 CONCLUSIONS
1. In this paper we evaluate a number of structural, kinematic and dynamic parameters of the Pleiades OSC. According to Gaia DR2 data on stars with magnitudes in the sky region with the center in the center of the cluster, a density, density profile, luminosity and mass functions of the cluster were constructed. We obtained: radius of the cluster , radius of its core , number and mass of stars in the cluster and , number and mass of stars in the cluster core and . These parameters characterize the general structure of the Pleiades cluster and its corona. A complex irregular structure of the cluster core is noted (see Fig. 4), which is more complex for the subsystem of brighter stars with , which indicates large deviations of the cluster core from equilibrium in the regular field.
2. We mark an additional indication of the non-stationarity of the Pleiades cluster in the regular field. There are the radial waves of the apparent and spatial density of the number of stars noted in Fig. 10, as well as waves on the dependences on the distance to the cluster center of tangential and radial components of the velocity field of the cluster core stars in the sky plane, marked in Fig. 9.
3. Dispersions of the velocities of the stars in the cluster core increase on average with an increase in the distance from its center (see Fig. 9), which is also a kinematic sign of nonstationarity of the cluster in the regular field (Danilov, 2011; Danilov and Putkov, 2017). The region of gravitational instability in the Pleiades cluster is located at distances – pc from its center and contains –% of the total number of stars in the considered samples of cluster objects. It is impossible to obtain data on gravitational instability near the center because of the highly irregular structure of the cluster, large deviations from the equilibrium state, and large errors in the velocities of the stars.
4. We obtained the estimates of the dynamic mass – and tidal radius – pc of the Pleiades cluster for different , , . When increasing the limiting magnitudes and the radius of the region under study, the sample of stars includes more and more stars of the cluster’s corona; therefore, the cluster dynamic mass increases. Thus, the radius and mass of the Pleiades cluster, obtained as a result of star counts in Section 3, exceeding its tidal radius and dynamic mass, are in good agreement with the numerical data on the parameters of the coronas of the OSC models (Danilov et al., 2014).
5. The average rotation velocity of the cluster core km s-1 at distances pc from its center was determined by the data on stars with . The rotation is “prograde”, the angle between the projection of the axis of rotation of the cluster core onto the sky plane and the direction of growth of the galactic latitude b is , the angle between the axis of rotation of the cluster core and the sky plane is . The rotation velocity of the cluster core at a distance of pc from its center is close to zero: km s-1. According to data on stars with , the velocity of the “retrograde” rotation of the cluster at a distance of pc from its center km s-1, the angle . The obtained estimates of the rotation parameters of the Pleiades cluster can be used in the numerical simulation of the dynamics of OSCs. The obtained velocities and directions of rotation of the core and outer regions of the Pleiades cluster are in good agreement with the data on the rotation of the OSC models (Danilov and Dorogavtseva, 2008; Danilov et al., 2014).
FUNDING
This work was supported by the Ministry of Science and Higher Education, FEUZ–2020–0030. This work was supported in part by the Act no. 211 of the Government of the Russian Federation, agreement no. 02.A03.21.0006.
CONFLICT OF INTEREST
The authors declare no conflicts of interest.
References
- Aarseth (1974) S. J. Aarseth, A&A35 (2), 237 (1974).
- Adams et al. (2001) J. D. Adams, J. R. Stauffer, D. G. Monet, et al., AJ121 (4), 2053 (2001).
- Adams et al. (2002) J. D. Adams, J. R. Stauffer, M. F. Skrutskie, et al., AJ124 (3), 1570 (2002).
- Cardelli et al. (1989) J. A. Cardelli, G. C. Clayton, and J. S. Mathis, ApJ345, 245 (1989).
- Carraro et al. (2017) G. Carraro, G. Baume, A. F. Seleznev, and E. Costa, Ap&SS362 (7), 128 (2017).
- Carraro and Seleznev (2012) G. Carraro and A. F. Seleznev, MNRAS419 (4), 3608 (2012).
- Carraro et al. (2016) G. Carraro, A. F. Seleznev, G. Baume, and D. G. Turner, MNRAS455 (4), 4031 (2016).
- Chandrasekhar (1942) S. Chandrasekhar, Principles of stellar dynamics (University of Chicago Press, Chicago, 1942).
- Cleveland and Devlin (1988) W. S. Cleveland and S. J. Devlin, Journal of the American Statistical Association 83 (403), 596 (1988).
- Danilov (1977) V. M. Danilov, Astrofizika 13, 685 (1977).
- Danilov (2008) V. M. Danilov, Astronomy Reports 52 (11), 888 (2008).
- Danilov (2010) V. M. Danilov, Astronomy Reports 54 (6), 514 (2010).
- Danilov (2011) V. M. Danilov, Astronomy Reports 55 (6), 473 (2011).
- Danilov and Dorogavtseva (2003) V. M. Danilov and L. V. Dorogavtseva, Astronomy Reports 47 (6), 483 (2003).
- Danilov and Dorogavtseva (2008) V. M. Danilov and L. V. Dorogavtseva, Astronomy Reports 52 (6), 467 (2008).
- Danilov and Loktin (2015) V. M. Danilov and A. V. Loktin, Astrophysical Bulletin 70 (4), 414 (2015).
- Danilov and Putkov (2012) V. M. Danilov and S. I. Putkov, Astronomy Reports 56 (8), 623 (2012).
- Danilov and Putkov (2017) V. M. Danilov and S. I. Putkov, Astrophysical Bulletin 72 (3), 266 (2017).
- Danilov et al. (2014) V. M. Danilov, S. I. Putkov, and A. F. Seleznev, Astronomy Reports 58 (12), 906 (2014).
- Danilov and Ryazanov (1985) V. M. Danilov and A. P. Ryazanov, in Astronomical-Geodetical Investigations, pp. 19–47 (1985).
- Gaia Collaboration et al. (2018) Gaia Collaboration, A. G. A. Brown, A. Vallenari, et al., A&A616, A1 (2018).
- Gaia Collaboration et al. (2016) Gaia Collaboration, T. Prusti, J. H. J. de Bruijne, et al., A&A595, A1 (2016).
- Hiltner (1962) W. A. Hiltner, Astronomical techniques, vol. 2 (University of Chicago Press, Chicago, 1962).
- Kerr and Lynden-Bell (1986) F. J. Kerr and D. Lynden-Bell, MNRAS221, 1023 (1986).
- Kharchenko et al. (2013) N. V. Kharchenko, A. E. Piskunov, E. Schilbach, et al., A&A558, A53 (2013).
- Kholopov (1981) P. N. Kholopov, Stellar Clusters (Nauka, Moscow, 1981).
- King (1994) I. R. King, An Introduction to Classical Stellar Dynamics (University of California, Berkeley, 1994).
- Korn and Korn (1968) G. A. Korn and T. M. Korn, Mathematical handbook for scientists and engineers. Definitions, theorems, and formulas for reference and review (McGraw-Hill, New York, 1968).
- Kroupa (2001) P. Kroupa, MNRAS322 (2), 231 (2001).
- Kutuzov and Osipkov (1980) S. A. Kutuzov and L. P. Osipkov, Soviet Ast.24, 17 (1980).
- Landau and Lifshitz (1991) L. D. Landau and E. M. Lifshitz, Mechanics (FIZMATLIT, Moscow, 2004), 5-th edition.
- Lodieu et al. (2019) N. Lodieu, A. Pérez-Garrido, R. L. Smart, and R. Silvotti, A&A628, A66 (2019).
- Loktin and Popova (2017) A. V. Loktin and M. E. Popova, Astrophysical Bulletin 72 (3), 257 (2017).
- Makarov (2006) V. V. Makarov, AJ131 (6), 2967 (2006).
- Marigo et al. (2017) P. Marigo, L. Girardi, A. Bressan, et al., ApJ835 (1), 77 (2017).
- Raboud and Mermilliod (1998) D. Raboud and J. C. Mermilliod, A&A329, 101 (1998).
- Ross et al. (1997) D. J. Ross, A. Mennim, and D. C. Heggie, MNRAS284 (4), 811 (1997).
- Sagar and Bhatt (1989) R. Sagar and H. C. Bhatt, MNRAS236, 865 (1989).
- Seleznev (1998) A. F. Seleznev, Astronomy Reports 42 (2), 153 (1998).
- Seleznev (2016a) A. F. Seleznev, Baltic Astronomy 25, 267 (2016a).
- Seleznev (2016b) A. F. Seleznev, MNRAS456 (4), 3757 (2016b).
- Seleznev et al. (2017) A. F. Seleznev, G. Carraro, R. Capuzzo-Dolcetta, et al., MNRAS467 (3), 2517 (2017).
- Sobol’ (1985) I. M. Sobol’, Monte Carlo method, 46 (Nauka, Moscow, 1985).
- Taff (1974) L. G. Taff, AJ79, 1280 (1974).
- van Leeuwen (1980) F. van Leeuwen, Proc. IAU Symposium, 85, 157 (1980).
- Vereshchagin et al. (2013) S. V. Vereshchagin, V. G. Reva, and N. V. Chupina, Astronomy Reports 57 (1), 52 (2013).
- Yeh et al. (2019) F. C. Yeh, G. Carraro, M. Montalto, and A. F. Seleznev, AJ157 (3), 115 (2019).