MERGHERS Pilot: MeerKAT discovery of diffuse emission in nine massive Sunyaev-Zel’dovich-selected galaxy clusters from ACT
Abstract
The MeerKAT Exploration of Relics, Giant Halos, and Extragalactic Radio Sources (MERGHERS) survey is a planned project to study a large statistical sample of galaxy clusters with the MeerKAT observatory. Here we present the results of a 16–hour pilot project, observed in response to the 2019 MeerKAT Shared Risk proposal call, to test the feasibility of using MeerKAT for a large cluster study using short (0.2–2.1 hour) integration times. The pilot focuses on 1.28 GHz observations of 13 massive, low-to-intermediate redshift () clusters from the Sunyaev-Zel’dovich-selected Atacama Cosmology Telescope (ACT) DR5 catalogue that show multiwavelength indications of dynamical disturbance. With a 70 per cent detection rate (9/13 clusters), this pilot study validates our proposed MERGHERS observing strategy and provides twelve detections of diffuse emission, eleven of them new, indicating the strength of MeerKAT for such types of studies. The detections (signal-to-noise ratio ) are summarised as follows: two systems host both relic(s) and a giant radio halo, five systems host radio halos, and two have candidate radio halos. Power values, -corrected to 1.4 GHz assuming a fiducial spectral index of , are consistent with known radio halo and relic scaling relations.
keywords:
galaxies: clusters: general – radio: continuum: general1 Introduction
In the last two decades, observations of diffuse, steep-spectrum, cluster-scale radio synchrotron emission have been used to study the physical link between the thermal and non-thermal components of the intracluster medium (ICM), constraining theories of cosmic-ray transport and magnetic field evolution within the ICM (see reviews by Brunetti & Jones, 2014; van Weeren et al., 2019). A strong link has been found to the dynamics of the host cluster, with the largest diffuse emission classes such as radio halos and relics found in massive, dynamically disturbed systems – radio halos are thought to originate from merger-driven turbulence within the ICM, and relics have been related to the presence of cluster merger shocks or revived radio galaxy plasma (see e.g., van Weeren et al., 2019, and references therein). The radio halo and relic luminosities correlate with the host cluster’s mass and thermal properties (Cassano et al., 2013; de Gasperin et al., 2014). However, cluster selection has been found to affect these relations: samples selected via their Sunyaev-Zel’dovich (SZ; Sunyaev & Zeldovich, 1972) signal show a higher diffuse emission detection rate than X-ray-selected samples (Basu, 2012; Sommer & Basu, 2014; Zandanel et al., 2014; Bonafede et al., 2015; Cuciti et al., 2015), which may be due to an X-ray selection bias towards relaxed, cool-core clusters (Andrade-Santos et al., 2017), or the different timescales of SZ versus X-ray signal boosting during mergers (Randall et al., 2002; Poole et al., 2007; Wik et al., 2008).
All statistical, uniformly-selected cluster samples used in radio halo studies have to date been restricted to high masses () and lower redshift ranges (; e.g., Venturi et al., 2007; Cuciti et al., 2015), with current turbulent re-acceleration formation theories predicting a sharp drop in the occurrence of radio halos at higher redshift, where cluster magnetic fields are expected to be weaker (Cassano et al., 2006; Brunetti & Jones, 2014). Diffuse emission has also been detected in some low-mass (e.g., Knowles et al., 2016b; Bernardi et al., 2016; Kale et al., 2017; Hlavacek-Larrondo et al., 2018; Brüggen et al., 2018; Hoang et al., 2020) and high-redshift ( Bonafede et al., 2009; Lindner et al., 2014; Pandey-Pommier et al., 2013; Riseley et al., 2017; Knowles et al., 2019; Giovannini et al., 2020) systems. Most of these detections result from single-target programmes or small samples. A study of a large statistical sample that covers these extended mass and redshift ranges has not been carried out. Most recently, LOFAR imaging of a declination-selected sample of nineteen , SZ-selected clusters revealed high-redshift diffuse emission with similar radio powers to those in lower redshift systems (Di Gennaro et al., 2020). This is an indication that our theories of the evolution of cosmic magnetic fields, and therefore of the production of diffuse emission, require further study.
The next step in advancing our understanding of diffuse emission processes and imposing stronger constraints on formation models is to perform statistical studies on cluster samples that expand discovery space. Due to their much improved sensitivity, such a study has become possible using the new generation of Square Kilometre Array (SKA) precursor telescopes such as MeerKAT, LOFAR (van Haarlem et al., 2013), and ASKAP (Johnston et al., 2007). MeerKAT is currently the most sensitive instrument of its kind in the Southern hemisphere. This 64-element interferometer located in the South African Karoo region, described in Jonas & MeerKAT Team (2016), Camilo et al. (2018), and Mauch et al. (2020), operates in the S (1750–3500 MHz), L (900–1670 MHz), and UHF (580–1015 MHz) bands. Its configuration makes it particularly well-suited to studies of diffuse cluster emission: its dense core, with 75 per cent of the antennas lying within a 1 km radius, provides superior brightness sensitivity to extended structures, while its outer ring antennas provide a maximum baseline of 8 km and therefore sufficient resolution to disentangle compact sources in all but the highest redshift targets.
Due to their redshift-independent selection functions, large area SZ surveys are a more efficient way to select massive clusters at any redshift compared to X-ray surveys with telescopes like ROSAT (Voges, 1993) or eROSITA (Cappelluti et al., 2011), and are therefore better suited to an expanded diffuse emission study. Large SZ cluster catalogues have been compiled by the Planck satellite (Planck Collaboration et al., 2014, 2016), and the ground-based Atacama Cosmology Telescope (ACT; Hasselfield et al., 2013; Hilton et al., 2018) and South Pole Telescope (Bleem et al., 2015, 2020). Unlike the ground based telescopes which have higher resolution, Planck misses clusters at low mass and at higher redshift due to beam dilution. ACT is undertaking its Advanced ACT (AdvACT; Henderson et al., 2016) survey of 18,000 deg2 of the Southern and Equatorial sky (Naess et al., 2020), with the first release of the cluster catalogue (ACT DR5111The ACT DR5 catalogue uses the 13,000 deg2 away from the Galactic plane to search for clusters.) containing more than 4000 optically-confirmed clusters (Hilton et al., 2021).
The MERGHERS (MeerKAT Exploration of Relics, Giant Halos, and Extragalactic Radio Sources; Knowles et al., 2016a) survey is a planned large-scale radio follow-up of ACT cluster targets that will be blind to the cluster dynamical state and use short integration times on MeerKAT. We present here the results of a pilot study of 13 ACT DR5 clusters, to test the feasibility of using MeerKAT for a large-scale cluster programme such as MERGHERS.
The paper is organised as follows. In Section 2 we introduce the sample and discuss the observations. The data processing methodology and imaging are described in Section 3. Results are presented in Section 4, with concluding remarks in Section 6. In this paper we adopt a CDM flat cosmology with km s-1 Mpc-1, , and .
2 Cluster sample and observing
| (1) | (2) | (3) | (4) | (6) | (7) | (9) | (10) | (11) | ||
|---|---|---|---|---|---|---|---|---|---|---|
| Name | RA J2000 | Dec. J2000 | z | Flagged | ||||||
| (ACT-CL…) | (deg) | (deg) | () | (min) | (%) | (Jy beam-1) | (″, ″, ∘) | (Jy beam-1) | (″) | |
| Epoch A - 61 antennas | ||||||||||
| J0013.34906 | 3.32748 | 49.11263 | 0.407 | 108 | 39.6 | 6.9, 5.9, 152.0 | 24 | 21 | ||
| J0019.60336† | 4.91085 | 3.60879 | 0.266 | 24 | 44.2 | 7.9, 7.2, 161.7 | 52 | 21 | ||
| J0034.40225† | 8.61022 | 2.42259 | 0.388 | 24 | 39.0 | 8.2, 6.7, 147.8 | 77 | 26 | ||
| J0040.84407† | 10.20664 | 44.13242 | 0.350 | 24 | 39.7 | 7.2, 6.1, 157.7 | 260a | 23 | ||
| J0046.43912 | 11.60191 | 39.20152 | 0.592 | 48 | 39.4 | 6.9, 5.9, 152.4 | 30 | 21 | ||
| Epoch B - 58 antennas | ||||||||||
| J0106.10618 | 16.54119 | 6.31591 | 0.641 | 108 | 49.3 | 7.4, 5.1, 165.4 | 25 | 23 | ||
| J0159.03413 | 29.75418 | 34.22213 | 0.413 | 24 | 48.6 | 6.7, 5.6, 163.6 | 35 | 21 | ||
| J0240.00115† | 40.01278 | 1.26642 | 0.603 | 132 | 50.6 | 7.7, 5.1, 164.9 | 27 | 23 | ||
| Epoch C - 58 antennas | ||||||||||
| J0245.55302 | 41.37543 | 53.03602 | 0.298 | 24 | 61.3 | 7.7, 5.1, 16.3 | 39 | 23 | ||
| J0248.10216 | 42.04673 | 2.27442 | 0.238 | 24 | 47.9 | 7.7, 5.4, 165.9 | 41 | 23 | ||
| J0248.20238† | 42.05431 | 2.63611 | 0.554 | 72 | 52.0 | 8.3, 5.2, 160.1 | 46 | 21 | ||
| J0528.83927 | 82.21643 | 39.46265 | 0.284 | 39 | 47.4 | 6.9, 5.0, 157.5 | 37 | 21 | ||
| J0638.75358 | 99.69631 | 53.97338 | 0.226 | 24 | 50.0 | 7.8, 5.4, 146.5 | 48 | 23 | ||
Notes: † Cluster field required direction-dependent corrections. a Image has highly variable noise due to residual contamination by the bright source artefacts.
2.1 Sample selection
For our cluster selection, we used an early version of the ACT DR5 cluster catalogue based on the ACT data through 2016, and selected candidate massive mergers to ensure a high scientific return from the pilot project. The full MERGHERS sample will not be subject to this “candidate merger” constraint, as it will be homogeneously mass-selected.
The selection criteria for the pilot sample were as follows. To ensure that our targets were robust cluster detections, we restricted the preliminary ACT DR5 sample to optically confirmed clusters222We refer the reader to Hilton et al. (2021) for the optical confirmation procedure. with an SZ signal-to-noise ratio (SNR) greater than 10, with a further Right Ascension (RA) range cut of 23h to 07h. The RA restriction was based on an expected MeerKAT observing schedule ranging from July through November, and on our preference for night-time observing. The SNR cut ensures we selected high-mass systems, and we further constrained the selection to clusters with that lie within the coverage of the Dark Energy Survey (DES; Abbott et al., 2018). These cuts reduced the sample pool to 29 clusters. To select potential mergers, we used a qualitative optical indication of disturbed morphology by calculating the positional offset between the SZ peak and the brightest cluster galaxy (BCG); the larger the offset, the more likely it is that the cluster is disturbed (Sehgal et al., 2013). We visually inspected the DES imaging to confirm the presence of multiple BCGs for clusters with significant or intermediate offsets.
The required integration time per target was determined through mock MeerKAT observations and a goal MeerKAT detection SNR of 10. The mock observations conservatively assumed 400 MHz of useable bandwidth due to the known satellite-affected frequency ranges. The simulations assumed a halo detection with a surface brightness, given the cluster redshift and SZ-derived mass333We use the weak-lensing-calibrated ACT masses., determined from observed scaling relations (Cassano et al., 2013). Our final sample was selected so as to maximise the number of targets observed, while remaining, after observation overheads, within the 16 hour time restriction of the 2019 MeerKAT Shared Risk proposal call. The list of 13 ACT DR5 clusters observed in this pilot study, along with the on-target times, is provided in Table 1.
2.2 Observations
All data for this project were observed in MeerKAT’s L-band receiver configuration, which has a native bandwidth of 856 MHz and a central frequency of 1.28 GHz. We observed in full polarization using the 4096 channel mode and 8 s dump time. To make full use of the power of MeerKAT, all observations used at least 58 of the 64 antennas; we also required that at least seven of the nine outer ring antennas be included. This criterion ensured that we would retain sufficient resolution in the final images to disentangle compact sources from any observed diffuse emission: for the highest redshift cluster in our sample, , a physical scale of 200 kpc (a conservative lower limit for merger-related diffuse cluster emission) covers 29 arcsec on the sky.
At L-band, a noise level of 10 Jy beam-1, using Briggs (Briggs, 1995) robust 0 weighting for a 10 arcsec beam, can be reached with less than an hour of MeerKAT time444See the online MeerKAT sensitivity calculator at https://archive-gw-1.kat.ac.za/public/tools/continuum_sensitivity_calculator.html.. This sensitivity makes MeerKAT a powerful tool for observing a large number of targets in a reasonable amount of telescope time. However, short integration times typically lead to poor uv-coverage and subsequently noisy point spread functions (PSFs). PSFs with complicated or bright sidelobes often create unwanted artefacts during image reconstruction, limiting the dynamic range.
To mitigate the negative effects of short integration times, the total on-source time for each target was broken up into 12–minute scans, each separated by approximately 1 hour. Targets with similar RA were grouped into epochs (or schedule blocks), with each epoch having a maximum RA range of 4 hours. There are three epochs in this pilot study, labelled A, B, and C, the groupings of which are listed in Table 1. Within a schedule block, scans of different targets were interleaved with each other, with a 2–minute visit to an appropriate phase calibrator after each target scan. By grouping targets into RA-constrained schedule blocks, several targets could share a phase calibrator, reducing the calibration overhead for that epoch. As a flux and bandpass calibrator, PKS J19396342 or PMN J04086545 was observed for ten minutes at the beginning of each epoch, and again every two hours. Appendix A shows the uv-coverage from the final calibrated data from two target observations, with the effect of the chosen observing strategy clearly evident.
3 Data Reduction
We made use of the oxkat v1.0555https://github.com/IanHeywood/oxkat software (Heywood, 2020) to reduce and process the data for this project, with each epoch being processed separately. oxkat is a semi-automated Python-based reduction pipeline for MeerKAT data, currently optimised for L-band continuum observations. The reduction procedure makes use of several radio astronomy software packages, including casa (McMullin et al., 2007) for cross-calibration and wsclean666https://sourceforge.net/p/wsclean/wiki/Home/ (Offringa et al., 2014) for general imaging.
The oxkat pipeline is currently automated up to direction-independent self-calibration (referred to as second generation calibration or 2GC) and imaging, with the cross-calibration (or first generation calibration, 1GC) and initial imaging tasks run separately from the 2GC steps. Third generation calibration (3GC), which implements direction-dependent corrections to the visibilities, is not automated, but still possible within the oxkat framework. Here we detail the 1GC, 2GC, and 3GC processing steps for our data, implemented using the oxkat software. The total percentages of flagged data, mostly due to satellites and other radio frequency interference (RFI), and the final properties of the primary beam-corrected images are listed in Table 1.
3.1 1GC: Cross-calibration and initial imaging
All cross-calibration tasks, where known calibrator sources are used to correct the target phases and amplitudes, are carried out in casa. The data are first averaged to 1024 channels and the field list is interrogated to determine primary calibrator, secondary calibrator, and target fields, as well as the target-secondary pairings. Initial flagging includes the known RFI-corrupted frequency bands (amounting to 40 per cent of the original bandwidth, dominated by RFI from satellites) as well as any poorly performing antennas. This step is then followed by automatic flagging of the calibrators, before models of the secondary calibrator fields are created. Both the secondary and primary calibrator models are then used to correct the target fields, after which the calibrated target fields are split into individual measurement sets.
The corrected target data undergo automatic flagging before imaging with wsclean, using the multi-frequency and auto-masking options (Offringa & Smirnov, 2017) and a Briggs weighting of -0.3. With a synthesised beam of 8 arcsec, this weighting provides the best compromise between angular resolution and noise sensitivity for our data. To capture all sources visible within MeerKAT’s field of view, we image a 3.1∘ 3.1∘ region centred on the cluster target. This is per cent wider than the MeerKAT primary beam at the lowest L-band frequency. We also note that the effective observing frequency, , of an image is dependent on the final flagged bandwidth, which varies across the three epochs.
3.2 2GC: Self-calibration
Self-calibration of the target visibilities, where gain solutions derived using only target data are used to iteratively improve its calibration, is carried out using casa and wsclean. First, the initial mask from the 1GC target imaging step is used to re-image the corrected data: the mask tells the software where to look for true emission and an accurate mask can greatly improve image quality. The mask is updated during re-imaging, after which a target sky model is predicted. The sky model is then used in casa to self-calibrate the target data, which determines a set of single-direction calibration solutions based on the phase centre of the dataset. Finally, the 2GC-corrected data are re-imaged and the mask and sky model updated.
For most of our targets, 2GC improves the image quality by reducing artefacts and lowers the noise floor by 1.3–20.3 per cent, depending on the field, resulting in image qualities sufficient for our scientific purposes. However, in four of our 13 targets, namely J0019.60336, J0034.40225, J0240.00115, and J0248.20238, 2GC processing results in a noisier image with larger artefacts. In each of the four cases, the field is populated by several bright ( mJy), extended sources, spread out over the 9 deg2 imaging field. In these cases, applying a calibration solution across the full field of view based only on the phase centre direction is insufficient and exacerbates amplitude errors around the brightest sources. For these fields, the measurement set is therefore reverted to the 1GC stage before carrying out direction-dependent corrections.
3.3 3GC: Direction-dependent calibration
For the four fields where 2GC processing resulted in a poorer quality image, the ddfacet777https://github.com/saopicc/DDFacet (Tasse et al., 2018) and killms888https://github.com/saopicc/killMS (Tasse, 2014; Smirnov & Tasse, 2015) packages are used to improve results through direction-dependent calibration. This is often needed for wide-field imaging where phase and amplitude gains may vary significantly across the field of view. With ddfacet and killms, the imaging field is broken up into several regions, called facets, each with its own phase centre, typically a bright source. Calibration solutions are determined for each facet separately before being applied to the data. For our four datasets, the 1GC-corrected visibilities are re-imaged with ddfacet, using between six and ten bright sources (depending on the field) to determine the facets. killms uses these facets and source positions to determine phase and amplitude corrections on a per-facet basis. A second round of imaging in ddfacet applies these corrections on the fly to produce a 3GC image with reduced artefacts around bright sources. After 3GC, the ACT-CL J0034.40225 field is still affected by direction-dependent artefacts. This field is particularly complex, with several bright (10–65 mJy), extended sources within the primary beam.
Additional calibration was also required for the J0040.84407 field, which is contaminated by a 2.6 Jy resolved source, 15 arcmin from the pointing centre. Self-calibration improved the central rms noise by 20 per cent, however the bright source was still a significant contaminant, with a central 2GC noise floor of 100 Jy beam-1. To remove this bright source from the visibilities, we peeled the bright source using the cubical999https://github.com/ratt-ru/CubiCal package (Kenyon et al., 2018). The peeling process uses calibration solutions towards the direction of the interfering source to remove the source contributions from the visibilities before re-imaging. After peeling, the central rms noise level is improved by 69 per cent to 31.8 Jy beam-1, and the peak image brightness is reduced to 0.11 Jy beam-1. Additional processing of this field will be necessary to further reduce residual artefacts radiating from the peeled source region.
3.4 Primary beam corrections
Once a final image has been obtained, we use the katbeam101010https://github.com/ska-sa/katbeam package to create primary beam corrected images for analysis. The final images are masked such that they contain only regions where the primary beam response remains above 30 per cent of the value at the phase centre. Primary beam correction increases the central rms noise by a median of 1.3 per cent across our 13 fields.
| (1) | (2) | (3) | (4) | (5) | (6) | (7) | (8) | (9) | (10) | (11) | (12) | (13) |
|---|---|---|---|---|---|---|---|---|---|---|---|---|
| Name | z | LAS | LLS | Class | New? | log | SNR | Comments | ||||
| (ACT-CL…) | () | (′) | (Mpc) | (GHz) | (mJy) | (W Hz-1) | ||||||
| J0013.34906 | 0.407 | 0.9 | 0.29 | cH | ✓ | 1.16 | 0.54 0.08 | 23.44 | ||||
| J0019.60336 | 0.266 | 3.3 | 0.81 | H | ✓ | 1.16 | 9.16 0.57 | 24.13 | ||||
| J0034.40225 | 0.388 | 1.1 | 0.35 | cH | ✓ | 1.16 | 1.26 0.20 | 23.76 | ||||
| J0046.43912 | 0.592 | 1.4 | 0.56 | R | ✓ | 1.16 | 3.48 0.19 | 24.66 | 1.8′ SW of centre. | |||
| 3.2 | 1.28 | H | ✓ | 1.16 | 3.58 0.27 | 24.67 | ||||||
| J0159.03413 | 0.413 | 3.3 | 1.08 | R | ✓ | 1.28 | 13.99 0.73 | 24.92 | 3.0′ SW of centre. | |||
| 1.7 | 0.56 | R | ✓ | 1.28 | 4.25 0.23 | 24.41 | 2.8′ N of centre. | |||||
| 3.7 | 1.22 | H | ✓ | 1.28 | 9.71 0.57 | 24.77 | ||||||
| J0245.55302 | 0.298 | 2.0 | 0.53 | H | ✓ | 1.28 | 3.82 0.28 | 24.02 | ||||
| J0248.10216 | 0.238 | 2.9 | 0.66 | H | ✓ | 1.28 | 6.46 0.41 | 24.02 | ||||
| J0528.83927 | 0.284 | 2.1 | 0.54 | H | ✓ | 1.28 | 3.58 0.26 | 23.94 | Extends SW from BCG | |||
| J0638.75358 | 0.226 | 2.2 | 0.48 | H | 1.28 | 4.68 0.34 | 23.83 | Wilber et al. (2020) | ||||
4 Results
Table 1 lists the central rms noise, , and synthesised beam, , for the final full-resolution, primary beam-corrected images. The native resolutions are in the range 6.7–8.3 arcsec, with cluster region noise levels between 7.5 and 31.8 Jy beam-1.
To increase the sensitivity to faint extended emission, we need to image at lower resolution. However, extended structure would be contaminated by source blending if compact sources were not first removed. This step is typically taken using -range restricted source modeling and model-subtraction from the visibilities. This method failed on our datasets due to the combination of short integration times and MeerKAT’s dense core: restricting the model to physical scales less than 100 kpc111111The smallest types of diffuse emission are typically 100–400 kpc across. our source model had too little data to accurately model the compact source flux; reducing the -cut to allow enough data for accurate flux characterisation led to models which, when removed, led to over-subtraction of the extended emission. To image extended emission without compact sources, we instead implemented the image-plane filtering technique described in Rudnick (2002), whereby emission on scales 1–3 times the synthesised beam is filtered out, creating an image with only the larger scale emission. As no convolution takes place, the large-scale image has the same units and resolution as the original, but has a negatively offset zero-level that needs to be corrected before any quantitative analysis. After correction for this zero-level, the image is convolved, for aesthetics, with a Gaussian slightly larger than the filter size. To verify the success of the compact source removal, we checked the filtered maps (before convolving) at the positions of isolated compact sources and find values consistent with noise. The rms noise, , and convolved beam size, , of the smoothed large-scale-emission images (hereafter the LS images) are given in the last two columns of Table 1.
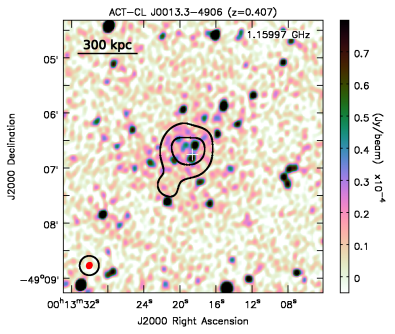
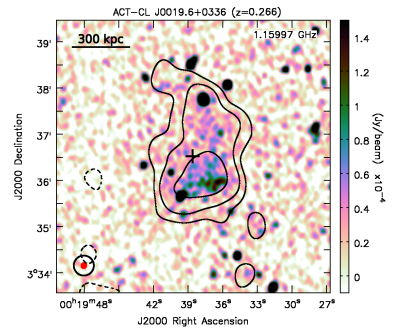
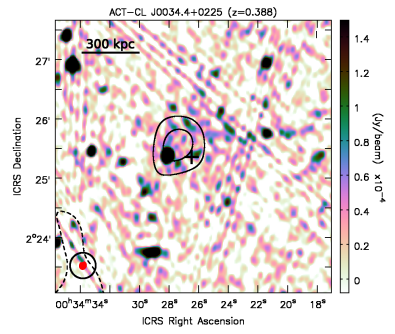
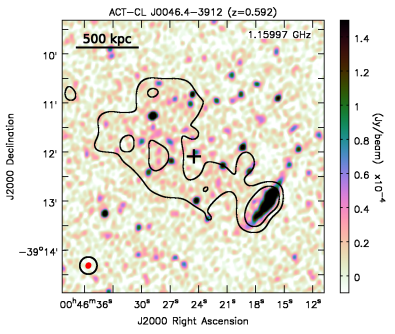
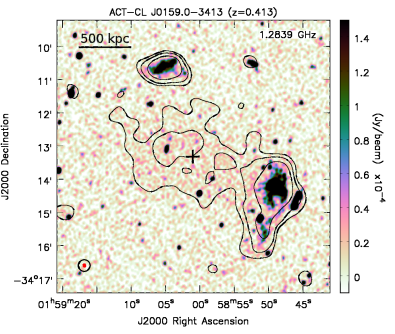
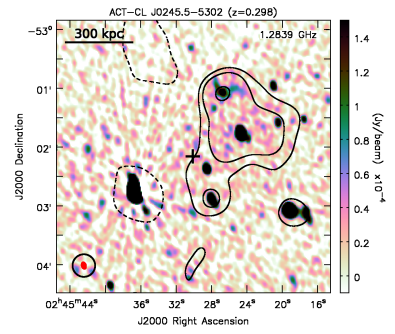
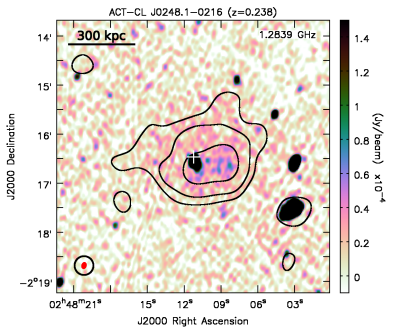
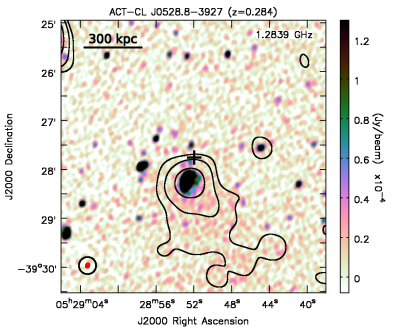
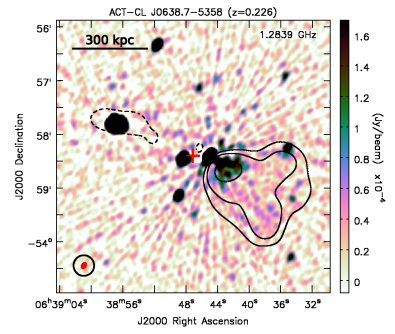
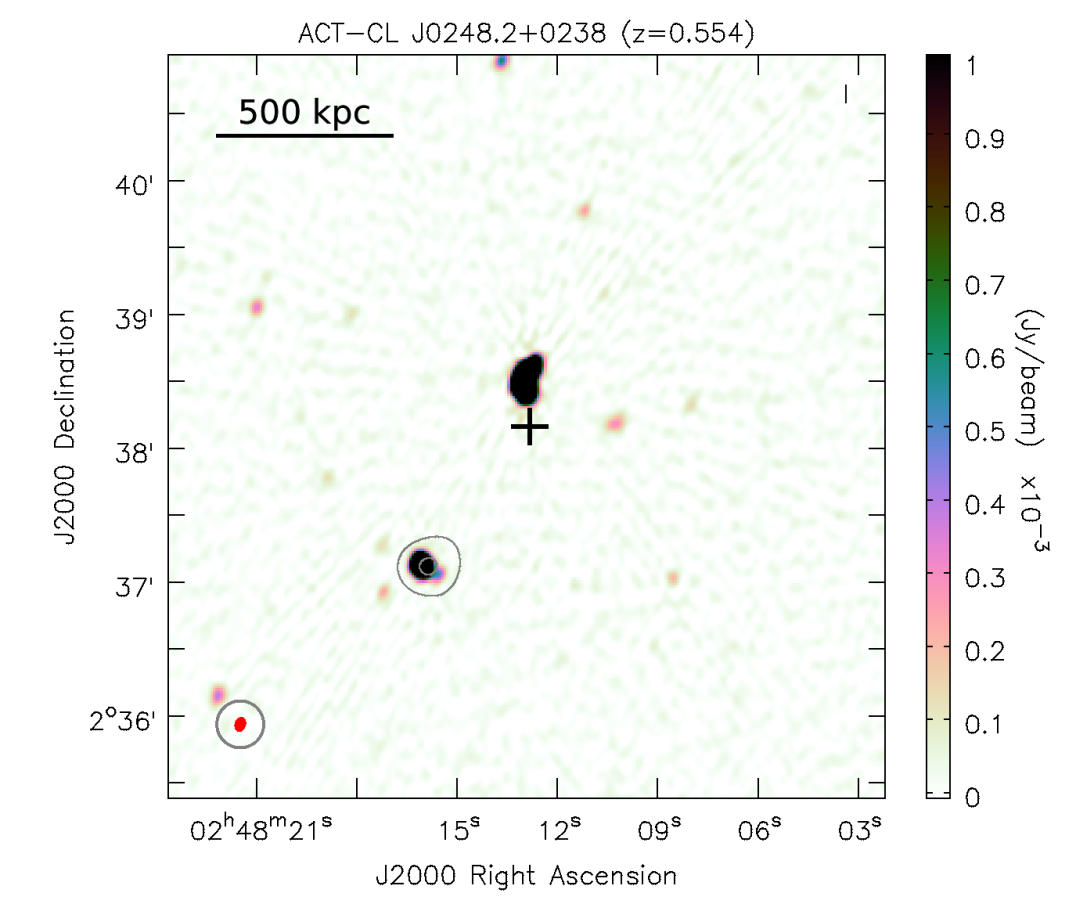
Figure 1 shows the cluster regions for the nine systems in which we detect diffuse extended emission (SNR ), with two of the nine clusters containing more than one diffuse source. The full resolution image is shown in the colour map, with the synthesised beam indicated by the filled red ellipse in the lower left of each panel. Black contours show the levels from the relevant LS map. Negative contours are dashed, and the LS synthesised beam is shown by the bold black ellipse in the lower left of each panel. The cross indicates the position of the ACT SZ peak. The physical scale at the cluster redshift is indicated in the upper left of each panel. Figure 4 in the appendix shows the cluster regions for the four targets with no diffuse emission detection.
We detect a 560 kpc radio relic in ACT-CL J0046.43912, and double relics in ACT-CL J0159.03413. Sub-Mpc radio halos are detected in five other systems, with candidate halos in ACT-CL J0013.34906 and ACT-CL J0034.40225. Given the observed sizes, the candidate halos could also be mini-halos, although unlikely if these are strongly dynamically disturbed systems. An X-ray study of these systems may assist in a firmer classification. The LS maps confirm the full-resolution detections in all nine systems, and reveal giant radio halos (physical size 1 Mpc) in ACT-CL J0046.43912 and ACT-CL J0159.03413. Table 2 lists the largest angular size (LAS), largest projected physical size (LLS) at the cluster redshift, classification, effective observing frequency , measured flux density , and SNR for each diffuse emission detection. Flux densities are measured within the 3 region and we assume a 5 per cent MeerKAT amplitude uncertainty. The total flux density uncertainty is measured as where is the number of beams within the 3 region. With the exception of the radio relic in ACT-CL J0046.43912 and the northern relic in ACT-CL J0159.03413, which do not have embedded compact sources, all flux density measurements were made in the LS image. For the two former cases, the flux density is measured in the full resolution image.
5 Discussion
All but one of our detections are new, with the halo in ACT-CL J0638.75358 having been detected by ASKAP (Wilber et al., 2020). We do not detect the full ASKAP halo emission in this system; however, we do resolve a peaked region in the halo that is morphologically aligned with the X-ray emission of the infalling subcluster seen in figure 6 from Wilber et al. (2020).
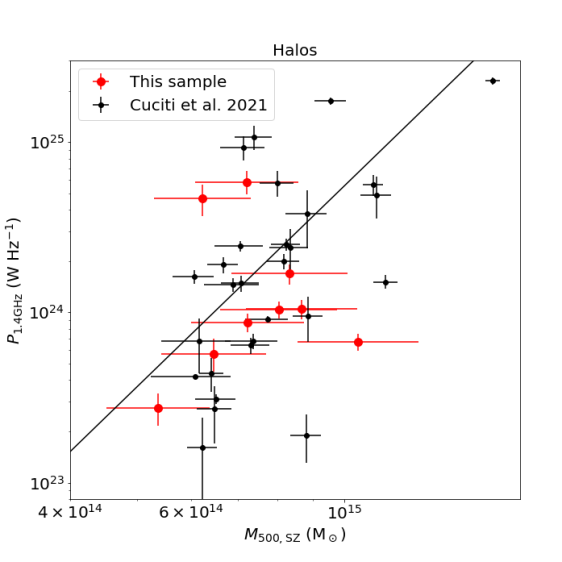
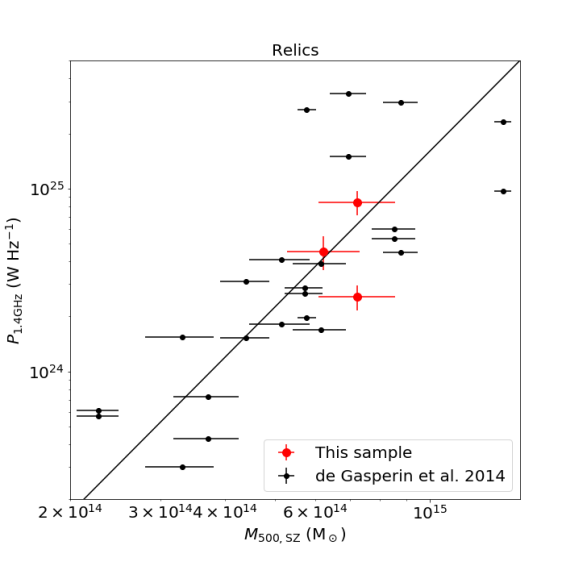
To compare our detections to the literature, we determine -corrected 1.4 GHz radio powers, , for all diffuse emission detections. To extrapolate the MeerKAT flux densities to 1.4 GHz we assume a fiducial spectral index of , adopting the spectral power law convention of . The choice of spectral index uncertainty allows for the wide range of observed spectral indices for radio halos and relics. We note that the -corrected radio powers will be higher if the detected sources have very steep spectra (), however, as the MeerKAT reference frequency is quite close to 1.4 GHz, the effect will not be large.
The calculated 1.4 GHz radio powers for all detections are provided in column 11 in Table 2, and we show their comparison with known scaling relations (Cuciti et al. 2021 for radio halos; de Gasperin et al. 2014 for relics) in Figure 2. We note that the literature results use SZ masses from Planck which have not been calibrated against weak lensing results, and are therefore systematically lower than our ACT DR5 masses used in selection. In Figure 2 we therefore use the ‘uncorrected’ ACT DR5 SZ masses121212The ‘uncorrected’ ACT masses are referred to as in Hilton et al. (2021) and are in the M500cUncorr columns of the ACT DR5 catalogue available on LAMBDA (https://lambda.gsfc.nasa.gov/product/act/actpol_prod_table.cfm). for our clusters, given in column 4 of Table 2, to more accurately compare results. All of our detections lie within the scatter of the correlations, indicating that we successfully removed contaminating compact emission. We note that our ACT-CL J0638.75358 radio halo, residing in the most massive of our clusters, lies at the edge of the scatter in the literature values, and in the region typically associated with ultra-steep spectrum sources. However, our power is likely underestimated due to missing flux, as described above, with Wilber et al. (2020) quoting a halo power a factor of higher, which would move it closer to the correlation.
6 Conclusions
The MERGHERS survey is a planned project to observe a statistically significant number ( 200) of galaxy clusters with MeerKAT, in order to probe the cosmic and mass evolution of diffuse cluster radio emission and cosmic magnetic fields. Observing a statistically significant number of clusters in a single observing season requires relatively short ( hour) on-source times. We have presented the results of a MERGHERS pilot study which validates this as feasible, confirming MeerKAT’s suitability for large cluster studies at L-band.
In this work, we have carried out pilot observations of 13 SZ-selected galaxy clusters detected in the ACT DR5 maps, observing each cluster for less than two hours, with most being observed for only 24 minutes. Short observations can be susceptible to poor uv-coverage, which in turn negatively affects the point spread function and subsequently limits image quality. Our chosen observing strategy, to be implemented in the full MERGHERS programme, mitigates this risk by splitting a target’s observation time into several smaller chunks, interspersed with observations of other clusters, so that a wider range of hour angle is covered for every target.
By mitigating sparse uv-coverage, and employing a range of modern data reduction and imaging techniques, we reached or improved upon the predicted rms noise floor, based on our total time-on-source, for most target fields. However, for the fields which underwent 3GC processing, our final rms noise is higher by a factor of 1.1–1.9 compared to the predicted value. This is likely because theoretical noise estimates do not take into account bright source contamination. For future observations, for fields with significant bright sources in all-sky surveys, full-field modelling may be a preferred method for estimating required source integration times. Due to its several extended bright sources, the ACT-CL J0034.40225 field is a good candidate for testing such algorithms, as well as testing more advanced reduction techniques.
We are able to reliably detect diffuse emission in 70 per cent of our clusters, with our highest redshift detection being at . All but one of our detections are new and the full set, provided in Table 2, can be summarised as follows: two systems host both radio relic(s) and a giant radio halo, five systems have radio halos, and two have candidate radio halos. Our estimated 1.4 GHz radio powers for all detections, assuming a fiducial spectral index of , are consistent with known scaling relations. Determination of in-band spectral indices and power upper limits for the non-detections are outside of the scope of this detection paper. When combined with multiwavelength data to verify the cluster dynamical state, these radio results will allow us to study cluster magnetic fields out to .
Our MERGHERS pilot project has shown that MeerKAT’s L-band provides sufficient resolution and sensitivity to reliably separate diffuse emission from compact sources. As MeerKAT also operates at lower frequencies where the steep-spectrum diffuse emission is brighter, a similar test can be carried out with UHF-band data to determine the limiting redshift with the lower UHF resolution.
Data Availability
The data underlying this article will be shared on reasonable request to the corresponding author.
Acknowledgements
The MeerKAT telescope is operated by the South African Radio Astronomy Observatory (SARAO), which is a facility of the National Research Foundation, an agency of the Department of Science and Innovation.
KK, DP, and SS acknowledge funding support from SARAO. JPH acknowledges support from NSF Astronomy and Astrophysics Research Program award number 1615657. MH and KM acknowledge support from the National Research Foundation of South Africa. CP acknowledges support by the European Research Council under ERC-CoG grant CRAGSMAN-646955. CS acknowledges support from the Agencia Nacional de Investigación y Desarrollo (ANID) through FONDECYT Iniciación grant no. 11191125. The research of OS is supported by the South African Research Chairs Initiative of the Department of Science and Technology and National Research Foundation. ZX is supported by the Gordon and Betty Moore Foundation.
This research made use of the Astropy,131313http://www.astropy.org (Astropy Collaboration et al., 2013, 2018), NumPy (Harris et al., 2020), and SciPy (Virtanen et al., 2020) Python packages. Astropy is a community-developed core Python package for Astronomy. The Common Astronomy Software Applications (CASA) package is developed by an international consortium of scientists based at the National Radio Astronomical Observatory (NRAO), the European Southern Observatory (ESO), the National Astronomical Observatory of Japan (NAOJ), the Academia Sinica Institute of Astronomy and Astrophysics (ASIAA), the CSIRO division for Astronomy and Space Science (CASS), and the Netherlands Institute for Radio Astronomy (ASTRON) under the guidance of NRAO. The National Radio Astronomy Observatory is a facility of the National Science Foundation operated under cooperative agreement by Associated Universities, Inc.
References
- Abbott et al. (2018) Abbott T. M. C., et al., 2018, ApJS, 239, 18
- Andrade-Santos et al. (2017) Andrade-Santos F., et al., 2017, ApJ, 843, 76
- Astropy Collaboration et al. (2013) Astropy Collaboration et al., 2013, A&A, 558, A33
- Astropy Collaboration et al. (2018) Astropy Collaboration et al., 2018, AJ, 156, 123
- Basu (2012) Basu K., 2012, MNRAS, 421, L112
- Bernardi et al. (2016) Bernardi G., et al., 2016, MNRAS, 456, 1259
- Bleem et al. (2015) Bleem L. E., et al., 2015, ApJS, 216, 27
- Bleem et al. (2020) Bleem L. E., et al., 2020, ApJS, 247, 25
- Bonafede et al. (2009) Bonafede A., et al., 2009, A&A, 503, 707
- Bonafede et al. (2015) Bonafede A., et al., 2015, MNRAS, 454, 3391
- Briggs (1995) Briggs D. S., 1995, PhD thesis, New Mexico Institute of Mining and Technology
- Brüggen et al. (2018) Brüggen M., et al., 2018, MNRAS, 477, 3461
- Brunetti & Jones (2014) Brunetti G., Jones T. W., 2014, International Journal of Modern Physics D, 23, 1430007
- Camilo et al. (2018) Camilo F., Scholz P., Serylak M., et al. 2018, ApJ, 856, 180
- Cappelluti et al. (2011) Cappelluti N., et al., 2011, Memorie della Societa Astronomica Italiana Supplementi, 17, 159
- Cassano et al. (2006) Cassano R., Brunetti G., Setti G., 2006, MNRAS, 369, 1577
- Cassano et al. (2013) Cassano R., et al., 2013, ApJ, 777, 141
- Cuciti et al. (2015) Cuciti V., Cassano R., Brunetti G., Dallacasa D., Kale R., Ettori S., Venturi T., 2015, A&A, 580, A97
- Cuciti et al. (2021) Cuciti V., et al., 2021, A&A, 647, A51
- Di Gennaro et al. (2020) Di Gennaro G., et al., 2020, Nature Astronomy, pre-print:arXiv:2011.01628,
- Giovannini et al. (2020) Giovannini G., et al., 2020, A&A, 640, A108
- Harris et al. (2020) Harris C. R., et al., 2020, Nature, 585, 357–362
- Hasselfield et al. (2013) Hasselfield M., et al., 2013, J. Cosmology Astropart. Phys., 2013, 008
- Henderson et al. (2016) Henderson S. W., et al., 2016, Journal of Low Temperature Physics, 184, 772
- Heywood (2020) Heywood I., 2020, oxkat: Semi-automated imaging of MeerKAT observations (ascl:2009.003)
- Hilton et al. (2018) Hilton M., et al., 2018, ApJS, 235, 20
- Hilton et al. (2021) Hilton M., et al., 2021, ApJS, 253, 3
- Hlavacek-Larrondo et al. (2018) Hlavacek-Larrondo J., et al., 2018, MNRAS, 475, 2743
- Hoang et al. (2020) Hoang N. D., et al., 2020, MNRAS,
- Johnston et al. (2007) Johnston S., et al., 2007, Publ. Astron. Soc. Australia, 24, 174
- Jonas & MeerKAT Team (2016) Jonas J., MeerKAT Team 2016, in MeerKAT Science: On the Pathway to the SKA. p. 1, doi:10.22323/1.277.0001
- Kale et al. (2017) Kale R., Wik D. R., Giacintucci S., Venturi T., Brunetti G., Cassano R., Dallacasa D., de Gasperin F., 2017, MNRAS, 472, 940
- Kenyon et al. (2018) Kenyon J. S., Smirnov O. M., Grobler T. L., Perkins S. J., 2018, MNRAS, 478, 2399
- Knowles et al. (2016a) Knowles K., et al., 2016a, in MeerKAT Science: On the Pathway to the SKA. p. 30, doi:10.22323/1.277.0030
- Knowles et al. (2016b) Knowles K., et al., 2016b, MNRAS, 459, 4240
- Knowles et al. (2019) Knowles K., et al., 2019, MNRAS, 486, 1332
- Lindner et al. (2014) Lindner R. R., et al., 2014, ApJ, 786, 49
- Mauch et al. (2020) Mauch T., Cotton W., Condon J., et al. 2020, ApJ, 888, 61
- McMullin et al. (2007) McMullin J. P., Waters B., Schiebel D., Young W., Golap K., 2007, in Shaw R. A., Hill F., Bell D. J., eds, Astronomical Society of the Pacific Conference Series Vol. 376, Astronomical Data Analysis Software and Systems XVI. p. 127
- Naess et al. (2020) Naess S., et al., 2020, J. Cosmology Astropart. Phys., 2020, 046
- Offringa & Smirnov (2017) Offringa A. R., Smirnov O., 2017, MNRAS, 471, 301
- Offringa et al. (2014) Offringa A. R., McKinley B., Hurley-Walker et al., 2014, MNRAS, 444, 606
- Pandey-Pommier et al. (2013) Pandey-Pommier M., Richard J., Combes F., Dwarakanath K. S., Guiderdoni B., Ferrari C., Sirothia S., Narasimha D., 2013, A&A, 557, A117
- Planck Collaboration et al. (2014) Planck Collaboration et al., 2014, A&A, 571, A29
- Planck Collaboration et al. (2016) Planck Collaboration et al., 2016, A&A, 594, A27
- Poole et al. (2007) Poole G. B., Babul A., McCarthy I. G., Fardal M. A., Bildfell C. J., Quinn T., Mahdavi A., 2007, MNRAS, 380, 437
- Randall et al. (2002) Randall S. W., Sarazin C. L., Ricker P. M., 2002, ApJ, 577, 579
- Riseley et al. (2017) Riseley C. J., Scaife A. M. M., Wise M. W., Clarke A. O., 2017, A&A, 597, A96
- Rudnick (2002) Rudnick L., 2002, PASP, 114, 427
- Sehgal et al. (2013) Sehgal N., et al., 2013, ApJ, 767, 38
- Smirnov & Tasse (2015) Smirnov O. M., Tasse C., 2015, MNRAS, 449, 2668
- Sommer & Basu (2014) Sommer M. W., Basu K., 2014, MNRAS, 437, 2163
- Sunyaev & Zeldovich (1972) Sunyaev R. A., Zeldovich Y. B., 1972, Comments on Astrophysics and Space Physics, 4, 173
- Tasse (2014) Tasse C., 2014, A&A, 566, A127
- Tasse et al. (2018) Tasse C., et al., 2018, A&A, 611, A87
- Venturi et al. (2007) Venturi T., Giacintucci S., Brunetti G., Cassano R., Bardelli S., Dallacasa D., Setti G., 2007, A&A, 463, 937
- Virtanen et al. (2020) Virtanen P., et al., 2020, Nature Methods, 17, 261
- Voges (1993) Voges W., 1993, Advances in Space Research, 13, 391
- Wik et al. (2008) Wik D. R., Sarazin C. L., Ricker P. M., Randall S. W., 2008, ApJ, 680, 17
- Wilber et al. (2020) Wilber A. G., Johnston-Hollitt M., Duchesne S. W., Tasse C., Akamatsu H., Intema H., Hodgson T., 2020, arXiv e-prints, p. arXiv:2006.01833
- Zandanel et al. (2014) Zandanel F., Pfrommer C., Prada F., 2014, MNRAS, 438, 124
- de Gasperin et al. (2014) de Gasperin F., van Weeren R. J., Brüggen M., Vazza F., Bonafede A., Intema H. T., 2014, MNRAS, 444, 3130
- van Haarlem et al. (2013) van Haarlem M. P., et al., 2013, A&A, 556, A2
- van Weeren et al. (2019) van Weeren R. J., de Gasperin F., Akamatsu H., Brüggen M., Feretti L., Kang H., Stroe A., Zandanel F., 2019, Space Sci. Rev., 215, 16
Appendix A UV-coverage plots
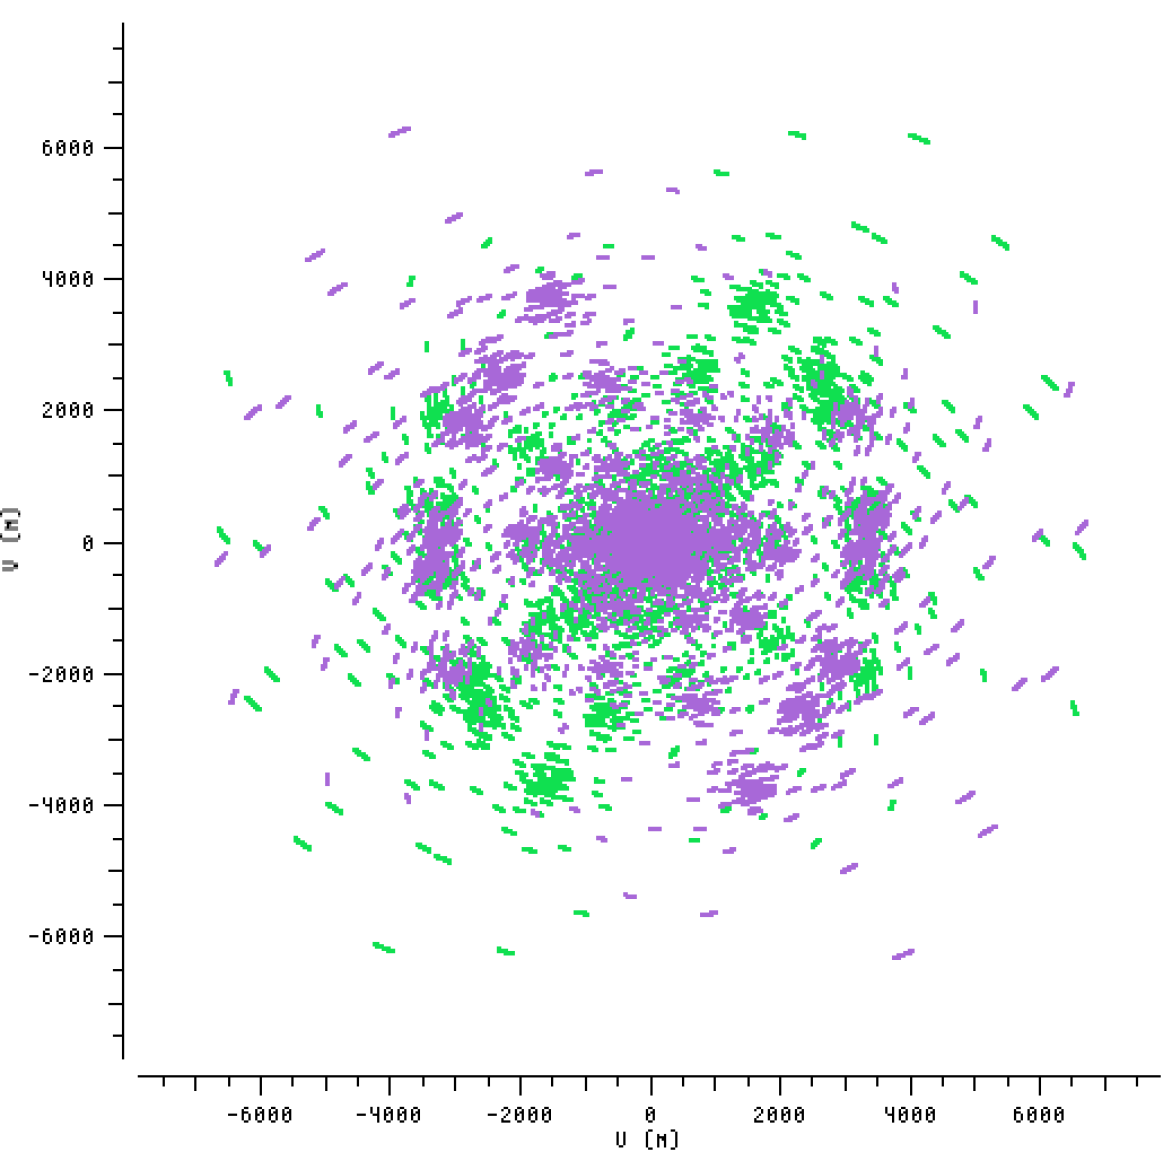
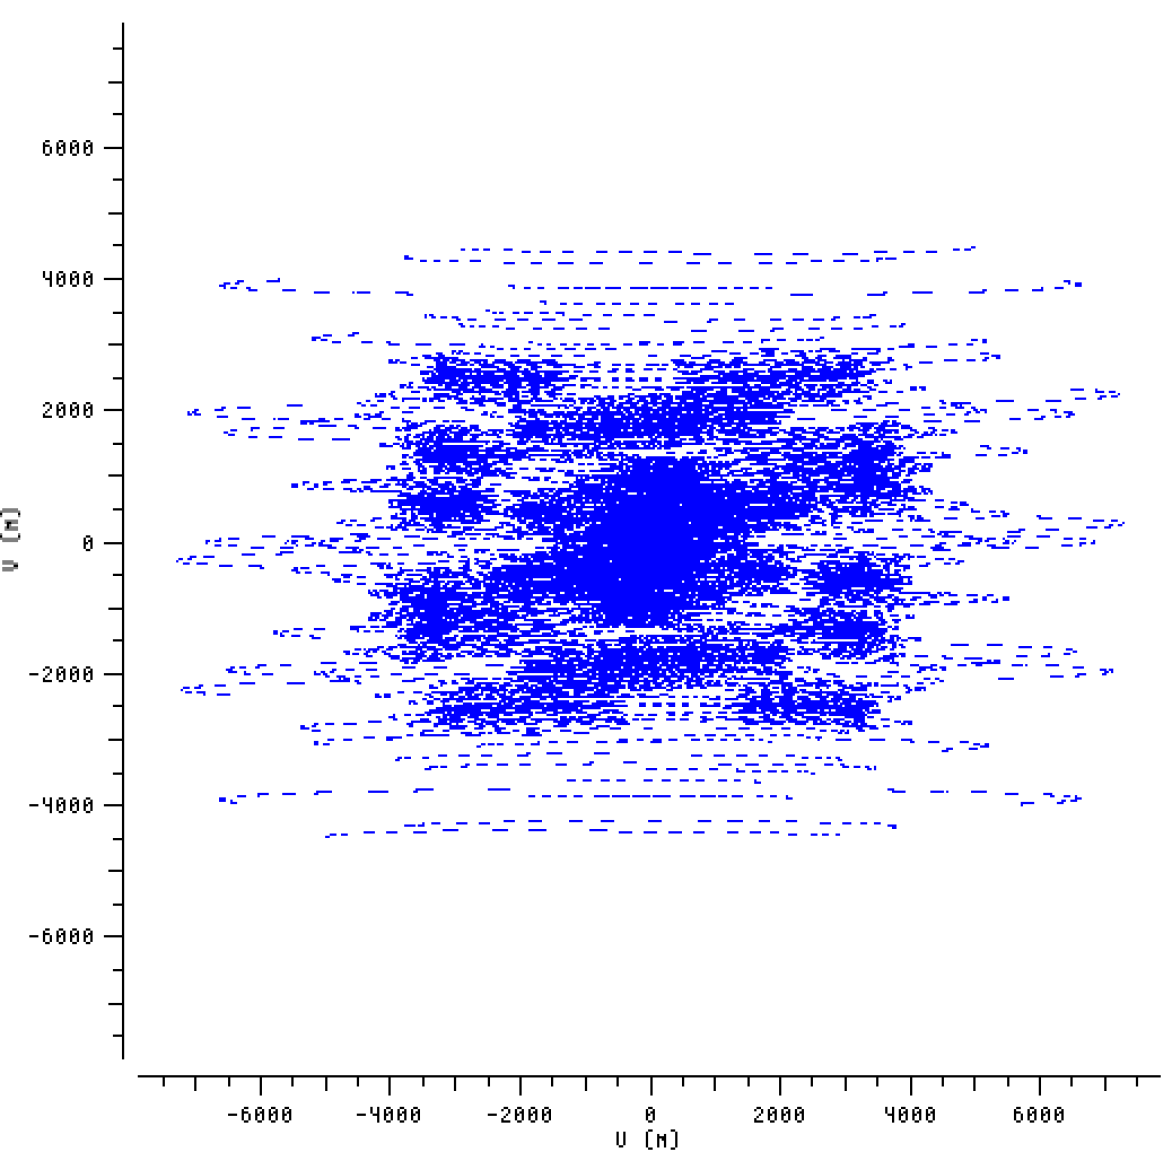
The observing strategy used in this project breaks up a target observation into 12-minute scans and spreads these over a range of hourangles in order to improve the target uv-coverage. Figure 3 presents the uv-coverage plots for one of our shortest observations (ACT-CL J0159.03413 - 24 minutes; top panel) and for our longest observation (ACT-CL J0240.0+0115 - 132 minutes; bottom panel). The plotted data are from the final calibrated datasets after all flagging. The effect of spreading out shorter scans produces a wider coverage in the radial direction, as can be seen in the top panel where the two 12-minute scans are in different colours. The effect of MeerKAT’s dense core is evident in the well-sampled 0–500 m range, where there is maximal sensitivity to the extended emission we are searching for.
Appendix B Cluster fields with no detections
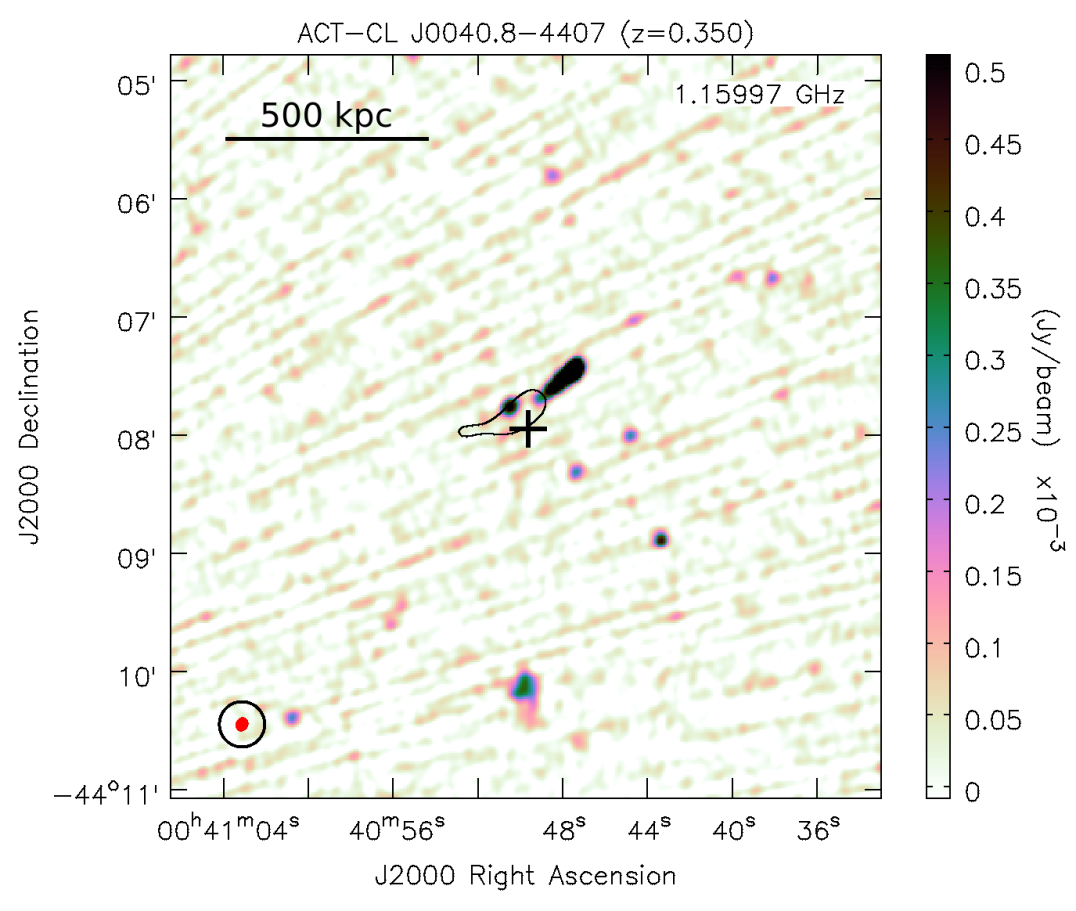
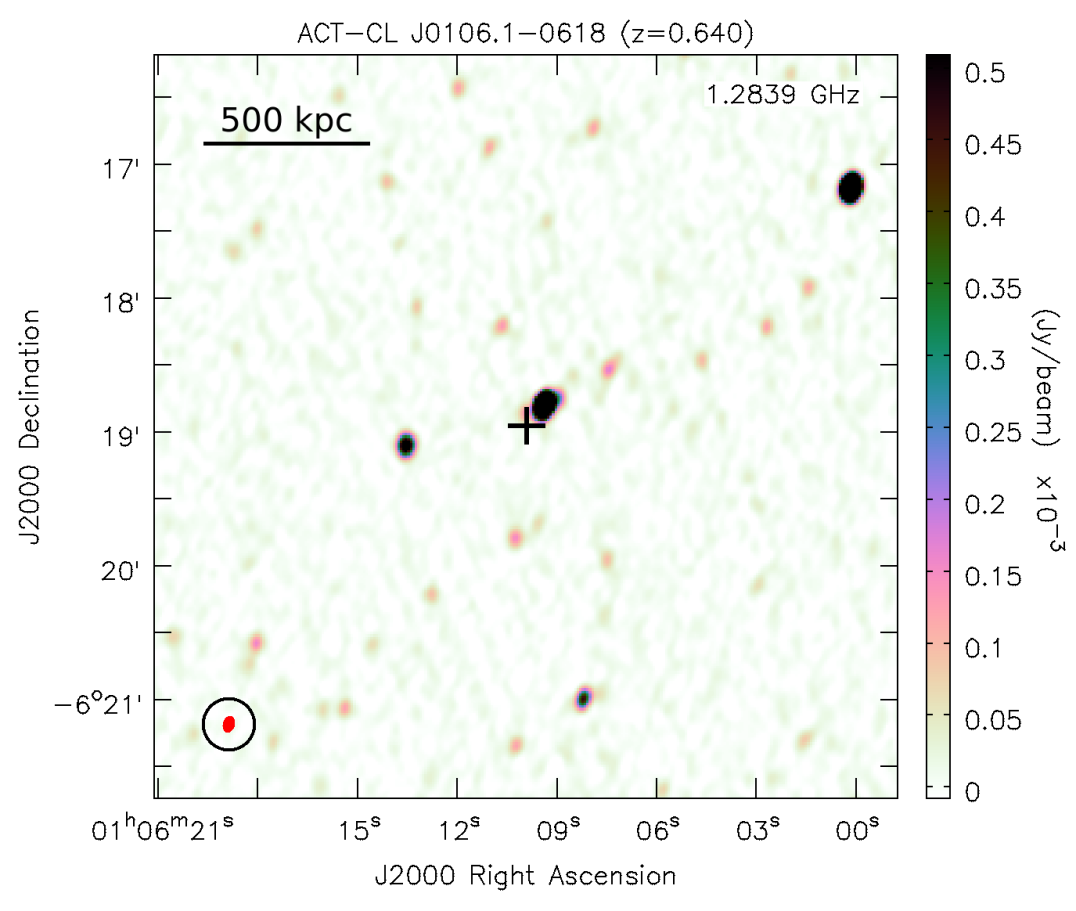
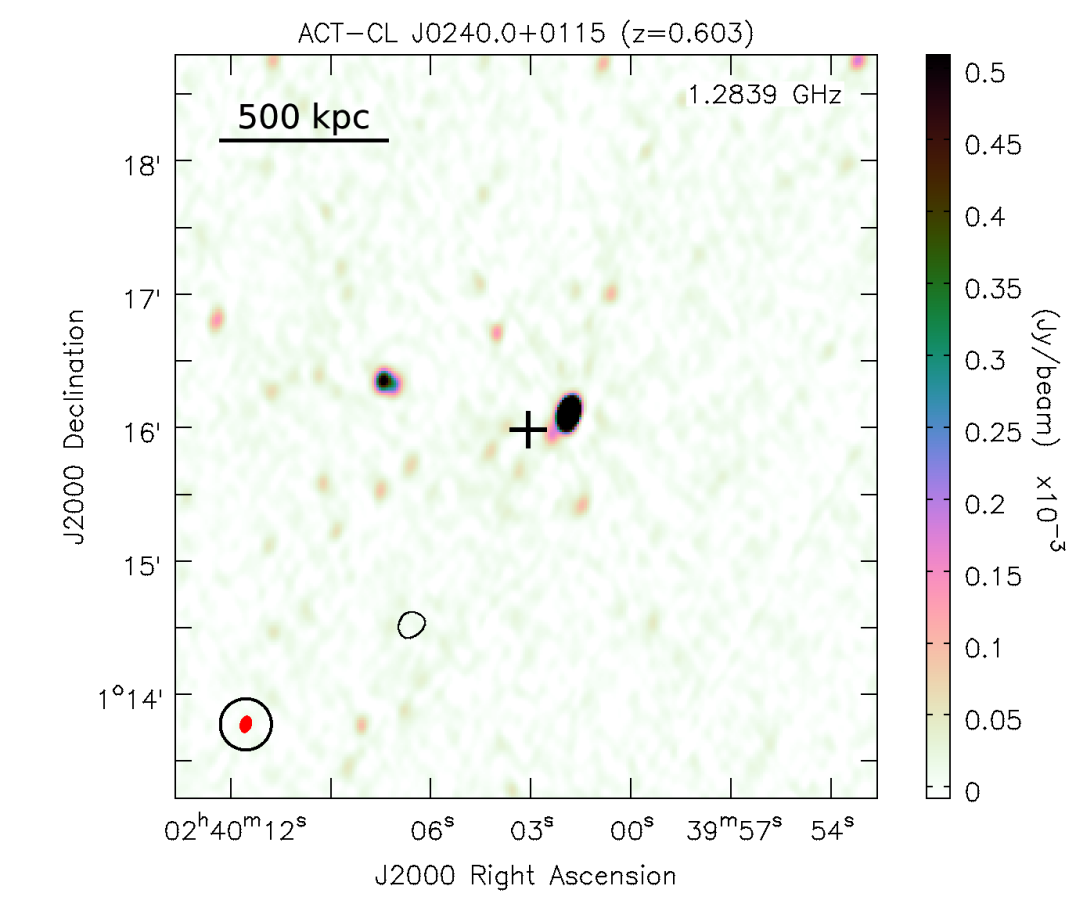
In Figure 4 we present full-resolution images of the four targets in our sample with no diffuse emission detection in the cluster region. Colour scales and notations are as in Figure 1. The targets are ACT-CL J0040.84407 (top left), ACT-CL J0106.10618 (top right), ACT-CL J0240.00115 (bottom left), and ACT-CL J0248.200238 (bottom right).