Spin-polarized imaging of strongly interacting fermions
in the ferrimagnetic state of Weyl candidate CeBi
Abstract
CeBi has an intricate magnetic phase diagram whose fully-polarized state has recently been suggested as a Weyl semimetal, though the role of states in promoting strong interactions has remained elusive. Here we focus on the less-studied, but also time-reversal symmetry-breaking ferrimagnetic phase of CeBi, where our density functional theory (DFT) calculations predict additional Weyl nodes near the Fermi level . We use spin-polarized scanning tunneling microscopy and spectroscopy to image the surface ferrimagnetic order on the itinerant Bi states, indicating their orbital hybridization with localized Ce states. We observe suppression of this spin-polarized signature at , coincident with a Fano line shape in the conductance spectra, suggesting the Bi states partially Kondo screen the magnetic moments, and this hybridization causes strong Fermi-level band renormalization. The band flattening is supported by our quasiparticle interference (QPI) measurements, which also show band splitting in agreement with DFT, painting a consistent picture of a strongly interacting magnetic Weyl semimetal.
I Introduction
1 Merging strong electron interactions with topology is a new frontier for fundamental research and advanced technology [1, 2, 3]. Kondo lattice systems are a promising platform for strongly correlated topological phenomena, exemplified by the recent observation of strongly-renormalized Dirac surface states in the Kondo insulator SmB6 [4, 5], and the proposal for a Weyl-Kondo semimetal phase [6]. In general, a Weyl semimetal [7] arises when a bulk Dirac point is split into two Weyl nodes by breaking inversion or time-reversal symmetry (TRS). However, a crystal structure that breaks inversion symmetry is typically not tunable, while an applied magnetic field that breaks TRS yields only a small Zeeman energy of Kelvin/Tesla for a typical -factor of 2. Materials with intrinsic magnetic order may have larger energy scales that drive the Weyl nodes farther apart and protect their well-defined chirality [8]. Such TRS-breaking Weyl semimetals were recently discovered in ferromagnets [9, 10, 11] and antiferromagnets [12]. The ultimate goal is to combine the higher energy scales and strong correlations with the practicality of external tunability [13]. This goal motivates the search for topological phases in Kondo lattice compounds, which often host large spin-orbit coupling, strongly interacting electrons, and proximate field-tunable magnetic order [14, 15, 16].
2 Cerium-monopnictides (Ce, = As, Sb, Bi) are correlated low-carrier-density Kondo lattice systems [17] with cascades of magnetic phase transitions, as shown for CeBi in Fig. 1 [18, 19, 20]. Though bulk magnetic phase diagrams have been measured by neutron scattering, surface magnetic order has not been studied. Meanwhile, non-trivial band topology was predicted in CeSb [21, 22] and CeBi [23, 24], and signatures of Weyl fermions were observed in transport experiments in the fully-polarized magnetic phase of CeSb [22]. However, the Weyl fermion bands have not yet been directly resolved in any phase of Ce, because the TRS-broken phases exist only under external magnetic field, which precludes the use of angle-resolved photoemission spectroscopy (ARPES). In cerium monopnictides, it remains crucial to measure the surface magnetic order, its associated band splitting, and its orbital contributions, which could influence the Fermi arcs and their connectivity to Weyl cones [9]. Furthermore, characterizing the interplay between magnetic order and Kondo physics is essential to understand the possible emergence of heavy fermions and flat bands [25].
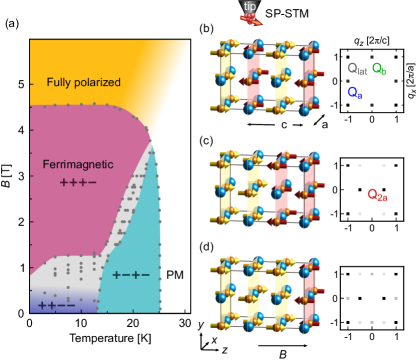
3 Here we use spin-polarized (SP) scanning tunneling microscopy (STM) and spectroscopy (STS) to image the energy-resolved surface magnetic order on CeBi, at low temperature with applied magnetic field . We extend previous density functional theory (DFT) calculations of Weyl nodes in the high- fully-polarized phase [24], to predict additional Weyl nodes near the Fermi level in the intermediate- ferrimagnetic phase. We therefore focus our experiments at T, where we image the expected (+++) pattern of the spin orientation of the orbitals on the Ce sites, but only above . Surprisingly, we observe the same magnetic pattern on the Bi sites below . The induced magnetic moments on the Bi states, co-aligned with the adjacent Ce states, indicate orbital hybridization, commonly referred to as mixing [26, 27]. For energies closer to we observe suppression of the (+++) spin polarization, coinciding with a Fano resonance in our measured conductance (), further supporting hybridization. These observations suggest a competition between the mechanism inducing the co-aligned (i.e. ferromagnetically aligned) moments on the Bi states and the antiferromagnetic Kondo screening. Finally, we present quasiparticle interference (QPI) measurements showing a 100 meV splitting of the Bi -band, validating our DFT calculations that show the crossing of the Bi and Ce bands to form Weyl nodes close to . Our QPI suggests a flattening of the mixed-character band that forms the Weyl cones.
II Methods
4 We calculated the bulk band structure of CeBi using the generalized-gradient approximation (GGA) as implemented in the all-electron code WIEN2K [28, *wien2k2], with the augmented-plane-wave + local-orbitals (APW+lo) basis set. In the paramagnetic phase we treated the Ce 4 orbitals as core electrons while in the magnetic phases we incorporated the Hubbard Coulomb interaction on the Ce electrons, with eV and eV chosen to make the Ce energy level qualitatively consistent with ARPES measurements on CeBi [27]. We included spin-orbit coupling in all calculations.
5 Single crystals of CeBi were grown by the self-flux method [19]. We cooled the crystals in zero field, cleaved them in cryogenic ultra-high vacuum at K to expose a neutral (010) surface before imaging them at K. We prepared non-magnetic PtIr STM tips by ex situ mechanical sharpening, then in situ field emission on Au foil. We obtained spin-polarized tips by gently dunking them into the sample to pick up a few atoms of magnetic material [30, 31, 32].
III Density functional theory calculations
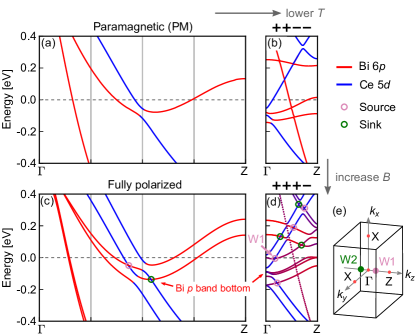
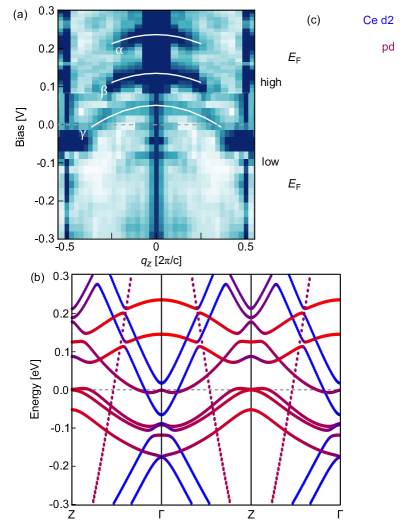
6 Figure 2 shows the folding and splitting of the two Bi bands and the Ce band that cross , as is lowered and is increased [33]. Our calculations predict an induced magnetic moment of on the Bi states in both the ferrimagnetic and the fully-polarized phase. We also computed the Berry curvature at each band crossing in the fully-polarized and ferrimagnetic phases, and circled the sinks and sources that constitute Weyl nodes (see also Fig. 11) [24]. In the fully-polarized phase we find a band splitting of 100 meV that generates Weyl nodes near the calculated , however we caution that the true may be significantly shifted in low-carrier-density Kondo materials. The ferrimagnetic phase shows comparable band splitting, but is advantageous because its band folding generates additional Weyl nodes. The predicted ferrimagnetic-phase Weyl nodes are well-spaced over a larger energy range, making the Weyl phase and its low energy signatures more robust to band bending. This circumvents the problem of ill-defined chirality that arises from scattering between multiple degenerate Fermi arcs [34] or from Fermi surfaces encompassing multiple Weyl points [8]. We therefore focus our attention experimentally on the ferrimagnetic phase for the remainder of this work.
IV Experimental Results
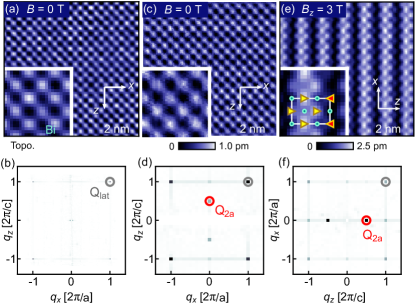
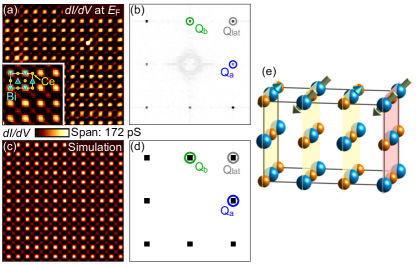
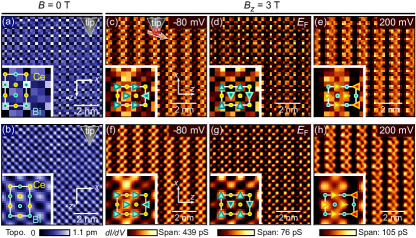
7 Figure 3(a) shows a topography acquired with a non-magnetic PtIr tip. The corresponding Fourier transform (FT) in Fig. 3(b) shows four peaks at , arising from the Ce sublattice (see Fig. 6 ). After gently dunking the tip into the sample, the new topography in Fig. 3(c) shows additional structure, suggesting that the tip has picked up magnetic material, leading to a spin-polarized tunneling current [37, 31]. The magnetic structure manifests in the FT in Fig. 3(d) as two dominant new peaks at , consistent with the expected bulk antiferromagnetic (++) phase that breaks the cubic symmetry of CeBi even in the absence of applied [see also Fig. 1(c)]. To verify the SP nature of the tip, we applied an in-plane field T, perpendicular to the zero-field (++) order, to rotate the magnetic ordering vector of the sample by ninety degrees into the expected (+++) phase, as shown in Fig. 3(e)-3(f) [see also Fig. 1(d)]. Although the tip spin may also realign due to applied , our observations in Fig. 3(c) and 3(e) show that the tip has a component that is co-aligned with the sample magnetization in both cases. This confirms two essential requirements for our study: Our tip is sensitive to the expected magnetic order of CeBi, and we can tune that magnetic order by applying magnetic field.
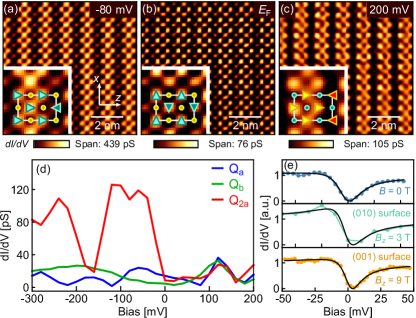
8 To determine the energy-resolved orbital character of the spins in the ferrimagnetic (+++) phase, we mapped the spin-polarized differential conductance, . Figure 4(a)-4(c) shows SP- maps from energies below, at, and above . Away from , we find a high SP-conductance for three neighboring vertical columns and a low SP-conductance for one column, as expected in the (+++) ferrimagnetic phase. Surprisingly, comparison of the simultaneously-acquired images in Figs. 4(a) and 4(c) reveals that the magnetic contrast has shifted from the Ce lattice sites above to the Bi lattice sites below . These induced magnetic moments on the Bi sites are co-aligned with the underlying magnetic pattern of the localized, unrenormalized Ce states, which have been observed eV below by ARPES [27]. Our evidence of orbital hybridization agrees with our DFT prediction of a Bi magnetic moment of .
9 We plot the intensity of the magnetic Bragg peaks vs. energy in Fig. 4(d). The peak is dominant at negative energies, but strongly suppressed at , and recovers only weakly above . This evolution is also apparent in the colorscale spans of the SP- maps. While the (+++) pattern of induced magnetic moments is dominant at and meV in Figs. 4(a) and 4(c), the map at in Fig. 4(b) shows a different motif with maxima on every second Bi atom. We speculate that this (++) structure may be caused by a residual out-of-plane ordering of surface spins (see Fig. 8). The suppression of the intensity also coincides with a phase flip of the real-space pattern (see Fig. 6).
10 Kondo screening can arise from hybridization, as suggested by previous Hall effect and ARPES measurements [38, 27], so we search for its possible signatures in spectroscopy. Fig. 4(e) shows three spatially-averaged spectra around in the (++), (+++), and fully-polarized phases. All spectra have a similar shape with a shoulder around meV and a dip near , characteristic of the asymmetric Fano line shape describing a Kondo resonance,
| (1) |
where is the energy of the localized many-body resonance (which we find to be consistent with ; see Table 1), is the Fano factor that describes the tunnelling ratio between the localized state and the itinerant conduction electrons, and is proportional to the hybridization between the localized and itinerant states [39]. Similar line shapes have been observed in other Kondo lattice systems such as YbRh2Si2 [40], URu2Si2 [41], and SmB6 [5]. In all three magnetic phases of CeBi, we find meV, consistent with a resistivity upturn at 100 K, above the Néel temperature [19]. However, the large residual at the Fano minimum (see Fig. 9) suggests that only of the conduction electrons participate in Kondo screening in CeBi, consistent with the local-moment-like behavior of the Ce sublattice [18, 19].
11 In CeBi the itinerant electrons closest to are of both Ce and Bi character, so we do not know a priori which itinerant states participate in the partial Kondo screening of Ce moments. However, the disappearance of (+++) order from the Bi sites at is consistent with the involvement of Bi states in Kondo singlet formation. Furthermore, the Kondo resonance is facilitated by the shared symmetry of the Bi orbitals and the Ce multiplet [42, 36], while hybridization is forbidden on-site. We thus conclude that the Bi states are the primary conduction electrons that couple to the Ce moments and participate in the formation of Kondo singlets.
12 Fig. 4 highlights several competing interactions in CeBi. First, the Fano lineshape in our spectra suggests a Kondo resonance in which some conduction electrons anti-align with and partially screen the local moments. However, the observed shift of the same (+++) order from the Ce sites in Fig. 4(c) to the Bi sites in Fig. 4(a) demonstrates that the induced magnetic moments on the Bi states are co-aligned with the local moments. These opposite magnetic interactions compete for the same states. Second, long-range order can arise when localized moments couple to each other via the polarized conduction electrons, through the Ruderman-Kittel-Kasuya-Yosida (RKKY) interaction. The competition between the screening of the local moments (Kondo) and formation of long-range magnetic order (RKKY) is typically determined by both the conduction () electron density and the coupling [14, 16]. However, we observe long-range order in Figs. 4(a) and 4(c) coexisting with the Kondo resonance in Fig. 4(e). Our data suggests that these competing interactions in CeBi each dominate at separate energies, in contrast with CeSb where the simultaneous observation of Kondo screening and long-range order has been explained by phase separation in momentum space [25].
13
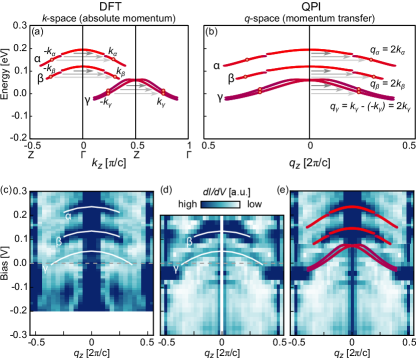
To determine the effect of hybridization on the predicted Weyl fermion bands in the CeBi (+++) phase, Fig. 5(a) shows our quasiparticle interference (QPI) measurement of the band dispersion along . The dominant QPI features show excellent agreement with the calculated bands of majority Bi orbital character shown in Fig. 5(b). From this band assignment, we make several observations. First, the QPI-observed and bands support the DFT-predicted 100 meV splitting of the hole-like Bi band around into () at 230 meV and () at 120 meV, consistent with the formation of induced magnetic moments on the Bi sites by orbital hybridization.
Second, the QPI-observed band can be attributed to scattering across the BZ boundary between the folded portion of the same Bi band. However, the QPI-observed band is meV higher than the corresponding DFT-predicted band, supporting a scenario of hybridization that renormalizes (flattens) the band and the band of mixed character that makes up half of the Fermi-level Weyl cone. We thus infer that the Weyl cones of CeBi are strongly renormalized compared to the DFT calculations, consistent with the enhanced effective mass of observed in quantum oscillation experiments on CeSb [43]. DFT calculations notoriously underestimate band-renormalization effects in strongly interacting materials, so our QPI experiment serves as a crucial reality check.
V Conclusion
14 Weyl cones are expected to be robust under renormalization, which can spread their position in momentum space but not lift the degeneracy of the requisite crossings [44]. Neither nor hybridization yields an exact realization of the proposed Weyl-Kondo semimetal [6], in which the electrons are directly involved in the formation of the Weyl cones. However, our work shows (i) induced magnetic moments on the Bi states, co-aligned with the local Ce moments, from spin-polarized images of the (+++) order on the Bi sites; (ii) hybridization from spectroscopy of the Fano resonance; (iii) 100 meV band splitting from QPI that confirms hybridization and TRS breaking; (iv) and band flattening from QPI. This comprehensive evidence supports a consistent picture of CeBi as a strongly interacting magnetic Weyl semimetal.
Acknowledgements
We thank Jason Hoffman, Robert Jan-Slager, Daniel Mazzone for insightful discussions. Experimental and theoretical work was supported by the Center for the Advancement of Topological Semimetals (CATS), an Energy Frontier Research Center funded by the U.S. Department of Energy (DOE), Office of Science, Basic Energy Sciences (BES) through the Ames Laboratory under its Contract No. DE-AC02-07CH11358. H.P. was funded by the Gordon and Betty Moore Foundation’s EPiQS Initiative through Grant GBMF4536. C.E.M. was supported by the Swiss National Science Foundation under fellowships P2EZP2_175155 and P400P2_183890. The theory work was carried out under the auspices of the U.S. DOE National Nuclear Security Administration under Contract No. 89233218CNA000001. C.L. was supported by Los Alamos National Laboratory (LANL) LDRD Program. The theory was also supported in part by the Center for Integrated Nanotechnologies, a DOE BES user facility, in partnership with the LANL Institutional Computing Program for computational resources.
Appendix A Surface atom and spin identification
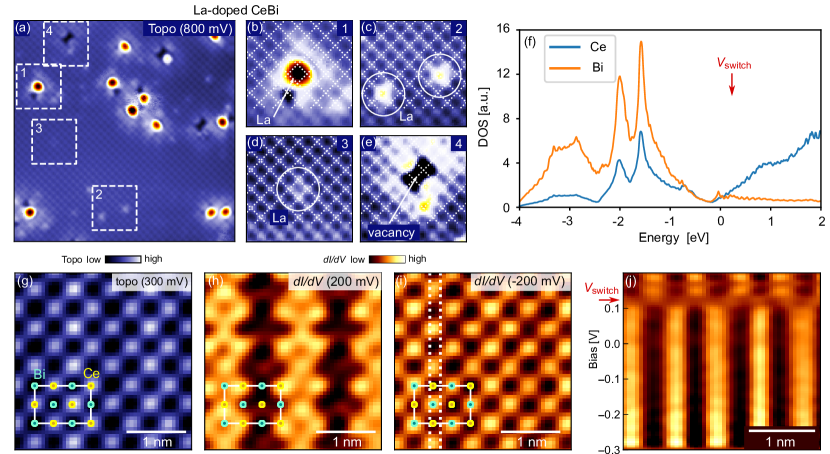
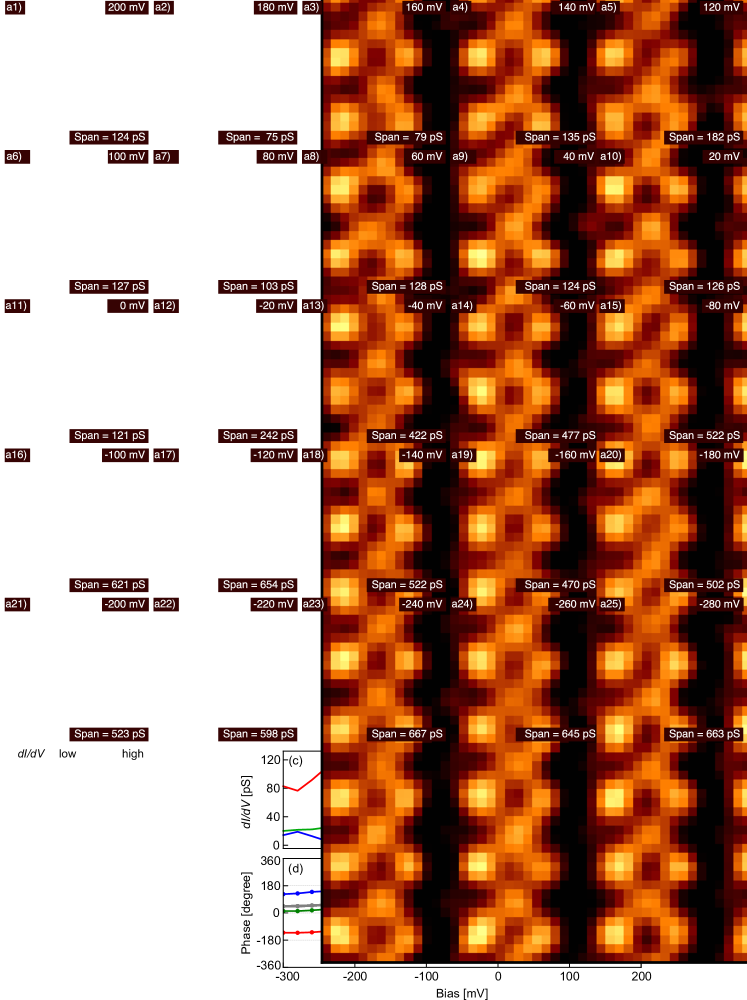
To identify the atomic sublattice imaged in Figs. 3 and 4, we investigated La-doped CeBi samples, where La is expected to replace Ce. Measurements and DFT calculations in Fig. 6 show that at large positive bias voltage we are tunneling predominantly into Ce sites, while below V we are tunneling predominantly into Bi sites. Fig. 7 shows the full energy dependence of the spin-polarized maps in Fig. 4. Fig. 8(a) shows a second spin-polarized map at the Fermi level, acquired with identical measurement parameters as Fig. 7(a11) but with different tip termination. Together, Figs. 7(a11) and 8(a) suggest a canting of the surface spins.
The Fermi level map in Fig. 8(a) shows a pattern with maxima on every second Bi atom, which is different from the (+++) pattern of the bulk magnetic moments expected from the phase diagram of Fig. 1(d). This Fermi level corresponds to dominant and magnetic Bragg peaks, as shown in Fig. 8(b). Figure 7(c) shows a corresponding suppression of the Bragg peak associated with the (+++) order for energies close to the Fermi level. The suppression of the intensity also coincides with a phase flip of the real-space pattern in Fig. 7(a). The suppression of at the Fermi level implies that the (++) pattern seen at that energy is not connected to the (+++) order, but of different origin. We suggest that this (++) structure might be caused by a residual out-of-plane ordering of surface spins, as sketched in Fig. 8(e), and simulated in Figs. 8(c)-(d).
Appendix B Kondo lineshape
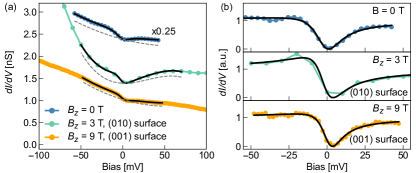
Figure 9(a) shows the spatially-averaged raw spectra around in the (++), (+++), and fully-polarized phase from which we subtracted the background (gray dashed lines) to obtain the Fano lineshapes shown in Fig. 4(e), and re-displayed here in Fig. 9(b). The qualitative features of the Fano lineshape, with a shoulder around meV and a dip near , are apparent in the raw spectra. But to quantify the Fano lineshape parameters in Table 1, we fit Eqn. 1 added to a polynomial background. By comparing the residual conductance at with the shoulder around meV in Fig. 9(a), it can be seen that only of the conduction electrons participate in the Kondo screening. Furthermore, the point spectra in Fig. 10 recorded in the antiferromagnetic ground state ( T) and in the ferrimagnetic state ( T) all show a Fano-like lineshape with only slight spatial variation at larger binding energies due to the magnetic order.
| [meV] | [meV] | [K] | ||||||
| T | 10.2 | 4 | 4 | 118.37 | ||||
| T | 8.8 | 10 | 10 | 102.12 | ||||
| T | 7.7 | 2.5 | 0.8 | 2.5 | 98.35 | |||
Appendix C Comparing DFT to QPI
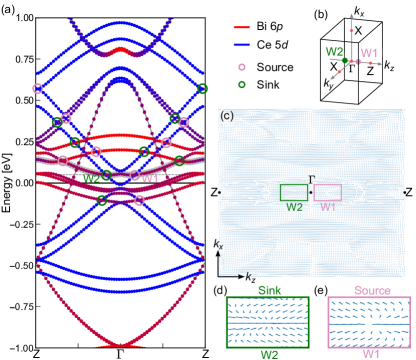
Figure 11(a) shows our DFT calculation of the band structure in the ferrimagnetic (+++) phase of CeBi, over a larger energy range than in Fig. 2(d). To find the Weyl nodes, we calculate the Berry curvature at each crossing, and circle the sources (pink) and sinks (green). In Figs. 11(c-e) we plot the Berry curvature of the Weyl points W1 and W2 closest to the Fermi level.
We investigate the band structure experimentally by imaging quasiparticle interference (QPI), which probes elastic momentum transfer, predominantly originating from intra-band scattering, as shown in Fig. 12(a). Therefore, all scattering vectors appear around in a QPI measurement, as shown in Fig. 12(b). Figure 12(c) and 12(d) show energy vs. dispersion along the direction measured in two different energy ranges with similar setup conditions. The two datasets are combined in Figs. 5(a) and 12(e), where we overlay the calculated band dispersion (, , ) from the Bi orbitals. After a slight upshift of the band, presumably caused by electron correlations, we find a good agreement between our DFT calculations and our QPI measurements.
Appendix D Zero padding
In order to improve atomic visibility, the following maps were interpolated by Fourier-transforming, zero-padding the FT, then inverting the FT: Fig. 3(a), Fig. 4(a)-(c), Fig. 6(f)-(j), Fig. 7(a), Fig. 8(a), Fig. 10(a), and Fig. 10(d). The comparison between raw and interpolated data is shown in Fig. 13.
References
- Maciejko and Fiete [2015] J. Maciejko and G. A. Fiete, Fractionalized topological insulators, Nature Physics 11, 385 (2015).
- Tokura et al. [2017] Y. Tokura, M. Kawasaki, and N. Nagaosa, Emergent functions of quantum materials, Nature Physics 13, 1056 (2017).
- Rachel [2018] S. Rachel, Interacting topological insulators, Reports on Progress in Physics 81, 116501 (2018).
- Dzero et al. [2010] M. Dzero, K. Sun, V. Galitski, and P. Coleman, Topological Kondo insulators, Phys. Rev. Lett. 104, 106408 (2010).
- Pirie et al. [2020] H. Pirie, Y. Liu, A. Soumyanarayanan, P. Chen, Y. He, M. M. Yee, P. F. S. Rosa, J. D. Thompson, D.-J. Kim, Z. Fisk, X. Wang, J. Paglione, D. K. Morr, M. H. Hamidian, and J. E. Hoffman, Imaging emergent heavy Dirac fermions of a topological Kondo insulator, Nature Physics 16, 52 (2020).
- Lai et al. [2018] H.-H. Lai, S. E. Grefe, S. Paschen, and Q. Si, Weyl-Kondo semimetal in heavy-fermion systems, Proceedings of the National Academy of Sciences 115, 93 (2018).
- Armitage et al. [2018] N. P. Armitage, E. J. Mele, and A. Vishwanath, Weyl and Dirac semimetals in three dimensional solids, Reviews of Modern Physics 90, 015001 (2018).
- Arnold et al. [2016] F. Arnold, C. Shekhar, S.-C. Wu, Y. Sun, R. D. dos Reis, N. Kumar, M. Naumann, M. O. Ajeesh, M. Schmidt, A. G. Grushin, J. H. Bardarson, M. Baenitz, D. Sokolov, H. Borrmann, M. Nicklas, C. Felser, E. Hassinger, and B. Yan, Negative magnetoresistance without well-defined chirality in the Weyl semimetal TaP, Nature Communications 7, 11615 (2016).
- Morali et al. [2019] N. Morali, R. Batabyal, P. K. Nag, E. Liu, Q. Xu, Y. Sun, B. Yan, C. Felser, N. Avraham, and H. Beidenkopf, Fermi-arc diversity on surface terminations of the magnetic Weyl semimetal Co3Sn2S2, Science 365, 1286 (2019).
- Liu et al. [2019] D. F. Liu, A. J. Liang, E. K. Liu, Q. N. Xu, Y. W. Li, C. Chen, D. Pei, W. J. Shi, S. K. Mo, P. Dudin, T. Kim, C. Cacho, G. Li, Y. Sun, L. X. Yang, Z. K. Liu, S. S. P. Parkin, C. Felser, and Y. L. Chen, Magnetic Weyl semimetal phase in a Kagomé crystal, Science 365, 1282 (2019).
- Belopolski et al. [2019] I. Belopolski, K. Manna, D. S. Sanchez, G. Chang, B. Ernst, J. Yin, S. S. Zhang, T. Cochran, N. Shumiya, H. Zheng, B. Singh, G. Bian, D. Multer, M. Litskevich, X. Zhou, S.-M. Huang, B. Wang, T.-R. Chang, S.-Y. Xu, A. Bansil, C. Felser, H. Lin, and M. Z. Hasan, Discovery of topological Weyl fermion lines and drumhead surface states in a room temperature magnet, Science 365, 1278 (2019).
- Kuroda et al. [2017] K. Kuroda, T. Tomita, M.-T. Suzuki, C. Bareille, A. A. Nugroho, P. Goswami, M. Ochi, M. Ikhlas, M. Nakayama, S. Akebi, R. Noguchi, R. Ishii, N. Inami, K. Ono, H. Kumigashira, A. Varykhalov, T. Muro, T. Koretsune, R. Arita, S. Shin, T. Kondo, and S. Nakatsuji, Evidence for magnetic Weyl fermions in a correlated metal, Nature Materials 16, 1090 (2017).
- Šmejkal et al. [2018] L. Šmejkal, Y. Mokrousov, B. Yan, and A. H. MacDonald, Topological antiferromagnetic spintronics, Nature Physics 14, 242 (2018).
- Doniach [1977] S. Doniach, The Kondo lattice and weak antiferromagnetism, Physica B+C 91, 231 (1977).
- Si and Steglich [2010] Q. Si and F. Steglich, Heavy fermions and quantum phase transitions, Science 329, 1161 (2010).
- Coleman [2015] P. Coleman, Introduction to Many-Body Physics (Cambridge University Press, Cambridge, 2015).
- Suzuki [1993] T. Suzuki, Heavy fermion state in low carrier concentration systems for rare earth pnictides and chalcogenides, Physica B: Condensed Matter 186-188, 347 (1993).
- Bartholin et al. [1979] H. Bartholin, P. Burlet, S. Quezel, J. Rossat-Mignod, and O. Vogt, Hydrostatic pressure effects and neutron diffraction studies of CeBi phase diagram, Le Journal de Physique Colloques 40, C5 (1979).
- Kuthanazhi et al. [2021] B. Kuthanazhi, N. H. Jo, L. Xiang, S. L. Bud’ko, and P. C. Canfield, Magnetisation and magneto-transport measurements on CeBi single crystals, Philosophical Magazine 10.1080/14786435.2021.2009136 (2021).
- Hulliger et al. [1975] F. Hulliger, M. Landolt, H. R. Ott, and R. Schmelczer, Low-temperature magnetic phase transitions of CeBi and CeSb, Journal of Low Temperature Physics 20, 269 (1975).
- Fang et al. [2020] Y. Fang, F. Tang, Y. R. Ruan, J. M. Zhang, H. Zhang, H. Gu, W. Y. Zhao, Z. D. Han, W. Tian, B. Qian, X. F. Jiang, X. M. Zhang, and X. Ke, Magnetic-field-induced nontrivial electronic state in the Kondo-lattice semimetal CeSb, Physical Review B 101, 094424 (2020).
- Guo et al. [2017] C. Guo, C. Cao, M. Smidman, F. Wu, Y. Zhang, F. Steglich, F.-C. Zhang, and H. Yuan, Possible Weyl fermions in the magnetic Kondo system CeSb, npj Quantum Materials 2, 39 (2017).
- Kuroda et al. [2018] K. Kuroda, M. Ochi, H. S. Suzuki, M. Hirayama, M. Nakayama, R. Noguchi, C. Bareille, S. Akebi, S. Kunisada, T. Muro, M. D. Watson, H. Kitazawa, Y. Haga, T. K. Kim, M. Hoesch, S. Shin, R. Arita, and T. Kondo, Experimental determination of the topological phase diagram in cerium monopnictides, Physical Review Letters 120, 086402 (2018).
- Huang et al. [2020] Z. Huang, C. Lane, C. Cao, G.-X. Zhi, Y. Liu, C. E. Matt, B. Kuthanazhi, P. C. Canfield, D. Yarotski, A. J. Taylor, and J.-X. Zhu, Prediction of spin polarized fermi arcs in quasiparticle interference in CeBi, Physical Review B 102, 235167 (2020).
- Jang et al. [2019] S. Jang, R. Kealhofer, C. John, S. Doyle, J.-S. Hong, J. H. Shim, Q. Si, O. Erten, J. D. Denlinger, and J. G. Analytis, Direct visualization of coexisting channels of interaction in CeSb, Science Advances 5, eaat7158 (2019).
- Takahashi and Kasuya [1985] H. Takahashi and T. Kasuya, Anisotropic - mixing mechanism explaining anomalous magnetic properties in Ce monopnictides, Journal of Physics C: Solid State Physics 18, 2745 (1985).
- Li et al. [2019] P. Li, Z. Wu, F. Wu, C. Guo, Y. Liu, H. Liu, Z. Sun, M. Shi, F. Rodolakis, J. L. McChesney, C. Cao, H. Yuan, F. Steglich, and Y. Liu, Large Fermi surface expansion through anisotropic mixing of conduction and electrons in the semimetallic Kondo lattice CeBi, Physical Review B 100, 155110 (2019).
- Blaha et al. [2020] P. Blaha, K. Schwarz, F. Tran, R. Laskowski, G. K. H. Madsen, and L. Marks, Wien2k An APW+lo program for calculating the properties of solids., Journal of Chemical Physics 152, 074101 (2020).
- Blaha et al. [2018] P. Blaha, K. Schwarz, G. K. H. Madsen, D. Kvasnicka, J. Luitz, R. Laskowsk, F. Tran, and L. Marks, Wien2k: An augmented plane wave plus local orbitals program for calculating crystal properties (2018).
- Krönlein et al. [2018] A. Krönlein, M. Schmitt, M. Hoffmann, J. Kemmer, N. Seubert, M. Vogt, J. Küspert, M. Böhme, B. Alonazi, J. Kügel, H. A. Albrithen, M. Bode, G. Bihlmayer, and S. Blügel, Magnetic Ground State Stabilized by Three-Site Interactions: FeRh(111), Physical Review Letters 120, 207202 (2018).
- Enayat et al. [2014] M. Enayat, Z. Sun, U. R. Singh, R. Aluru, S. Schmaus, A. Yaresko, Y. Liu, C. Lin, V. Tsurkan, A. Loidl, J. Deisenhofer, and P. Wahl, Real-space imaging of the atomic-scale magnetic structure of Fe1+yTe, Science 345, 653 (2014).
- Loth et al. [2010] S. Loth, K. von Bergmann, M. Ternes, A. F. Otte, C. P. Lutz, and A. J. Heinrich, Controlling the state of quantum spins with electric currents, Nature Physics 6, 340 (2010).
- [33] C. E. Matt, Y. Liu, H. Pirie, N. C. Drucker, N. H. Jo, B. Kuthanazhi, Z. Huang, C. Lane, J.-X. Zhu, P. C. Canfield, and J. E. Hoffman, Dataset for publication ”spin-polarized imaging of strongly interacting fermions in the ferrimagnetic state of the Weyl candidate CeBi”, The Materials Data Facility (2022), doi: 10.18126/9XRK-RBA3.
- Xu et al. [2015] S.-Y. Xu, I. Belopolski, N. Alidoust, M. Neupane, G. Bian, C. Zhang, R. Sankar, G. Chang, Z. Yuan, C.-C. Lee, S.-M. Huang, H. Zheng, J. Ma, D. S. Sanchez, B. Wang, A. Bansil, F. Chou, P. P. Shibayev, H. Lin, S. Jia, and M. Z. Hasan, Discovery of a Weyl fermion semimetal and topological Fermi arcs, Science 349, 613 (2015).
- Zheng et al. [2016] H. Zheng, S.-Y. Xu, G. Bian, C. Guo, G. Chang, D. S. Sanchez, I. Belopolski, C.-C. Lee, S.-M. Huang, X. Zhang, R. Sankar, N. Alidoust, T.-R. Chang, F. Wu, T. Neupert, F. Chou, H.-T. Jeng, N. Yao, A. Bansil, S. Jia, H. Lin, and M. Z. Hasan, Atomic-scale visualization of quantum interference on a Weyl semimetal surface by scanning tunneling microscopy, ACS Nano 10, 1378 (2016).
- Kasuya et al. [1993] T. Kasuya, Y. Haga, Y. Kwon, and T. Suzuki, Physics in low carrier strong correlation systems, Physica B: Condensed Matter 186-188, 9 (1993).
- Wiesendanger [2009] R. Wiesendanger, Spin mapping at the nanoscale and atomic scale, Reviews of Modern Physics 81, 1495 (2009).
- Kitazawa et al. [1985] H. Kitazawa, I. Oguro, M. Hirai, Y. Kondo, T. Suzuki, and T. Kasuya, Super dense Kondo states in CeSb and CeBi, Journal of Magnetism and Magnetic Materials 47-48, 532 (1985).
- Fano [1961] U. Fano, Effects of configuration interaction on intensities and phase shifts, Physical Review 124, 1866 (1961).
- Ernst et al. [2011] S. Ernst, S. Kirchner, C. Krellner, C. Geibel, G. Zwicknagl, F. Steglich, and S. Wirth, Emerging local Kondo screening and spatial coherence in the heavy-fermion metal YbRh2Si2, Nature 474, 362 (2011).
- Schmidt et al. [2010] A. R. Schmidt, M. H. Hamidian, P. Wahl, F. Meier, A. V. Balatsky, J. D. Garrett, T. J. Williams, G. M. Luke, and J. C. Davis, Imaging the Fano lattice to ‘hidden order’ transition in URu2Si2, Nature 465, 570 (2010).
- Heer et al. [1979] H. Heer, A. Furrer, W. Halg, and O. Vogt, Neutron spectroscopy in the cerium monopnictides, Journal of Physics C: Solid State Physics 12, 5207 (1979).
- Settai et al. [1994] R. Settai, T. Goto, S. Sakatume, Y. S. Kwon, T. Suzuki, Y. Kaneta, and O. Sakai, Observation of heavy hole state in CeSb, Journal of the Physical Society of Japan 63, 3026 (1994).
- Witczak-Krempa et al. [2014] W. Witczak-Krempa, G. Chen, Y. B. Kim, and L. Balents, Correlated quantum phenomena in the strong spin-orbit regime, Annual Review of Condensed Matter Physics 5, 57 (2014).