The VVV Near-IR Galaxy Catalogue beyond the Galactic disk
Abstract
Knowledge about the large-scale distribution of galaxies is far from complete in the Zone of Avoidance, which is mostly due to high interstellar extinction and to source confusion at lower Galactic latitudes. Past near-infrared (NIR) surveys, such as the Two Micron All Sky Survey (2MASS), have shown the power of probing large-scale structure at these latitudes. Our aim is to map the galaxy distribution across the Southern Galactic plane using the VISTA Variables in the Vía Láctea Survey (VVV), which reach 2 to 4 magnitudes deeper than 2MASS. We used SExtractor+PSFEx to identify extended objects and to measure their sizes, the light concentration index, magnitudes, and colours. Morphological and colour constraints and visual inspection were used to confirm galaxies. We present the resulting VVV NIR Galaxy Catalogue of 5563 visually confirmed galaxies, of which only 45 were previously known. This is the largest catalogue of galaxies towards the Galactic plane, with 99% of these galaxies being new discoveries. We found that the galaxy density distribution closely resembled the distribution of low interstellar extinction of the existing NIR maps. We also present a description of the 185 2MASS extended sources observed in the region, of which 16% of these objects had no previous description, which we have now classified. We conclude that interstellar extinction and stellar density are the main limitations for the detection of background galaxies in the Zone of Avoidance. The VVV NIR Galaxy Catalogue is a new data set providing information for extragalactic studies in the Galactic plane.
keywords:
surveys – catalogues – infrared: galaxies – galaxies: photometry1 Introduction
The identification of galaxies behind the Milky Way (MW) is a difficult task, due to the obscuring effects of both dust and stars, and also the high stellar crowding at low Galactic latitudes (Kraan-Korteweg & Lahav 2000). The hidden galaxies can contribute to the identification of large-scale structures beyond our Galaxy (Huchra et al., 2012; Macri et al., 2019), as these allow us to obtain complete luminosity, mass and density distributions that can be tested against the models of galaxy and structure formation (Peebles, 1980; Klypin et al., 1993).
At optical wavelengths, systematic searches for galaxies towards the obscured regions in our Galaxy have been performed to reduce the effects of the Zone of Avoidance (ZoA). Kraan-Korteweg & Woudt (1999), Kraan-Korteweg (2000) and Woudt & Kraan-Korteweg (2001) presented the first deep optical search for galaxies using the object´s diameter for the selection of candidates behind the MW, with these authors identifying overdensities and filaments of galaxies that might be related to possible extragalactic large-scale structures.
The use of NIR surveys minimizes the effects of foreground extinction in the ZoA in comparison with optical passbands. The Two Micron All Sky Survey (2MASS; Skrutskie et al. 2006) produced images in the , , and NIR passbands, while Jarrett et al. (2000a) developed an algorithm to detect and characterize extended sources in the 2MASS catalogue. The procedure to separate point sources from extended sources includes tracking the point-spread function, image background removal, photometry and object classification, using a decision tree technique which takes into account the radial shape, surface brightness and symmetry parameters of the sources. Near the Galactic plane (|| 3∘), the extended sources are dominated by galaxies, Galactic HII regions and large low surface brightness nebulae, stellar clusters and multiple stars. The main science products of this survey are the Point Source Catalog (PSC), consisting of over 500 million stars and galaxies, and the Extended Source Catalog (2MASX) with 1.6 million resolved sources complete to = 13.5 mag, and covering more than 99% of the sky. Jarrett et al. (2000b) reported the detection and spectroscopic confirmation of nearby galaxies hidden behind the MW data in the ZoA. Later, Schröder et al. (2007) performed a visual search for galaxies based on the Deep Near Infrared Survey (DENIS, Epchtein et al. 1997) and compared these results with objects in common with 2MASX. These authors presented a catalogue of 122 galaxies and possible galaxy candidates, including morphological types estimated from the galaxy appearance in the , , and passbands, and total magnitudes and errors derived using the MAG_AUTO magnitudes from SExtractor (Bertin & Arnouts 1996). More recently, Schröder et al. (2019a) presented a homogeneous bright galaxy catalogue of 3763 objects based on the 2MASX survey at latitudes lower than 10∘, with the main goal of obtaining the Tully-Fisher relation to this whole-sky sample.
The 2MASS Redshift Survey (2MRS, Huchra et al. 2005, 2012; Macri et al. 2019) provides redshifts for the 45,640 brightest 2MASS galaxies (extinction-corrected 11.75 mag) in the regions defined as || 5∘ for 30∘ l 330∘ and || 8∘ for other l values. The radial velocities of this survey might be able to contribute to studies of large-scale structures and cosmic flows in this important region of the hidden sky. In this sense, the 2MASS Tully-Fisher survey (2MTF, Masters et al. 2008; Howlett et al. 2017) aims to measure distances of all bright spirals using the TF relation. Finally, Lambert et al. (2020) applied to this catalogue a modification to the traditional Friends-of-Friends algorithm (Huchra & Geller 1982), and found new group candidates that might help to define new large-scale structures in the ZoA.
Staveley-Smith et al. (2016) presented the deep HI survey (HIZOA) in the southern ZoA covering the region of 212∘ 36∘ and || 5∘. These HI surveys allow the study of sources in this region because they suffer minimal foreground extinction or source confusion when compared with optical and NIR surveys. These surveys are complementary, as NIR selection mainly favors the detection of early-type galaxies, while HI surveys the late-types. Sorce et al. (2017) predicted structures towards the ZoA by performing simulations that yielded a probability distribution of galaxies. They then compared their results with a dozen known galaxy clusters, including the presence of the more distant Vela super-cluster (Kraan-Korteweg et al. 2017), and found a remarkable agreement. Finally, Schröder et al. (2019b) presented detections of 170 galaxies in the northern ZoA at || 6∘, of which a third of these had no previous HI observations.
Recent NIR surveys have increased the capacity for detecting extragalactic sources in the ZoA, as shown by Williams et al. (2014), who presented a photometric catalogue of 548 HIZOA galaxies that reach 2 magnitudes deeper than 2MASS in this region. The NIR properties include ellipticities, position angles, isophotal and extrapolated total magnitudes in the three , and NIR passbands. Said et al. (2016) presented a deep NIR catalogue of 915 galaxies from the HIZOA, that includes ellipticities in the passband and isophotal magnitudes at = 20 mag / arcsec2 in the , and passbands. Their main goal was to obtain accurate NIR photometric parameters for the NIR Tully-Fisher analysis. This work is an extension of Williams et al. (2014) with the addition of new observations. The photometric and spectroscopic surveys are primordial to understand the large-scale structure in this complicated region due to the presence of the Milky Way. All the surveys involving NIR data, including 2MASX, 2MRS and 2MTF, and the ’blind’ HI data, such as HIZOA, are complementary. Important structures in the local Universe such as the Great Attractor (for a review of its size and location see Mutabazi et al. 2014) and Norma cluster (Kraan-Korteweg et al. 1996) are found in these regions. The combination of all surveys will allow peculiar velocities to be determined, in order to obtain a better understanding of the local dynamics, the cosmic flow fields and the underlying density field (Kraan-Korteweg et al. 2018).
The VISTA Variables in the Vía Láctea (VVV, Minniti et al. 2010) is a NIR variability survey of the entire MW Bulge and a large portion of the Southern Galactic Disk, with the main scientific goal being to gain more insight into the inner MW’s origin, structure, and evolution. This survey has detected objects that are hidden behind Galactic high extinction regions, and these discoveries include variable stars, brown dwarfs (Beamín et al. 2013), new stellar open clusters (Borissova et al. 2011, 2014; Barbá et al. 2015), and new globular clusters (Minniti et al. 2011, 2017).
In addition to studies of Galactic structure, the VVV survey also offers an excellent opportunity to study extragalactic sources behind the MW, such as background galaxies, active galaxies including quasars and blazars, and groups and clusters of galaxies. In this sense, Amôres et al. (2012) identified 214 galaxy candidates in the d003 tile of the VVV survey ( = 298.356∘, = -1.650∘) behind the Galactic disk, by means of visual inspection and a comparison of their sizes and colours with field stars. Coldwell et al. (2014) confirmed the existence of the X-ray detected galaxy cluster Suzaku J1759-3450 (Mori et al., 2013) at = 0.13 in the b261 tile ( = 356.597∘, = -5.321∘), with the photometry of the sources being obtained using SExtractor (Bertin & Arnouts 1996).
Baravalle et al. (2018) was our first galaxy search study in the reddened and crowded fields located at low Galactic latitudes. We presented a photometric method based on SExtractor+PSFEx (Bertin & Arnouts 1996; Bertin 2011) to identify and characterize extragalactic sources behind the MW disk. The method was tested in the d010 ( = 308.569∘, = -1.649∘) and d115 ( = 295.438∘, = 1.627∘) tiles, and revealed 530 new galaxy candidates. Baravalle et al. (2019) presented the first confirmed galaxy cluster VVV-J144321.06-611753.9 at = 0.234 in the VVV d015 tile ( = 315.836∘, = -1.650∘). The photometry was performed with SExtractor+PSFEx using the Baravalle et al. (2018) procedure, and the selection was based on the Cluster Red Sequence in the colour-magnitude diagrams (Gladders & Yee, 2000).
More recently, Saito et al. (2019) reported that VVV-WIT-04, a NIR variable source, has an extragalactic origin and might be the counterpart of the radio source PMN J1515-5559. Pichel et al. (2020) presented the NIR and mid-IR (MIR) properties of 4 known blazars located in the VVV regions, wich have very different NIR properties in the colour-magnitude and colour-colour diagrams compared with stellar or extragalactic sources, and also exhibit a significant variability in the light curves.
Baravalle et al. (2018) and Baravalle et al. (2019) optimized the photometric procedure in order to identify and characterize extended sources. Here, we used the VVV NIR images across the Southern Galactic disk and we present the photometric catalogue of galaxies in the ZoA. This catalogue will allow the community to pursue a number of different scientific projects such as mapping the total extinction across the Galactic plane, and to recognize clear NIR windows of low interstellar extinction (Minniti et al. 2018; Saito et al. 2020). Other related projects involve associate galaxy hosts for transient sources, including Supernovae, Gamma-ray bursts and gravitational wave events, to search for hidden nearby galaxies at low Galactic latitudes and to identify candidates for compact groups and clusters of galaxies. The paper is organized as follows: Section 2 presents the VVV NIR data, including principally the methodology to identify extragalactic sources and confirmed galaxies, as well as the comparison with other NIR surveys and the correlation with MIR data. Section 3 presents the VVV NIR Galaxy Catalogue in the Southern Galactic disk of the survey and the galaxy distribution map. Section 4 includes the principal conclusions and final remarks.
2 The VVV survey
The NIR observations allow the study of regions at the lower Galactic latitudes, where interstellar extinction is severe. This wavelength regime is less affected by foreground extinction than the optical one. It is also sensitive to early-type galaxies, groups and galaxy clusters, which should be less confused with Galactic objects such as young stellar objects and cool cirrus sources (Schröder et al. 2007).
The VVV survey is a NIR variability public survey of the Galactic bulge (10∘ 350 ∘ and -10∘ +5∘) and an adjacent section of the mid-plane (295∘ 350∘ and -2∘ +2∘) (Minniti et al. 2010). The survey was carried out using the VISTA (Visible and Infrared Survey Telescope for Astronomy) 4m telescope at ESO, which is equipped with a wide-field NIR camera (VIRCAM, Dalton et al. 2006) with a pixel scale of 0.34”/ pixel.
The VVV tiles are produced by six single pointing observations with a total field of view of 1.64 square degrees in the (0.87 m), (1.02 m), (1.25 m), (1.64 m), and (2.14 m) passbands (Saito et al. 2010). The VVV images were taken under varying observing conditions, although in general this effect would be minimal because we use images with seeing 0.9 arcsec in the passbands. The background sky level varies from image to image, and the source density changes with position across the MW disk, depending on the line-of-sight. The survey area is fully covered by 348 tiles in the MW, of which 196 are in the bulge and 152 in the disk regions. In this work, we focused our efforts on the disk parts of 220 deg2 covered by the survey. The images from the Project Programme 179.B-2002 were downloaded from the Cambridge Astronomical Survey Unit111http://casu.ast.cam.ac.uk/vistasp/imgquery/search (CASU, Emerson et al. 2006) with the observing status ’Completed’, with the same exposure time and the smallest observed seeing.
In the future, the VISTA Variables in the Vía Láctea eXtended Survey (VVVX) will triple the areal coverage of the original VVV survey following the same observational strategy. This extended survey, aimed for completion in late 2021, will provide , and astrometric and photometric catalogues reaching similar magnitudes for the extended area, as well as variability information for the passband. The galaxies found in these regions would connect the VVV galaxy distribution with other surveys at higher galactic latitudes.
2.1 The methodology
The algorithm to detect and characterize extragalactic sources using SExtractor (Bertin & Arnouts 1996) and PSFEx (Bertin 2011) has been extensively described in Baravalle et al. (2018). Briefly, SExtractor performs the photometry in the , , , and VVV images and creates catalogues for each passband. PSFEx takes these catalogues and creates the best PSF model by looking for well-defined point sources. Finally, SExtractor applies the PSF model to each source to obtain the astrometric, photometric, and morphological properties.
We applied the custom-built pipeline to the 152 tiles of the Galactic disk region using only the , and images, as most of the galaxies have no light contributions in the and passbands. All detected sources in these passbands were cross-matched taking the passband as a reference, using the maximum object separation of 1 arcsec. In order to discriminate point sources from extended objects, we used magnitudes, the stellar index CLASS_STAR, the SPREAD_MODEL () parameter, the radius that contains 50% of the total flux of an object (), and the concentration index (, Conselice et al. 2000) from the detections. The extended sources have to satisfy the morphological criteria: CLASS_STAR 0.3; 0.002; 1.0 5.0 arcsec and 2.1 5 (Baravalle et al. 2018).
SExtractor performs a clean procedure for any source inside the adaptive aperture, in which the fluxes are integrated by applying a mirroring between one side of the ellipse and the other. Also, the flux is defined by taking into account the threshold that separates the source from the background. The stellar density at lower Galactic latitudes makes it difficult to separate close objects degrading this process, and as this makes the adaptive apertures smaller, the magnitudes are underestimated. In order to minimize this effect, the cases with extreme contamination were not included in this study, which in fact represent a very small percentage of our total sample. The SExtractor photometry allowed us to obtain total magnitude (MAG_AUTO) estimates using the Kron magnitudes (Kron 1980), which represent approximately 94% of the total flux (Bertin & Arnouts 1996). SExtractor+PSFEx provided us with the PSF fitting magnitudes (MAG_PSF), using the PSF model mentioned above, and also the circular aperture magnitudes obtained within a fixed aperture of 2 arcsec diameter to avoid strong stellar contamination. The ( - ), ( - ) and ( - ) colours were then derived from these aperture magnitudes.
2.1.1 Interstellar extinction and stellar density
The extinction at lower Galactic latitudes is high in some parts of the MW. Schlegel et al. (1998) derived extinction maps from the 100 m dust emission by DIRBE/IRAS, which were re-calibrated by Schlafly & Finkbeiner (2011). At |b| 5∘, the presence of contaminating sources was not removed and the reddening reported should be taken with caution (Arce & Goodman 1999; Amôres & Lépine 2005, 2007; Gonzalez et al. 2012; Soto et al. 2013, 2019). Nagayama et al. (2004) studied the distribution of galaxies at low Galactic latitudes (b 1.7∘), and by using a stellar colour-excess technique these authors found a systematic underestimation of AK 0.4 mag in the map of Schlegel et al. (1998). However, despite these concerns, the maps are still widely used to characterize the foreground extinction in studies of the distribution of galaxies in the ZoA. In particular, the work of Schröder et al. (2007), van Driel et al. (2009) and Schröder et al. (2019a) have used the Schlegel et al. (1998) maps to obtain the extinction-corrected magnitudes, and found them to be consistent with the 2MRS and 2MTF surveys. Our magnitudes were corrected by interstellar extinction along the line-of-sight, using the maps of Schlafly & Finkbeiner (2011) and the VVV NIR relative extinction coefficients of Catelan et al. (2011): AJ = 0.280 AV, AH = 0.184 AV and AKs = 0.118 AV. These corrected magnitudes and colours are represented by , and and the colours ( - )∘ and ( - )∘ throughout this work.
2.1.2 False detections and duplicate objects
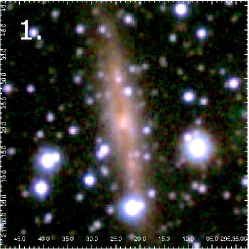
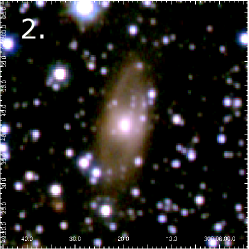
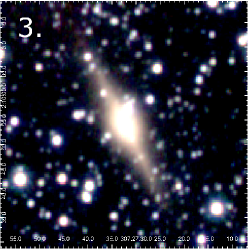
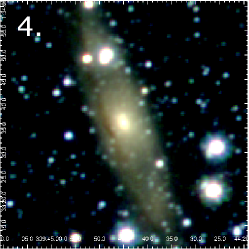
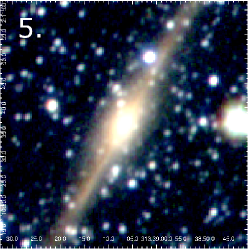
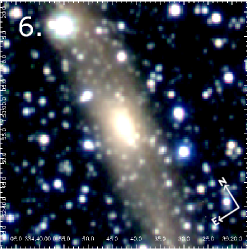
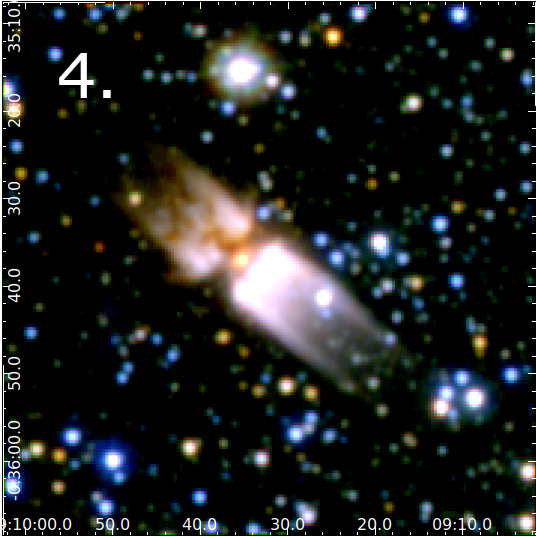
In order to minimize false detections, we also considered colour cuts: 0.5 ( - )∘ 2.0 mag, 0.0 ( - )∘ 1.0 mag, 0.0 ( - )∘ 2.0 mag, and ( - )∘ + 0.9 ( - )∘ 0.44 mag following Baravalle et al. (2018). These cuts provide a good compromise between avoiding the loss of interesting objects and the inclusion of spurious ones, and these are similar to those used in Jarrett et al. (2000a, b) and Amôres et al. (2012). This process classifies these objects as extragalactic candidates, and the final visual inspection allows us to confirm the galaxies. This inspection was performed by four of the authors of the present study for all the candidates by looking at the images in the five passbands of the VVV survey using the VISTA Science Archive (VSA222http://horus.roe.ac.uk/vsa). When any doubts, discrepancies and/or comments arose, we searched for false three-colour images generated from the , and passbands. The combined colour and the extended nature allowed us to distinguish better the true galaxies from false ones. Some objects were also found with important stellar contamination, with Figure 1 showing examples of the largest galaxies detected with strong stellar contamination. These objects were also observed by the 2MASX survey. In our first investigation (Baravalle et al. 2018), we tried to mask nearby stars and to correct galaxy magnitudes. However, the strong contamination affected more than half of the galaxy light contributions and made it difficult to obtain accurate magnitude estimates. Thus, the results were in general not reliable, and we decided not to correct in the present study for stellar contamination. In addition, the cases with a high number of nearby stars, especially those for small objects, were not considered in this work. In contrast, the cases with little contamination were included in the analysis without any correction, resulting in brighter magnitudes. Following Baravalle et al. (2018), we obtained the photometric and structural parameters of these galaxies, including the , , ellipticity and the spheroid Sérsic index (, Sersic 1968).
Appendix A includes useful information that characterizes the VVV tiles of the Galactic disk. For all the tiles, the median interstellar extinctions using the values close to the extended sources, extragalactic sources and galaxies are AKs = 1.423 mag, 0.656 mag and 0.710 mag, respectively. In general, the extended objects are distributed across the tiles, and the extragalactic sources and galaxies were found mainly in the regions with lower interstellar extinctions. We also used the stellar density defined as the logarithm of the number of stars with 15 mag per square degrees, using the PSF photometry of Alonso-García et al. (2018).
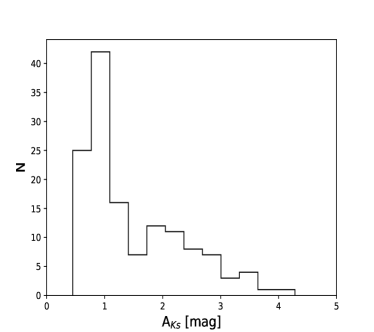
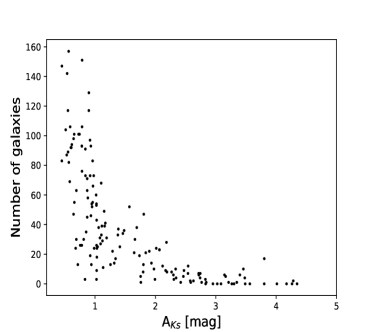
Figure 2 shows the distribution of median AKs interstellar extinctions defined by extended sources in the upper panels, and displays the stellar densities in the bottom panels. The distributions are presented in the left panels, and the number of detected galaxies per tile as a function of these median AKs interstellar extinctions and stellar densities is shown in the right panels. At lower interstellar extinctions (AKs 1 mag), the highest number of detected galaxies is 157, while for 1 AKs 3 mag, the number drops from 68 to 1. The median stellar density in the VVV disk, given by log (N∗/deg2), is 5.066 0.167, which is higher than the peak of the distribution of about 4.5 reported by Schröder et al. (2019a) in the ZoA sample. These results show severe contamination in our studied regions. As expected, as shown in the right panels, the highest number of galaxy detections were obtained in the outermost parts of the disk and the lowest values were found in regions with high interstellar extinction and stellar contamination. No extragalactic candidates were detected in the d100, d108 or d110 tiles. After the visual inspections, all the extragalactic sources in the d065, d069, d070, d071, d072, d073, d099, d100, d101, d102, d108, d109, d110, d112 and d114 tiles were classified as false detections. These regions have lower Galactic latitudes and mainly higher interstellar extinctions, with star crowding being extreme with median A values from 3 mag up to 6.19 mag and logarithmic stellar densities from 5.055 up to 5.384. On the other hand, more than 150 galaxies were found in the d022 and d122 tiles, with lower interstellar extinctions of 0.56 and 0.79 mag and logarithmic stellar densities of 5.093 and 4.799, respectively.
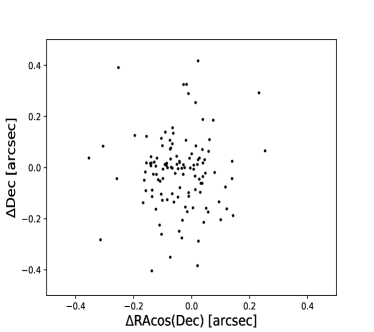
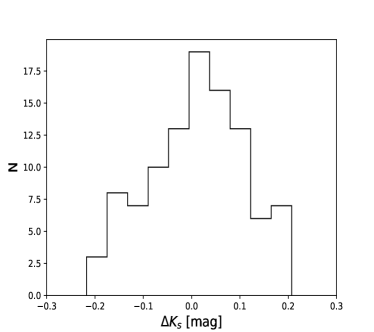
We also have repeated objects, mostly found in the overlapping tile boundaries due to the observing procedure and tile construction. Within the angular separations of 0.75 arcsec, 122 duplicated galaxies were found. Figure 3 shows the differences in the coordinates and magnitudes for these duplicated sources. The median differences after 1–clipping are RA cos(Dec) = (-0.062 0.060) arcsec, Dec = (0.009 0.066) arcsec and = (0.009 0.102) mag. These values might be considered the uncertainty estimates for the astrometry and photometry.
2.1.3 Photometric results
The different NIR photometric systems in general did not match exactly, as was expected, given that the observations were carried out at different sites with different telescopes, IR cameras, detectors and filters. We used the photometric transformations detailed in Soto et al. (2013) to translate our magnitudes to the 2MASS photometric system. The transformations were obtained on a tile by tile basis, and these were based on the selection of stars with a good photometry. Briefly, the procedure can be summarized as follows: First, the VVV photometry was used to clean the CASU catalogue of non-stellar sources by selecting stars in a specific intensity range, weighted by second moments. Subsequently, stars in relative isolation were selected by using a radius of 2 arcsec to remove multiple sources in close proximity. This VVV catalogue was then cross-referenced with 2MASS sources, with the signal to noise ratio greater than 7, and the result was then matched with the VVV catalogue with a small radius of 0.1 arcsec in the and passbands. The resulting clean VVV-2MASS catalogue was then used to derive the photometric transformations using a linear fit with an iterative clipping algorithm and adaptive bins. The VVV aperture and total magnitudes of the detected galaxies in the Galactic disk were transformed to the 2MASS photometric system using Soto et al. (2013).
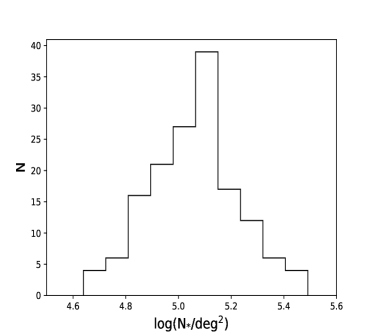
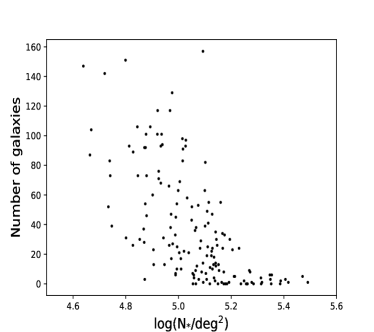
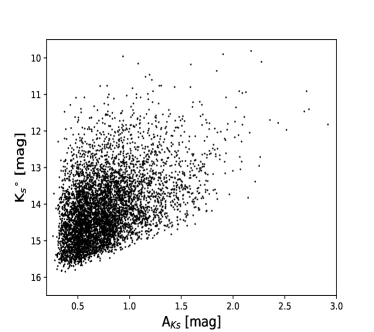
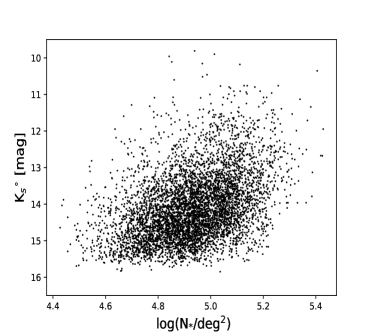
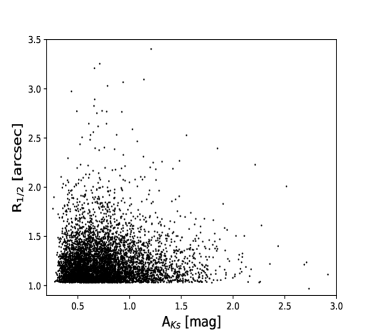
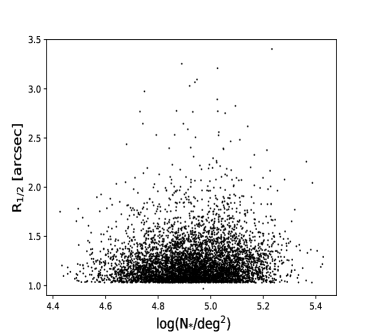
For the detected galaxies, Figure 4 shows the magnitudes and the half-light radius as a function of the AKs interstellar extinctions and stellar densities. The estimated stellar density was defined here as the number of stars with 15 mag in an area of 43 arcmin2 around each galaxy scaled to an area of 1 deg2. The median value is log(N/deg2) = 4.933 0.154, which as expected was significantly larger than the values reported in surveys based on the 2MASS data that cover higher Galactic latitudes. It is clear that we reached magnitudes of about 15.5 mag in regions with lower interstellar extinctions and stellar densities. In all, 96% of the detections had an value of about 1.18 arcsec for AKs interstellar extinctions smaller than 1.5 mag, which then reached median values of 1.22 arcsec. We saw a tendency for brighter galaxies to be observed in regions which displayed higher stellar densities, while at the same time, the size of the detected galaxies did not reveal a clear correlation. In Baravalle et al. (2018), we analysed the completeness of the photometry for the two studied tiles: d010 and d115. At = 15.5 mag, we attained a completeness of 80 and 95% (see their Figure 3) for these tiles, respectively. Comparing the extinctions, the d115 tile had the lowest AKs values. A conservative completeness of 80% might be estimated at these faint magnitude levels. These results show that both interstellar extinction and stellar density are the main limitations and critical concerns for the detection of galaxies at these low Galactic latitudes.
2.2 Comparison with NIR surveys
Over the VVV disk region, 185 extended sources from the 2MASX were recovered and visually checked. These comprise 21 galaxies and 164 Galactic objects that are: bright single and double stars or stellar associations and gas and dust regions. In Appendix B, we describe these 2MASX sources by dividing them into these categories. We found that about 16% of the Galactic objects have no previous description in the literature. Our galaxies were cross-matched with the 21 galaxies detected by 2MASX using angular separations of about 2 arcsec. Some examples of the common galaxies between the two surveys are shown in Figure 1. The median astrometric differences after 1–clipping between the positions of the VVV galaxies and 2MASX are very small: RA cos(Dec) = (0.087 0.333) arcsec and Dec = (0.036 0.372) arcsec. The galaxies with higher differences are those with a strong contamination by nearby stars.
In this VVV region, there are 22 galaxies reported from Schröder et al. (2007), 41 from Williams et al. (2014), 46 from Said et al. (2016) and 19 from Schröder et al. (2019a). Of these galaxies, we have 12 galaxies in common with Schröder et al. (2007), 20 with Williams et al. (2014), 22 with Said et al. (2016) and 19 with Schröder et al. (2019a). In total, after the cross-match, we have 45 galaxies in common with other authors (11 with only one, 25 with two, 5 with three and 4 with four authors). We visually checked all the objects, including those that were not detected with our procedure (which are diffuse objects, faint galaxies, objects with strong contamination by bright stars or not included in our colour criteria).
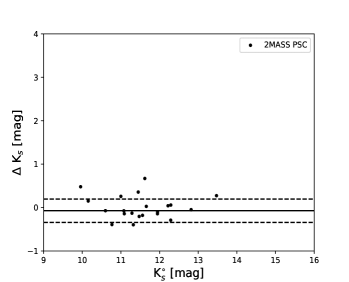
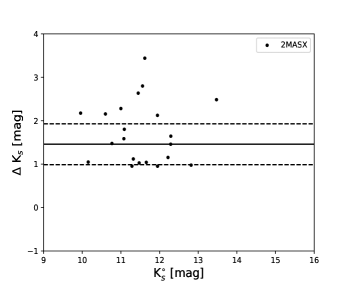
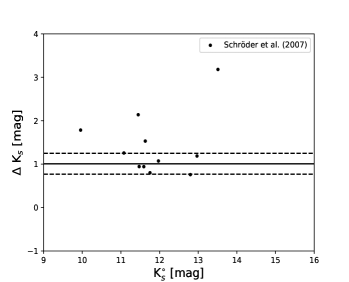
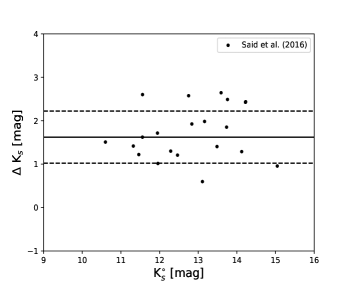
Our magnitudes were only transformed to the 2MASS photometric system (Soto et al. 2013) and compared with 2MASS, 2MASX, Schröder et al. (2007) and Said et al. (2016). The galaxies reported by Schröder et al. (2019a) have 2MASX photometry, and those of Williams et al. (2014) are included in Said et al. (2016). From these, we used 2MASS aperture magnitudes at a fixed radius aperture of 4 arcsec (2MASS PSC), the isophotal magnitudes within the = 20 mag / arcsec2 () fiducial elliptical aperture from 2MASX and Said et al. (2016), and MAG_AUTO magnitudes from Schröder et al. (2007).
The magnitude differences were calculated from our total and literature magnitudes (m = m(VVV) - m(literature)) for the , and passbands, and the statistical differences are the result of 2–clipping. Table 1 shows the median magnitude differences in the , and passbands, and includes the final number of objects considered after the –clipping in parenthesis. The number of compared galaxies for is higher than those for and . In some cases, the authors did not present estimates for the magnitudes in these passbands or the differences are higher than the 2–clipping. Figure 5 shows only the comparisons for the magnitudes, as it is the most reliable passband. In general, the uncertainties are important and might be a result of stellar contamination. The best comparisons are with 2MASS magnitudes, and we conclude that our total magnitude estimates are comparable with those that are aperture magnitudes within a fixed aperture of 4 arcsec radius. The comparison with the isophotal magnitudes yielded offsets higher than one magnitude in all cases. We attribute these observed offsets to the different photometric methods, the different procedures used to define the centre positions and magnitudes and the stellar contamination in these dense regions with high interstellar extinctions.
| Literature | |||
|---|---|---|---|
| [mag] | [mag] | [mag] | |
| 2MASS PSC | -0.20 0.52 (18) | -0.19 0.14 (15) | -0.09 0.11 (14) |
| (2MASX) | 2.13 0.64 (4) | 1.44 0.64 (16) | 1.46 0.47 (17) |
| MAG_AUTO (Schröder et al. 2007) | 1.24 0.18 (5) | – | 1.01 0.24 (8) |
| (Said et al. 2016) | 1.82 0.40 (15) | 1.53 0.31 (13) | 1.62 0.60 (21) |
2.3 Correlation with MIR data
The Wide-field Infrared Survey Explorer mission (WISE; Wright et al. 2010) mapped the whole sky in the MIR (3.4, 4.6, 12, and 22 m) passbands. For red sources such as galaxies with older stellar populations, WISE goes one magnitude deeper than the 2MASS magnitude for the 3.4 m passband (Wright et al. 2010). WISE also detects the most luminous galaxies in the Universe, such as the Ultra-luminous IR galaxies which might be related to mergers that lead to dust-enshrouded star formation (Su et al. 2013). In addition, they might be related to active galactic nuclei (AGN) activity, such as gas disturbed from stable circular orbits and falling into the central super-massive black hole in merging galaxies (Massaro et al. 2012).
In the regions of the VVV disk, we have found 509 galaxies in common with the WISE survey using a cross-match with angular separations of 2 arcsec, implying that 10% of our galaxies have also been seen in the MIR regime by WISE.
3 The VVV NIR Galaxy Catalogue
We created the VVV NIR Galaxy Catalogue (VVV NIRGC), which contains 5563 galaxies across an area of 220 deg2 within 295∘ 350∘, -2.25∘ +2.25∘, using the procedure detailed in the previous section. In this region, we have only a total of 45 galaxies in common with other NIR surveys, such as the 2MASX, Schröder et al. (2007), Williams et al. (2014) and Said et al. (2016) catalogues. Consequently, in VVV NIRGC, about 99% of the galaxies are new discoveries.
Table 2 shows the first ten galaxies of VVV NIRGC, listing the identification in column (1), the J2000 equatorial coordinates in columns (2) and (3), the Galactic coordinates in columns (4) and (5), the AKs interstellar extinction in column (6), total extinction-corrected , , and magnitudes in columns (7) to (9), the extinction-corrected , , and aperture magnitudes within a fixed aperture of 2 arcsec diameter in columns (10) to (12), the morphological parameters: , , ellipticity and in columns (13) to (16) and the WISE flag in column (17). If the galaxy has a WISE counterpart, this flag is set to 1, otherwise it is set to 0. All magnitudes were extinction-corrected and transformed to the 2MASS photometric system. This table is available in its entirety in a machine-readable form333https://catalogs.oac.uncor.edu/vvv_nirgc/.
| ID | RA | Dec | l | b | AKs | WISE | ||||||||||
|---|---|---|---|---|---|---|---|---|---|---|---|---|---|---|---|---|
| (J2000) | (J2000) | [deg] | [deg] | [mag] | [mag] | [mag] | [mag] | [mag] | [mag] | [mag] | [arcsec] | flag | ||||
| VVV-J113548.43-635434.3 | 11:35:48.43 | -63:54:34.3 | 294.7325 | -2.2484 | 0.82 | 15.11 | 14.69 | 14.36 | 15.89 | 15.42 | 15.26 | 1.18 | 2.64 | 0.31 | 1.19 | 0 |
| VVV-J113550.51-634933.7 | 11:35:50.51 | -63:49:33.7 | 294.7119 | -2.1673 | 0.91 | 15.28 | 14.42 | 13.90 | 16.47 | 15.51 | 15.10 | 1.46 | 2.81 | 0.57 | 2.48 | 0 |
| VVV-J113550.71-635444.0 | 11:35:50.71 | -63:54:44.0 | 294.7371 | -2.2497 | 0.82 | 16.68 | 16.08 | 15.29 | 16.95 | 16.45 | 16.17 | 1.12 | 2.12 | 0.46 | 3.50 | 0 |
| VVV-J113636.55-635556.4 | 11:36:36.55 | -63:55:56.4 | 294.8234 | -2.2449 | 0.88 | 16.19 | 15.43 | 14.98 | 16.63 | 16.02 | 15.83 | 1.12 | 2.36 | 0.47 | 2.28 | 0 |
| VVV-J113722.99-635650.0 | 11:37:22.99 | -63:56:50.0 | 294.9092 | -2.2350 | 0.90 | 15.59 | 15.20 | 15.10 | 16.52 | 16.08 | 15.93 | 1.14 | 3.15 | 0.60 | 7.62 | 0 |
| VVV-J113851.89-635321.8 | 11:38:51.89 | -63:53:21.8 | 295.0494 | -2.1339 | 1.47 | 14.69 | 14.03 | 13.86 | 15.76 | 15.18 | 14.94 | 1.25 | 2.14 | 0.20 | 0.42 | 0 |
| VVV-J113905.29-635803.6 | 11:39:05.29 | -63:58:03.6 | 295.0947 | -2.2023 | 0.82 | 15.77 | 15.00 | 14.71 | 16.22 | 15.70 | 15.56 | 1.12 | 2.55 | 0.38 | 1.64 | 0 |
| VVV-J113926.76-635711.6 | 11:39:26.76 | -63:57:11.6 | 295.1285 | -2.1776 | 0.82 | 15.43 | 14.90 | 14.59 | 16.07 | 15.58 | 15.36 | 1.05 | 2.32 | 0.35 | 1.52 | 0 |
| VVV-J113946.21-640120.3 | 11:39:46.21 | -64:01:20.3 | 295.1817 | -2.2342 | 0.59 | 16.38 | 15.78 | 15.33 | 16.78 | 16.29 | 16.14 | 1.11 | 2.10 | 0.10 | 3.82 | 0 |
| VVV-J114000.97-625333.3 | 11:40:00.97 | -62:53:33.3 | 294.8991 | -1.1400 | 0.91 | 14.65 | 14.10 | 14.08 | 15.53 | 14.85 | 14.85 | 1.04 | 2.30 | 0.41 | 3.03 | 0 |
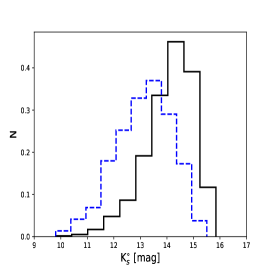
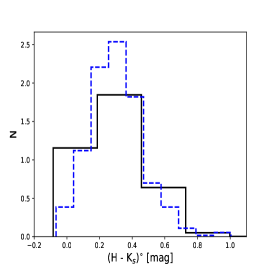
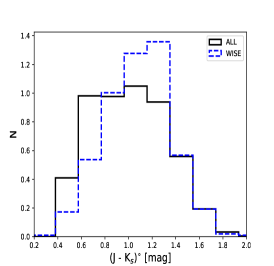
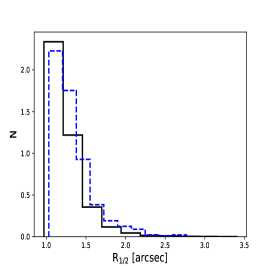
Figure 6 shows the normalized distributions of the reddening corrected magnitudes and the ( - )∘ and ( - )∘ colours of the galaxies in the VVV NIRGC. Figure 7 also shows the normalized distributions of some of the structural properties for the galaxies, such as , , and Sérsic index. We made a distinction between galaxies from the VVV NIRGC (represented with solid lines) and those that also have WISE data (represented with dashed lines) see section 2.3. Table 3 summarizes the median values of the photometric and structural parameters for the two normalized distributions. For the galaxies in VVV NIRGC, the limiting magnitude reaches about 16 mag and the distribution of ( - )∘ is nearly constant between 0.5 and 1.2 mag. These are small objects with distributions that have peaks with 1.3 arcsec, with a value of approximately 3, and around 4. These results are similar to those found in the tiles analysed in Baravalle et al. (2018, 2019), which are characteristic of early-type galaxies. The galaxies with WISE data are brighter and with slightly larger sizes with a smaller Sérsic index than the galaxies, in general, in the VVV NIRGC. These results might be a consequence of the predominance of late-type galaxies.
| Parameter | All galaxies | Galaxies with WISE data |
|---|---|---|
| [mag] | 14.24 0.92 | 13.22 1.06 |
| ( - )∘ [mag] | 0.99 0.31 | 1.09 0.28 |
| ( - )∘ [mag] | 0.28 0.19 | 0.30 0.16 |
| [arcsec] | 1.18 0.23 | 1.27 0.27 |
| 2.83 0.49 | 2.92 0.36 | |
| 3.34 1.81 | 2.79 1.47 |
3.1 The galaxy distribution map
Figures 8 and 9 show the distribution of the 5563 galaxies in the VVV NIRGC catalogue with the superposition of the AV contours (1, 3, 5, 7, 9, 11, 13, 15, 20 and 25 mag) derived from the extinction map by Schlafly & Finkbeiner (2011) and the stellar density gray-scale map from the VVV catalogues by Alonso-García et al. (2018), respectively. The star count map has a pixel scale of 0.9 arcmin2 and includes all stellar detections, regardless of their magnitudes, for a better visualization. The galaxies in the VVV region across the Southern Galactic plane are represented by red circles. We have also included the galaxies in common with previous works: 2MASX, Schröder et al. (2007), Williams et al. (2014) and Said et al. (2016) with blue triangles. In general, the regions with strong interstellar extinction or a higher stellar density have no galaxy detections.
There are 3584 galaxies brighter than = 15 mag in regions of low interstellar extinction, AKs 1 mag. This number represents about 64% of the galaxies in the VVV NIRGC catalogue. Figure 10 shows the distribution of these brightest galaxies as a density plot with a resolution of 90 arcmin2 per pixel, together with the superposition of some AV contours (10, 15, 20 and 25 mag) from Schlafly & Finkbeiner (2011). In the Figures 8-10, possible clustering can be appreciated at different areas of the map. These regions in Galactic coordinates, in order of density, are the following: (326.0∘, -1.4∘), (326.7∘, -2.1∘), (299.2∘, -1.0∘), (305.0∘, 1.0∘), (308.0∘, 1.2∘), (309.3∘, -2.0∘), (317.0∘, 2.0∘) and (300.8∘, 1.8∘). The galaxy cluster VVV-J144321-611754, identified in Baravalle et al. (2019), is located in a less dense region (the d015 tile, = 315.8∘ and = -1.6∘). As it is very important to know which of these observed over-densities of galaxies are real structures, additional observations, i.e. NIR spectroscopy, are needed in order to select and confirm the galaxy cluster candidates.
The VVV NIRGC is the largest collection available to date of galaxies in the Galactic plane within 295∘ 350∘ and -2.25∘ +2.25∘. In general, dense regions of galaxies are related to lower interstellar extinctions and stellar densities in the Galactic plane. Thus, Figures 8-10 show that the galaxy distribution closely resembles the distribution of low extinction in the NIR interstellar extinction maps made by the VVV survey (Minniti et al., 2018; Soto et al., 2019).
Indeed, the main factors driving galaxy detection in the VVV images are the real distribution of galaxies and the total interstellar extinction and stellar density throughout the MW plane. The windows of low extinction, in particular, contain a higher number of galaxies per unit area. In fact, this is a useful method for identifying low extinction windows across the MW disk. Some other secondary factors that favor the detection (or non-detection) of galaxies in the VVV survey are the seeing and the sky brightness variations in the NIR, as discussed earlier. For instance, it is more difficult to detect faint galaxies in the crowded regions near the Galactic bulge or along the MW spiral arm tangents.
4 Main conclusions and Future work
In this work, we have analysed the VVV NIR images across the Southern Galactic plane in order to search for galaxies using SExtractor+PSFEx, as described in Baravalle et al. (2018). We found that the main limitations for galaxy detections are both the high interstellar extinction and the strong star crowding, which are extremely severe in some cases.
The VVV NIRGC comprises the photometric and morphological properties of 5563 visually confirmed galaxies, with 99% of these having no previous identification. This work compiles the largest collection to date of galaxies in the Galactic disk (within 295∘ 350∘, -2.25 +2.25∘).
We have compared galaxy magnitudes with other NIR surveys in the ZoA, namely 2MASS, 2MASX, Schröder et al. (2007) and Said et al. (2016), and our total magnitude estimates are comparable with the 2MASS magnitudes. The comparison with other isophotal magnitudes have offsets higher than one magnitude in all cases (Table 1). These differences might be due to the different photometric methods and procedures used to define the magnitudes in these dense regions with high interstellar extinctions. The total number of 185 2MASX extended objects were visually inspected. The 21 galaxies in common were used for the comparisons, and the remaining 164 extended objects were re-classified as detailed in Appendix B.
The confirmed galaxies in the VVV NIRGC have colours and morphological parameters that are consistent with early-type galaxies (Table 3). The galaxies with MIR data from WISE are about 10% of the sample and showing some differences with the total distributions. These are, in general, brighter and larger objects with a smaller Sérsic index than the galaxies in the VVV NIRGC. Thus, they might be late-type galaxies.
We have also presented the galaxy distribution map across the Southern Galactic plane using the VVV NIRGC. In general, the dense regions of galaxies are related to lower interstellar extinctions in the Galactic plane. These results confirm that both the interstellar extinction and stellar density are the main limitations for these studies at lower Galactic latitudes. This work represents the first step in exploring the distribution of galaxies in the ZoA using the VVV survey. The VVV NIRGC may also be used to identify candidate compact groups and clusters of galaxies, which require later spectroscopic confirmation.
In the future, our procedure might be improved by using co-added images to reach fainter objects and, most importantly, be extended to the VVVX area. It is very important to cross-correlate with surveys using other frequencies, such as the Galactic Legacy Infrared Mid-Plane Survey Extraordinaire (GLIMPSE, Benjamin et al. 2005) and WISE MIR data, the Widefield Australian Square Kilometer Array Pathfinder L-band legacy all-sky blind survey (WALLABY, Koribalski et al. 2020) of neutral hydrogen, and X-ray and radio source catalogues.
Acknowledgements
We would like to thank the anonymous referee for the useful comments and suggestions which has helped to improve this paper. This work was partially supported by Consejo de Investigaciones Científicas y Técnicas (CONICET) and Secretaría de Ciencia y Técnica de la Universidad Nacional de Córdoba (SecyT). We gratefully acknowledge data from the ESO Public Survey program ID 179.B-2002 taken with the VISTA telescope, and products from the CASU. DM is supported by the BASAL Center for Astrophysics and Associated Technologies (CATA) through grant AFB 170002 and by Proyecto FONDECYT N∘ 1170121. This research has made use of the NASA/IPAC Infrared Science Archive, which is funded by the National Aeronautics and Space Administration and operated by the California Institute of Technology. This publication makes use of data products from the Two Micron All Sky Survey, which is a joint project of the University of Massachusetts and the Infrared Processing and Analysis Center California Institute of Technology, funded by the National Aeronautics and Space Administration and the National Science Foundation. This research has made use of the VizieR catalogue access tool, CDS, Strasbourg, France (DOI: 10.26093/cds/vizier). The original description of the VizieR service was published in 2000, A&AS 143, 23.
Data Availability
The data underlying this article are available in the IATE home page at https://catalogs.oac.uncor.edu/vvv_nirgc/.
References
- Alonso-García et al. (2018) Alonso-García, J., Saito, R. K., Hempel, M., et al. 2018, A&A, 619, A4
- Amôres & Lépine (2005) Amôres, E. B. & Lépine, J. R. D. 2005, AJ, 130, 659
- Amôres & Lépine (2007) Amôres, E. B. & Lépine, J. R. D. 2007, AJ, 133, 1519
- Amôres et al. (2012) Amôres, E. B., Sodré, L., Minniti, D., et al. 2012, AJ, 144, 127
- Araya et al. (2005) Araya, E., Hofner, P., Kurtz, S., Bronfman, L., & DeDeo, S. 2005, ApJS, 157, 279
- Arce & Goodman (1999) Arce, H. G. & Goodman, A. A. 1999, ApJ, 512, L135
- Baravalle et al. (2018) Baravalle, L. D., Alonso, M. V., Nilo Castellón, J. L., Beamín, J. C., & Minniti, D. 2018, Astron. J., 155, 46
- Baravalle et al. (2019) Baravalle, L. D., Nilo Castellón, J. L., Alonso, M. V., et al. 2019, ApJ, 874, 46
- Barbá et al. (2015) Barbá, R. H., Roman-Lopes, A., Nilo Castellón, J. L., et al. 2015, Astron. Astrph., 581, A120
- Beamín et al. (2013) Beamín, J. C., Minniti, D., Gromadzki, M., et al. 2013, A&A, 557, L8
- Beltrán et al. (2006) Beltrán, M. T., Brand, J., Cesaroni, R., et al. 2006, A&A, 447, 221
- Benjamin et al. (2005) Benjamin, R. A., Churchwell, E., Babler, B. L., et al. 2005, ApJ, 630, L149
- Bertin (2011) Bertin, E. 2011, in Astronomical Society of the Pacific Conference Series, Vol. 442, Astronomical Data Analysis Software and Systems XX, ed. I. N. Evans, A. Accomazzi, D. J. Mink, & A. H. Rots, 435
- Bertin & Arnouts (1996) Bertin, E. & Arnouts, S. 1996, Astron. Astroph. Supplement (Journal), 117, 393
- Borissova et al. (2011) Borissova, J., Bonatto, C., Kurtev, R., et al. 2011, A&A, 532, A131
- Borissova et al. (2014) Borissova, J., Chené, A. N., Ramírez Alegría, S., et al. 2014, A&A, 569, A24
- Bronfman et al. (1996) Bronfman, L., Nyman, L. A., & May, J. 1996, A&AS, 115, 81
- Caratti o Garatti et al. (2015) Caratti o Garatti, A., Stecklum, B., Linz, H., Garcia Lopez, R., & Sanna, A. 2015, A&A, 573, A82
- Caswell et al. (2010) Caswell, J. L., Fuller, G. A., Green, J. A., et al. 2010, MNRAS, 404, 1029
- Caswell et al. (1977) Caswell, J. L., Haynes, R. F., & Goss, W. M. 1977, MNRAS, 181, 427
- Catelan et al. (2011) Catelan, M., Minniti, D., Lucas, P. W., et al. 2011, in RR Lyrae Stars, Metal-Poor Stars, and the Galaxy, ed. A. McWilliam, Vol. 5, 145
- Churchwell et al. (2006) Churchwell, E., Povich, M. S., Allen, D., et al. 2006, ApJ, 649, 759
- Coldwell et al. (2014) Coldwell, G., Alonso, S., Duplancic, F., et al. 2014, Astron. Astrph., 569, A49
- Conselice et al. (2000) Conselice, C. J., Bershady, M. A., & Jangren, A. 2000, Astrophys. J., 529, 886
- Contreras et al. (2013) Contreras, Y., Schuller, F., Urquhart, J. S., et al. 2013, A&A, 549, A45
- Courtois & Tully (2015) Courtois, H. M. & Tully, R. B. 2015, MNRAS, 447, 1531
- Courtois et al. (2009) Courtois, H. M., Tully, R. B., Fisher, J. R., et al. 2009, AJ, 138, 1938
- Culverhouse et al. (2011) Culverhouse, T., Ade, P., Bock, J., et al. 2011, ApJS, 195, 8
- Cutri et al. (2003) Cutri, R. M., Skrutskie, M. F., van Dyk, S., et al. 2003, VizieR Online Data Catalog, II/246
- Cyganowski et al. (2008) Cyganowski, C. J., Whitney, B. A., Holden, E., et al. 2008, AJ, 136, 2391
- Dalton et al. (2006) Dalton, G. B., Caldwell, M., Ward, A. K., et al. 2006, in Proceedings of the International Society for Optical, Vol. 6269, Society of Photo-Optical Instrumentation Engineers (SPIE) Conference Series, 62690X
- Dutra et al. (2003) Dutra, C. M., Bica, E., Soares, J., & Barbuy, B. 2003, A&A, 400, 533
- Egan et al. (2003) Egan, M. P., Price, S. D., Kraemer, K. E., et al. 2003, VizieR Online Data Catalog, V/114
- Egan et al. (2001) Egan, M. P., Price, S. D., Moshir, M. M., et al. 2001, VizieR Online Data Catalog
- Emerson et al. (2006) Emerson, J., McPherson, A., & Sutherland, W. 2006, The Messenger, 126, 41
- Epchtein et al. (1997) Epchtein, N., de Batz, B., Capoani, L., et al. 1997, The Messenger, 87, 27
- Frew et al. (2013) Frew, D. J., Bojičić, I. S., & Parker, Q. A. 2013, MNRAS, 431, 2
- Garay et al. (2006) Garay, G., Brooks, K. J., Mardones, D., & Norris, R. P. 2006, ApJ, 651, 914
- Garay et al. (2007) Garay, G., Mardones, D., Brooks, K. J., Videla, L., & Contreras, Y. 2007, ApJ, 666, 309
- Giveon et al. (2002) Giveon, U., Sternberg, A., Lutz, D., Feuchtgruber, H., & Pauldrach, A. W. A. 2002, ApJ, 566, 880
- Gladders & Yee (2000) Gladders, M. D. & Yee, H. K. C. 2000, AJ, 120, 2148
- Gonzalez et al. (2012) Gonzalez, O. A., Rejkuba, M., Zoccali, M., et al. 2012, A&A, 543, A13
- Goss & Shaver (1970) Goss, W. M. & Shaver, P. A. 1970, Australian Journal of Physics Astrophysical Supplement, 14, 1
- Gum (1955) Gum, C. S. 1955, Mem. RAS, 67, 155
- Guzmán et al. (2012) Guzmán, A. E., Garay, G., Brooks, K. J., & Voronkov, M. A. 2012, ApJ, 753, 51
- Guzmán et al. (2014) Guzmán, A. E., Garay, G., Rodríguez, L. F., et al. 2014, ApJ, 796, 117
- Harju et al. (1998) Harju, J., Lehtinen, K., Booth, R. S., & Zinchenko, I. 1998, A&AS, 132, 211
- Helou & Walker (1988) Helou, G. & Walker, D. W. 1988, Infrared astronomical satellite (IRAS) catalogs and atlases. Volume 7
- Hindson et al. (2013) Hindson, L., Thompson, M. A., Urquhart, J. S., et al. 2013, MNRAS, 435, 2003
- Howlett et al. (2017) Howlett, C., Staveley-Smith, L., Elahi, P. J., et al. 2017, MNRAS, 471, 3135
- Huchra et al. (2005) Huchra, J., Jarrett, T., Skrutskie, M., et al. 2005, in Astronomical Society of the Pacific Conference Series, Vol. 329, Nearby Large-Scale Structures and the Zone of Avoidance, ed. A. P. Fairall & P. A. Woudt, 135
- Huchra & Geller (1982) Huchra, J. P. & Geller, M. J. 1982, ApJ, 257, 423
- Huchra et al. (2012) Huchra, J. P., Macri, L. M., Masters, K. L., et al. 2012, Astrophys. J. Suppl., 199, 26
- Ishihara et al. (2010) Ishihara, D., Onaka, T., Kataza, H., et al. 2010, A&A, 514, A1
- Jarrett (2004) Jarrett, T. 2004, Publications of the Astronomical Society of Australia, 21, 396
- Jarrett et al. (2000a) Jarrett, T. H., Chester, T., Cutri, R., & Schneider, S. 2000a, AJ, 119, 2498
- Jarrett et al. (2000b) Jarrett, T. H., Chester, T., Cutri, R., & Schneider, S. 2000b, AJ, 120, 298
- Jones & Dickey (2012) Jones, C. & Dickey, J. M. 2012, ApJ, 753, 62
- Karachentseva et al. (2010) Karachentseva, V. E., Mitronova, S. N., Melnyk, O. V., & Karachentsev, I. D. 2010, Astrophysical Bulletin, 65, 1
- Kharchenko et al. (2013) Kharchenko, N. V., Piskunov, A. E., Schilbach, E., Röser, S., & Scholz, R. D. 2013, A&A, 558, A53
- Klypin et al. (1993) Klypin, A., Holtzman, J., Primack, J., & Regos, E. 1993, ApJ, 416, 1
- Koribalski et al. (2020) Koribalski, B. S., Staveley-Smith, L., Westmeier, T., et al. 2020, Ap&SS, 365, 118
- Kourkchi & Tully (2017) Kourkchi, E. & Tully, R. B. 2017, ApJ, 843, 16
- Kraan-Korteweg (2000) Kraan-Korteweg, R. C. 2000, Astron. Astroph. Supplement (Journal), 141, 123
- Kraan-Korteweg et al. (2017) Kraan-Korteweg, R. C., Cluver, M. E., Bilicki, M., et al. 2017, Mon. Not. R. Astron. Soc., 466, L29
- Kraan-Korteweg & Lahav (2000) Kraan-Korteweg, R. C. & Lahav, O. 2000, A&ARv, 10, 211
- Kraan-Korteweg et al. (2018) Kraan-Korteweg, R. C., van Driel, W., Schröder, A. C., Ramatsoku, M., & Henning, P. A. 2018, MNRAS, 481, 1262
- Kraan-Korteweg & Woudt (1999) Kraan-Korteweg, R. C. & Woudt, P. A. 1999, Publications of the Astronomical Society of Australia, 16, 53
- Kraan-Korteweg et al. (1996) Kraan-Korteweg, R. C., Woudt, P. A., Cayatte, V., et al. 1996, Nature, 379, 519
- Kron (1980) Kron, R. G. 1980, Astrophys. J. Suppl., 43, 305
- Kuchar & Clark (1997) Kuchar, T. A. & Clark, F. O. 1997, ApJ, 488, 224
- Kwok et al. (1997) Kwok, S., Volk, K., & Bidelman, W. P. 1997, ApJS, 112, 557
- Lambert et al. (2020) Lambert, T. S., Kraan-Korteweg, R. C., Jarrett, T. H., & Macri, L. M. 2020, MNRAS[\eprint[arXiv]2007.00581]
- Macri et al. (2019) Macri, L. M., Kraan-Korteweg, R. C., Lambert, T., et al. 2019, ApJS, 245, 6
- Massaro et al. (2012) Massaro, F., D’Abrusco, R., Tosti, G., et al. 2012, ApJ, 750, 138
- Masters et al. (2008) Masters, K. L., Springob, C. M., & Huchra, J. P. 2008, AJ, 135, 1738
- Minniti et al. (2017) Minniti, D., Geisler, D., Alonso-García, J., et al. 2017, ApJ, 849, L24
- Minniti et al. (2011) Minniti, D., Hempel, M., Toledo, I., et al. 2011, A&A, 527, A81
- Minniti et al. (2010) Minniti, D., Lucas, P. W., Emerson, J. P., et al. 2010, New Astron., 15, 433
- Minniti et al. (2018) Minniti, D., Saito, R. K., Gonzalez, O. A., et al. 2018, A&A, 616, A26
- Mitronova et al. (2004) Mitronova, S. N., Karachentsev, I. D., Karachentseva, V. E., Jarrett, T. H., & Kudrya, Y. N. 2004, Bulletin of the Special Astrophysics Observatory, 57, 5
- Mookerjea et al. (2004) Mookerjea, B., Kramer, C., Nielbock, M., & Nyman, L. Å. 2004, A&A, 426, 119
- Morales et al. (2013) Morales, E. F. E., Wyrowski, F., Schuller, F., & Menten, K. M. 2013, A&A, 560, A76
- Mori et al. (2013) Mori, H., Maeda, Y., Furuzawa, A., Haba, Y., & Ueda, Y. 2013, Pub. Astron. Soc. Jap., 65, 102
- Mottram et al. (2007) Mottram, J. C., Hoare, M. G., Lumsden, S. L., et al. 2007, A&A, 476, 1019
- Mutabazi et al. (2014) Mutabazi, T., Blyth, S. L., Woudt, P. A., et al. 2014, MNRAS, 439, 3666
- Nagayama et al. (2004) Nagayama, T., Woudt, P. A., Nagashima, C., et al. 2004, MNRAS, 354, 980
- Paturel et al. (2003) Paturel, G., Theureau, G., Bottinelli, L., et al. 2003, A&A, 412, 57
- Peebles (1980) Peebles, P. J. E. 1980, The large-scale structure of the universe
- Peretto & Fuller (2009) Peretto, N. & Fuller, G. A. 2009, A&A, 505, 405
- Pichel et al. (2020) Pichel, A., Donoso, L. G., Baravalle, L. D., et al. 2020, MNRAS, 491, 3448
- Pinheiro et al. (2010) Pinheiro, M. C., Copetti, M. V. F., & Oliveira, V. A. 2010, A&A, 521, A26
- Purcell et al. (2012) Purcell, C. R., Longmore, S. N., Walsh, A. J., et al. 2012, MNRAS, 426, 1972
- Robitaille et al. (2007) Robitaille, T. P., Cohen, M., Whitney, B. A., et al. 2007, AJ, 134, 2099
- Robitaille et al. (2008) Robitaille, T. P., Meade, M. R., Babler, B. L., et al. 2008, AJ, 136, 2413
- Roman-Lopes & Abraham (2006) Roman-Lopes, A. & Abraham, Z. 2006, AJ, 131, 2223
- Rousseau et al. (2000) Rousseau, J., Paturel, G., Vauglin, I., et al. 2000, A&A, 363, 62
- Said et al. (2016) Said, K., Kraan-Korteweg, R. C., Jarrett, T. H., Staveley-Smith, L., & Williams, W. L. 2016, Mon. Not. R. Astron. Soc., 462, 3386
- Saito et al. (2010) Saito, R., Hempel, M., Alonso-García, J., et al. 2010, The Messenger, 141, 24
- Saito et al. (2020) Saito, R. K., Minniti, D., Benjamin, R. A., et al. 2020, MNRAS, 494, L32
- Saito et al. (2019) Saito, R. K., Minniti, D., Ivanov, V. D., et al. 2019, MNRAS, 490, 1171
- Schlafly & Finkbeiner (2011) Schlafly, E. F. & Finkbeiner, D. P. 2011, Astrophys. J., 737, 103
- Schlegel et al. (1998) Schlegel, D. J., Finkbeiner, D. P., & Davis, M. 1998, Astrophys. J., 500, 525
- Schröder et al. (2019a) Schröder, A. C., an Driel, W., & Kraan-Korteweg, R. C. 2019a, MNRAS, 482, 5167
- Schröder et al. (2019b) Schröder, A. C., Flöer, L., Winkel, B., & Kerp, J. 2019b, MNRAS, 489, 2907
- Schröder et al. (2007) Schröder, A. C., Mamon, G. A., Kraan-Korteweg, R. C., & Woudt, P. A. 2007, A&A, 466, 481
- Sersic (1968) Sersic, J. L. 1968, Atlas de galaxias australes
- Shaver et al. (1983) Shaver, P. A., McGee, R. X., Newton, L. M., Danks, A. C., & Pottasch, S. R. 1983, MNRAS, 204, 53
- Simpson et al. (2012) Simpson, R. J., Povich, M. S., Kendrew, S., et al. 2012, MNRAS, 424, 2442
- Skrutskie et al. (2006) Skrutskie, M. F., Cutri, R. M., Stiening, R., et al. 2006, Astron. J., 131, 1163
- Sorce et al. (2017) Sorce, J. G., Colless, M., Kraan-Korteweg, R. C., & Gottlöber, S. 2017, Mon. Not. R. Astron. Soc., 471, 3087
- Soto et al. (2013) Soto, M., Barbá, R., Gunthardt, G., et al. 2013, A&A, 552, A101
- Soto et al. (2019) Soto, M., Barbá, R., Minniti, D., et al. 2019, MNRAS, 488, 2650
- Staveley-Smith et al. (2016) Staveley-Smith, L., Kraan-Korteweg, R. C., Schröder, A. C., et al. 2016, Astron. J., 151, 52
- Stephenson & Sanduleak (1971) Stephenson, C. B. & Sanduleak, N. 1971, Publications of the Warner & Swasey Observatory, 1, 1
- Su et al. (2013) Su, S., Kong, X., Li, J., & Fang, G. 2013, ApJ, 778, 10
- Suárez et al. (2006) Suárez, O., García-Lario, P., Manchado, A., et al. 2006, A&A, 458, 173
- Tapia et al. (2014) Tapia, M., Persi, P., Roth, M., et al. 2014, MNRAS, 437, 606
- Urquhart et al. (2014) Urquhart, J. S., Csengeri, T., Wyrowski, F., et al. 2014, A&A, 568, A41
- Urquhart et al. (2018) Urquhart, J. S., König, C., Giannetti, A., et al. 2018, MNRAS, 473, 1059
- van Driel et al. (2009) van Driel, W., Schneider, S. E., Kraan-Korteweg, R. C., & Monnier Ragaigne, D. 2009, A&A, 505, 29
- Vauglin et al. (2002) Vauglin, I., Rousseau, J., Paturel, G., et al. 2002, A&A, 387, 1
- Vig et al. (2007) Vig, S., Ghosh, S. K., Ojha, D. K., & Verma, R. P. 2007, A&A, 463, 175
- Walsh et al. (2001) Walsh, A. J., Bertoldi, F., Burton, M. G., & Nikola, T. 2001, MNRAS, 326, 36
- West & Tarenghi (1989) West, R. M. & Tarenghi, M. 1989, A&A, 223, 61
- Williams et al. (2014) Williams, W. L., Kraan-Korteweg, R. C., & Woudt, P. A. 2014, Mon. Not. R. Astron. Soc., 443, 41
- Woudt & Kraan-Korteweg (2001) Woudt, P. A. & Kraan-Korteweg, R. C. 2001, Astron. Astrph., 380, 441
- Wray (1966) Wray, J. D. 1966, PhD thesis, Northwestern University.
- Wright et al. (2010) Wright, E. L., Eisenhardt, P. R. M., Mainzer, A. K., et al. 2010, Astron. J., 140, 1868
- Yu & Xu (2016) Yu, N. & Xu, J. 2016, ApJ, 833, 248
Appendix A The studied VVV tiles in the Galactic disk
This is important information for the reader interested in the details of the observed regions. Table 4 shows some characteristics of the studied tiles, with the identification in column (1), the Galactic coordinates and the interstellar extinctions at passband of the centre in columns (2) to (4), the median interstellar extinctions of the extended objects in column (5), and the number of confirmed galaxies in column (6).
In previous works, Amôres et al. (2012) reported 214 objects in the d003 tile, of which 72 were considered to be possible galaxies. These detections are, in general, in agreement with our observations, with any differences possible arising from the adopted methodology and the removal of objects with strong stellar contamination. Also, Baravalle et al. (2018) reported 530 galaxies in the d010 and d115 tiles. Here, we were more discriminative in the image selection and more exhaustive in the visual inspection.
| Tile ID | AV | A | Number of | ||
|---|---|---|---|---|---|
| [deg] | [deg] | [mag] | [mag] | galaxies | |
| d001 | 295.4376 | -1.6497 | 8.703 | 1.159 | 39 |
| d002 | 296.8967 | -1.6498 | 7.858 | 1.081 | 31 |
| d003 | 298.3557 | -1.6497 | 4.725 | 0.553 | 89 |
| d004 | 299.8147 | -1.6497 | 4.988 | 0.588 | 106 |
| d005 | 301.2737 | -1.6497 | 4.226 | 0.599 | 92 |
| d006 | 302.7327 | -1.6497 | 5.747 | 0.785 | 106 |
| d007 | 304.1917 | -1.6498 | 4.745 | 0.655 | 101 |
| d008 | 305.6510 | -1.6497 | 4.261 | 0.551 | 117 |
| d009 | 307.1097 | -1.6497 | 4.298 | 0.581 | 69 |
| d010 | 308.5690 | -1.6497 | 9.103 | 0.898 | 129 |
| d011 | 309.9739 | -1.6360 | 7.218 | 0.966 | 66 |
| d012 | 311.4867 | -1.6497 | 8.587 | 1.060 | 38 |
| d013 | 312.9457 | -1.6497 | 5.891 | 0.945 | 54 |
| d014 | 314.4047 | -1.6497 | 6.705 | 0.870 | 63 |
| d015 | 315.8371 | -1.6502 | 6.113 | 0.840 | 91 |
| d016 | 317.2949 | -1.6497 | 5.116 | 0.645 | 98 |
| d017 | 318.7539 | -1.6497 | 5.909 | 0.781 | 93 |
| d018 | 320.2129 | -1.6497 | 4.319 | 0.960 | 83 |
| d019 | 321.6719 | -1.6497 | 7.393 | 0.917 | 97 |
| d020 | 323.1406 | -1.6362 | 7.693 | 0.881 | 58 |
| d021 | 324.5899 | -1.6497 | 10.229 | 1.027 | 43 |
| d022 | 326.0489 | -1.6497 | 3.653 | 0.563 | 157 |
| d023 | 327.5079 | -1.6497 | 4.355 | 0.566 | 82 |
| d024 | 328.9669 | -1.6497 | 6.620 | 0.834 | 3 |
| d025 | 330.4259 | -1.6497 | 5.124 | 0.853 | 35 |
| d026 | 331.8849 | -1.6497 | 9.314 | 0.781 | 26 |
| d027 | 333.3439 | -1.6497 | 5.381 | 0.715 | 13 |
| d028 | 334.8029 | -1.6497 | 9.009 | 0.985 | 24 |
| d029 | 336.1531 | -1.5276 | 8.087 | 0.920 | 19 |
| d030 | 337.7209 | -1.6497 | 8.056 | 1.027 | 9 |
| d031 | 339.1799 | -1.6497 | 9.367 | 1.134 | 11 |
| d032 | 340.6389 | -1.6497 | 10.498 | 1.318 | 14 |
| d033 | 342.0979 | -1.6497 | 8.322 | 1.031 | 24 |
| d034 | 343.5569 | -1.6497 | 6.974 | 1.030 | 18 |
| d035 | 345.0159 | -1.6498 | 6.417 | 0.812 | 30 |
| d036 | 346.4749 | -1.6498 | 8.109 | 0.939 | 13 |
| d037 | 347.9339 | -1.6497 | 5.365 | 0.690 | 30 |
| d038 | 349.3929 | -1.6497 | 5.398 | 0.679 | 24 |
| d039 | 295.4374 | -0.5576 | 7.001 | 1.024 | 3 |
| d040 | 296.8962 | -0.5576 | 10.775 | 1.256 | 13 |
| d041 | 298.3548 | -0.5575 | 4.748 | 0.931 | 93 |
| d042 | 299.8135 | -0.5570 | 9.725 | 1.102 | 68 |
| d043 | 301.2720 | -0.5575 | 10.005 | 1.192 | 31 |
| d044 | 302.7308 | -0.5575 | 20.385 | 1.976 | 10 |
| d045 | 304.1896 | -0.5576 | 19.626 | 1.840 | 21 |
| d046 | 305.6481 | -0.5575 | 10.511 | 1.113 | 39 |
| d047 | 307.1068 | -0.5575 | 10.236 | 1.461 | 34 |
| d048 | 308.5653 | -0.5575 | 19.512 | 2.473 | 9 |
| d049 | 310.0249 | -0.5544 | 28.317 | 3.480 | 4 |
| d050 | 311.4828 | -0.5575 | 39.246 | 2.743 | 7 |
| d051 | 312.9415 | -0.5576 | 31.868 | 2.298 | 6 |
| d052 | 314.4001 | -0.5576 | 28.625 | 2.305 | 3 |
| d053 | 315.8588 | -0.5575 | 28.934 | 2.268 | 8 |
| d054 | 317.3175 | -0.5575 | 21.962 | 2.014 | 24 |
| d055 | 318.7761 | -0.5576 | 18.618 | 2.539 | 7 |
| d056 | 320.2348 | -0.5576 | 24.226 | 2.542 | 12 |
| d057 | 321.6935 | -0.5575 | 17.682 | 2.066 | 23 |
| d058 | 323.1522 | -0.5575 | 17.893 | 2.191 | 8 |
| d059 | 324.6109 | -0.5575 | 22.517 | 3.163 | 5 |
| Tile ID | AV | A | Number of | ||
|---|---|---|---|---|---|
| [deg] | [deg] | [mag] | [mag] | galaxies | |
| d060 | 326.0695 | -0.5575 | 42.993 | 2.463 | 5 |
| d061 | 327.5282 | -0.5576 | 29.493 | 3.457 | 10 |
| d062 | 328.9868 | -0.5576 | 24.148 | 2.577 | 2 |
| d063 | 330.4455 | -0.5575 | 25.052 | 2.169 | 9 |
| d064 | 331.9041 | -0.5575 | 15.324 | 1.797 | 8 |
| d065 | 333.3629 | -0.5576 | 39.527 | 2.832 | 0 |
| d066 | 334.8215 | -0.5575 | 25.793 | 2.419 | 1 |
| d067 | 336.2801 | -0.5576 | 21.919 | 2.828 | 3 |
| d068 | 337.7388 | -0.5576 | 18.504 | 2.765 | 1 |
| d069 | 339.1975 | -0.5576 | 35.709 | 4.263 | 0 |
| d070 | 340.6561 | -0.5576 | 34.913 | 5.366 | 0 |
| d071 | 342.1148 | -0.5576 | 12.754 | 3.302 | 0 |
| d072 | 343.5735 | -0.5575 | 27.715 | 3.802 | 0 |
| d073 | 345.0321 | -0.5576 | 30.089 | 2.953 | 0 |
| d074 | 346.4908 | -0.5576 | 16.443 | 1.759 | 1 |
| d075 | 347.9495 | -0.5576 | 17.169 | 1.755 | 5 |
| d076 | 349.4082 | -0.5575 | 14.235 | 2.585 | 1 |
| d077 | 295.4375 | 0.5346 | 7.330 | 0.781 | 93 |
| d078 | 296.8963 | 0.5346 | 6.419 | 0.755 | 26 |
| d079 | 298.3552 | 0.5345 | 4.322 | 0.841 | 73 |
| d080 | 299.8141 | 0.5346 | 11.560 | 1.386 | 37 |
| d081 | 301.2729 | 0.5346 | 10.349 | 1.661 | 30 |
| d082 | 302.7318 | 0.5346 | 14.507 | 2.183 | 28 |
| d083 | 304.1908 | 0.5346 | 17.355 | 2.067 | 23 |
| d084 | 305.6495 | 0.5346 | 17.463 | 1.807 | 47 |
| d085 | 307.1084 | 0.5345 | 18.849 | 1.569 | 52 |
| d086 | 308.5672 | 0.5346 | 33.014 | 1.691 | 38 |
| d087 | 310.0261 | 0.5346 | 42.790 | 3.144 | 6 |
| d088 | 311.4849 | 0.5346 | 42.121 | 3.803 | 17 |
| d089 | 312.9438 | 0.5346 | 26.151 | 2.716 | 7 |
| d090 | 314.4027 | 0.5346 | 22.500 | 2.335 | 10 |
| d091 | 315.8616 | 0.5346 | 22.336 | 2.119 | 12 |
| d092 | 317.3204 | 0.5346 | 13.721 | 1.482 | 36 |
| d093 | 318.7793 | 0.5346 | 16.766 | 1.736 | 19 |
| d094 | 320.2382 | 0.5346 | 28.764 | 1.899 | 22 |
| d095 | 321.6970 | 0.5346 | 12.878 | 1.934 | 14 |
| d096 | 323.1559 | 0.5346 | 18.679 | 2.343 | 4 |
| d097 | 324.6148 | 0.5346 | 20.111 | 2.630 | 2 |
| d098 | 326.0736 | 0.5346 | 25.883 | 2.842 | 1 |
| d099 | 327.5325 | 0.5346 | 33.170 | 4.346 | 0 |
| d100 | 328.9913 | 0.5346 | 79.078 | 6.185 | 0 |
| d101 | 330.4502 | 0.5346 | 47.601 | 4.172 | 0 |
| d102 | 331.9091 | 0.5346 | 27.476 | 3.564 | 0 |
| d103 | 333.3679 | 0.5346 | 20.665 | 3.212 | 1 |
| d104 | 334.8269 | 0.5346 | 16.362 | 2.740 | 4 |
| d105 | 336.2857 | 0.5346 | 19.643 | 2.719 | 6 |
| d106 | 337.7445 | 0.5346 | 14.083 | 1.992 | 3 |
| d107 | 339.2034 | 0.5346 | 24.339 | 4.283 | 2 |
| d108 | 340.6622 | 0.5346 | 19.564 | 3.086 | 0 |
| d109 | 342.1212 | 0.5346 | 37.578 | 3.024 | 0 |
| d110 | 343.5801 | 0.5346 | 28.236 | 3.265 | 0 |
| d111 | 345.0388 | 0.5346 | 19.256 | 3.348 | 1 |
| d112 | 346.4977 | 0.5346 | 34.060 | 4.012 | 0 |
| d113 | 347.9566 | 0.5346 | 22.919 | 3.399 | 6 |
| d114 | 349.4155 | 0.5346 | 23.303 | 3.487 | 0 |
| d115 | 295.4380 | 1.6270 | 3.520 | 0.451 | 147 |
| d116 | 296.8973 | 1.6268 | 4.355 | 0.531 | 87 |
| d117 | 298.3569 | 1.6268 | 3.756 | 0.514 | 104 |
| d118 | 299.8156 | 1.6266 | 4.546 | 0.538 | 142 |
| d119 | 301.2761 | 1.6268 | 3.258 | 0.450 | 83 |
| Tile ID | AV | A | Number of | ||
|---|---|---|---|---|---|
| [deg] | [deg] | [mag] | [mag] | galaxies | |
| d120 | 302.7357 | 1.6268 | 7.564 | 0.978 | 73 |
| d121 | 304.1952 | 1.6268 | 12.774 | 0.951 | 52 |
| d122 | 305.6592 | 1.6765 | 41.703 | 0.786 | 151 |
| d123 | 307.1145 | 1.6268 | 5.067 | 0.607 | 92 |
| d124 | 308.5740 | 1.6268 | 4.553 | 0.727 | 101 |
| d125 | 310.0336 | 1.6268 | 7.753 | 0.919 | 74 |
| d126 | 311.4932 | 1.6268 | 8.216 | 0.932 | 46 |
| d127 | 312.9528 | 1.6268 | 7.704 | 1.024 | 54 |
| d128 | 314.4124 | 1.6268 | 7.331 | 1.018 | 60 |
| d129 | 315.8719 | 1.6268 | 7.606 | 0.897 | 117 |
| d130 | 317.3316 | 1.6268 | 4.509 | 0.616 | 94 |
| d131 | 318.7912 | 1.6268 | 6.303 | 0.784 | 76 |
| d132 | 320.2508 | 1.6268 | 6.011 | 0.743 | 101 |
| d133 | 321.7104 | 1.6268 | 8.537 | 0.870 | 71 |
| d134 | 323.1699 | 1.6268 | 6.516 | 1.025 | 26 |
| d135 | 324.6295 | 1.6268 | 8.388 | 1.092 | 27 |
| d136 | 326.0891 | 1.6268 | 6.649 | 0.870 | 45 |
| d137 | 327.5487 | 1.6268 | 11.189 | 1.378 | 33 |
| d138 | 328.3753 | 1.6268 | 38.469 | 1.801 | 13 |
| d139 | 330.4679 | 1.6268 | 11.014 | 1.648 | 21 |
| d140 | 331.9275 | 1.6268 | 9.788 | 1.411 | 25 |
| d141 | 333.3871 | 1.6268 | 12.664 | 1.340 | 17 |
| d142 | 334.8467 | 1.6268 | 7.171 | 1.023 | 53 |
| d143 | 336.3062 | 1.6268 | 5.663 | 0.691 | 63 |
| d144 | 337.7658 | 1.6268 | 5.742 | 0.658 | 55 |
| d145 | 339.2255 | 1.6268 | 5.136 | 0.644 | 47 |
| d146 | 340.6850 | 1.6268 | 11.347 | 1.171 | 41 |
| d147 | 342.1446 | 1.6268 | 9.055 | 1.151 | 49 |
| d148 | 343.6042 | 1.6268 | 8.695 | 1.043 | 25 |
| d149 | 345.0639 | 1.6268 | 47.313 | 1.290 | 22 |
| d150 | 346.5234 | 1.6268 | 10.183 | 1.123 | 29 |
| d151 | 347.9830 | 1.6267 | 8.418 | 0.961 | 55 |
| d152 | 349.4426 | 1.6267 | 9.097 | 1.105 | 33 |
Appendix B The 2MASS extended sources in the VVV disk region
In Section 2.2, we reported 185 extended sources from the 2MASX catalogue in the regions of the VVV disk. We visually checked all of these, with this list including 21 galaxies and 164 objects that are mainly stars and stellar associations.
Table 7 shows the 2MASX galaxies that were used to compare our photometry, listing the 2MASX identification in column (1), the Galactic coordinates in columns (2) and (3) from the 2MASX catalogue, the 2MASX and WISE classification types in columns (4) and (5), the heliocentric radial velocity in column (6), and other literature references taken from the NASA Extragalactic Database (NED)444The NASA/IPAC Extragalactic Database (NED) is operated by the Jet Propulsion Laboratory, California Institute of Technology, under contract with the National Aeronautics and Space Administration. in column (7). For the classification, we used G for a galaxy and IrS for an IR source, taken from 2MASX and WISE surveys. The radial velocities were mainly obtained from the HI survey (Staveley-Smith et al. 2016). Following Schröder et al. (2019a), all these sources have flag=1 or ’obvious galaxy’ with the exception of 2MASX J12164837-6103579 with flag=2 or ’galaxy’.
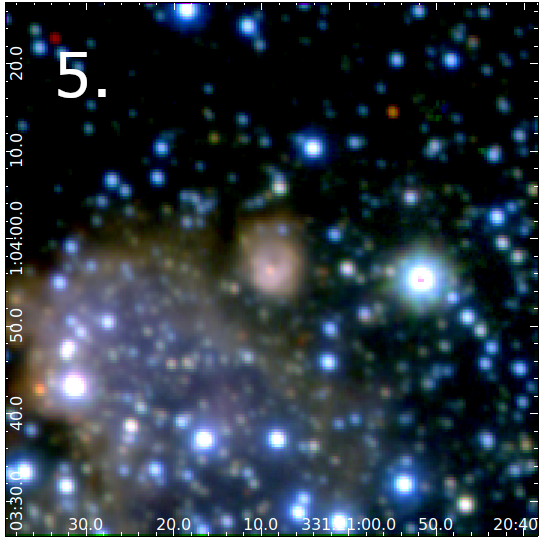
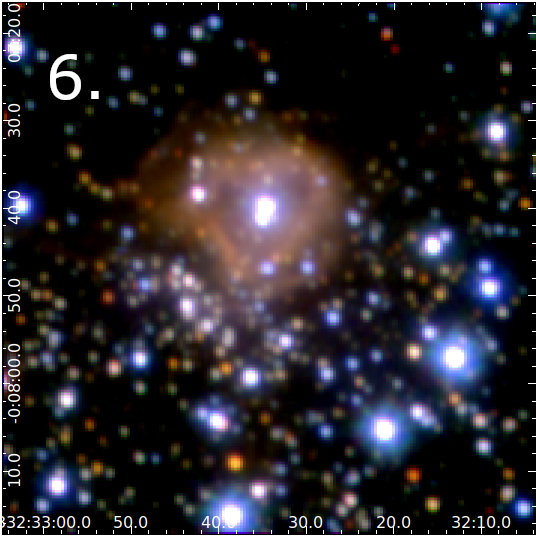
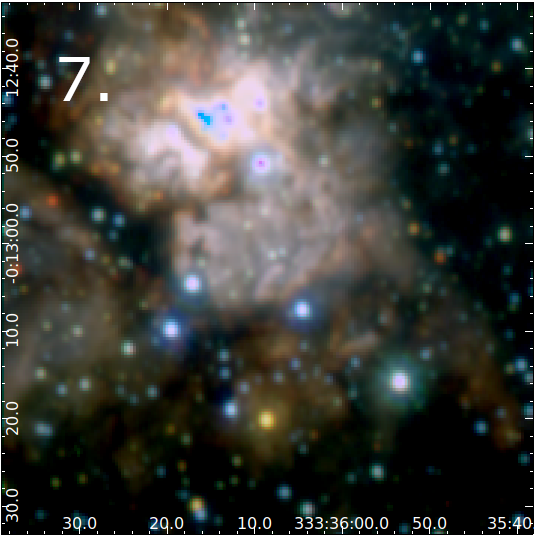
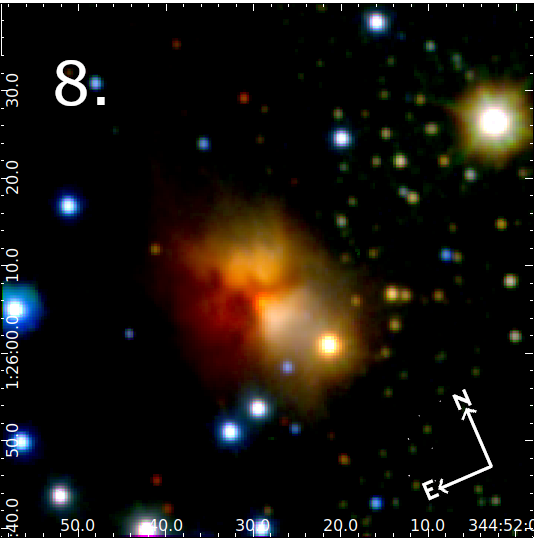
For the 164 2MASX extended objects that are not extragalactic, we searched for the closest object in a circle of 1 arcmin radius using the SIMBAD database555This research has made use of the SIMBAD database, operated at CDS, Strasbourg, France.. We also identified these sources with different surveys at other frequencies. Table 8 shows interesting information of the 164 2MASX extended objects, listing the 2MASX identification in column (1), the Galactic coordinates in columns (2) and (3) from the 2MASX catalogue, the SIMBAD ID of the closest source in the database and the corresponding literature references in columns (4) and (5), and the object description in column (6). In general, we took the object description from the SIMBAD database, and for the cases without previous descriptions (about 16% of the total) we added our comments after the visual inspection. The source 2MASX J13464910-6024299 is the known CenB, a well-studied radio source, and we included only 5 of the 59 available references in the table. The sources 2MASX J13462058-6247497, J16103869-4905591, J16152012-4913215 and J17134463-3705111 have the Schröder et al. (2019a) flags 8p?, 9, 9p and 8p?, respectively, in agreement with our description. Figure 11 shows the VVV colour composed images of some examples of these 2MASX objects, such as HII regions (1. 12100188-6250004 and 3. 12530717-6350331), young stellar object (YSO) candidates (2. 12411836-6144427, 5. 16062307-5043275 and 8. 16574897-4034050), IR sources (6. 16170265-5047083 and 7. 16221035-5006168), and emission line stars (4. 13462058-6247597).
| 2MASX ID | 2MASX | WISE | Radial velocity | REFERENCES | ||
|---|---|---|---|---|---|---|
| [deg] | [deg] | Type | Type | [km/sec] | ||
| J11494881-6400073 | 296.2408 | -1.9336 | IrS | G | 2119 7 | 1, 2, 3, 4, 5, 6, 7, 14, 16 |
| J11523245-5950248 | 295.5898 | 2.1891 | G | G | 5400 15 | 8, 14, 16 |
| J11565971-6019148 | 296.2382 | 1.8419 | G | G | – | 8 |
| J12092077-6229125 | 298.0924 | -0.0111 | IrS | IrS | 1449 14 | 2, 4, 14, 16 |
| J12120649-6045031 | 298.1435 | 1.7548 | IrS | IrS | – | 14 |
| J12153835-6102448 | 298.6112 | 1.5253 | G | G | – | 14 |
| J12164837-6103579 | 298.7541 | 1.5244 | G | G | – | 14 |
| J12190068-6024475 | 298.9365 | 2.2067 | G | G | – | – |
| J12280968-6054558 | 300.1055 | 1.8283 | G | IrS | 5011 51 | 2, 14, 16 |
| J12294880-6107045 | 300.3227 | 1.6442 | G | IrS | 5391 319 | 2, 4, 14, 16 |
| J13281021-6022580 | 307.4590 | 2.1650 | IrS | IrS | – | 9, 14 |
| J13440358-6019350 | 309.4047 | 1.8822 | IrS | IrS | – | 7, 9, 10, 14 |
| J13464910-6024299 | 309.7214 | 1.7315 | G | G | 3872 20 | 6, 9, 11, 14, 15 |
| J13471848-6034133 | 309.7457 | 1.5600 | IrS | IrS | – | 9, 12, 13, 14 |
| J13502487-6005380 | 310.2259 | 1.9398 | G | IrS | – | 14 |
| J14062119-6025446 | 312.0511 | 1.1096 | G | IrS | – | 2, 8, 13, 14 |
| J14155209-5855348 | 313.6519 | 2.1768 | G | IrS | 5399 4 | 2, 4, 8, 14 |
| J14391130-5742293 | 316.9480 | 2.2014 | G | IrS | – | 6, 8, 14 |
| J15232096-5915266 | 321.2764 | -1.9076 | IrS | IrS | – | 14 |
| J15395406-5737113 | 323.9908 | -1.8069 | G | G | – | 8, 14 |
| J16174633-4751584 | 334.6618 | 1.8824 | G | G | – | 8, 14 |
- •
- •
- •
- •
| 2MASX ID | SIMBAD ID | REFERENCES | Description | ||
|---|---|---|---|---|---|
| [deg] | [deg] | ||||
| J11402953-6327520 | 295.1064 | -1.6758 | La Serena 003 | 1 | Possible (open) star cluster |
| J11450474-6317459 | 295.5581 | -1.3783 | La Serena 009 | 1 | Possible (open) star cluster |
| J11520923-6153348 | 296.0102 | 0.1794 | IRAS 11496-6136 | 2 | Carbon Star |
| J11535055-6420218 | 296.7457 | -2.1616 | VVV CL007 | 3 | Cluster of Stars |
| J11585505-6337470 | 297.1394 | -1.3502 | G297.1390-01.3510 | 4 | IR source |
| J12005699-6304097 | 297.2516 | -0.7558 | La Serena 017 | 1 | Possible (open) star cluster |
| J12090125-6315596 | 298.1830 | -0.7866 | ESO 95-1 | 5 | HII (ionized) region |
| J12095662-6249224 | 298.2143 | -0.3319 | Caswell CH3OH 298.22-00.33 | 6 | Maser |
| J12100013-6250474 | 298.2247 | -0.3541 | – | – | Star |
| J12100188-6250004 | 298.2259 | -0.3407 | G298.2-00.3 | 7 | HII (ionized) region |
| J12114684-6146291 | 298.2609 | 0.7368 | VVV CL010 | 3 | Cluster of stars |
| J12152350-6301156 | 298.8570 | -0.4348 | [HLB98] SEST 54 | 8 | Maser |
| J12152500-6301207 | 298.8600 | -0.4358 | G298.8591-00.4372 | 14 | YSO |
| J12204537-6310426 | 299.4790 | -0.5126 | – | – | Star with a bright nearby star |
| J12294170-6213085 | 300.4012 | 0.5458 | IRAS 12268-6156 | 5 | Dense core |
| J12300399-6256387 | 300.5045 | -0.1731 | G300.5047-00.1745 | 4 | HII (ionized) region |
| J12324972-6135310 | 300.7200 | 1.1998 | [MHL2007] G300.7221+01.2007 | 14 | YSO |
| J12344923-6139290 | 300.9607 | 1.1501 | – | – | Star |
| J12345078-6139070 | 300.9633 | 1.1564 | WRAY 16-118 | 9 | PN |
| J12345259-6140190 | 300.9682 | 1.1366 | VVV CL015 | 3 | Cluster of stars |
| J12345752-6139401 | 300.9772 | 1.1480 | G300.9785+01.1459 | 4 | IR source |
| J12350355-6141451 | 300.9913 | 1.1141 | VVV CL016 | 3 | Open (galactic) Cluster |
| J12360541-6150347 | 301.1221 | 0.9748 | – | – | Star |
| J12411836-6144427 | 301.7329 | 1.1030 | G301.7319+01.1030 | 14 | YSO candidate |
| J12415682-6204187 | 301.8208 | 0.7794 | G301821+007850 | 10 | Bubble |
| J12433200-6255130 | 302.0325 | -0.0624 | IRAS 12405-6238 | 5 | HII (ionized) region |
| J12501909-6134572 | 302.7987 | 1.2889 | DBS2003 80 | 11 | Open (galactic) Cluster |
| J12502553-6135223 | 302.8115 | 1.2819 | DBS2003 80 | 11 | Open (galactic) Cluster |
| J12530717-6350331 | 303.1173 | -0.9714 | IRAS 12500-6334 | 5 | HII (ionized) region |
| J12545111-6102526 | 303.3453 | 1.8211 | IRAS 12518-6046 | 12 | Far-IR source |
| J12552193-6104510 | 303.4070 | 1.7873 | – | – | Nebula |
| J13083302-6214482 | 304.9227 | 0.5588 | DBS2003 82 | 11 | Cluster of stars |
| J13084090-6215161 | 304.9375 | 0.5501 | HTU2013 2 | 13 | Dense core |
| J13110865-6234415 | 305.1986 | 0.2068 | G305.197+0.206 | 13 | HII (ionized) region |
| J13111431-6245005 | 305.1962 | 0.0345 | DBS2003 83 | 11 | Cluster of stars |
| J13111621-6245505 | 305.1988 | 0.0204 | DBS2003 84 | 11 | Cluster of stars |
| J13121738-6242198 | 305.3198 | 0.0695 | DBS2003 132 | 11 | Cluster of stars |
| J13122717-6233047 | 305.3510 | 0.2217 | G305.348+0.223 | 13 | HII (ionized) region |
| J13142096-6244230 | 305.5520 | 0.0154 | IRAS 13111-6228 | 5 | HII (ionized) region |
| J13142635-6244309 | 305.5621 | 0.0123 | G305.561+0.013 | 14 | YSO candidate |
| J13270813-6203201 | 307.1010 | 0.5269 | DZOA 4638-16 | 15 | IR source |
| J13324267-6026541 | 308.0094 | 2.0147 | G308.0023+02.0190 | 14 | YSO Candidate |
| J13405761-6145447 | 308.7543 | 0.5482 | DZOA 4648-07 | 15 | IR source |
| J13455154-6009067 | 309.6594 | 2.0071 | – | – | Star |
| J13462058-6247597 | 309.1589 | -0.5939 | IRAS 13428-6232 | 17 | Emission-line star |
| J13463702-6239303 | 309.2196 | -0.4622 | AGAL G309.221-00.462 | 18 | Sub-millimetric source |
| J13503488-6140199 | 309.8877 | 0.3982 | DZOA 4655-12 | 15 | YSO |
| J13510266-6130150 | 309.9796 | 0.5493 | IRAS 13475-6115 | 12 | Star |
| J13515956-6115394 | 310.1462 | 0.7597 | Caswell OH 310.146+00.760 | 6 | Maser |
| J14020791-6148249 | 311.1783 | -0.0723 | [MHL2007] G311.1794-00.0720 | 14 | YSO candidate |
| J14023620-6105450 | 311.4253 | 0.5969 | DZOA 4664-05 | 15 | IR source |
| J14023845-6118190 | 311.3727 | 0.3941 | – | – | Faint star with bright nearby star |
| J14084243-6110419 | 312.1084 | 0.3092 | AGAL G312.108+00.309 | 18 | Sub-millimetric source |
| J14143959-6222433 | 312.4121 | -1.0486 | IRAS 14109-6208 | 12 | Far-IR source ( 30 m) |
| J14242344-6205208 | 313.5772 | -1.1540 | AGAL G313.576-01.154 | 18 | YSO |
| J14245658-6144520 | 313.7582 | -0.8574 | AKARI-IRC-V1 J1424563-614450 | 19 | Star |
| J14275344-5844595 | 315.1742 | 1.8103 | – | – | Star with a bright nearby star |
| J14420173-6030091 | 316.1402 | -0.4984 | BNM96 316.139-0.503 | 5 | HII (ionized) region |
| J14450462-5949094 | 316.7704 | -0.0363 | SMN83 G316.8-0.1 1 | 20 | Part of a cloud |
| J14450514-5949050 | 316.7719 | -0.0357 | VGO2007 14416-5937 B | 21 | IR source |
| 2MASX ID | SIMBAD ID | REFERENCES | Description | ||
|---|---|---|---|---|---|
| [deg] | [deg] | ||||
| J14452278-5949415 | 316.8011 | -0.0605 | WBB2001 41 | 22 | IR source |
| J14592915-5820102 | 319.0892 | 0.4604 | IRAS 14556-5808 | 5 | HII (ionized) region |
| J14593166-5749002 | 319.3392 | 0.9158 | IRAS 14557-5737 | 5 | HII (ionized) region |
| J15002412-5924522 | 318.6831 | -0.5455 | – | – | No object detected |
| J15003503-5858101 | 318.9150 | -0.1650 | WBB2001 43 | 22 | IR source |
| J15031365-5904294 | 319.1630 | -0.4206 | IRAS 14593-5852 | 5 | HII (ionized) region |
| J15034121-5835075 | 319.4522 | -0.0213 | VVV CL044 | 3 | Cluster of stars |
| J15051680-5731176 | 320.1555 | 0.8043 | WRAY 16-160 | 9 | PN |
| J15160510-5811445 | 321.0508 | -0.5063 | AGAL G321.054-00.507 | 18 | Sub-millimetric source |
| J15183778-5638505 | 322.1607 | 0.6262 | MSX5C G322.1587+00.6262 | 4 | IR source |
| J15202255-5627119 | 322.4679 | 0.6611 | IRAS 15165-5616 | 23 | Star |
| J15325265-5556106 | 324.1995 | 0.1206 | IRAS 15290-5546 | 5 | HII (ionized) region |
| J15370333-5500156 | 325.2236 | 0.5332 | – | – | Star with a bright nearby star |
| J15373472-5534467 | 324.9446 | 0.0246 | – | – | Star |
| J15421778-5358308 | 326.4482 | 0.9056 | IRAS 15384-5348 | 5 | HII (ionized) region |
| J15433657-5357522 | 326.6084 | 0.7972 | VVV CL055 | 3 | Cluster of stars |
| J15444145-5405599 | 326.6518 | 0.5931 | [DBS2003] 95 | 5 | HII (ionized) region |
| J15450053-5402059 | 326.7284 | 0.6160 | [RA2006b] IRS 2 | 24 | NIR source ( 10 m) |
| J15455314-5430042 | 326.5440 | 0.1691 | AGAL G326.544+00.169 | 18 | Sub-millimetric source |
| J15462068-5410535 | 326.7932 | 0.3802 | IRAS 15425-5401 | 23 | Outflow candidate |
| J15491623-5425461 | 326.9747 | -0.0788 | IRAS 15453-5416 | 23 | Star |
| J15500315-5403503 | 327.2922 | 0.1353 | – | – | Star |
| J15530050-5434515 | 327.3015 | -0.5377 | MSX6C G327.3017-00.5382 | 4 | IR source |
| J15530199-5435425 | 327.2953 | -0.5509 | AGAL G327.301-00.552 | 18 | YSO |
| J15530579-5435206 | 327.3063 | -0.5520 | GAL 327.3-00.5 | 25 | HII (ionized) region |
| J15540626-5311391 | 328.3071 | 0.4310 | GAL 328.31+00.45 | 26 | HII (ionized) region |
| J15540750-5323442 | 328.1812 | 0.2737 | SDC G328.178+0.285 | 27 | Dark cloud (nebula) |
| J15560795-5419395 | 327.8128 | -0.6322 | MMB G327.808-00.634 | 28 | Maser |
| J15575303-5402134 | 328.1960 | -0.5751 | IRAS 15539-5353 | 5 | HII (ionized) region |
| J15581658-5207370 | 329.4774 | 0.8426 | [MHL2007] G329.4761+00.8414 2 | 14 | YSO candidate |
| J15593814-5345369 | 328.5721 | -0.5321 | GUM 50 | 29 | HII (ionized) region |
| J15594129-5344479 | 328.5868 | -0.5268 | TYC 8697-1749-1 | 30 | Star |
| J16005582-5236231 | 329.4725 | 0.2150 | IRAS 15570-5227 | 5 | HII (ionized) region |
| J16011315-5234360 | 329.5252 | 0.2087 | MMB G329.526+00.216 | 28 | Maser |
| J16015300-5356196 | 328.7059 | -0.8840 | IRAS 15579-5347 | 12 | Far-IR source ( 30 m) |
| J16055177-5048136 | 331.2379 | 1.0617 | AGAL G331.239+01.059 | 31 | Sub-millimetric source |
| J16062307-5043275 | 331.3524 | 1.0657 | 2MASS J16062311-5043276 | 14 | YSO candidate |
| J16062662-5043302 | 331.3589 | 1.0589 | [CPA2006] S59 | 32 | Bubble |
| J16075456-4918476 | 332.4815 | 1.9473 | – | – | No object detected |
| J16103869-4905591 | 332.9552 | 1.8021 | IRAS 16069-4858 | 5 | HII (ionized) region |
| J16121310-5202389 | 331.1301 | -0.5220 | IRAS 16083-5154 | 5 | HII (ionized) region |
| J16124234-5145015 | 331.3859 | -0.3593 | VVV CL063 | 3 | Cluster of stars |
| J16150065-4950392 | 332.9614 | 0.7739 | [DBS2003] 102 | 33 | Open (galactic) Cluster |
| J16151362-4948505 | 333.0074 | 0.7717 | SSTGLMC G333.0075+00.7709 | 34 | AGB star candidate |
| J16151868-4948535 | 333.0167 | 0.7617 | [GGB2012] G333.0162+00.7615 | 35 | Outflow candidate |
| J16152012-4913215 | 333.4291 | 1.1868 | PN Pe 1-5 | 36 | PN |
| J16164238-5117132 | 332.1561 | -0.4532 | GAL 332.15-00.45 | 26 | HII (ionized) region |
| J16170265-5047083 | 332.5428 | -0.1297 | 2MASS J16170288-5047051 | 37 | NIR source ( 10 m) |
| J16185735-5023591 | 333.0294 | -0.0650 | MSX6C G333.0299-00.0645 | 38 | HII (ionized) region |
| J16190102-5020341 | 333.0763 | -0.0312 | – | – | Star with bright nearby stars |
| J16192228-5009150 | 333.2489 | 0.0637 | IRAS 16156-5002 | 5 | HII (ionized) region |
| J16195698-5045452 | 332.8874 | -0.4343 | – | – | Star with bright nearby star |
| J16200971-4936012 | 333.7284 | 0.3687 | PN G333.7+00.3 | 4 | Possible PN |
| J16201048-5053291 | 332.8221 | -0.5509 | 2MASS J16201045-5053286 | 14 | YSO candidate |
| J16203332-5040423 | 333.0148 | -0.4419 | MSX5C G333.0149-00.4431 | 4 | IR source |
| J16205968-5035141 | 333.1284 | -0.4263 | [MHL2007] G333.1306-00.4275 3 | 14 | YSO candidate |
| J16210034-5036143 | 333.1179 | -0.4393 | [MKN2004] MMS 40 | 50 | Millimetric radio-source |
| J16210050-5035089 | 333.1310 | -0.4268 | [MHL2007] G333.1306-00.4275 1 | 14 | YSO candidate |
| J16213188-5025042 | 333.3085 | -0.3664 | AGAL G333.308-00.366 | 18 | YSO |
| J16220862-5005405 | 333.6062 | -0.2070 | – | – | IR source |
| 2MASX ID | SIMBAD ID | REFERENCES | Description | ||
|---|---|---|---|---|---|
| [deg] | [deg] | ||||
| J16221035-5006168 | 333.6023 | -0.2174 | MSX5C G333.6044-00.2165 | 4 | IR source |
| J16225317-5048489 | 333.1801 | -0.7981 | CD-50 10459 | 39 | Emission-line star |
| J16265564-4909491 | 334.8132 | -0.1072 | MSX6C G334.8128-00.1059 | 40 | IR source |
| J16395987-4851524 | 336.4891 | -1.4760 | – | – | YSO |
| J16405900-4707080 | 337.9057 | -0.4423 | 2MASS J16405819-4706319 | 40 | AGB star candidate |
| J16410569-4707383 | 337.9119 | -0.4621 | [PLW2012] G337.909-00.462-039.2 | 41 | Dense core |
| J16410805-4706463 | 337.9272 | -0.4575 | [MHL2007] G337.9266-00.4588 1 | 14 | YSO candidate |
| J16410990-4708074 | 337.9138 | -0.4764 | EGO G337.91-0.48 | 42 | Outflow candidate |
| J16431592-4605409 | 338.9342 | -0.0620 | – | – | IR source |
| J16521117-4703067 | 339.1934 | -1.8506 | 2MASS-GC03 | 43 | Globular Cluster |
| J16534645-4316088 | 342.2984 | 0.3288 | VVV CL089 | 3 | Open (galactic) Cluster |
| J16541460-4517282 | 340.7828 | -1.0124 | AGAL G340.784-01.016 | 31 | Sub-millimetric source |
| J16541621-4519002 | 340.7659 | -1.0322 | – | – | Star |
| J16541764-4517122 | 340.7918 | -1.0165 | RCW 110B | 51 | HII (ionized) region |
| J16560261-4304439 | 342.7066 | 0.1268 | [GBM2006] 16524-4300A | 44 | Radio-source |
| J16563986-4013290 | 345.0065 | 1.8214 | [MHL2007] G345.0052+01.8209 1 | 14 | YSO candidate |
| J16564527-4014280 | 345.0044 | 1.7977 | IRAS 16533-4009 | 4 | HII (ionized) region |
| J16574897-4034050 | 344.8746 | 1.4360 | [MHL2007] G344.8746+01.4347 1 | 14 | YSO candidate |
| J16592078-4232376 | 343.5024 | -0.0142 | MSX6C G343.5024-00.0145 | 4 | IR source |
| J16593051-4010419 | 345.3804 | 1.4247 | [CAB2011] G345.37+1.42 | 45 | Millimetric radio-source |
| J16593668-4003251 | 345.4880 | 1.4842 | [GGR2014] 1 | 46 | Millimetric radio-source |
| J16593754-4005271 | 345.4630 | 1.4611 | [MHL2007] G345.4640+01.4581 1 | 14 | YSO candidate |
| J16594225-4003451 | 345.4946 | 1.4668 | IRAS 16562-3959 | 47 | Star forming region |
| J16594625-4004141 | 345.4961 | 1.4518 | – | – | Nebula |
| J17003381-4034210 | 345.1940 | 1.0234 | – | – | Star |
| J17003600-4033300 | 345.2095 | 1.0266 | [DBS2003] 113 | 33 | Cluster of stars |
| J17003811-4032379 | 345.2249 | 1.0303 | MSX6C G345.2244+01.0304 | 4 | IR source |
| J17041301-4220009 | 344.2194 | -0.5953 | 2MASX J17041301-4220009 | 43 | Cluster of stars |
| J17042084-4044456 | 345.4955 | 0.3495 | [MCM2005b] 89 | 33 | Cluster of stars |
| J17042791-4046186 | 345.4885 | 0.3160 | MSX6C G345.4881+00.3148 | 4 | HII (ionized) region |
| J17043294-4039237 | 345.5898 | 0.3734 | AGAL G345.589+00.372 | 48 | YSO |
| J17051332-4101242 | 345.3751 | 0.0498 | – | – | Stars |
| J17093532-4135589 | 345.4062 | -0.9519 | [DBS2003] 116 | 33 | Cluster of stars |
| J17134463-3706111 | 349.5094 | 1.0554 | NGC 6302 | 36 | PN |
| J17182142-3919134 | 348.2307 | -0.9700 | – | – | IR source |
| J17182340-3918444 | 348.2410 | -0.9706 | [TPR2014] IRAS 17149 B3 | 49 | Star in Nebula |
| J17182590-3919264 | 348.2361 | -0.9839 | MSX5C G348.2362-00.9804 | 52 | IR source |
| J17182961-3919024 | 348.2484 | -0.9899 | [BBC2006] IRAS 17149-3916 Clump 4 | 53 | Dense core |
| J17191552-3904324 | 348.5314 | -0.9724 | [BNM96] 348.534-0.973 | 5 | HII (ionized) region |
| J17192058-3903543 | 348.5494 | -0.9797 | [GMB2007b] 17158-3901 C | 50 | Millimetric radio-source |
| J17195582-3900424 | 348.6585 | -1.0427 | [MHL2007] G348.6600-01.0446 1 | 14 | YSO candidate |
| J17200331-3858039 | 348.7085 | -1.0374 | – | – | Star |
| J17200631-3858379 | 348.7063 | -1.0507 | – | – | Star in Nebula |
| J17200691-3859539 | 348.6901 | -1.0644 | – | – | Stars |
- •
- •
- •
- •
- •
- •
- •
- •
- •
- •