Scalable hyperfine qubit state detection via electron shelving in the 2D5/2 and 2F7/2 manifolds in
Abstract
Qubits encoded in hyperfine states of trapped ions are ideal for quantum computation given their long lifetimes and low sensitivity to magnetic fields, yet they suffer from off-resonant scattering during detection often limiting their measurement fidelity. In this is exacerbated by a low fluorescence yield, which leads to a need for complex and expensive hardware – a problematic bottleneck especially when scaling up the number of qubits. We demonstrate a detection routine based on electron shelving to address this issue in and achieve a 5.6 reduction in single-ion detection error on an avalanche photodiode to in a 100 s detection period, and a 4.3 error reduction on an electron multiplying CCD camera, with error in 400 s. We further improve the characterization of a repump transition at 760 nm to enable a more rapid reset of the auxiliary states populated after shelving. Finally, we examine the detection fidelity limit using the long-lived state, achieving a further 300 and 12 reduction in error to and in 1 ms on the respective detectors. While shelving-rate limited in our setup, we suggest various techniques to realize this detection method at speeds compatible with quantum information processing, providing a pathway to ultra-high fidelity detection in .
I Introduction
Trapped ions have seen a resurgence as a leading platform for the development of quantum information systems. In recent years, a primary area of research has been the quality of single- and two-qubit gates, where fidelities of better than 99.99% Harty et al. (2014); Gaebler et al. (2016); Sepiol et al. (2019) and 99.9% Gaebler et al. (2016); Ballance et al. (2016) have been reported, respectively. Enabled by quantum control techniques, such as amplitude, frequency and phase-modulation Choi et al. (2014); Leung et al. (2018); Milne et al. (2020), high-fidelity two-qubit gates are now possible at high speeds Schäfer et al. (2018); Zhang et al. (2020) and also across larger qubit registers Wright et al. (2019); Bentley et al. (2020). Progress in this domain has allowed for the implementation of longer and more complex quantum circuits (e.g. Nam et al., 2020; Erhard et al., 2020; Egan et al., 2020). Yet, as the number of qubits in a joint register – and thereby the potential size of a correlated state – grows, an increasingly important area for improvement becomes state-detection fidelity. Detection errors are generally statistically independent and scale at least linearly with the number of qubits. They therefore quickly become a significant factor limiting the overall performance of a multi-qubit register, e.g. in the context of active quantum error correction conditioned on stabilizer measurements Schindler et al. (2011); Nigg et al. (2014); Bermudez et al. (2017); Egan et al. (2020).
Various qubit encodings are available in trapped ions which bring with them different advantages and drawbacks – including in the area of demonstrated measurement fidelity. One can either choose two ground states of the fine- or hyperfine structure for the encoding, or split the logical states across a ground- and a metastable state to form an optical qubit Bruzewicz et al. (2019). Hyperfine qubits such as Gaebler et al. (2016), Benhelm et al. (2008); Kirchmair et al. (2009) or Olmschenk et al. (2007) as considered here, are an attractive choice in that they do not suffer from energy relaxation ( decay) like optical qubits, and also offer so-called “clock states” that are first-order insensitive to perturbations from magnetic fields (providing long coherence). Here, the qubit states are separated by microwave frequencies on the order of several to tens of GHz enabling the use of low-noise microwave sources for high-fidelity qubit control Harty et al. (2014); Ball et al. (2016); Edmunds et al. (2020).
Measurement on either category of trapped-ion qubit is generally performed using state-dependent laser-induced fluorescence Wineland et al. (1995), whereby one logical state, the “bright state”, scatters photons and the other does not, hence being referred to as “dark state”. Optical qubits enable efficient discrimination between these states and have shown high detection fidelities, leveraging the large energy-level separation of the qubit manifold Myerson et al. (2008); Burrell et al. (2010). By contrast, when using hyperfine qubits the relatively small energy gap between the qubit states results in unwanted off-resonant scattering during detection. This scattering limits the useful duration of the detection period and thereby the number of photons that can be collected in it, negatively impacting the ability to distinguish qubit states from associated photon-detection-probability distributions. To overcome this obstacle, one may pursue the use of new complex imaging and detection hardware Debnath et al. (2016); Seif et al. (2018); Crain et al. (2019); Todaro et al. (2020); Zhukas et al. (2020) or software-based data processing of time-resolved information Hume et al. (2007); Myerson et al. (2008); Hemmerling et al. (2012); Wölk et al. (2015); Seif et al. (2018); Ding et al. (2019). As qubit numbers are increased, however, the overhead for detection hardware and software can become limiting, motivating an exploration of complementary “physics-based” schemes to improve measurement fidelity in hyperfine qubits.
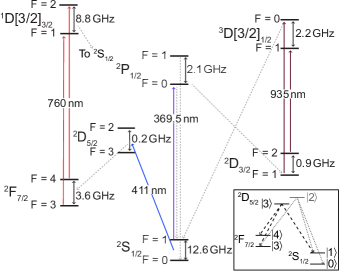
In this paper, we borrow a detection technique widely employed in optical qubits to perform electron shelving on a hyperfine qubit to increase detection fidelity without modification of detection hardware or software. By shelving the population of one of the qubit states to a metastable state separated by an optical transition, we can detect population remaining in the qubit manifold without being limited by off-resonant scattering and the resulting leakage to the other logical state. We implement this method using a quadrupole transition at 411 nm from the qubit manifold to the state, and separately to the extremely long-lived metastable level (Fig. 1). We also employ a repump laser at 760 nm to efficiently restore all population to the qubit manifold after the detection period via the rapidly decaying state. In our work, we further combine the shelving routine with efficient software post-processing techniques using photons collected on an avalanche photodiode (APD) and an electron multiplying charged coupled device (EMCCD) camera, using a time-resolved, non-adaptive maximum likelihood protocol on the APD Wölk et al. (2015) and a machine-learning-based image classifier on the EMCCD. We characterize and compare the various routines, demonstrating measurement-fidelity improvements up to leveraging the level, and describe how this may be efficiently integrated into quantum information experiments.
II Trapped ion qubit state detection
Various approaches are being pursued to improve qubit state detection with ions, which can be broadly classed as hardware-, software-, or physics-based. The first category uses specialized detectors, such as superconducting nanowire single photon detectors (SNSPDs) either stand-alone Crain et al. (2019) or embedded in a surface-electrode RF trap Todaro et al. (2020), multi-channel photomultiplier tubes (PMTs) Debnath et al. (2016); Seif et al. (2018), or fast intensified cameras Zhukas et al. (2020). Several software-based methods have been demonstrated to improve the final state estimation. Combining a record of the incident timing of photons during detection with prior knowledge such as the expected fluorescence rate and decay times and from the bright and dark states, one can infer the final state from a maximum likelihood calculation Myerson et al. (2008). Furthermore, if real-time data processing is available, the same detection fidelity can be achieved in shorter detection times using an adaptive version of this technique. Wölk et al. Wölk et al. (2015) analyze the time-resolved detection methods for the case of , which had been experimentally demonstrated for optical qubits by Myerson et al. Myerson et al. (2008), and hyperfine qubits by Hume et al. Hume et al. (2007) and Hemmerling et al. Hemmerling et al. (2012). Other software-based approaches include recent work by Ding et al. Ding et al. (2019) investigating the use of machine-learning methods for state estimation, implemented in hardware on an FPGA with a single qubit; they achieve similar results to Seif et al. Seif et al. (2018), who apply machine learning methods to the time-resolved readout from a PMT array in post-processing.
Detection of optical qubits falls under the physics-based approaches, achieving a very high signal-to-noise ratio through what is generally referred to as “electron shelving” after Hans Dehmelt Dehmelt (1975); Nagourney et al. (1986). In such settings, measurement fidelities of have been reported for an optical qubit encoded in 40Ca+ using time-resolved measurements of fluorescence Myerson et al. (2008), and separately, without time resolution, on an EMCCD camera Burrell et al. (2010). The detection fidelity of an optical qubit is fundamentally limited by the lifetime of the metastable state (a decay process). Although the associated decay rate during detection is often low under typical detection times, the decay probabilities are independent for each ion and can thereby quickly become the limiting factor to the overall state detection fidelity in larger qubit registers. To address this problem, a newer generation of fast cameras is being developed, which allow time-resolved measurements to be carried out while also providing spatial resolution for identification of the unique quantum state in a multi-qubit register. First demonstrations have recently been reported for an electron-shelved read-out in 138Ba+ Zhukas et al. (2020), reaching fidelity for a single qubit and at least 99.7% in a four-qubit register.
In the measurement-fidelity limiting factor is leakage between the hyperfine qubit levels during detection. The two logical states encoded in the levels can be distinguished by state-selective fluorescence induced by a 369 nm laser resonant with the transition, which, aside from a small branching ratio to , forms a closed cycling transition (Fig. 1). However, the small hyperfine splitting of 2.11 GHz between adjacent levels results in a comparatively large off-resonant scattering probability causing leakage primarily from the bright state to the dark state . The inverse occurs as well, but with a lower probability due to the effective GHz detuning. The dynamics of this asymmetric leakage during state detection in hyperfine qubits have been analyzed theoretically by Acton et al. Acton et al. (2005) and, more specifically for the case of , by Wölk et al. Wölk et al. (2015). A further challenge in is its low fluorescence yield compared to other isotopes without nuclear spin, such as . Fluorescence increases with the strength of an applied magnetic field Ejtemaee et al. (2010), but so does the magnetic field sensitivity of the clock transition encoding the qubit, negatively impacting the available phase coherence time ().
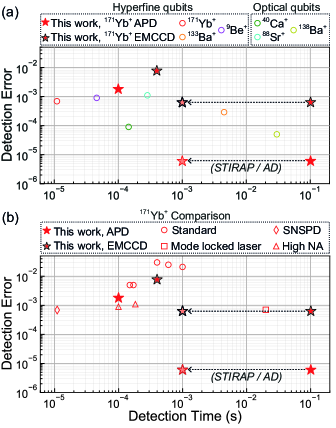
The efficiency of a detection protocol can be quantified in two dimensions, through the measured detection error and the required detection time – both of which should be ideally minimized for practical use in quantum computing. In Fig. 2(a) we show an overview of results reported in the trapped-ion field for both hyperfine and optical qubits together with the results (red stars) described in this manuscript using the APD (red outline) and the EMCCD (black outline). Figure 2(b) compares detection errors for the specific case of . Open-circle markers represent measurements achieved without special hardware for photon collection. The open-triangle markers show detection fidelities achieved using a high NA objective Noek et al. (2013) and the open-square marker is a measurement in using a mode-locked laser to achieve near background free detection in the dark periods between ultra-short pulses Roman et al. (2020). The open-diamond markers use SNSPDs to collect photons from Crain et al. (2019) and Todaro et al. (2020). The work we report here exceeds the results achieved with “standard” detection hardware in , and if combined with high-speed optical pumping via STIRAP provides a route for field-leading performance in detection error at practically relevant measurement times.
III Experimental Setup
We realize a qubit in the hyperfine clock states of , designating and . Our experiments are carried out in a blade-style linear Paul trap with secular trap frequencies of MHz. The magnetic quantization field is produced by a permanent magnet, creating a 440.9(6) T field at the ion position, which was measured using the linear Zeeman shift of 13.98(1) kHz/T Meggers (1967). Single-qubit operations are driven with a microwave field produced by a vector signal generator111Keysight E8267D that is delivered through an in-vacuum loop antenna. Photons emitted during laser cooling and state detection are collected by a custom-made objective with an effective NA = 0.56 and imaged onto either an APD222Laser Components COUNT-10B or an EMCCD333Andor iXon Ultra 897.
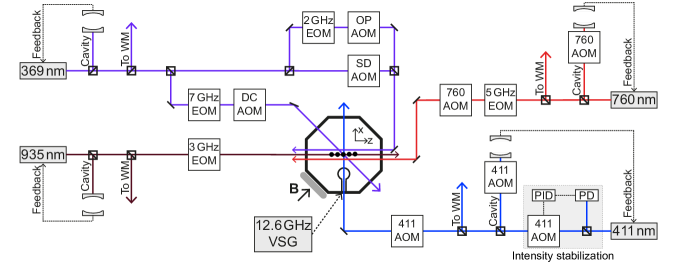
A simplified energy-level diagram showing the states and transitions in relevant to this work is shown in Fig. 1, and a simplified schematic of the experimental setup is given in Fig. 3. Doppler cooling (DC), optical pumping (OP), and state detection (SD) utilize the transition; this requires a diode laser near 369.5 nm, nominally tuned to the inner transition that is split into three different beamlines. A second-order sideband from a 7.374 GHz electro-optic modulator (EOM) simultaneously excites the outer transition during Doppler cooling ensuring all manifold states are addressed. At the start of each experiment, following Doppler cooling, the ion is prepared in the qubit state by adding a 2.105 GHz sideband via a separate EOM to the 369 nm laser; this optically pumps any population in to via Olmschenk et al. (2007). To directly measure the final qubit state, the 369.5 nm laser light is applied to the ion without any additional modulation to selectively excite , the “bright” qubit state. Occasional decays from to (0.5%) remove the ion from the cooling cycle and logical state space, necessitating a repump laser at 935 nm that is operated continuously. An EOM running at 3.067 GHz adds sidebands to the 935 nm laser to ensure both hyperfine levels of the are repumped.
In this work, we introduce two additional lasers for the purpose of state detection: a 411 nm laser444Moglabs LDL-202 with a Fast Servo Controller (FSC) for electron shelving from to Roberts et al. (1999); Keller (2015); Feldker et al. (2020); Roman et al. (2020); Tan et al. (2020), and a 760 nm laser Huntemann et al. (2012a); Jau et al. (2015); Mulholland et al. (2019) for repumping from the long-lived state ( years Roberts et al. (2000)) via . The 760 nm laser replaces a 638 nm laser Sugiyama (1999) commonly used for this purpose and gives the benefit of substantially faster repumping. An EOM driven at 5.258 GHz adds sidebands to the 760 nm laser to excite both hyperfine states. We stabilize both laser frequencies through Pound-Drever-Hall locks to cylindrical Fabry-Pérot cavities555Stable Laser Systems, Boulder CO, USA with a free spectral range of 1.5 GHz; the 411 nm (760 nm) cavity has a finesse of approximately 32,000 (1,0002,000) and a drift rate of mHz/s ( Hz/s). The ultra-low expansion spacer of the 411 nm cavity is temperature stabilized close to the minimum of its coefficient of thermal expansion (CTE) located at 38.2∘C. Absolute frequency measurements use a HeNe-calibrated wavemeter666HighFinesse WSU-10 with a 500 kHz precision, 10 MHz absolute accuracy at 760 nm and 177 MHz absolute accuracy at 411 nm (due to operating nm from the 633 nm calibration wavelength).
IV Atomic spectroscopy
In order to implement electron-shelved detection using or , we make use of a precision characterization of the transition at 411 nm, which we report separately in a jointly submitted manuscript. Table 1 contains all of the relevant parameters that have been measured by our team, and we direct interested readers to Ref. Tan et al. (2020) for full details on the measurements of the 411 nm transition, including the lifetime, branching ratios, quadratic Zeeman coefficient and hyperfine constant of the states. From here on, we use simplified notation for the hyperfine levels in Dirac notation by omitting the and labels, shortening the labels to .
| Parameter | This work (exp.) |
|---|---|
| 411 nm frequency for (THz) | 729.487752(177) |
| 411 nm frequency for (THz) | 729.474917(177) |
| Hyperfine constant of (MHz) | -63.368(1) |
| Linear Zeeman coefficient of (kHz/) | 13.96(2) |
| Linear Zeeman coefficient of (kHz/) | 19.61(3) |
| Quadratic Zeeman coefficient for (Hz/) | -0.350(1) |
| Lifetime of (ms) | 7.1(4) |
| Decay from to | 17.6(4)% |
| Decay from to | 82.4(4)% |
| Lifetime of (ms) | 7.4(4) |
| Decay from to | 11.1(3)% |
| Decay from to | 7.4(3)% |
| Decay from to | 81.6(4)% |
| 760 nm repumper center frequency (THz) after preparing | 394.430203(16) |
| 760 nm repumper center frequency (THz) after preparing | 394.424943(20) |

After each experiment involving the state, any population that has decayed to must be returned to the qubit manifold. There are several possible transitions over a range of wavelengths that can be driven to achieve this goal: 638 nm Gill et al. (1995), 760 nm Huntemann et al. (2012a), 828 nm Sugiyama (1999), or 864 nm Taylor et al. (1997). Here, we employ a 760 nm laser as it has been observed to have the most rapid clear-out time. This phenomenology owes to its excited energy level exhibiting a short upper-state lifetime (29 ns Berends et al. (1993)), and a decay path primarily to the ground states rather than other D-levels Sugiyama (1999).
In Fig. 4, we present the measured spectra for the 760 nm transition; the measurement protocol is illustrated schematically in panel (a). We first prepare the ion in one of the levels using the 411 nm shelving laser. A subsequent 10 ms wait period allows the ion to decay to either or . Following the wait period, a 100 s period of high power, on resonance Doppler cooling induces fluorescence in cases where the ion has not decayed to , and we discard these experiments in post-processing. The 760 nm laser is then applied to clear out the state at a frequency adjusted through AOMs. To detect the final state, high power, on resonance Doppler cooling light is used to determine whether the ion has returned to the manifold or remains in . The probability of excitation from is plotted in Fig. 4(b),(c) for states prepared in different levels of (b) and (c) . The energy level diagrams in Fig. 4(d),(e) show the potentially occupied states populated through the dipole decay from (d) or (e) with the corresponding decay probabilities from the levels Roberts et al. (1999); Tan et al. (2020), and the possible repump pathways from . As is an electric quadrupole (E2) coupling transitions are possible. Consequently, given a prepared level in , the 760 nm peaks shown in the measurements comprise between 6 and 22 possible unresolved transitions of varying probabilities. The center frequencies of the transitions, obtained from Gaussian fits, are reported in Tab. 1 with a improvement in precision relative to previous results Mulholland et al. (2019).
V state detection using electron shelving
The standard detection protocol used to discriminate between the qubit states and in relies on detecting state-selective laser-induced fluorescence at 369 nm. Ideally, the collected photons result in two well-separated Poisson distributions corresponding to the different states. However, leakage between the qubit levels due to off-resonant excitation during detection create one-sided tails on the photon distributions that overlap and thereby lead to detection errors.
In the following, we augment the standard detection method by prepending the measurement with pulses at 411 nm in order to transfer population from one qubit state to a metastable level. State detection is then performed using 369 nm light that drives all transitions between the and manifolds, effectively eliminating off-resonant excitations. Here, the achievable detection fidelity is limited by the shelving transfer accuracy and the finite lifetime of the metastable state. As indicated in Tab. 1, the state lifetime is ms, after which it decays to () or (). This presents two possibilities for an electron-shelving based detection protocol: (1) transfer the population of one qubit state to and detect for duration ms before any significant decay occurs; or (2) optically pump the state to via . In this section, we describe the detection protocols using both shelving methods, discuss different software-based techniques to improve state discrimination under these protocols, and finally compare the achieved state detection fidelities.
V.1 Electron-shelved detection in
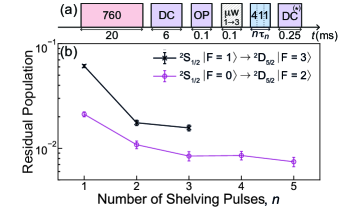
The first protocol requires us to achieve an effective transfer of population from either hyperfine level in the qubit manifold to the metastable state. We begin by measuring the effectiveness of applying a pulse on two transitions: and (Fig. 5(a)). The linewidth of the 411 nm laser as well as the non-zero temperature of the motional modes limit the shelving efficiency associated with a single pulse. Thus, in order to maximize population transfer, we implement a series of pulses tuned to address multiple Zeeman levels. When shelving via , five Zeeman transitions can be driven successively, . By contrast, the transition only allows three successive pulses on to be used, as the first-order Zeeman shift is approximately equal for the upper and lower states ( kHz/T). If the transitions are excited, then any population initially transferred to will be de-shelved by the subsequent pulses.
The residual population in the qubit manifold after shelving is plotted in Fig. 5(b). As the number of shelving pulses is increased, the shelving fidelity improves from 93.9(2)% to 98.4(1)% for (black), and from 97.9(2)% to 99.3(1)% for (pink). The clock transition between the states is driven first as its first-order magnetic-field insensitivity allows for the highest state transfer probability. In general, we observe no significant difference when changing the order of the subsequent pulses tuned to other Zeeman levels.
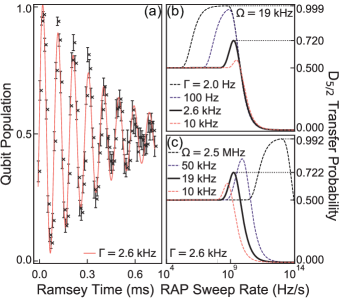
When using this protocol in large multi-qubit registers, it is critical to ensure that the population transfer efficiency remains high for all ions throughout the experiment. Its effectiveness will be limited by laser frequency drifts and variations in coupling strength due to laser intensity or polarization gradients across the ion string. As both of these effects are often slowly varying or even static “systematic” errors, mitigation through advanced pulse sequences Tycko (1983); Levitt (1986); Kabytayev et al. (2014); Ball et al. (2020) can be considered in addition to regular calibration. Another commonly used routine for accurate population transfer is Rapid Adiabatic Passage (RAP) Vitanov et al. (2001); Wunderlich et al. (2007); Noel et al. (2012); Fürst et al. (2020). This technique involves linearly sweeping the frequency of the shelving laser, while simultaneously shaping the amplitude of pulse to follow a Gaussian profile. The procedure is more robust to systematic errors in the pulse frequency or length than a simple pulse, at the cost of enhanced sensitivity to high-frequency and dephasing errors Lu et al. (2013); Soare et al. (2014); Edmunds et al. (2020).
In Fig. 6 we examine the theoretical maximum transfer fidelity using RAP for different inverse laser coherence times, , and Rabi frequencies, . The probability of transfer using a Landau-Zener model Zener (1932) for RAP is given by
| (1) |
where is the frequency sweep rate used for the RAP pulse. To incorporate the effect of a finite laser linewidth, the theory is modified to include a Markovian noise bath in a two-level dephasing model Lacour et al. (2007); Noel et al. (2012). The transfer probability now depends on the inverse of the laser coherence, , becoming
| (2) |
which results in a sharp dropoff in transfer fidelity at lower sweep rates.
In our experiment we record a Rabi frequency of 19 kHz on the clock transition and a 0.392 ms phase coherence time. This number is inferred from Ramsey interferometry shown in Fig. 6(a) and corresponds to an inverse coherence time of kHz, which we attribute to laser linewidth. In Fig. 6(b),(c) we plot the calculated transfer fidelity against the sweep rate, as given by Eqn. (2). Given our parameters, kHz, kHz, we could achieve a maximum transfer fidelity of 0.72 (solid black lines), which is significantly worse than the fidelity of a single pulse (98%). To achieve % transfer fidelity, we would either need to improve our laser coherence to 2 Hz or increase our Rabi frequency to 2.5 MHz (dashed black lines); both of these are unfeasible in our current system. However, more reasonable parameter regimes achieving the same target can be found with two-dimensional parameter analysis, e.g. reducing the inverse coherence time to 130 Hz and increasing the Rabi frequency to 100 kHz. This would be achievable using higher laser lock-bandwidth and a different laser source, respectively. We further plan to investigate numerically optimized robust control waveforms Ball et al. (2020) to improve state transfer efficiency.
V.2 Electron-shelved detection in
Another attractive option for electron-shelved detection in uses the state with a lifetime in excess of 5 years Roberts et al. (2000), enabling longer detection periods, while still eliminating off-resonant scattering. Given that is an electric octupole transition, direct shelving to this state requires ultra-stable laser systems generally only available in specialized frequency metrology laboratories Huntemann et al. (2012a, b); Fürst et al. (2020).
To investigate this level for state detection without such a laser, we optically pump the qubit state to the manifold via using 411 nm light. As before with the electron-shelved detection in , once the population has been transferred to , we use high power light resonant with the entire and manifolds to measure laser induced fluorescence from the population remaining in the qubit manifold.
The incoherent shelving process used by us requires ms to ensure 99.9% population transfer to , which makes it impractical for use in quantum computing. One way to achieve fast shelving to the F-state is via a STIRAP-like scheme Vitanov et al. (2017) to a state that rapidly decays to the manifold. To implement such a scheme, one could use a laser at nm connecting the metastable state to the level Sugiyama (1999); Schacht et al. (2015) and combine it with light at 435 nm connecting the manifold to the state. As this scheme relies on the rapid decay of the state, it could be executed repeatedly akin to optical pumping, ensuring a high transfer efficiency to the long lived state. Alternatively, a pulsed two-stage scheme could be used, where multiple shelving pulses (similar to Fig. 5) are combined with active depopulation (AD in Fig. 2) of the state via resonant light at Roberts et al. (1999).
V.3 State-detection protocol comparison
In this section, we now compare the detection fidelity for three different detection protocols: (1) standard detection with light resonant only with the state in the qubit manifold, (2) -shelved detection with the Doppler cooling laser tuned on resonance at high power after shelving the qubit state to via five successive pulses to different Zeeman states, and (3) -shelved detection with the resonant Doppler cooling laser after incoherently shelving the qubit state via .
In all cases measurements are conducted using either an APD recording global fluorescence or an EMCCD camera providing the spatially resolved information required for experiments with multi-qubit registers. Except for protocol (3), we compare the performance of a simple threshold-based detection with a time-resolved maximum likelihood analysis for the APD data. For all three protocols, we compare thresholding and a classifier-based software routine for analysis of EMCCD data.
The detection error is calculated by interleaving preparation of a dark and bright qubit state and averaging the respective errors. We define the dark state error, , as the fraction of points prepared in the dark state that are recorded as bright, and the bright state error accordingly. The overall detection error is then quantified as . In order to derive a threshold value and train the image classifier, five percent of measured data are dedicated to calibration/training, with the analysis being conducted on the remaining 95% of the data.
V.3.1 APD-based detection
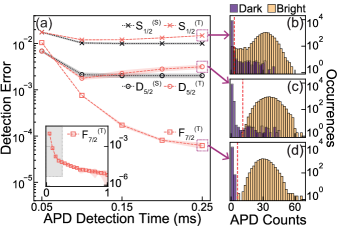
To find the lowest detection error achievable with the APD, we vary the length of the detection period for the three different protocols as shown in Fig. 7(a). In the simplest protocol (1) of state-dependent fluorescence detection in the qubit manifold, the photon count histograms of the bright (dark) state are described by a Poissonian distribution modified with a tail towards the dark (bright) state counts Acton et al. (2005). This leads to a significant overlap visible in Fig. 7(b) and correspondingly a large detection error. When one of the qubit states is shelved by five successive pulses to in protocol (2), the application of detection light resonant with the entire manifold eliminates the off-resonant scattering and hence the decay tail of the bright state completely, which is shown in Fig. 7(c). A residual but suppressed tail from the dark-state distribution remains due to decays from back to the qubit manifold, with an 18% branching ratio. Lastly, incoherent shelving to the long-lived state in protocol (3) maximally suppresses the decay tails on both distributions as illustrated in Fig. 7(d). To reduce the prohibitively long shelving times to under optical pumping via in these measurements, the ion is shelved only once every 1000 points before the dark state error is measured. The ion is then returned to the qubit manifold with the 760 nm laser in order to measure the bright state error for another 1000 points. These interleaved blocks are repeated 1000 times yielding a total of datapoints for each case. The total detection period is extended up to 1 ms for -shelved detection as illustrated in the inset of Fig. 7 (a).
To further improve on the detection error in the two protocols that show state decays, we also implement a maximum likelihood estimation based on time-resolved data Wölk et al. (2015), referred to hereafter as “subbinning”. Here, additional information about the decay dynamics during a measurement period is obtained by dividing the s overall detection period into five smaller “subbins” of length s. This approach improves the ability to identify decay dynamics and allows for better discrimination of dark counts originating from electronic noise or cosmic particles. For the analysis, we further require an independent measurement of average count rates and the off-resonant scattering rates for the bright and dark states. Given our standard parameters for standard detection, we measure decay times from the bright and dark states of ms and ms, respectively. For -shelved detection, is given by the ms upper state lifetime of the shelved state, while has an effectively infinite value. Given that there is no measurable decay during detection after shelving to , we do not perform time-resolved analysis under that protocol.
V.3.2 EMCCD-based detection
To obtain spatially resolved measurements as required for multi-qubit experiments, we employ an EMCCD detector. Camera-based detection requires the identification of regions of interest (ROI) for pixel-based analyses. We locate these through Gaussian fits to the 2D ion location(s) of calibration images of (a) bright ion(s). Further processing then happens only on ROI data extracted from the full camera images, which decreases processing time and can readily be parallelized.
As an ROI consists of multiple pixels, the thresholding method integrates their values over a certain number of “hot” pixels (corresponding to a subset of the brightest pixels) to obtain a measure of total counts in a given ROI. Alternatively, a set of calibration images obtained using ions prepared in the dark and bright states can be used to train a Random Forest classifier Pedregosa et al. (2011) for each ROI in order to identify and . If trained on reliable data, this method is expected to be superior to the simple thresholding model, as it will consider not just the net fluorescence in the region of interest but also correlations between the counts on different pixels.
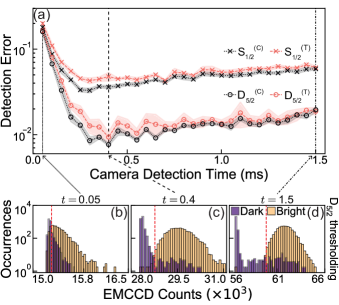
We compare the two spatial analysis methods across the three different detection protocols: standard , -shelved and -shelved. In Fig. 8(a), we evaluate the measured detection error as a function of detection time for the first two protocols. The standard detection (cross markers) is compared to the -shelved detection (open circles) and each dataset is analyzed using the thresholding method (red) and the image classifier (black). These data clearly show that the shelved detection is superior to standard and that the image classifier can yield appreciable improvements under short to intermediate detection times. This is likely related to the a larger number of mislabeled training images due to state decays, potentially offering room for further improvement.
The change in detection error at different detection times can be understood by examining the bright and dark histograms for -shelved detection (Fig. 8(b)-(d)). At short detection times, the distributions have a large overlap, with electrical noise in the camera dominating the signal (Fig. 8(b), 0.05 ms detection period). At long detection periods (Fig. 8(d), 1.5 ms), the bright distribution mean has increased sufficiently to separate it from the dark distribution, but state decays become dominant due to the 7 ms lifetime of producing a decay tail from the dark distribution. At the optimum detection period, these two error contributions are balanced (Fig. 8(c), 0.4 ms detection period).
| EMCCD thresholding | EMCCD classifier | APD thresholding | APD subbinning | |||||
|---|---|---|---|---|---|---|---|---|
| Error | (ms) | Error | (ms) | Error | (ms) | Error | (ms) | |
| standard | 0.3 | 0.3 | 0.1 | 0.15 | ||||
| -shelved | 0.4 | 0.4 | 0.1 | 0.15 | ||||
| -shelved | 1 | 1 | 1 | - | - | |||
V.4 Summary of results
We summarize our findings of the lowest measured errors for all detection protocols and analysis methods in Table 2. Overall, we achieve a 5.6 improvement in fidelity using electron-shelved detection in compared to standard detection, measuring an error of with a 100 s detection time on the APD. When using the EMCCD, we record a minimum error of using -shelved detection, 4.3 lower than the best observed error using standard detection. For -shelved detection with a 1 ms detection time, the detection error is reduced by another factor of () to () on the APD (EMCCD).
VI Conclusion
In this work, we demonstrate that it is possible to combine the benefits of a long-lived, first-order magnetic-field insensitive hyperfine qubit with the high-fidelity detection typically observed in an optical qubit. By first shelving the population in one qubit state of to a metastable level, we are able to use high-power, near-resonant Doppler cooling light to perform efficient state discrimination without suffering off-resonant leakage. To enable scaling to larger qubit registers, we also characterize the detection error after shelving to when using a spatially-resolving EMCCD. For both the APD and EMCCD detectors we compare the performance of software routines for processing photon detection data. This involves either analyzing time-resolved information about the incoming photons collected on the APD, or exploiting spatial correlations between EMCCD pixels using a classifier routine.
We also validate that the state detection error in our system can be further reduced by shelving to the long-lived manifold. New laser systems used in one of two schemes we outline could be used to overcome the prohibitively long optical pumping time to , making this a viable avenue for ultra-high-fidelity detection.
Ultimately our results foreshadow the possibility of combining novel data-processing software routines with physics-based techniques in the future to further reduce measurement errors without requiring extensive hardware modifications. When combined with an efficient repump laser at 760 nm to reset the qubit state, we believe the electron-shelving based detection routine presented here will improve the practicality and scalability of current quantum devices.
Acknowledgements
This work was partially supported by the Intelligence Advanced Research Projects Activity Grant No. W911NF-16-1-0070, the US Army Research Office Grant No. W911NF-14-1-0682, the Australian Research Council Centre of Excellence for Engineered Quantum Systems Grant No. CE170100009, and a private grant from H.&A. Harley.
References
- Bruzewicz et al. (2019) C. D. Bruzewicz, J. Chiaverini, R. McConnell, and J. M. Sage, Appl. Phys. Rev. 6, 021314 (2019).
- Harty et al. (2014) T. P. Harty, D. T. C. Allcock, C. J. Ballance, L. Guidoni, H. A. Janacek, N. M. Linke, D. N. Stacey, and D. M. Lucas, Phys. Rev. Lett. 113, 220501 (2014).
- Gaebler et al. (2016) J. P. Gaebler, T. R. Tan, Y. Lin, Y. Wan, R. Bowler, A. C. Keith, S. Glancy, K. Coakley, E. Knill, D. Leibfried, and D. J. Wineland, Phys. Rev. Lett. 117, 060505 (2016).
- Sepiol et al. (2019) M. A. Sepiol, A. C. Hughes, J. E. Tarlton, D. P. Nadlinger, T. G. Ballance, C. J. Ballance, T. P. Harty, A. M. Steane, J. F. Goodwin, and D. M. Lucas, Phys. Rev. Lett. 123, 110503 (2019).
- Ballance et al. (2016) C. J. Ballance, T. P. Harty, N. M. Linke, M. A. Sepiol, and D. M. Lucas, Phys. Rev. Lett. 117, 060504 (2016).
- Choi et al. (2014) T. Choi, S. Debnath, T. A. Manning, C. Figgatt, Z.-X. Gong, L.-M. Duan, and C. Monroe, Phys. Rev. Lett. 112, 190502 (2014).
- Leung et al. (2018) P. H. Leung, K. A. Landsman, C. Figgatt, N. M. Linke, C. Monroe, and K. R. Brown, Phys. Rev. Lett. 120, 020501 (2018).
- Milne et al. (2020) A. R. Milne, C. L. Edmunds, C. Hempel, F. Roy, S. Mavadia, and M. J. Biercuk, Phys. Rev. Applied 13, 024022 (2020).
- Schäfer et al. (2018) V. M. Schäfer, C. J. Ballance, K. Thirumalai, L. J. Stephenson, T. G. Ballance, A. M. Steane, and D. M. Lucas, Nature 555, 75 (2018).
- Zhang et al. (2020) C. Zhang, F. Pokorny, W. Li, G. Higgins, A. Pöschl, I. Lesanovsky, and M. Hennrich, Nature 580, 345 (2020).
- Wright et al. (2019) K. Wright et al., Nat. Commun 10, 5464 (2019).
- Bentley et al. (2020) C. D. B. Bentley, H. Ball, M. J. Biercuk, A. R. R. Carvalho, M. R. Hush, and H. J. Slatyer, Adv. Quantum Technol. 3, 2000044 (2020).
- Nam et al. (2020) Y. Nam et al., npj Quantum Inf. 6, 33 (2020).
- Erhard et al. (2020) A. Erhard, H. P. Nautrup, M. Meth, L. Postler, R. Stricker, M. Ringbauer, P. Schindler, H. J. Briegel, R. Blatt, N. Friis, and T. Monz, (2020), arXiv:2006.03071 [quant-ph] .
- Egan et al. (2020) L. Egan, D. M. Debroy, C. Noel, A. Risinger, D. Zhu, D. Biswas, M. Newman, M. Li, K. R. Brown, M. Cetina, and C. Monroe, (2020), arXiv:2009.11482 [quant-ph] .
- Schindler et al. (2011) P. Schindler, J. T. Barreiro, T. Monz, V. Nebendahl, D. Nigg, M. Chwalla, M. Hennrich, and R. Blatt, Science 332, 1059 (2011).
- Nigg et al. (2014) D. Nigg, M. Müller, E. A. Martinez, P. Schindler, M. Hennrich, T. Monz, M. A. Martin-Delgado, and R. Blatt, Science 345, 302 (2014).
- Bermudez et al. (2017) A. Bermudez et al., Phys. Rev. X 7, 041061 (2017).
- Wineland et al. (1995) D. J. Wineland, J. C. Bergquist, J. J. Bollinger, and W. M. Itano, Phys. Scripta T59, 286 (1995).
- Benhelm et al. (2008) J. Benhelm, G. Kirchmair, C. F. Roos, and R. Blatt, Phys. Rev. A 77 (2008), 10.1103/physreva.77.062306.
- Kirchmair et al. (2009) G. Kirchmair, J. Benhelm, F. Zähringer, R. Gerritsma, C. F. Roos, and R. Blatt, Phys. Rev. A 79, 020304 (2009).
- Olmschenk et al. (2007) S. Olmschenk, K. C. Younge, D. L. Moehring, D. N. Matsukevich, P. Maunz, and C. Monroe, Phys. Rev. A 76, 052314 (2007).
- Ball et al. (2016) H. Ball, W. D. Oliver, and M. J. Biercuk, npj Quantum Inf. 2, 16033 (2016).
- Edmunds et al. (2020) C. L. Edmunds, C. Hempel, R. J. Harris, V. Frey, T. M. Stace, and M. J. Biercuk, Phys. Rev. Research 2, 013156 (2020).
- Debnath et al. (2016) S. Debnath, N. M. Linke, C. Figgatt, K. A. Landsman, K. Wright, and C. Monroe, Nature 536, 63 (2016).
- Seif et al. (2018) A. Seif, K. A. Landsman, N. M. Linke, C. Figgatt, C. Monroe, and M. Hafezi, J. Phys. B: At. Mol. Opt. Phys. 51, 174006 (2018).
- Crain et al. (2019) S. Crain, C. Cahall, G. Vrijsen, E. E. Wollman, M. D. Shaw, V. B. Verma, S. W. Nam, and J. Kim, Communications Physics 2, 97 (2019).
- Todaro et al. (2020) S. L. Todaro, V. B. Verma, K. C. McCormick, D. T. C. Allcock, R. P. Mirin, D. J. Wineland, S. W. Nam, A. C. Wilson, D. Leibfried, and D. H. Slichter, (2020), arXiv:2008.00065 [quant-ph] .
- Zhukas et al. (2020) L. A. Zhukas, P. Svihra, A. Nomerotski, and B. B. Blinov, (2020), arXiv:2006.12801 [quant-ph] .
- Hume et al. (2007) D. B. Hume, T. Rosenband, and D. J. Wineland, Phys. Rev. Lett. 99, 120502 (2007).
- Myerson et al. (2008) A. H. Myerson, D. J. Szwer, S. C. Webster, D. T. C. Allcock, M. J. Curtis, G. Imreh, J. A. Sherman, D. N. Stacey, A. M. Steane, and D. M. Lucas, Phys. Rev. Lett. 100, 200502 (2008).
- Hemmerling et al. (2012) B. Hemmerling, F. Gebert, Y. Wan, and P. O. Schmidt, New J. Phys. 14, 023043 (2012).
- Wölk et al. (2015) S. Wölk, C. Piltz, T. Sriarunothai, and C. Wunderlich, J. Phys. B: At. Mol. Opt. Phys. 48, 075101 (2015).
- Ding et al. (2019) Z.-H. Ding, J.-M. Cui, Y.-F. Huang, C.-F. Li, T. Tu, and G.-C. Guo, Phys. Rev. Applied 12, 014038 (2019).
- Roberts et al. (1999) M. Roberts, P. Taylor, S. V. Gateva-Kostova, R. Clarke, W. R. C. Rowley, and P. Gill, Phys. Rev. A 60, 2867 (1999).
- Dehmelt (1975) H. Dehmelt, Bull. Am. Phys. Soc. 20, 60 (1975).
- Nagourney et al. (1986) W. Nagourney, J. Sandberg, and H. Dehmelt, Phys. Rev. Lett. 56, 2797 (1986).
- Burrell et al. (2010) A. H. Burrell, D. J. Szwer, S. C. Webster, and D. M. Lucas, Phys. Rev. A 81, 040302 (2010).
- Acton et al. (2005) M. Acton, K. A. Brickman, P. C. Haljan, P. J. Lee, L. Deslauriers, and C. Monroe, Quantum Inf. Comput 6, 465 (2005), quant-ph/0511257 .
- Ejtemaee et al. (2010) S. Ejtemaee, R. Thomas, and P. C. Haljan, Phys. Rev. A 82, 063419 (2010).
- Christensen et al. (2020) J. E. Christensen, D. Hucul, W. C. Campbell, and E. R. Hudson, npj Quantum Inf. 6, 35 (2020).
- Wunderlich et al. (2007) C. Wunderlich, T. Hannemann, T. Körber, H. Häffner, C. Roos, W. Hänsel, R. Blatt, and F. Schmidt-Kaler, J. Modern Opt. 54, 1541 (2007).
- Keselman et al. (2011) A. Keselman, Y. Glickman, N. Akerman, S. Kotler, and R. Ozeri, (2011).
- Noek et al. (2013) R. Noek, G. Vrijsen, D. Gaultney, E. Mount, T. Kim, P. Maunz, and J. Kim, Opt. Lett. 38, 4735 (2013).
- Roman et al. (2020) C. Roman, A. Ransford, M. Ip, and W. C. Campbell, New J. Phys. 22, 073038 (2020).
- Meggers (1967) W. F. Meggers, Journal of research of the National Bureau of Standards. Section A, Physics and chemistry 71A, 396 (1967).
- Keller (2015) J. Keller, Spectroscopic characterization of ion motion for an optical clock based on Coulomb crystals, Ph.D. thesis, University of Hannover (2015).
- Feldker et al. (2020) T. Feldker, H. Fürst, H. Hirzler, N. V. Ewald, M. Mazzanti, D. Wiater, M. Tomza, and R. Gerritsma, Nat. Phys. 16, 413 (2020).
- Tan et al. (2020) T. Tan, C. L. Edmunds, A. R. Milne, M. J. Biercuk, and C. Hempel, “Precision characterization of the state and quadratic zeeman coefficient in ,” submitted (2020).
- Huntemann et al. (2012a) N. Huntemann, M. Okhapkin, B. Lipphardt, S. Weyers, C. Tamm, and E. Peik, Phys. Rev. Lett. 108, 090801 (2012a).
- Jau et al. (2015) Y.-Y. Jau, J. D. Hunker, and P. D. D. Schwindt, AIP Adv. 5, 117209 (2015).
- Mulholland et al. (2019) S. Mulholland, H. A. Klein, G. P. Barwood, S. Donnellan, P. B. R. Nisbet-Jones, G. Huang, G. Walsh, P. E. G. Baird, and P. Gill, Rev. Sci. Instrum. 90, 033105 (2019).
- Roberts et al. (2000) M. Roberts, P. Taylor, G. P. Barwood, W. R. C. Rowley, and P. Gill, Phys. Rev. A 62, 020501 (2000).
- Sugiyama (1999) K. Sugiyama, Jpn. J. Appl. Phys. 38, 2141 (1999).
- Gill et al. (1995) P. Gill, H. A. Klein, A. P. Levick, M. Roberts, W. R. C. Rowley, and P. Taylor, Phys. Rev. A 52, R909 (1995).
- Taylor et al. (1997) P. Taylor, M. Roberts, S. V. Gateva-Kostova, R. B. M. Clarke, G. P. Barwood, W. R. C. Rowley, and P. Gill, Phys. Rev. A 56, 2699 (1997).
- Berends et al. (1993) R. W. Berends, E. H. Pinnington, B. Guo, and Q. Ji, J. Phys. B: At. Mol. Opt. Phys. 26, L701 (1993).
- Tycko (1983) R. Tycko, Phys. Rev. Lett. 51, 775 (1983).
- Levitt (1986) M. H. Levitt, Prog Nucl Mag Res Sp 18, 61 (1986).
- Kabytayev et al. (2014) C. Kabytayev, T. J. Green, K. Khodjasteh, M. J. Biercuk, L. Viola, and K. R. Brown, Phys. Rev. A 90, 012316 (2014).
- Ball et al. (2020) H. Ball, M. J. Biercuk, A. Carvalho, J. Chen, M. Hush, L. A. D. Castro, L. Li, P. J. Liebermann, H. J. Slatyer, C. Edmunds, V. Frey, C. Hempel, and A. Milne, (2020), arXiv:2001.04060 [quant-ph] .
- Vitanov et al. (2001) N. V. Vitanov, T. Halfmann, B. W. Shore, and K. Bergmann, Annu. Rev. Phys. Chem. 52, 763 (2001).
- Noel et al. (2012) T. Noel, M. R. Dietrich, N. Kurz, G. Shu, J. Wright, and B. B. Blinov, Phys. Rev. A 85, 023401 (2012).
- Fürst et al. (2020) H. A. Fürst, C.-H. Yeh, D. Kalincev, A. P. Kulosa, L. S. Dreissen, R. Lange, E. Benkler, N. Huntemann, E. Peik, and T. E. Mehlstäubler, Phys. Rev. Lett. 125, 163001 (2020).
- Lu et al. (2013) X.-J. Lu, X. Chen, A. Ruschhaupt, D. Alonso, S. Guérin, and J. G. Muga, Phys. Rev. A 88, 033406 (2013).
- Soare et al. (2014) A. Soare, H. Ball, D. Hayes, J. Sastrawan, M. C. Jarratt, J. J. McLoughlin, X. Zhen, T. J. Green, and M. J. Biercuk, Nat. Phys. 10, 825 (2014).
- Zener (1932) C. Zener, Proc. R. Soc. London A. 137, 696 (1932).
- Lacour et al. (2007) X. Lacour, S. Guérin, L. P. Yatsenko, N. V. Vitanov, and H. R. Jauslin, Phys. Rev. A 75, 033417 (2007).
- Huntemann et al. (2012b) N. Huntemann, B. Lipphardt, M. Okhapkin, C. Tamm, E. Peik, A. V. Taichenachev, and V. I. Yudin, Phys. Rev. Lett. 109, 213002 (2012b).
- Vitanov et al. (2017) N. V. Vitanov, A. A. Rangelov, B. W. Shore, and K. Bergmann, Rev. Modern Phys. 89, 015006 (2017).
- Schacht et al. (2015) M. Schacht, J. R. Danielson, S. Rahaman, J. R. Torgerson, J. Zhang, and M. M. Schauer, J. Phys. B: At. Mol. Opt. Phys. 48, 065003 (2015).
- Pedregosa et al. (2011) F. Pedregosa et al., J Mach Learn Res 12, 2825 (2011).