∎
[]t1 Corresponding authors: antonio.uras@cern.ch (A. Uras),
gianluca.usai@ca.infn.it (G. Usai)
Nuclear dependence of light neutral meson production
in p-A collisions at 400 GeV with NA60
Abstract
The NA60 experiment has studied low-mass muon pair production in proton-nucleus collisions with a system of Be, Cu, In, W, Pb and U targets, using a 400 GeV proton beam at the CERN SPS. The transverse momentum spectra of the and mesons are measured in the full range accessible, from up to 2 GeV/. The nuclear dependence of the production cross sections of the , and mesons has been found to be consistent with the power law , with the parameter increasing as a function of for all the particles, and an approximate hierarchy . The cross section ratios , and have been studied as a function of the size A of the production target, and an increase of the and yields relative to the is observed from p-Be to p-U collisions.
1 Introduction
The study of the production of low-mass vector and pseudoscalar mesons in proton-nucleus (p-A) collisions represents a unique tool to understand the role of cold nuclear matter in particle production mechanisms. The nuclear dependence of both the transverse momentum spectra and the total production cross sections is of special interest in this context, with the observations usually interpreted in terms of phenomenological models, since a first-principle description based on non-perturbative QCD is not yet available.
Proton-nucleus collisions have also become of special interest in their own, as a tool to test the possible existence of in-medium modifications of the vector meson spectral functions in cold nuclear matter. The experimental evidence for such effects is at the moment controversial, namely after the KEK-PS E325 Tabaru:2006az and the CLAS Nasseripour:2007mga ; Wood:2010ei experiments reporting contradicting observations on possible -meson broadening and mass-shift in cold nuclear matter. In this context, a recent measurement in p-A collisions at 400 GeV by the NA60 experiment Arnaldi:2016pzu , exploiting the same data set considered in the present analysis, ruled out the existence of any significant cold-nuclear matter effect at the SPS energies on the line shapes of the light vector mesons , and , giving in particular, for the first time, a precise characterisation of the -meson line shape in p-A collisions. The aforementioned results from NA60 represent the basis for the new results presented in this letter.
Measurements in p-A collisions also provide a useful cold-nuclear-matter reference for the observations in heavy-ion collisions, allowing for the study of particle production as a function of the size A of the nucleus.
Despite the points of interest mentioned above, there is a
general lack of high-precision and high-statistics measurements of low-mass
vector and pseudoscalar mesons in proton-nucleus collisions at the
SPS energies, in particular for what concerns dilepton data. The
nuclear dependence of the production cross sections for ,
and mesons was investigated at the energy of
GeV by the CERES experiment Agakishiev:1998mw
in p-Be and p-Au collisions, and by the HELIOS
experiment Veenhof:1993xt in p-Be collisions. Results from
these experiments were compared to, or complemented the measurements
in proton-proton collisions, in particular those performed by the NA27
experiment AguilarBenitez:1991yy relative to the production of
, , and mesons at GeV.
On the other hand, there are no accurate measurements on the nuclear
dependence of production in proton-nucleus collisions at the
SPS. At somehow higher energy, and mesons have been
recently measured in p-C, p-Ti and p-W interactions at
GeV by HERA-B Abt:2006wt .
The NA60 experiment complemented its main In-In programme with a high-luminosity proton-nucleus run, exposing to a 400 GeV proton beam six target materials: Be, Cu, In, W, Pb and U. This allowed for a comprehensive and detailed study of the nuclear dependence of the , , and meson production. The present letter is organised as follows. First, the spectra are presented for the and mesons, for which the measurement could be performed down to zero — while the acceptance coverage limited the measurement of -meson production (via the Dalitz decay channel) to GeV/. The nuclear dependence of the production cross sections of , and mesons, integrated over the regions available for each particle, is then investigated in terms of the power law . The available statistics also allowed for a dedicated study of the parameters as a function of . Finally, particle production is further discussed via the study of the cross section ratios in the full phase space, with strangeness enhancement being specifically addressed through the measurement of the nuclear dependence of the cross section ratios and .
2 Apparatus and event selection
During the 2004 run, the NA60 experiment collected data with a system of nine sub-targets of different nuclear species — Be, Cu, In, W, Pb and U — simultaneously exposed to an incident 400 GeV proton beam. The individual target thickness was chosen to have approximately a similar statistical sample from each target. The total interaction length was 7.5%. The beam intensity during the run was 4- protons per second.
A general description of the NA60 apparatus can be found for example in Arnaldi:2008er , while in Arnaldi:2016pzu some additional, specific details can be found, relevant to the setup used during the proton run of interest for the present analysis.
The produced dimuons are identified and measured by the muon spectrometer, composed of a set of Multi-Wire Proportional Chamber (MWPC) tracking stations, trigger scintillator hodoscopes, a toroidal magnet and a hadron absorber. The material which stops the hadrons also induces multiple scattering and energy loss on the muons, degrading the mass resolution of the measurement made in the spectrometer. To overcome this problem, NA60 already measures the muons before the absorber with a vertex spectrometer, made of pixel silicon detectors. The muon tracks reconstructed in the muon spectrometer are extrapolated back to the target region and matched to the tracks reconstructed in the vertex spectrometer. This is done comparing both their angles and momenta, requiring a matching less than 3. Once identified, the muons are refitted using the joint information of the muon and the vertex spectrometers. These tracks will be referred to as matched muons. Muon pairs of opposite charge are then selected. The matching technique improves significantly the signal-to-background ratio and the dimuon mass resolution. Because of the heavier absorber setup, the mass resolution is slightly worse than during the In-In run: 30-35 MeV/ (depending on target position) at the mass (against 23 MeV/ during the In-In run), and the coverage is reduced towards the dimuon mass threshold.
2.1 Target identification
In order to study the nuclear dependence of the yields and the kinematics for the particles produced in the collisions, the identification of the production target is mandatory. In principle, one could consider the origin of the matched dimuon alone, defined as the point of closest approach of its two muon tracks. However, this origin has a limited spatial resolution; in particular, the error associated to the -position of the dimuon’s origin becomes comparable or even larger than the typical semi-distance between targets (5 mm) for masses below 0.45 GeV/. In order to overcome these difficulties, the vertices reconstructed by using all the tracks measured in the silicon telescope (VT vertices) are considered, requiring that the two muons are attached to the same VT vertex, or to two different VT vertices falling within the same target. The loss of statistics, as studied by Monte Carlo simulations, varies from for the mass region, to in the dimuon mass region below 0.45 GeV/ dominated by the Dalitz decay of the . After applying this selection, muon pairs are left. The algorithm fails to associate the correct target in of events at the mass, at the mass and in the Dalitz region: this systematic effect has been studied by means of the same Monte Carlo simulations, and corrected for in the final results.
2.2 Background treatment
The small amount of combinatorial background (originating from and decays) is subtracted from the raw dimuon sample: its shape is estimated with an event-mixing technique, while its normalization is established fixing the like-sign (LS) component coming out from the mixing to the LS component of the data (containing no signal from correlated pairs at the SPS energies). In the considered proton-nucleus data, the background accounts for less than of the integrated mass spectrum below 1.4 GeV. The comparison between mixed and real sample, in turn, gives an average uncertainty of at most, for both the and the components; because of the absolute low level of the background and because of its smooth mass profile, this uncertainty hardly affects the extraction of the signal from the considered dimuon sources.
The background from fake track matches, which could arise at high multiplicities from the association of a muon track to more than one track in the vertex telescope with an acceptable matching , is significantly lower than the combinatorial background. For this reason, its contribution is almost negligible in the proton-nucleus data — being in any case taken automatically into account by the overlay Monte Carlo technique adopted for the simulations.
3 Monte Carlo simulations, acceptance and reconstruction efficiency
The electromagnetic decays of the light, neutral pseudoscalar and vector mesons (, , , and ) are the dominating processes at the lower end of the dimuon mass spectrum (from the threshold to the mass region), adding to the continuum spectrum via their Dalitz decays and/or giving rise to distinct peaks via their 2-body decays. This hadronic decay cocktail was simulated with the NA60 Monte Carlo generator Genesis genesis . The input parameters for the kinematic distributions of the generated processes have been tuned by comparison with the real data, by means of an iterative procedure ensuring self-consistency to the analysis.
The transverse momentum spectra used in the simulations are taken from the analysis itself. The rapidity distributions in the center of mass frame were generated according to the expression , similar to a Gaussian of width , where describes the empirical functional mass dependence of the width with values of about 0.5 and 0.75 at the masses of 0.14 GeV/ () and 1 GeV/, respectively genesis . This simple parameterisation has been used by several experiments, since it describes reasonably well existing measurements Afanasev:2000uu ; Alber:1997sn .
The muon angular distributions also entering the simulations are assumed to be isotropic for the 2-body decays, while the angular anisotropies of the Dalitz decays, expected to be the same for the pseudo-scalar () and vector () mesons Bratkovskaya:1996nf , are described by the distribution:
| (1) |
where is the mass of the virtual photon, the mass of the muon, and the angle between the positive muon and the momentum of the parent meson in the rest-frame of the virtual photon Anastasi:2016hdx . As was explicitly verified, the dimuon acceptance for the Dalitz decays is practically unaffected by the character of the angular distribution, due to the fact that the anisotropy is strongly smeared out in the laboratory frame.
For the mass line shapes of the narrow resonances , and , a modified relativistic Breit-Wigner parametrization was used, first proposed by G.J. Gounaris and J.J. Sakurai Gounaris:1968mw , with widths and masses taken from the Particle Data Group (PDG) tables Nakamura:2010zzi . For the broad meson the following parameterisation was used Knoll:1998iu :
| (2) |
with a mass dependent width
| (3) |
The parameters of the parameterisation were either fixed to the PDG values Nakamura:2010zzi , or extracted from the data themselves, as extensively discussed in Arnaldi:2016pzu .
The dimuon mass distributions of the and Dalitz decays are described by the QED expectations for point-like particles Kroll:1955zu , corrected by the form factors also extracted from the data themselves Arnaldi:2016pzu .
The semimuonic simultaneous decays from mesons produce
a smooth open charm continuum with a maximum at around 1 GeV/. They
were simulated with PYTHIA 6.4 Sjostrand:2006za , with the mass of charm quark
set to GeV/ and the primordial momentum of the interacting partons
generated according to a Gaussian distribution of variance (GeV/)2.
The Monte Carlo simulations were performed using the overlay
technique, which consists of superimposing a Monte-Carlo-generated muon
pair onto real events, in order to realistically simulate the underlying hadronic
event together with the detector specific behaviour. A real event is
read, chosen among the reconstructed data collected by the experiment,
containing a high-mass matched dimuon (within the mass
window, the two stiff muons guaranteeing an unambiguous identification of the interaction target)
whose vertex is imposed to be the origin of the generated muon pair.
Alternatively, dimuons whose vertex has the -coordinate determined with an uncertainty
smaller than 3 mm were also used. This second choice, applying weaker
conditions on the vertex candidates, has been considered for
systematic checks in the analysis. The muon pair produced in the
simulation is tracked through the NA60 apparatus, using
GEANT3 Brun:1987ma . Starting from the ensemble of simulated and real hits, the events
in which a muon pair gave rise to a trigger were reconstructed using
the same reconstruction settings used for the real data. To make the
MC simulation as realistic as possible, the MC tracks leave a signal
in a given pixel plane with a probability proportional to the plane
efficiency as estimated from the analysis of the real data.
The dependence of the dimuon acceptance results from a complex convolution of several factors: the geometric acceptance of the vertex telescope, the energy loss of muons in the hadron absorber, the geometric requirements embedded in the trigger logic of the muon spectrometer (which requires two muons to belong to different sextants), the combination of the magnetic fields provided by the dipole magnet in the vertex region and the toroidal magnet in the muon spectrometer after the absorber. An additional loss of factor up to is caused by the reconstruction efficiency.
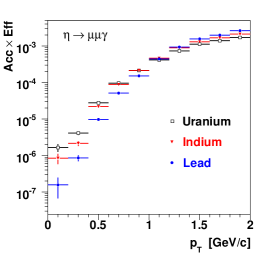
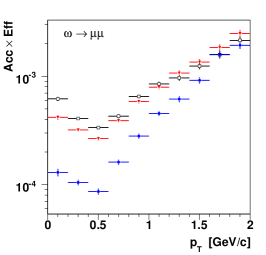
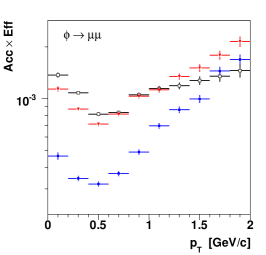
In Figure 1 the dimuon acceptance reconstruction efficiency as a function of is shown for the three processes , and , on which the extraction of the , and yields is based. For each process, the dependence is shown for the Uranium, Indium and Lead targets, respectively sitting in the initial, central and final part of the target system. In the 2004 p-A run the acceptance was lower than during the In-In run. This was due to a combination of several factors, the most important being the replacement of 40 cm of graphite with 40 cm of iron in the final part of the hadron absorber. Other factors contributing to the loss of acceptance were the reduced tracking efficiencies both for the muon spectrometer (due to 5 MWPC broken planes) and the vertex spectrometer (one tracking plane permanently switched off and the others having much reduced efficiencies with respect to the In-In run, because of ageing effects), as well as the selections imposed in the analysis for the identification of the production target.
4 Signal Extraction
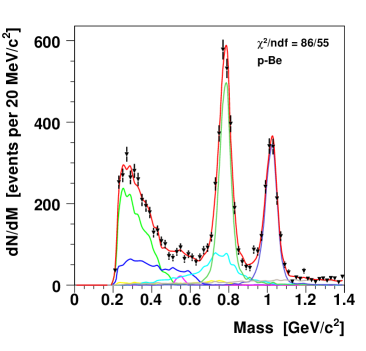
The signal extraction for the dimuon sources of interest for the present analysis is based on a fit of the dimuon mass spectrum, after the subtraction of the combinatorial background. In the fit procedure, the data points are compared to the superposition of the expected MC sources in the mass region from the threshold up to 1.4 GeV/, as explained in Arnaldi:2016pzu .
Any possible interference effect is neglected in the fits performed in the present analysis, as justified by the results discussed in Arnaldi:2016pzu . The contribution of the Dalitz decay accounts for a very small fraction of the total dimuon yield; for this reason, and because of its continuum shape having no dominant structure apart from the broad peak at the mass (due to the contribution of the to the form factor), the fit to the reconstructed mass spectrum is not sensitive to this contribution, and the ratio was fixed to 0.12 genesis ; Becattini:2003wp . The relative branching ratios and have been fixed to the PDG value Nakamura:2010zzi and to the value obtained from the analysis of the target-integrated mass spectrum Arnaldi:2016pzu , respectively. The normalisation of the -meson 2-body decay has been left free in the -integrated fits, where the available data samples were large enough to allow for a robust extraction of the corresponding signal; it was otherwise fixed to , as justified by the -integrated results. All the other processes have their normalisations free.
The evaluation of the systematics on the signal extraction is performed by repeating the fits on the dimuon mass spectra, each time varying the following parameters of the input configuration: (i) the cross section ratio was varied by with respect to the nominal value 0.12; (ii) the combinatorial background normalisation was varied by ; (iii) the ratio , when fixed, was varied by around the nominal value ; (iv) the relative branching ratios between the 2-body and Dalitz decays of the and mesons were varied by the uncertainties associated to the existing measurements Nakamura:2010zzi ; Arnaldi:2016pzu ; (v) the cut on the matching for the single muons was varied in the interval 2 to 3; (vi) two settings for the choice of the production vertices in the overlay MC were used, as described in the previous section.
A possible bias in the estimation of the open charm contribution has also been considered, due to the fact that the Drell-Yan process, which does not give any appreciable contribution below 1 GeV/ while contributing above, is neglected in the fits. In order to study the corresponding systematic effect, each fit has been repeated scaling the open charm process down to 80% and 60% of the level optimised by the fit when the contribution is left free.
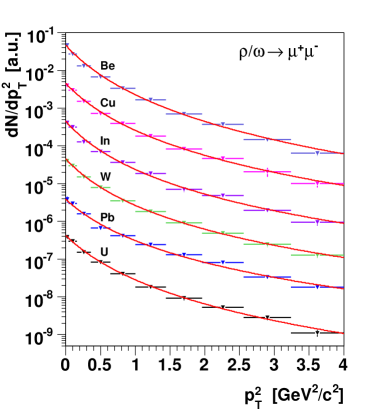
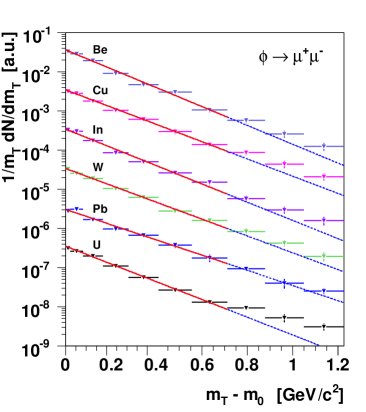
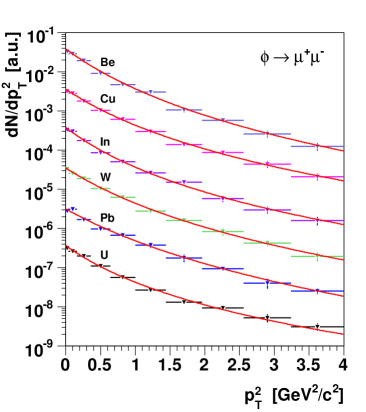
5 spectra of the and mesons
In this section we present the analysis of the transverse momentum spectra for the and mesons. To build the raw spectra we start by dividing the real data sample, target by target, into intervals of 200 MeV/, sufficiently larger than the resolution of the apparatus in order for residual smearing effects to be safely neglected. The same selection is then applied to the MC spectra for all the signal sources, as well as to the contribution accounting for the combinatorial background. The available statistics is significant up to GeV/. For each target and interval, a fit is then performed on the dimuon mass spectrum after the subtraction of the combinatorial background. In this way, the contributions coming from the 2-body decays of the and mesons can be evaluated, and a raw spectrum is extracted for each particle. This is then corrected for the acceptance efficiency as a function of , estimated through the MC simulations. For sufficiently narrow bins, this correction is independent of the function used as input for the MC simulations.
Dividing the total sample into several intervals strongly reduces the statistics available for each mass spectrum fit, making it impossible to properly disentangle the contribution under the peak. For this reason, the constraint is imposed in these fits, as justified by the -integrated analysis of the production cross section ratios as a function of the target size A, discussed in the last section. Whenever the constraint is imposed in the analysis, the results are referred to instead of or separately.
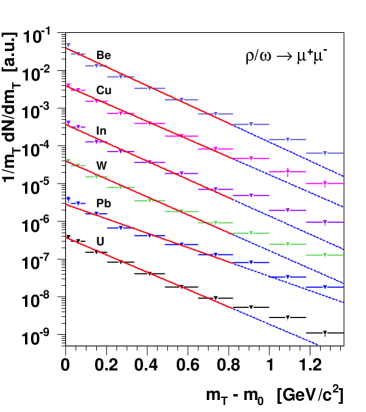
The and spectra resulting after the correction for the acceptance efficiency are shown in Figures 2–3 as a function of the transverse mass and . The spectra have been compared to the thermal-like function:
| (4) |
One can immediately appreciate how the thermal hypothesis clearly fails in describing the spectra in the whole available kinematic range, showing a systematic deviation from the pure exponential trend. The fact that such a deviation was not observed in peripheral In-In collisions at 158 AGeV Banicz:2009aa , resulting in a hardening of the spectra reported in the present analysis, could be attributed to the larger collision energy in the p-A data.
The fit with the exponential function has thus been limited to
GeV/ and GeV/
for the and the mesons, respectively,
where the thermal hypothesis
is found to describe the data reasonably well (solid, red line); the
extrapolation of the resulting fit function up to the upper end of the available
range is shown as a dashed, blue line, helping to appreciate
the contribution of the hard tail at high . The values found
from the fits are compiled in Table 1,
where both statistical and systematic uncertainties are reported, the
latter reflecting squared sum of the systematic uncertainty on the signal extraction,
discussed in the previous Section. When evaluating the systematic uncertainty on the parameter,
the upper limit of the fit range was also changed by the quantity equivalent to MeV/ in ,
since the limit of the range where the thermal-like part of the distribution dominates
over the hard tail cannot be precisely established.
The superposition of a thermal-like distribution at low and a hard tail at high , favored by the data, can be modeled by means of the following power-law function, used for example by the HERA-B Collaboration to describe the spectrum of the meson Abt:2006wt :
| (5) |
a standard form where the term dominates in the limit of vanishing , and the dependence is characteristic of hard processes. The fits based on this power-law function successfully extend up to the upper end of the available range, as it can be appreciated from the right panels of Figure 2–3. The and parameters are listed in Table 1 with their statistical and systematic uncertainties, the latter reflecting the squared sum of the systematic uncertainties on the signal extraction, discussed in the previous Section.
| Target | [MeV] | [GeV] | |||
|---|---|---|---|---|---|
| Be | |||||
| Cu | |||||
| In | |||||
| W | |||||
| Pb | |||||
| U | |||||
| ALL | |||||
| Be | |||||
| Cu | |||||
| In | |||||
| W | |||||
| Pb | |||||
| U | |||||
| ALL | |||||
No significant trend for the or parameters,
as a function of the production target, can be inferred from the fit
results within the statistical and systematic uncertainties. To get
more insight into this aspect, in Table 1 we
also compile the mean value of for each target, as extracted
from the corresponding power-law fit function. The errors associated
to each value of reflect the statistical and
systematic uncertainties on the or parameters. No
definite trend as a function of the target can be identified here,
too. To compare the and spectra, then, the
target-integrated values are considered — profiting from a better statistical accuracy.
One finds , .
The results obtained for the spectra of the and
mesons can be compared to the available experimental results. The
NA27 Collaboration measured the , , and
production in p-p collisions at GeV AguilarBenitez:1991yy .
No data point is shown by the NA27 Collaboration for the spectra of the
and mesons, for which only the fit results are given, relative
to the function , with the quoted
values for the parameter being: (GeV/)-2, (GeV/)-2. From these parameters one finds
and
.
As one can see, the for the meson extracted
from the fit function of NA27 agrees with the estimate obtained in the
present analysis, while for the of
the meson a difference of more than 4 (statistical)
standard deviations is found. Furthermore, the present NA60 results clearly indicate
that , while the
NA27 results imply that .
Concerning the measurement for the -meson, the present results can be also compared to the ones obtained by the HERA-B Collaboration Abt:2006wt , which measured -meson production (in the channel) in p-C, p-Ti and p-W collisions at GeV. Keeping in mind the different energies between the NA60 and the HERA-B data, the distributions are well described in both cases by the power-law function (5). As in the present analysis, no definite trend for the as a function of the target is found by HERA-B. The , parameters and the mean measured by HERA-B are compatible with the NA60 measurements shown in Table 1; in particular, for the Tungsten target common to both the NA60 and HERA-B data, the following values are found: , , , to be compared to the NA60 results listed in Table 1.
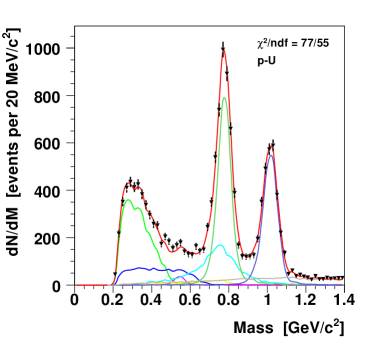
6 Nuclear dependence of the , and production cross sections
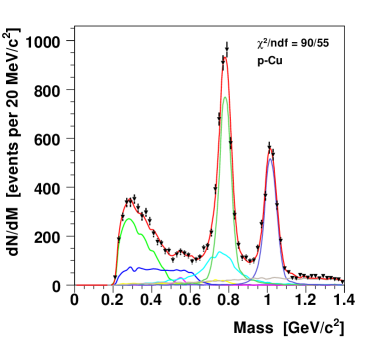
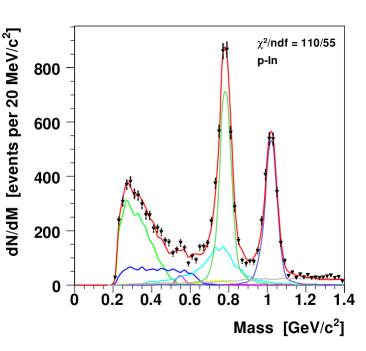
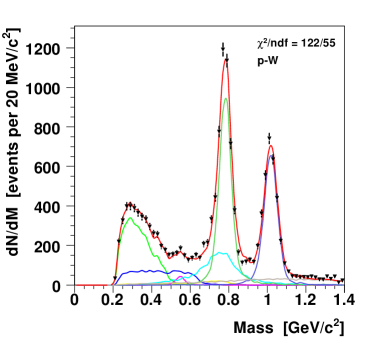
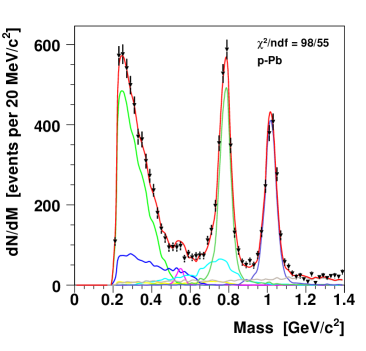
6.1 -integrated analysis
The -integrated yields of the , and mesons are extracted from the fits shown in Figure 4. As one can see, the comparison between the sum of the MC sources and the dimuon mass spectrum is satisfactory over the whole mass range for each target. The yields are then corrected for the acceptance efficiency evaluated in the full phase space, and normalised to the number of nuclear interaction lengths of each target. The small beam attenuation seen by the downstream targets is also taken into account and corrected for. In the case of the -meson, the difference between the kinematics of the parent meson and the dimuon has been properly estimated by means of a MC simulation of the Dalitz process, and the results properly corrected for.
In the following, the nuclear dependence of the production cross-sections,
normalised to the lightest target is presented. The absolute cross-sections could not be determined
because of a malfunctioning of the argonium counter devoted the beam luminosity measurement.
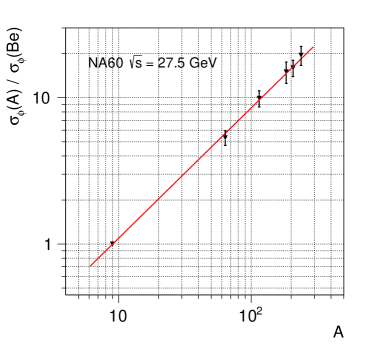
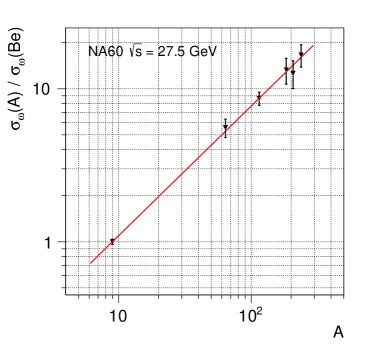
The relative production cross sections for the ,
and mesons,
normalised to the Beryllium target, are shown in the left panels of
Figure 5. The cross section for the -meson was found to be
compatible with the one of the -meson within the errors, independent of the target, and is not shown here (see Section 7).
The nuclear dependence of the production cross
sections has been parameterised with the power law Sibirtsev:2008ib : the fit functions are shown as solid, red lines in
Figure 5, giving , and
.
| [GeV/] | |||
|---|---|---|---|
| — | |||
| — | |||
| — | |||
Fixing the reference for the relative cross sections to the Beryllium nucleus could induce a bias in the analysis of the nuclear dependence of particle production. Accounting for 9 nucleons only, indeed, the Be nucleus could behave more as an incoherent superposition of single nucleons rather than as a nuclear system having collective properties — as in the case of the heavier nuclei. This could lead to a breaking of the power-law dependence for the Be target, biasing the extraction of the parameters. For this reason, the option to normalise the production cross sections to the Cu target, excluding the Be point from the fit, was also considered as a cross-check: the corresponding results on the parameters, affected by larger statistical uncertainties because of the much reduced lever arm, and not shown here, were found to be compatible within the uncertainties to the ones presented above.
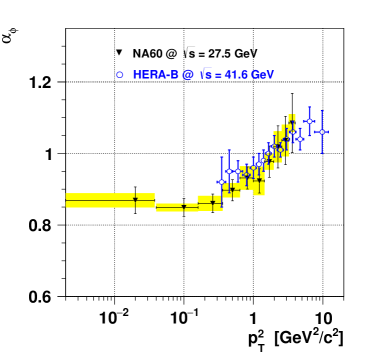
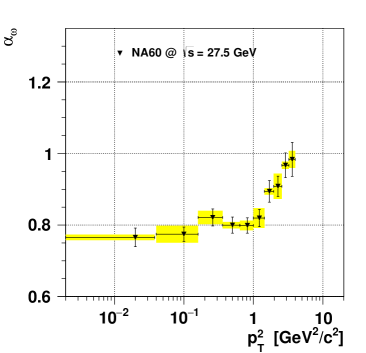
6.2 -differential analysis
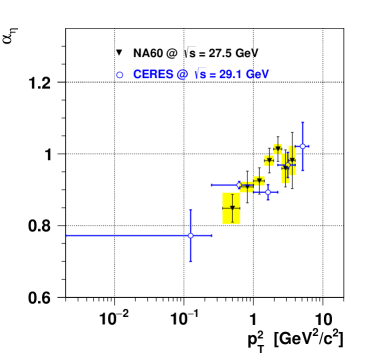
The -dependence of the parameters for the , and mesons has also been studied, considering intervals of 200 MeV/ and starting from for the and mesons and from GeV/ for the meson. For each slice of , the , and parameters have been extracted, together with their statistical and systematic uncertainties, by applying the same procedure discussed in the previous section for the -integrated measurement. The parameters are shown in Table 2 and their dependence is summarised on the right column of Figure 5: in each plot, the error bars and the shadowed boxes account for the statistical and systematic uncertainties, respectively. It was also verified (not shown here) that the same trend of the parameters as a function of , although with significantly larger uncertainties, could be found when excluding the Be target from the analysis, setting the relative normalisation to the Cu target.
The parameters increase as a function of for the three considered particles, a behaviour which can be related to the so-called “Cronin effect” originally observed by Cronin et al. for charged kaons Kluberg:1977bm . The trend of the parameters can also be interpreted as a consequence of the hardening of the particle production mechanism with , with values of closer to the “black disk” limit for , as expected for soft production mechanisms scaling with the surface of the target nucleus, and values closer to the limit for GeV/, as expected for hard production mechanisms scaling with the number of available nucleons. An additional hardening of the production mechanism could be attributed to the component in the quark wave function of the measured hadrons: in absence of explicit theoretical calculations for the parameters, this simple assumption could still qualitatively explain the larger values measured for and , with respect to .
The nuclear dependence of the production cross sections for the light neutral mesons has been studied by previous experiments for the meson, although at energy regimes often different from the one considered in the present analysis. The parameter for the meson has been measured by the NA11 Collaboration, at the CERN-SPS, studying collisions of 120 GeV protons on beryllium and tantalum targets, in the decay channel Bailey:1983uh . They obtained a value (with a systematic uncertainty estimated to be around three times smaller than the statistical one) for mesons produced in the phase space window and GeV/. The BIS-2 Collaboration, at Serpukhov, measured the value of the mesons produced in collisions induced by neutrons of energies between 30 and 70 GeV colliding on carbon, aluminum and copper targets, considering the decay channel Aleev:1990tf , obtaining for mesons produced with and GeV/ (without mentioning systematic errors). More recently, as already mentioned in the the analysis of the spectra, the HERA-B experiment at DESY studied -meson production in p-C, p-Ti and p-W collisions at GeV Abt:2006wt . HERA-B found a value in the phase space covered by the detector, and (GeV/)2. Extrapolating the measurements to zero , the value for decreases to (where the error includes the systematic uncertainty). The HERA-B results also suggest an increase of the parameter with (also reported for the and for the mesons), with values of as large as 1.1 for (GeV/)2. A remarkable agreement is observed between the -dependence of measured in the present analysis and the results of HERA-B, as shown in the right-top panel of Figure 5. The KEK-PS E325 experiment Tabaru:2006az also measured the parameter for the meson, studying its decay in p-C and p-Cu collisions at GeV. In the region of and GeV/ they found , larger than the NA60 measurement in the same range, but still compatible within the uncertainties. Summarising, despite the different collision systems, energies and also kinematic regions, there is a substantial agreement between the value extracted from the present analysis and the values from previous measurements.
A comparison of the results on the parameter can be established with the data published by the CERES-TAPS Collaboration Agakishiev:1998mw : good agreement is observed between the two sets of data points, as shown in the right-bottom panel of Figure 5. No similar comparison is possible for the , due to the lack of available measurements. The only available value for the meson is reported by the KEK-PS E325 Collaboration, already cited for the meson, which measured , compatible with the value of for the total inelastic p-A cross section and somehow smaller than our result.
7 Particle cross-section ratios in full phase space
We finally consider the nuclear dependence of the particle cross-section ratios in full phase space, assuming the meson as the reference. The results are compiled in Table 3.
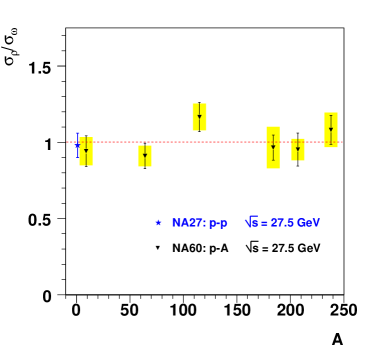
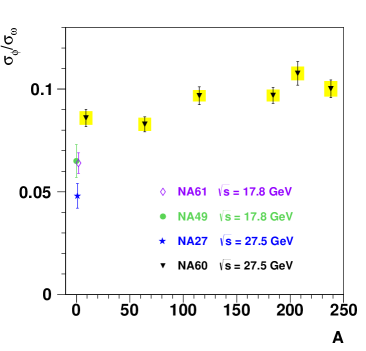
The ratio — shown in the left panel of Figure 6 — appears to be flat with A. The ratio averaged over the different targets, indicated by a horizontal line, is , in agreement with the ratio measured in p-p collisions at GeV by the NA27 experiment AguilarBenitez:1991yy , also shown in the figure.
The ratio is shown in the right panel of Figure 6. The trend of the NA60 data points points to a increase of the ratio from Beryllium to Uranium, as to be expected from the difference between the -integrated and coefficients, see section 6.1. The ratio in p-p collisions can be derived from the data of the NA27 AguilarBenitez:1991yy , NA49 Afanasev:2000uu ; Alt:2005zq and NA61/SHINE NA49:2017mtg experiments. The corresponding values are also reported in Figure 6. Given the low atomic number of the Be nucleus (with p-Be often historically taken as a proxy of p-p collisions) one might expect the ratio to show similar values in p-Be and p-p: this scenario is, however, not favoured by the data presented in Figure 6, which suggest instead a discontinuity in the evolution of the ratio from pp to p-A. The origin of this behaviour, should it be attributed to a genuine physical mechanism, cannot be further investigated on the basis of the currently available data.
| A | |||
|---|---|---|---|
| Be | |||
| Cu | |||
| In | |||
| W | |||
| Pb | |||
| U |
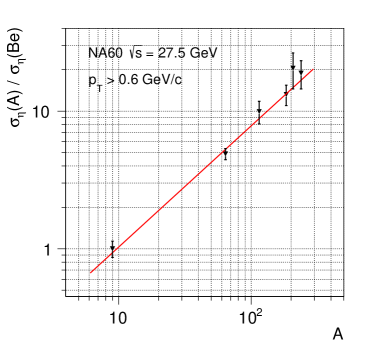
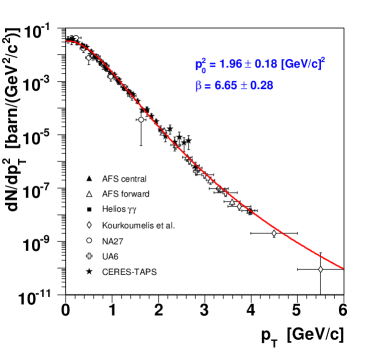
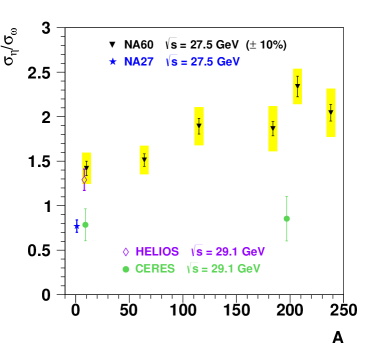
Special care must be taken when considering the ratio. Indeed, since the is measured in the present analysis via its Dalitz decay, and only for GeV/ of the muon pair, an extrapolation of the spectrum down to zero was needed, to recover the cross section in the full phase space. This full phase space extrapolation is based on a variety of available measurements, compiled in the plot shown on the left side of Figure 7 (see Veenhof:1993xt ; Agakishiev:1998mw ; AguilarBenitez:1991yy ; Kourkoumelis:1979ts ; Akesson:1983xq ; Akesson:1985za ; Akesson:1986nx ; Antille:1987kr ). On these data, a fit is performed with the power-law function given by Eq. (5), providing an excellent description of the points in the whole range. The ratio extrapolated to the full phase space is shown in the right panel of Figure 7. The systematic uncertainty from the extrapolation of the measurement to full phase space amounts to 10 %, point-to-point fully correlated. It should be remarked that the considered extrapolation factor does not depend on the nuclear target, and it is mainly based on measurements in elementary collisions (pp, p or p-Be). As a consequence, the NA60 results for the -integrated ratio are properly normalised at the p-Be point, while the trend versus A should be ascribed to the nuclear dependence of the ratio in the range GeV/, where particles are measured, as to be expected from the difference between the and coefficients in this same kinematic range, see section 6.1.
The cross-section ratio was also measured by NA27 in p-p collisions at GeV AguilarBenitez:1991yy , by HELIOS in p-Be collisions at GeV Akesson:1994mb and by CERES-TAPS in p-Be and p-Au collisions at GeV Agakishiev:1998mw . The corresponding measurements are shown in the right panel of Figure 7 together with the NA60 results. The measurement of by the HELIOS experiment was derived from the ratio measured in p-Be collisions through the detection of both dielectrons and dimuons, exploiting the capability to fully reconstruct the Dalitz decays. Neglecting possible interference effects, HELIOS obtained from the data and from the data. These results were based on a decay angle distribution to extrapolate the and measurements to full phase space. If HELIOS had assumed a uniform dimuon decay angle distribution for the and mesons, as done in the present analysis, the full phase space and cross sections would have been larger, resulting in a ratio around , in agreement with the NA60 value. Finally, the CERES-TAPS measurements in p-Be and p-Au are based on the and decay channels for , resulting in the two points also shown in the right panel of Figure 7.
The comparison between the p-A results from NA60 and the p-p point from NA27 suggests a discontinuity in the evolution of the ratio from p-p to p-A, similar to what remarked for the ratio. The HELIOS measurement in p-Be collisions agrees with the NA60 data, while the p-Be measurement of CERES-TAPS looks compatible with the p-p point from NA27. At large A, the NA60 data cannot be directly compared to the CERES-TAPS point in p-Au, because of the different range of covered by the two measurements in evaluating the nuclear dependence of the cross section. The CERES-TAPS data, taken alone, are not conclusive about the nuclear dependence of the ratio, because of the only two nuclear targets available and the rather large statistical uncertainties.
8 Conclusions
In this letter we reported on a comprehensive study of low-mass dimuon production in p-A interactions at 400 GeV, ranging from p-Be to p-U, measured with the NA60 apparatus at the CERN SPS. The analysis of the spectra for the and mesons has shown that the observed distributions cannot be explained by a thermal-like exponential function in the full range accessed, while a good description of the whole observed spectrum is provided by the power-law parametrisation . The nuclear dependence of the cross sections of the , and mesons has been found to be compatible with the power law , with a clear rising trend of the parameters observed as a function of . The observed, approximate hierarchy could be attributed to the component in the quark wave function of the and mesons, resulting in a harder production mechanism with respect to the meson. The measurement of the nuclear dependence of the production cross section ratios points to a moderate rising trend as a function of A of both the and — reflecting the observed difference in the parameters of the , and mesons — while the ratio has been found to be almost independent of the production target, and compatible with unity, in agreement with the available measurement in p-p.
References
- [1] T. Tabaru et al. Nuclear mass number dependence of inclusive production of and mesons in 12 GeV p-A collisions. Phys. Rev. C, 74:025201, 2006.
- [2] R. Nasseripour et al. Search for medium modification of the meson. Phys. Rev. Lett., 99:262302, 2007.
- [3] M. H. Wood et al. Absorption of the and Mesons in Nuclei. Phys. Rev. Lett., 105:112301, 2010.
- [4] R. Arnaldi et al. Precision study of the and electromagnetic transition form-factors and of the line shape in NA60. Phys. Lett., B757:437–444, 2016.
- [5] G. Agakishiev et al. Neutral meson production in p-Be and p-Au collisions at 450 GeV beam energy. Eur. Phys. J. C, 4:249–257, 1998.
- [6] Robert Jan Veenhof. Low mass muon pair production in 450 GeV p-Be collisions. RX-1433 (AMSTERDAM).
- [7] M. Aguilar-Benitez et al. Inclusive particle production in 400-GeV/c p p interactions. Z. Phys. C, 50:405–426, 1991.
- [8] I. Abt et al. and phi Meson Production in Proton-Nucleus Interactions at = 41.6 GeV. Eur. Phys. J. C, 50:315–328, 2007.
- [9] R Arnaldi et al. Evidence for the production of thermal-like muon pairs with masses above 1 GeV/ in 158A GeV Indium-Indium Collisions. Eur. Phys. J. C, 59:607–623, 2009.
- [10] S. Damjanovic, H. Woehri, and A. De Falco. NA60 Internal Note 2005-1.
- [11] S. V. Afanasev et al. Production of Phi mesons in p + p, p + Pb and central Pb + Pb collisions at E(beam) = 158-A-GeV. Phys. Lett. B, 491:59–66, 2000.
- [12] T. Alber et al. Charged particle production in proton, deuteron, oxygen and sulphur nucleus collisions at 200-GeV per nucleon. Eur. Phys. J., C2:643–659, 1998.
- [13] E. L. Bratkovskaya, W. Cassing, and U. Mosel. Probing hadronic polarizations with dilepton anisotropies. Z. Phys. C, 75:119–126, 1997.
- [14] A. Anastasi et al. Measurement of the transition form factor with the KLOE detector. 2016.
- [15] G. J. Gounaris and J. J. Sakurai. Finite width corrections to the vector meson dominance prediction for . Phys. Rev. Lett., 21:244–247, 1968.
- [16] K. Nakamura. Review of particle physics. J. Phys. G, 37:075021, 2010.
- [17] Joern Knoll. Transport dynamics of broad resonances. Prog. Part. Nucl. Phys., 42:177–186, 1999.
- [18] Norman M. Kroll and Walter Wada. Internal pair production associated with the emission of high-energy gamma rays. Phys. Rev., 98:1355–1359, 1955.
- [19] Torbjorn Sjostrand, Stephen Mrenna, and Peter Z. Skands. PYTHIA 6.4 Physics and Manual. JHEP, 05:026, 2006.
- [20] R. Brun, F. Bruyant, M. Maire, A.C. McPherson, and P. Zanarini. GEANT3. 1987.
- [21] F. Becattini, M. Gazdzicki, A. Keranen, J. Manninen, and R. Stock. Chemical equilibrium in nucleus nucleus collisions at relativistic energies. Phys. Rev. C, 69:024905, 2004.
- [22] K Banicz et al. phi Production in In-In Collisions at 158-A-GeV. Eur. Phys. J., C64:1–18, 2009.
- [23] A. Sibirtsev, H. W. Hammer, and U. G. Meissner. A-dependence of meson production in p-A collisions. Eur. Phys. J. A, 37:287–301, 2008.
- [24] L. Kluberg et al. Atomic Number Dependence of Large Transverse Momentum Hadron Production by Protons. Phys. Rev. Lett., 38:670–673, 1977.
- [25] R. Bailey et al. A-Dependence study of inclusive production. Z. Phys. C, 22:125, 1984.
- [26] A. N. Aleev et al. A-Dependence of inclusive meson production in neutron - nucleus interactions at 30 GeV to 70 GeV. Czech. J. Phys., 42:11–19, 1992.
- [27] C. Alt et al. Inclusive production of charged pions in p+p collisions at 158-GeV/c beam momentum. Eur. Phys. J., C45:343–381, 2006.
- [28] Antoni Marcinek. New baryonic and mesonic observables from NA61/SHINE. EPJ Web Conf., 182:02082, 2018.
- [29] C. Kourkoumelis et al. Inclusive production at high at the ISR. Phys. Lett. B, 84:277, 1979.
- [30] T. Akesson et al. Production of and at 11∘ in p-p collisions at = 63 GeV. Z. Phys. C, 18:5, 1983.
- [31] T. Akesson et al. A comparison of direct photon, , and production in p- and p-p interactions at the CERN ISR. Phys. Lett. B, 158:282–288, 1985.
- [32] T. Akesson et al. Inclusive production at low transverse momentum in 63 GeV p-p collisions at the CERN interacting storage rings. Phys. Lett. B, 178:447, 1986.
- [33] J. Antille et al. A measurement of the inclusive and production cross sections at high in p- and p-p collisions at GeV. Phys. Lett. B, 194:568, 1987.
- [34] T. Akesson et al. Low mass lepton pair production in p-Be collisions at 450 GeV/. Z. Phys. C, 68:47–64, 1995.