Path-Dependent Supercooling of the 3He Superfluid A-B transition
Abstract
We examine the discontinuous first-order superfluid 3He A to B transition in the vicinity of the polycritical point (2.232 mK and 21.22 bar). We find path-dependent transitions: cooling at fixed pressure yields a well defined transition line in the temperature-pressure plane, but this line can be reliably crossed by depressurizing at nearly constant temperature after transiting at a higher pressure. This path dependence is not consistent with any of the standard B-phase nucleation mechanisms in the literature. This symmetry breaking transition is a potential simulator for first order transitions in the early universe.
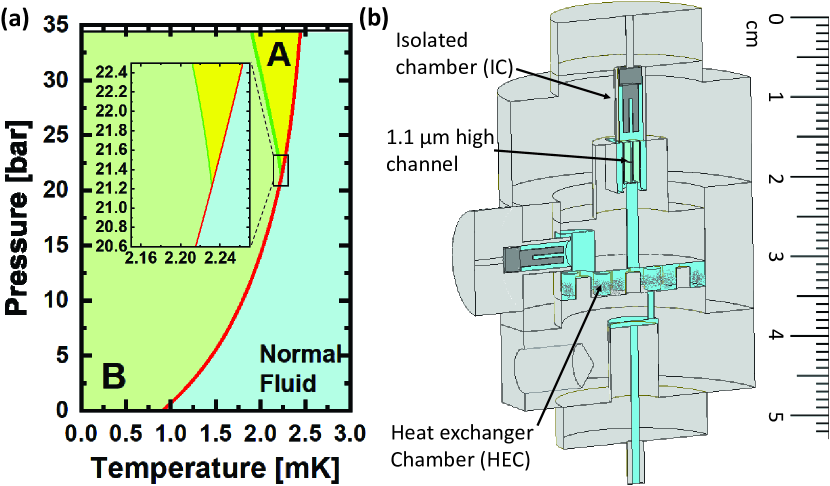
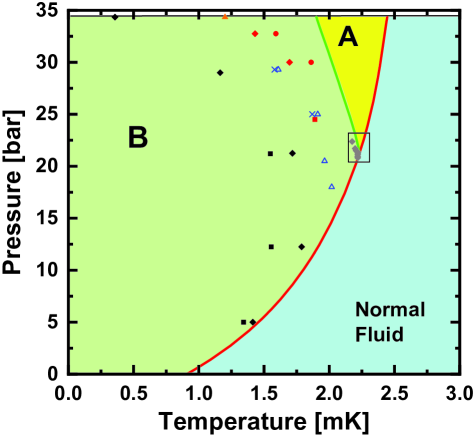
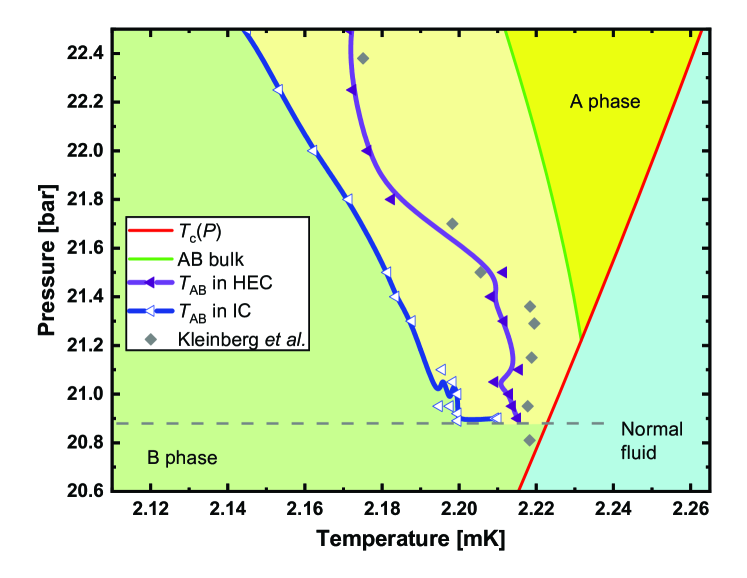
Superfluid 3He is a condensed matter system with a complex order parameter. Superfluidity onsets with the condensation of pairs into a state with finite angular momentum via a second order phase transition at a pressure dependent transition temperature, [1, 2, 3, 4, 5]. Pressure dependent strong coupling favors the anisotropic A phase at high pressures, while the isotropic B phase is the stable phase below the line [6]. Under these conditions the equilibrium phase diagram exhibits a polycritical point (PCP) at which the line of first order transitions () intersects the line of second order transitions () at 21.22 bar and 2.232 mK (Figure 1(a)). The transition between the A and B phases is first order and thus subject to hysteresis. At the PCP, the bulk free energies of A, B superfluid phases and normal state are equal.
At high pressure the A phase supercools well below and can be long lived [7]. A phase supercooling occurs because any formation of a bubble of radius of B phase (from the parent A phase) sets off the unusually large interfacial energy () [8] against the small free energy gain () [9] leading to to a critical radius 1 m. The extreme purity and low temperatures that limit thermal fluctuations together with the barrier to homogeneous nucleation lead to calculated lifetimes of the supercooled A phase greater than the age of the Universe. The transition has been the subject of extensive experimental [10, 11, 12, 13, 14, 15, 7, 16, 17, 18, 19] (summarized briefly in Supplementary Note 1 [20]) that have limited applicability to the experiments in this letter since they were performed in a variety of magnetic fields and not focused on the PCP. The AB transition was also the subject of extensive theoretical investigation [21, 22, 23, 24, 25, 26, 27, 28]. As Leggett has pointed out [22, 23, 24], the nucleation mechanism of the B phase “remains a mystery”. Its study represents a unique opportunity to gain fundamental insights and is potentially relevant to phase transitions in the evolution of the early universe [29].
Here we study the nucleation of B phase in a well characterized isolated volume and in negligible magnetic field (the Earth’s field) near the PCP. In this region the free energy landscape as a function of complex order parameter, pressure and temperature is of particular interest. Over the limited phase space (box in Figure 1(a)) we observe both a reproducibility of B phase nucleation and an unexpected path dependence.
Two mechanisms for nucleation of the B phase have experimental support. The “Baked-Alaska mechanism” [23] requires local heating by deposition of energy following passage of a cosmic ray or charged particle and was tested using quartz cells of roughness 10 nm [7, 31] in a magnetic field of 28.3 mT. The AB transition could be induced by a nearby radioactive source, confirming aspects of the mechanism. In the cosmological or Kibble-Zurek scenario [18, 25, 26], small regions undergo phase transitions that are “oriented” differently under quench conditions (cooling through ) [16, 18, 32]. When they eventually coalesce, they produce a cosmic string, or its equivalent in 3He - a vortex line. Other, yet to be tested models cite Q balls [27] and Resonant Tunneling (RT) [28]. RT is an intrinsic nucleation mechanism, in which the transition rate into the equilibrium B phase (“true vacuum”), depends on the details of the order parameter landscape. Under certain precise conditions of temperature and pressure a nearby “false vacuum” facilitates the transition. Thus the mechanism relies on the richness of the superfluid 3He 18-dimensional order parameter, with multiple possible states [33, 34]. Furthermore some of these states have degeneracies, which are broken by weak interactions, for example spin-orbit interaction. An example of this is the spatially modulated B-phase, stabilized by confinement [35], which may explain the observed absence of supercooling in Ref. [36].
Our experiment consists of two chambers (Figure 1(b)), filled with bulk 3He separated by a m height channel. The experimental set-up and the associated thermal parameters are described in detail in a previous publication [37] (see also Supplementary Note 2 [20]). The AB transition is observed in an isolated chamber (IC) using a quartz tuning fork [38] whose resonant frequency, , and (Quality factor, with the full linewidth at half power) are monitored continuously. The second chamber (HEC) contains the silver heat exchanger, as well as a second tuning fork. Nucleation of B phase in the HEC does not propagate into the IC, because the A phase is stabilized in the channel by confinement [39] under all conditions studied here. There are no sintered powders in the IC to promote nucleation of the B phase but the surfaces are not specially prepared. The experiment is located where the magnetic field is mT, the 3He pressure, was regulated to within bar using a room temperature gauge (see Supplementary Note 3 [20]). Temperatures, were read off from a 3He melting curve thermometer [6] after correction for thermal gradients ( K [37]) and converted to the PLTS2000 temperature scale [30] (Supplementary Note 4 [20]). The temperature, (read off from the melting curve thermometer), and pressure, read off from a regulated pressure gauge located in the room temperature gas handling system accurately represent the coordinates in the IC and HEC during all parts of the experiments (see Supplementary Note 3 [20]).
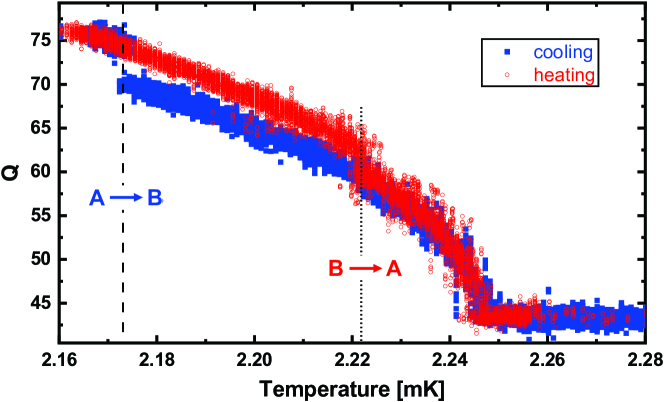
The measured of the IC fork while cooling (blue) and warming (red) through , and the AB (blue) or BA (red) transitions are shown in Figure 2. The displacement of the dashed lines in Figure 2 illustrates supercooling via the hysteresis of the first order AB (BA) phase transitions. We cooled to within 5 K of the supercooled transition at 22 bar and maintained the temperature within 5 K of that transition for a day and observed no AB transition, emphasizing the stability of the metastable A phase close to the observed supercooled transition temperature.
The of the AB supercooled phase transitions while ramping temperature at K/hr is shown in Figure 3(a) as left-pointing triangles with a heavy blue line drawn to guide the eye. These points lie below the equilibrium line (light green) at zero magnetic field [6] where the free energies of the A and B phases are equal. The light green and heavy blue lines bound the supercooled A phase (light yellow). We observed the AB transition at 20.89 bar 24 K below but no AB transition was seen at 20.88 bar (Supplementary Note 5 [20]). Thus we do not extend the blue line to ; instead, we draw a gray dashed line at 20.88 bar. Clearly, the A phase is reliably observed while cooling at constant pressure through below the polycritical point; however, it does not reappear on warming at these pressures. This confirms that the magnetic field, which would otherwise stabilize a thin sliver of A phase, is negligible. The set of AB transitions observed in the HEC along with the transitions shown here in the IC are briefly discussed in Supplementary Note 5 [20]; the presence of silver powder significantly raises the temperature of AB transitions.
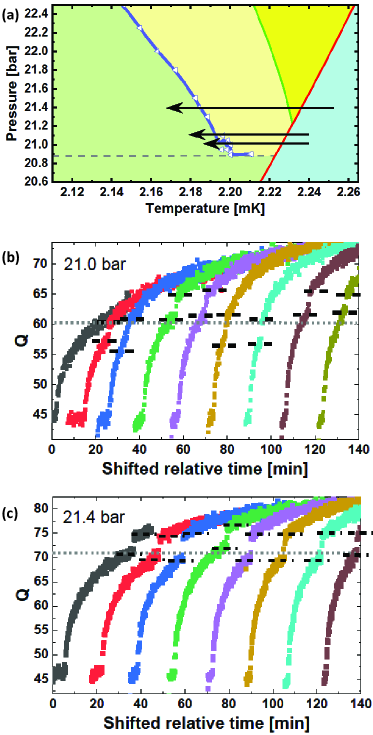
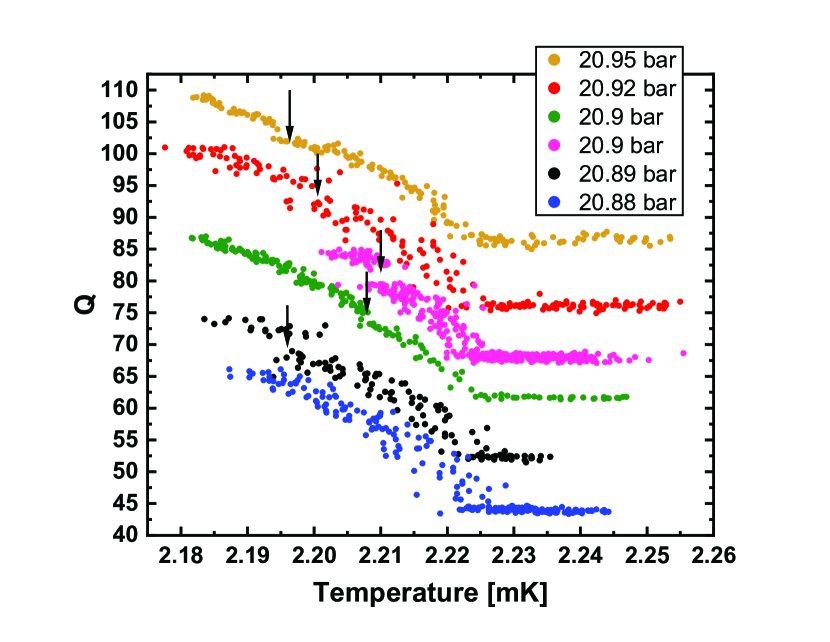
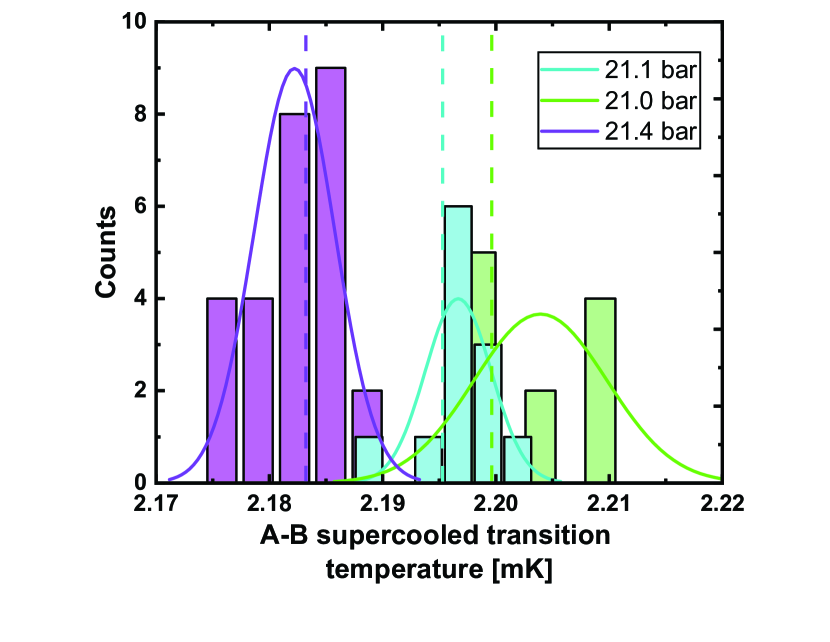
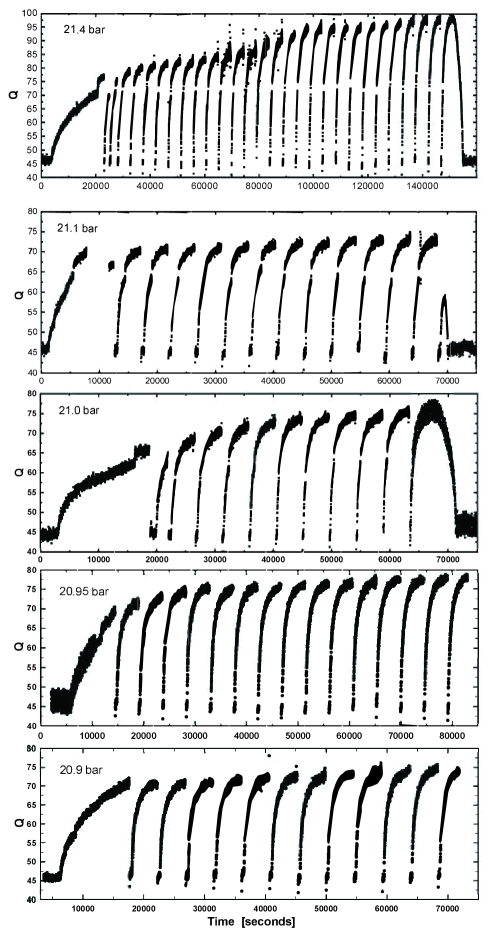
To sample the AB transition statistics, we increased the drive voltage to the quartz fork in the IC (by 10) for a few hundred seconds, to warm the IC above and then cool back through and as rapidly as possible (100 K/hr at ). Warming the IC above is essential to prevent premature nucleation by persistent pockets of B phase [19]. The following these pulses is shown in Figure 3(b,c) (see also Supplementary Note 5 [20]). The 3He in the channel is certainly in the A phase before the IC cools through [39, 36, 40, 37] and the 3He in the HEC is in the B phase. In Figure 3(b), the AB transition occurs in a very narrow interval of (and thus ). The width of the distribution of at 21.4 bar is K, close to the slow cooled , and similarly for 21.1 bar, K. At 21.0 bar, the fast cooled AB transitions were more broadly distributed ( K). The distributions are shown in Supplementary Note 5 [20]. Pulsed experiments at 20.95 and 20.90 bar showed only a few AB transitions with most pulsed transitions crossing directly from the normal to the B phase. Slow cooled AB transitions were seen at 20.95, 20.92, 20.90 and 20.89 bar. These various slow and fast cooled transitions are shown in Supplementary Note 5 [20]. The scatter in and increase in width of the distribution for fast cooled transitions at low pressures argues for the onset of an instability of the A phase under cooling at constant pressure from . The initiation of the A phase while cooling at constant pressure through below the PCP is briefly discussed in Supplementary Note 6 [20]. Termination of this instability line away from , similar to a critical point (see Supplementary Note 6 [20]), is not excluded.
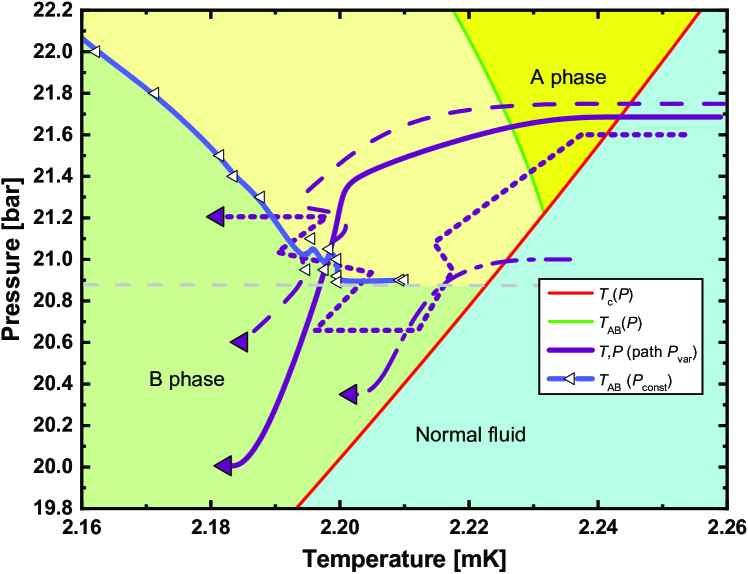
Despite the sharpness of the (blue) instability line at constant pressure, we now show that nucleation of the B phase is path-dependent. We carried out a series of experiments where we followed different trajectories in the plane (Figure 4). It is clear that supercooling of A phase below the instability line (in one case involving several crossings of this line) is possible. Traversal of the gap between the apparent termination of the instability line and is also possible. If the transition observed under constant pressure cooling were due to an enhanced transition probability at (or near) certain values of (), then we should have observed an AB transition on crossing the ( = Const.) line. We conclude that are insufficient to describe the probability of the change of state of the system.
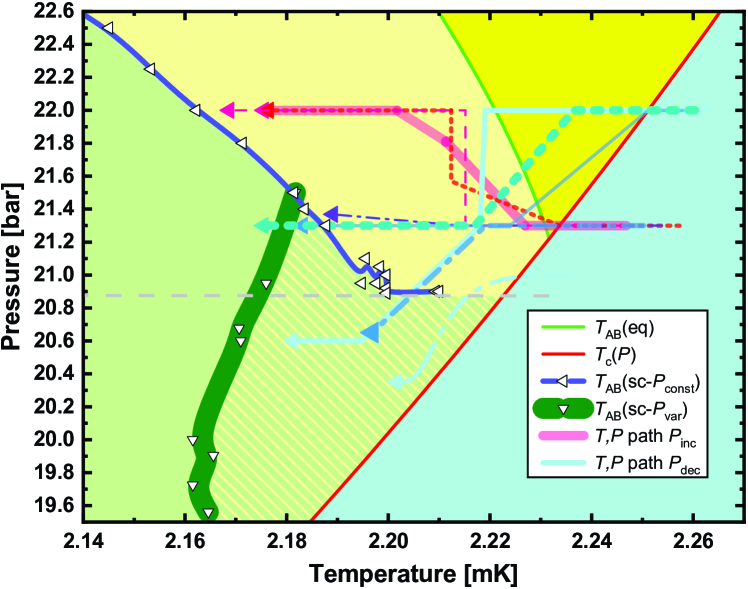
In another series of experiments we find an enhanced region of supercooling (striped region in Figure 5) if we initially cool through between 23 and 22 bar. This cooling is followed by a trajectory (paths not shown) in which we depressurize and cool slowly, all trajectories crossing the blue instability line below 21.5 bar. The supercooled AB transitions occur along a reasonably well-defined lined in the plane shown as a broad green line in Figure 5. This path-dependent enhancement of the supercooled region, suggests a “memory” of at which the normal-superfluid transition occurred. Such a memory or path dependence is confirmed since under-supercooling (albeit small) is seen after pressurization, (pink lines in Figure 5); similarly, depressurization following cooling at a constant pressure results in greater supercooling (cyan lines in Figure 5) compared to cooling at constant pressure through to the same final pressure.
In summary, we have carried out a study of the nucleation of the superfluid B phase of 3He from the supercooled A phase in the vicinity of the polycritical point, where the difference in free energy of the two phases is small. On cooling at constant pressure, we identify a well-defined instability line in the plane at which the first order supercooled AB transition occurs. We find that this instability line appears to terminate at a point, separated from the line of second order normal-superfluid transitions , and at a pressure 0.3 bar below PCP. The locus of the instability line does not depend on the cooling rates studied, which differ by an order of magnitude, except in the immediate vicinity of the terminus point. However, by following a variety of different trajectories in the plane we demonstrate that supercooling displays a path dependence. Thus pressure and temperature alone do not provide coordinates to specify where supercooled A phase transforms to B phase. An open question is the potential analog with path dependence in supercritical region of classical liquids [41], which may also relate to the observed terminus of the instability line.
We find that supercooling can be enhanced by crossing and then depressurizing. In principle such a “memory effect” could be explained by small 3He-filled cavities in the surface connected to the bulk 3He via a narrow orifice (see Fig. 1 in [23]). However we believe this is not a likely mechanism here (see Supplementary Note 8 [20]). Our experiment also provides a test of the Baked-Alaska mechanism of cosmic ray induced nucleation in a well-motivated but relatively unexplored region of phase space near the PCP. We believe that neither the statistics of nucleation at the constant pressure instability line, nor the path dependence of nucleation are explained by this model.
We suggest that the full free energy landscape in the isolated chamber should be taken into consideration, within the framework of resonant tunnelling or alternative models. The equilibrium order parameter has a strong spatial dependence: at surfaces of the chamber and the tuning fork, where gap suppression depends on surface scattering; at sharp corners [42, 35, 43]. The orientation of the order parameter (texture) in the complex geometry of the chamber and tuning fork may also play a role, although in this case the energy scales are much smaller [1, 5]. Superfluid domain walls, both textural and “cosmic” [44] may also play a role [45] and respond differently under (de)pressurization. All these effects are in the context of the bulk free energy landscape of the superfluid 3He order parameter, in which strong coupling effects (source of stability of A phase) are both pressure and temperature dependent [46].
Further investigations of these phenomena will be aided by the following. Surface scattering conditions can be tuned from diffuse to specular by adjustment of surface 4He boundary layer [47, 48, 43]. The free energy difference of bulk A and B phases can be tuned by magnetic fields [49]. Surface quality and geometry can be tailored using silicon nanofabrication techniques [50, 36, 51], extending the method of confining channels adopted in this work to isolate the chamber from B phase. The AB transition can be assayed by a non-invasive probe, such as NMR [52, 35]. It remains to be explored whether such path dependence is confined to the restricted region near the polycritical point.
We conjecture that the puzzling detachment of the constant pressure instability line and the reliable nucleation of A phase below the PCP, may arise from the fact that the sample is cooled through a channel in which the A phase is stabilized by confinement, and this imprints the A phase on the bulk chamber. If so, it may be possible to seed non-equilibrium phases of superfluid 3He, such as the polar phase, by cooling through a channel in which the polar phase is stabilized by oriented nanoscale structures [53, 50, 54, 55].
The quest to understand the nucleation of B phase from A phase remains open, with implications for cosmology. First order transitions have been proposed in the early universe, such as the electroweak transition [56], and in eternal inflation [57]. These have potential signature signals in future gravitational wave detectors [58, 59, 60], the prediction of which relies on nucleation theory. This provides strong motivation to identify the possible intrinsic nucleation mechanisms in superfluid 3He as a laboratory-based simulator for cosmology.
We acknowledge useful input from J.A. Sauls, B. Widom, H. Tye , M. Hindmarsh and A.J. Leggett. This work at Cornell was supported by the NSF under DMR-1708341, 2002692 (Parpia), PHY-1806357 (Mueller), and in London by the EPSRC under EP/R04533X/1 and STFC under ST/T006749/1. Fabrication of the channel was carried out at the Cornell Nanoscale Science and Technology Facility (CNF) with assistance and advice from technical staff. The CNF is a member of the National Nanotechnology Coordinated Infrastructure (NNCI), which is supported by the National Science Foundation (Grant NNCI-1542081).
References
- Leggett [1975] A. J. Leggett, Rev. Mod. Phys. 47, 331 (1975).
- Wheatley [1975] J. C. Wheatley, Rev. Mod. Phys. 47, 415 (1975).
- Lee [1997] D. M. Lee, Rev. Mod. Phys. 69, 645 (1997).
- Dobbs [2001] E. Dobbs, Helium Three, International Series of Monographs on Physics (Oxford University Press, 2001).
- Vollhardt and Wolfle [2013] D. Vollhardt and P. Wolfle, The Superfluid Phases of Helium 3, Dover Books on Physics (Dover Publications, 2013).
- Greywall [1986] D. Greywall, Phys. Rev. B 33, 7520 (1986).
- Schiffer et al. [1992] P. Schiffer, M. T. O’Keefe, M. D. Hildreth, H. Fukuyama, and D. D. Osheroff, Phys. Rev. Lett. 69, 120 (1992).
- Osheroff and Cross [1977] D. D. Osheroff and M. C. Cross, Phys. Rev. Lett. 38, 905 (1977).
- Cahn and Hilliard [1958] J. W. Cahn and J. E. Hilliard, J. Chem. Phys. 28, 258 (1958).
- Kleinberg et al. [1974] R. L. Kleinberg, D. N. Paulson, R. A. Webb, and J. C. Wheatley, J. Low Temp. Phys. 17, 521 (1974).
- Hakonen et al. [1985] P. J. Hakonen, M. Krusius, M. M. Salomaa, and J. T. Simola, Phys. Rev. Lett. 54, 245 (1985).
- Buchanan et al. [1986] D. S. Buchanan, G. W. Swift, and J. C. Wheatley, Phys. Rev. Lett. 57, 341 (1986).
- Fukuyama et al. [1987] H. Fukuyama, H. Ishimoto, T. Tazaki, and S. Ogawa, Phys. Rev. B 36, 8921 (1987).
- Swift and Buchanan [1987] G. W. Swift and D. S. Buchanan, Jpn. J. Appl. Phys. 26, 1828 (1987).
- Boyd and Swift [1990] S. T. P. Boyd and G. W. Swift, Phys. Rev. Lett. 64, 894 (1990).
- Bäuerle et al. [1996] C. Bäuerle, Yu. M. Bunkov, S. N. Fisher, H. Godfrin, and G. R. Pickett, Nature 382, 332 (1996).
- Ruutu et al. [1996] V. M. H. Ruutu, V. B. Eltsov, A. J. Gill, T. W. B. Kibble, M. Krusius, Y. G. Makhlin, B. Plaçais, G. E. Volovik, and W. Xu, Nature 382, 334 (1996).
- Yu. M. Bunkov, and O. D. Timofeevskaya [1998] Yu. M. Bunkov, and O. D. Timofeevskaya, Phys. Rev. Lett. 80, 4927 (1998).
- Bartkowiak et al. [2000] M. Bartkowiak, S. N. Fisher, A. M. Guénault, R. P. Haley, G. R. Pickett, G. N. Plenderleith, and P. Skyba, Phys. Rev. Lett. 85, 4321 (2000).
- [20] See supplemental material at [url will be inserted by publisher] for supplementary notes and figures.
- Leggett [1985] A. J. Leggett, Phys. Rev. Lett. 54, 246 (1985).
- Yip and Leggett [1986] S. Yip and A. J. Leggett, Phys. Rev. Lett. 57, 345 (1986).
- Leggett and Yip [1990] A. J. Leggett and S. K. Yip, in Helium Three, Modern Problems in Condensed Matter Sciences No. 26, edited by L. P. Pitaevskii and W. P. Halperin (Elsevier, Amsterdam, 1990) 3rd ed., Chapt. 8, pp. 523–707.
- Leggett [2002] A. J. Leggett, J. Low Temp. Phys. 126, 775 (2002).
- Kibble [1976] T. W. B. Kibble, J. Phys. A: Math. Gen. 9, 1387 (1976).
- Zurek [1985] W. H. Zurek, Nature 317, 505 (1985).
- Ki Hong [1988] D. Ki Hong, J. Low Temp. Phys. 71, 483 (1988).
- Tye and Wohns [2011] S.-H. H. Tye and D. Wohns, Phys. Rev. B 84, 184518 (2011).
- Volovik [2002] G. E. Volovik, The Universe in a Helium Droplet (Oxford University Press, 2002).
- Rusby et al. [2007] R. Rusby, B. Fellmuth, J. Engert, W. Fogle, E. Adams, L. Pitre, and M. Durieux, J. Low Temp. Phys. 149, 156 (2007).
- Schiffer and Osheroff [1995] P. Schiffer and D. D. Osheroff, Rev. Mod. Phys. 67, 491 (1995).
- Yury Bunkov [2013] Yury Bunkov, J. Phys.: Condens. Matter 25, 404205 (2013).
- Barton and Moore [1975] G. Barton and M. A. Moore, J. Low Temp. Phys. 21, 489 (1975).
- Marchenko [1987] V. I. Marchenko, Sov. Phys. JETP 66, 79 (1987).
- Levitin et al. [2019] L. V. Levitin, B. Yager, L. Sumner, B. Cowan, A. J. Casey, J. Saunders, N. Zhelev, R. G. Bennett, and J. M. Parpia, Phys. Rev. Lett. 122, 085301 (2019).
- Zhelev et al. [2017] N. Zhelev, T. S. Abhilash, E. N. Smith, R. G. Bennett, X. Rojas, L. Levitin, J. Saunders, and J. M. Parpia, Nat. Commun. 8, 15963 (2017).
- Lotnyk et al. [2020] D. Lotnyk, A. Eyal, N. Zhelev, T. S. Abhilash, E. N. Smith, M. Terilli, J. Wilson, E. Mueller, D. Einzel, J. Saunders, and J. M. Parpia, Nat. Commun. 11, 4853 (2020).
- Blaauwgeers et al. [2007] R. Blaauwgeers, M. Blazkova, M. Človečko, V. B. Eltsov, R. de Graaf, J. Hosio, M. Krusius, D. Schmoranzer, W. Schoepe, L. Skrbek, P. Skyba, R. E. Solntsev, and D. E. Zmeev, J. Low Temp. Phys. 146, 537 (2007).
- Levitin et al. [2013a] L. V. Levitin, R. G. Bennett, A. Casey, B. Cowan, J. Saunders, D. Drung, T. Schurig, and J. M. Parpia, Science 340, 841 (2013a).
- Shook et al. [2020] A. J. Shook, V. Vadakkumbatt, P. Senarath Yapa, C. Doolin, R. Boyack, P. H. Kim, G. G. Popowich, F. Souris, H. Christani, J. Maciejko, and J. P. Davis, Phys. Rev. Lett. 124, 015301 (2020).
- Schienbein and Marx [2018] P. Schienbein and D. Marx, Phys. Rev. E 98, 022104 (2018).
- Tsutsumi et al. [2011] Y. Tsutsumi, M. Ichioka, and K. Machida, Phys. Rev. B 83, 094510 (2011).
- Heikkinen et al. [2021] P. J. Heikkinen, A. Casey, L. V. Levitin, X. Rojas, A. Vorontsov, P. Sharma, N. Zhelev, J. M. Parpia, and J. Saunders, Nat. Commun. 12, 1574 (2021).
- Salomaa and Volovik [1988] M. M. Salomaa and G. E. Volovik, Phys. Rev. B 37, 9298 (1988).
- [45] I. Yang, S.-H. H. Tye, and B. Shlaer, arXiv:1110.2045 .
- Wiman and Sauls [2015] J. J. Wiman and J. A. Sauls, Phys. Rev. B 92, 144515 (2015).
- Tholen and Parpia [1991] S. M. Tholen and J. M. Parpia, Phys. Rev. Lett. 67, 334 (1991).
- Tholen and Parpia [1993] S. M. Tholen and J. M. Parpia, Phys. Rev. B 47, 319 (1993).
- Paulson et al. [1974] D. N. Paulson, H. Kojima, and J. C. Wheatley, Phys. Rev. Lett. 32, 1098 (1974).
- Wiman and Sauls [2014] J. J. Wiman and J. A. Sauls, J. Low Temp. Phys. 175, 17 (2014).
- Zhelev et al. [2018] N. Zhelev, T. S. Abhilash, R. G. Bennett, E. N. Smith, B. Ilic, J. M. Parpia, L. V. Levitin, X. Rojas, A. Casey, and J. Saunders, Rev. Sci. Instrum. 89, 073902 (2018).
- Levitin et al. [2013b] L. V. Levitin, R. G. Bennett, E. V. Surovtsev, J. M. Parpia, B. Cowan, A. J. Casey, and J. Saunders, Phys. Rev. Lett. 111, 235304 (2013b).
- Pollanen et al. [2012] J. Pollanen, J. I. A. Li, C. A. Collett, Gannon, W. P. W. J., Halperin, and J. A. Sauls, Nat. Phys. 8, 317 (2012).
- Dmitriev et al. [2015] V. V. Dmitriev, L. A. Melnikovsky, A. A. Senin, A. A. Soldatov, and A. N. Yudin, JETP Lett. 101, 808 (2015).
- Zhelev et al. [2016] N. Zhelev, M. Reichl, T. S. Abhilash, E. N. Smith, K. X. Nguyen, E. J. Mueller, and J. M. Parpia, Nat. Commun. 7, 12975 (2016).
- Katz and Perelstein [2014] A. Katz and M. Perelstein, J. High Energy Phys. 2014, 108.
- Guth [2007] A. H. Guth, J. Phys. A: Math. Theor. 40, 6811 (2007).
- [58] P. Amaro-Seoane, H. Audley, S. Babak, J. Baker, E. Barausse, P. Bender, E. Berti, P. Binetruy, M. Born, D. Bortoluzzi, J. Camp, C. Caprini, V. Cardoso, M. Colpi, J. Conklin, N. Cornish, C. Cutler, K. Danzmann, R. Dolesi, L. Ferraioli, V. Ferroni, E. Fitzsimons, J. Gair, L. G. Bote, D. Giardini, F. Gibert, C. Grimani, H. Halloin, G. Heinzel, T. Hertog, M. Hewitson, K. Holley-Bockelmann, D. Hollington, M. Hueller, H. Inchauspe, P. Jetzer, N. Karnesis, C. Killow, A. Klein, B. Klipstein, N. Korsakova, S. L. Larson, J. Livas, I. Lloro, N. Man, D. Mance, J. Martino, I. Mateos, K. McKenzie, S. T. McWilliams, C. Miller, G. Mueller, G. Nardini, G. Nelemans, M. Nofrarias, A. Petiteau, P. Pivato, E. Plagnol, E. Porter, J. Reiche, D. Robertson, N. Robertson, E. Rossi, G. Russano, B. Schutz, A. Sesana, D. Shoemaker, J. Slutsky, C. F. Sopuerta, T. Sumner, N. Tamanini, I. Thorpe, M. Troebs, M. Vallisneri, A. Vecchio, D. Vetrugno, S. Vitale, M. Volonteri, G. Wanner, H. Ward, P. Wass, W. Weber, J. Ziemer, and P. Zweifel, arXiv:1702.00786 .
- Hindmarsh and Hijazi [2019] M. Hindmarsh and M. Hijazi, J. Cosmol. Astropart. Phys. 2019 (12), 062–062.
- Caprini et al. [2020] C. Caprini, M. Chala, G. C. Dorsch, M. Hindmarsh, S. J. Huber, T. Konstandin, J. Kozaczuk, G. Nardini, J. M. No, K. Rummukainen, P. Schwaller, G. Servant, A. Tranberg, and D. J. Weir, J. Cosmol. Astropart. Phys. 2020 (03), 024.
Supplementary Note 1. Comparison to earlier Experiments
Previous experiments observing supercooling [1, 2, 3, 4, 5] were performed in a variety of magnetic fields (that favors the A phase over the B phase and extends supercooling). The experiments in Ref [5] that display exceptionally strong supercooling were carried out with smooth surfaces with well characterized roughness and isolated from the rest of the fluid by means of a magnetic “valve” that ensured that B phase external to the sample under study could not initiate an AB transition. In comparison, the other experiments cited were performed in containers with rougher surfaces, and in some cases with sinter or powders in contact with the 3He sample under study. Thus they are not immediately applicable to our results. With the exception of the experiments in [1], none of the experiments focused on the polycritical point. No experiment changed the pressure after traversing in the course of a cool down.
Supplementary Note 2. Experimental details
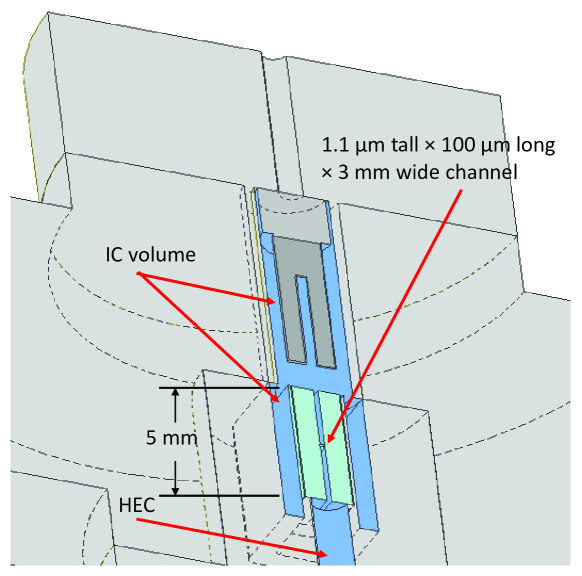
The measurement of the AB transition occurs in a small volume isolated chamber (IC) connected to a chamber containing a heat exchanger (HEC) through a 1.1 m high, 3 mm wide, and 100 m long channel with 200 m tall 3 mm wide 2.45 mm long “lead-in” sections at either end. The 1.1 m height section should be filled with the A phase at all temperatures and pressures explored in this paper. The arrangement is illustrated in Fig. 1 (b) of the main paper. The channel (Supplementary Figure S2) was nanofabricated in 1 mm thick silicon, capped with 1 mm thick sodium doped glass, anodically bonded to the silicon[8] and then glued into a coin silver carrier. In the mK temperature regime, the IC was cooled through the A-phase-filled channel with a thermal time constant 1500 s at the superfluid transition temperature, , limiting the cooling rate achievable in the experiment[9].
The volume of the IC is estimated to be 0.14 0.02 cm3, and the area of all wetted surfaces in the IC was estimated to be 14.5 0.5 cm2. In comparison, the HEC had a volume of 0.72 0.1 cm3 and a surface area of 3.5 0.5 m2 due to the heat exchanger.
Supplementary Note 3. Pressure difference across channel, power dissipated, heat load and thermal gradients while ramping pressure.
We estimate the pressure difference across the channel that must accompany the pressurization or depressurization of the 3He in the system. We start with the equation that links pressure, impedance, viscosity and flow:
| (S1) |
where [Pa] is the pressure across the channel, [m-3] is the impedance, [kg m-1 s-1] is the viscosity of the 3He at , and [m3s-1] is the flow rate through the channel accompanying a change in pressure of the system. The impedance for a rectangular channel, = 12 is defined by its length = 100 m, width = 3 mm, and height = 1.1 m, resulting in = 31017 m-3. The viscosity of the system is largest at and is estimated to be 0.02 kg m-1 s-1 [10] in bulk 3He. In the channel, owing to confinement, the normal fluid is subject to slip and the effective viscosity is given by , with the slip factor, dependent on the Knudsen number (). , where is the viscous mean free path. A simplified upper bound for the correction factor is given by . With the mean free path of order 1 m at , 1. Thus is 1/3, reducing the effective viscosity to 0.007 kg m-1 s-1 at . Below , the normal viscosity decreases by a further factor of 3[10, 11], and in the superfluid state the effective viscosity of the normal fluid just below , (0.99) 0.002 kg m-1 s-1. Our maximum pressurization or depressurization rate was 1.3 bar/day.
To estimate we require the molar volume = 27.3610-6 m3 mole-1 and d/d = -0.185 10-6 m3 mole-1 bar -1 [6]. The flow rate can be computed by multiplying the molar volume by the molar flow rate,
| (S2) |
and can be calculated from the equation
| (S3) |
The volume of the isolated chamber, = 0.1410-6 m3; we estimate = 1.410-14 m3 s-1.
Thus, the expected magnitude of the pressure drop across the channel at the maximum pressurization or depressurization rate is 8 Pa or 0.1 mbar, below the superfluid transition. The impedance of the fill line (filled with normal fluid, with a 100 m diameter and thus not subject to slip) below mixing chamber temperatures is of order 1017 m-3. The volume rate of flow is estimated to be of order 110-13 m3 s-1 (due to to combined volumes of HEC and IC). Since the viscosity varies as , the pressure drop would mainly occur at the low temperature end of the fill line. We estimate a pressure drop of no more than 10 times that across the channel in the fill line. Above that temperature, the lower viscosity of the 3He implies negligible pressure differences due to pressurization rates. The hydrostatic pressure difference due to the density differences in the liquid (at cryogenic temperatures) and the gas at room temperature is of order 15 mbar, but this is present whether the cell is operated at constant pressure or while being pressurized. In summary, the pressure in the IC while pressurizing or depressurizing is not significantly different from that at the room temperature controller.
We can also estimate the power dissipated in the channel on account of viscous heating due to flow while changing the pressure when the experiment is below . The power can be expressed as the product of the pressure difference across the channel, (Supplementary Eq. 1) multiplied by the volume flow rate, (Supplementary Eq. 2) (and thus varies as the square of the flow rate). The power, is found to be 8 Pa 1.410-14 m3 s-1 10-13 W. This power dissipation would lead to a thermal gradient = , where is the thermal resistance of the channel = 1.5106 K/W[9]. Thus we estimate at our maximum pressurization/depressurization rate, a thermal offset of order 10-13 W 1.5106 K/W = 0.15 K would appear across the channel. This temperature difference is too small to measure.
The temperature rise due to the addition of 3He thermalized at the mixing chamber temperature into the HEC on account of the pressurization can also be estimated. The volume of the HEC and IC combined is estimated to be 0.86 10-6 m3[9]; we write the total flow into the cell as = 8.610-14 m3 s-1, and taking into account the molar volume of the 3He at 22 bar as = 27.3610-6 m3/mole, the inflow of 3He () is estimated to be 3.1410-9 moles/s.
The molar specific heat in the normal state is nR[6], with R = 8.314 J/mole K, the temperature in K, and 4. In the superfluid, we assume that the specific heat follows a behavior after a discontinuous increase by a factor of 3 at the superfluid transition. We further assume that the heat load is calculated at a temperature of 0.95, close to the lowest temperature for measurements discussed here at the polycritical point. The heat load due to the influx of 3He at mixing chamber temperature ( = 10 mK) to the superfluid transition temperature ( = 2.273 mK) and then from to 0.95 is given by
| (S4) |
after accounting for the 3 heat capacity increase at the superfluid transition. This yields a heat load of order 5 pW. The heat exchanger has a surface area = 3.2 m2, and using the standard value of Kapitza boundary resistance, = 250 (with in K, in [12], we find = 31 103 K/W. We estimate the temperature rise at the heat exchanger due to inflow of 3He to be of order 0.15 K, again too small to measure. The total additional temperature increase on account of the pressure ramp is 0.5 K. Thus the coordinates while ramping the pressure and temperature are not significantly altered from what would be observed while cooling at the same rate at constant pressure. This is consistent with our observation that on stopping the pressure ramp (under conditions of constant cooling rate), no transient cooling was observed implying that the additional heat lead on account of the pressure ramp is negligible.
Supplementary Note 4. Relationship between , and the phase diagram of 3He.
| (mbar) | (mK) | (mK) | (mbar) | (mK) | (mK) |
|---|---|---|---|---|---|
| 52.7 | - | 0.90944 | 25 | 1.78732 | 1.76047 |
| 52 | 0.94925 | 0.92816 | 24 | 1.81646 | 1.78881 |
| 51 | 0.98446 | 0.96438 | 23 | 1.84551 | 1.81704 |
| 50 | 1.01862 | 0.99938 | 22 | 1.87446 | 1.84518 |
| 49 | 1.05205 | 1.03349 | 21 | 1.90332 | 1.87322 |
| 48 | 1.08492 | 1.06691 | 20.2 | - | 1.89558 |
| 47 | 1.11738 | 1.09978 | 20 | 1.93209 | 1.90116 |
| 46 | 1.14949 | 1.13219 | 19 | 1.96078 | 1.92901 |
| 45 | 1.18134 | 1.16421 | 18 | 1.98938 | 1.95677 |
| 44 | 1.21295 | 1.1959 | 17 | 2.01789 | 1.98445 |
| 43 | 1.24436 | 1.2273 | 16 | 2.04633 | 2.01204 |
| 42 | 1.2756 | 1.25843 | 15 | 2.07468 | 2.03956 |
| 41 | 1.30668 | 1.28932 | 14 | 2.10295 | 2.06699 |
| 40 | 1.33761 | 1.31999 | 13 | 2.13115 | 2.09435 |
| 39 | 1.3684 | 1.35045 | 12 | 2.15927 | 2.12163 |
| 38 | 1.39907 | 1.38073 | 11 | 2.18732 | 2.14884 |
| 37 | 1.4296 | 1.41082 | 10 | 2.2153 | 2.17598 |
| 36 | 1.46002 | 1.44074 | 9 | 2.2432 | 2.20305 |
| 35 | 1.49032 | 1.4705 | 8 | 2.27104 | 2.23006 |
| 34 | 1.5205 | 1.5001 | 7 | 2.29881 | 2.257 |
| 33 | 1.55057 | 1.52955 | 6 | 2.32651 | 2.28388 |
| 32 | 1.58053 | 1.55886 | 5 | 2.35415 | 2.3107 |
| 31 | 1.61039 | 1.58804 | 4 | 2.38173 | 2.33746 |
| 30 | 1.64013 | 1.61708 | 3 | 2.40924 | 2.36416 |
| 29 | 1.66977 | 1.64599 | 2 | 2.4367 | 2.3908 |
| 28 | 1.69931 | 1.67479 | 1 | 2.46409 | 2.4174 |
| 27 | 1.72875 | 1.70346 | 0 | 2.49143 | 2.44393 |
| 26 | 1.75808 | 1.73202 |
Temperatures reported in this work were referenced to a 3He melting curve thermometer. The most recent temperature scale in the mK regime utilizes the melting curve[7], and is designated as . Unfortunately, does not provide a map onto the phase diagram of 3He as measured by Greywall[6]. Fortunately since both the measurements reference pressure relative to the pressure of the superfluid transition at the melting curve , the temperature scale provided by Greywall, and are readily mapped onto one another especially in the regime between 2.5 mK and the 0.9 mK. Below we describe the procedure we used to generate the conversion.
We generate a table of and , from the polynomials provided in [6, 7], with in mK and in bar throughout.
We then plot and fit the two scales over the temperature range between 0.9 and 2.5 mK. Over this limited regime, the two scales can be well fitted by a third order polynomial, with systematic deviations of less than 1 K. the fit we obtained is
| (S5) |
and was used to generate the phase diagrams shown in this Letter. Meanwhile, the relation between and is given as , with , , , , , , and . The values of and are listed in the accompanying Tables 2, 3. In addition, we also provide here and as a polynomial function of pressure, , with , , , , , and ; , with , , , , , and .
| (bar) | (mK) | (mK) |
|---|---|---|
| 1.932 | 1.901 | |
| 34 | 1.941 | 1.910 |
| 33 | 1.969 | 1.937 |
| 32 | 1.998 | 1.965 |
| 31 | 2.027 | 1.993 |
| 30 | 2.056 | 2.021 |
| 29 | 2.083 | 2.047 |
| 28 | 2.111 | 2.075 |
| 27 | 2.137 | 2.100 |
| 26 | 2.164 | 2.126 |
| 25 | 2.191 | 2.152 |
| 24 | 2.217 | 2.177 |
| 23 | 2.242 | 2.202 |
| 22 | 2.262 | 2.221 |
| 21.22 | 2.273 | 2.232 |
| (bar) | (mK) | (mK) |
|---|---|---|
| 34.338 | 2.491 | 2.444 |
| 34 | 2.486 | 2.439 |
| 33 | 2.474 | 2.427 |
| 32 | 2.463 | 2.417 |
| 31 | 2.451 | 2.405 |
| 30 | 2.438 | 2.392 |
| 29 | 2.425 | 2.380 |
| 28 | 2.411 | 2.366 |
| 27 | 2.395 | 2.350 |
| 26 | 2.378 | 2.334 |
| 25 | 2.360 | 2.316 |
| 24 | 2.339 | 2.296 |
| 23 | 2.317 | 2.274 |
| 22 | 2.293 | 2.251 |
| 21 | 2.267 | 2.226 |
| 20 | 2.239 | 2.199 |
| 19 | 2.209 | 2.170 |
| 18 | 2.177 | 2.139 |
| 17 | 2.143 | 2.106 |
| 16 | 2.106 | 2.070 |
| 15 | 2.067 | 2.032 |
| 14 | 2.026 | 1.992 |
| 13 | 1.981 | 1.949 |
| 12 | 1.934 | 1.903 |
| 11 | 1.883 | 1.854 |
| 10 | 1.828 | 1.800 |
| 9 | 1.769 | 1.743 |
| 8 | 1.705 | 1.681 |
| 7 | 1.636 | 1.613 |
| 6 | 1.560 | 1.539 |
| 5 | 1.478 | 1.458 |
| 4 | 1.388 | 1.370 |
| 3 | 1.290 | 1.272 |
| 2 | 1.181 | 1.164 |
| 1 | 1.061 | 1.043 |
| 0 | 0.929 | 0.908 |
Supplementary Note 5. Constant pressure cooling runs at the lowest pressures where was observed.
In Supplementary Figure 3 we show the traces of vs at 5 closely spaced pressures all taken while cooling slowly at constant pressure. At the lowest pressure 20.88 bar, no AB transition is seen. At 20.89 bar, the transition is seen well below .
In supplementary Figure 4, we show the distributions of the fast cooled transitions shown in Figure 3 b,c of the main paper along with those seen at an intermediate pressure. The distribution broadens significantly at the lowest pressure.
We show the complete set of time at the 5 lowest pressures studied in Supplementary Figure 5. The AB transition under fast and slow cooling can readily be seen in the two highest pressure pulsed heating experiments and can be seen to be more widely distributed at 21.0 bar (see also Fig 3 b,c in the main paper). At 20.95 bar and 20.9 bar AB transitions can be seen under slow cooling but are not immediately evident under fast cooling.
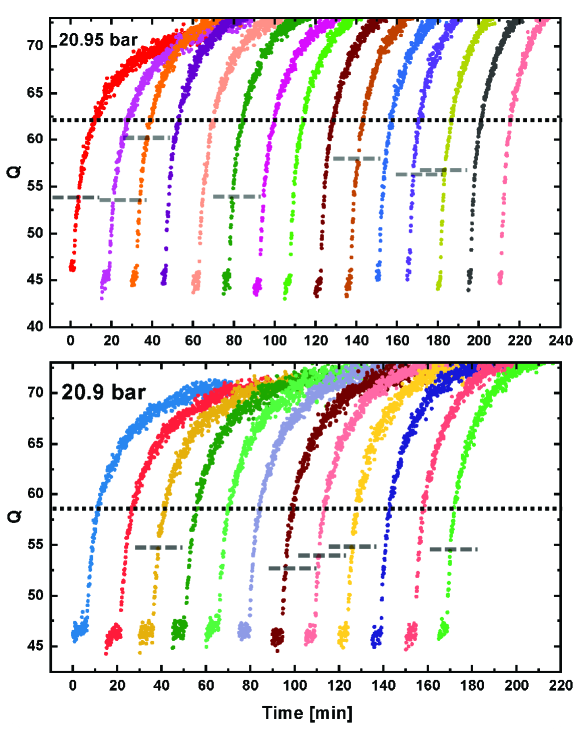
In analogy with Figures 3 b, c in Supplementary Figure 6 we show time shifted recoveries following pulses at the two lowest pressures. In some recoveries AB transitions can be seen and are marked with dashed lines. Other pulses appear to carry the IC directly to the B phase. The dotted line marks the location of the slow cooled transition.
In Supplementary Figure 7 we show the supercooled transitions seen in the heat exchange chamber (HEC). They show less supercooling than the IC presumably due to the sinter. Also shown are the data obtained by Kleinberg [1] (see also Supplementary Figure 1).
Supplementary Note 6. Analogy of the termination of the line of constant pressure cooled AB transitions with a Classical Critical Point.
In Figures 3, 4 and 5 of the main paper (and in the text), we see that the line of constant pressure supercooled AB transitions terminates away from in analogy with the critical point in classical gas-liquid transitions. However, there are significant differences. Unlike the classical liquid-vapor transition (which is first order but not symmetry breaking), the AB transition has a very small volume change and breaks symmetry. While cooling a classical system at constant pressure, supercooling involves conversion from the parent phase below the coexistence line (where the two phases have equal free energies). This supercooled region should be bounded by the coexistence line and a spinodal line defined by the divergence of the isothermal compressibility, or where an extremum point along an isotherm is attained[13]. The stability of the A phase at temperatures below the line of spinodal-like transitions is puzzling; spinodals designate where the metastable state becomes absolutely unstable. Thus we conclude that the (=Const.) line cannot be a spinodal. However, the stability of the A phase below the (=Const.) line represents a puzzle, because the free energy difference between the two phases is small. It may well be that the tensor and complex nature of the order parameter introduces an additional barrier or rigidity against the conversion from AB.
It is possible that the extension of the supercooled A phase beyond the two-phase critical point may be related to echoes of the liquid-vapor coexistence line beyond the critical point (the “Widom Line”[14, 15] connecting fluid heat capacity maxima), but this remains speculative without detailed thermodynamic data. It seems much more likely that the transformation of the complex order parameter from the A to the B phase is the source of the path dependence and the stability of the A phase away from the line of constant pressure cooled AB transitions.
Supplementary Note 7. Initiation of the A-Phase below the PCP.
The initiation of the A phase after crossing below the polycritical point (despite the B phase’s stability in this ) is worth discussion. A small magnetic field would insert an infinitesimal width of A phase between the normal state and the B phase [1, 16]. However, we see no BA transition on warming assuring us that the magnetic field is indeed negligible. Our constant-pressure cooled data below the polycritical point bears resemblance to the data in 0.5 mT of Kleinberg [1] (Supplementary Figure 7). Another mechanism to nucleate the A phase in the IC below 22.22 bar references Cahn-Hilliard [17]. Since the channel that cools the 3He in the IC is in the A phase, the surface-energy cost to grow a seed of the B phase in the IC just below from the A phase filled channel exceeds the volume free-energy cost of the A over the B phase. Thus it is likely that the channel “seeds” the IC with the A phase. Once the A phase occupies the IC, B phase nucleation requires overcoming a barrier and leads to supercooling. We note that in Supplementary Figure 7, the A phase is seen to nucleate in the HEC and also in the experiments carried out in the presence of powdered CMN refrigerant [1]. The pores in the sintered powder and refrigerant also promote the A phase in the HEC volume while cooling.
Supplementary Note 8. Lobster Pots.
Yip and Leggett introduced the concept of a “lobster pot” (See Fig. 1 in [18]), a surface cavity connected to the bulk through an orifice. in the cavity is suppressed relative to the bulk, and in the orifice is further reduced. In this model, the cavity transitions from the normal state to the equilibrium phase at the reduced cavity , encoding the memory of the coordinates of . When the orifice connecting the “lobster pot” to the bulk undergoes , the memory stored in the lobster-pot is imprinted on the bulk. Thus, if the fluid in the IC is cooled through at a high pressure, a “lobster-pot”is filled with A phase. When cooled through near or below the polycritical pressure, the cavity fills with B phase, thus retaining memory of the pressure when it was cooled through . A high pressure cooled experiment should supercool further because an A-phase filled cavity cannot provide a B phase “seed” to nucleate AB. However, this model requires a very specific distribution of cavities and orifices. For example, to achieve a cavity reduction of 1% requires cavity radii 1 m[19, 20], and similar sized pores. Such pore-cavity combinations would favor the A phase even at low pressure, rendering the model problematic.
References
- Kleinberg et al. [1974] R. L. Kleinberg, D. N. Paulson, R. A. Webb, and J. C. Wheatley, J. Low Temp. Phys. 17, 521 (1974).
- Hakonen et al. [1985] P. J. Hakonen, M. Krusius, M. M. Salomaa, and J. T. Simola, Phys. Rev. Lett. 54, 245 (1985).
- Fukuyama et al. [1987] H. Fukuyama, H. Ishimoto, T. Tazaki, and S. Ogawa, Phys. Rev. B 36, 8921 (1987).
- Swift and Buchanan [1987] G. W. Swift and D. S. Buchanan, Jpn. J. Appl. Phys. 26, 1828 (1987).
- Schiffer et al. [1992] P. Schiffer, M. T. O’Keefe, M. D. Hildreth, H. Fukuyama, and D. D. Osheroff, Phys. Rev. Lett. 69, 120 (1992).
- Greywall [1986] D. Greywall, Phys. Rev. B 33, 7520 (1986).
- Rusby et al. [2007] R. Rusby, B. Fellmuth, J. Engert, W. Fogle, E. Adams, L. Pitre, and M. Durieux, J. Low Temp. Phys. 149, 156 (2007).
- Zhelev et al. [2018] N. Zhelev, T. S. Abhilash, R. G. Bennett, E. N. Smith, B. Ilic, J. M. Parpia, L. V. Levitin, X. Rojas, A. Casey, and J. Saunders, Rev. Sci. Instrum. 89, 073902 (2018).
- Lotnyk et al. [2020] D. Lotnyk, A. Eyal, N. Zhelev, T. S. Abhilash, E. N. Smith, M. Terilli, J. Wilson, E. Mueller, D. Einzel, J. Saunders, and J. M. Parpia, Nat. Commun. 11, 4853 (2020).
- Parpia [1979] J. M. Parpia, The Viscosity of Normal and Superfluid Helium Three, Ph.D. thesis, Cornell University (1979).
- Parpia and Reppy [1979] J. M. Parpia and J. D. Reppy, Phys. Rev. Lett. 43, 1332 (1979).
- Andres and Sprenger [1976] K. Andres and W. Sprenger, Proceedings of LT14, Matti Krusius and Matti Vuorio, eds., 1, 123 (1976).
- Debenedetti [1996] P. G. Debenedetti, Metastable liquids concepts and principles (Princeton University Press, Princeton, N.J., 1996) Chap. 2,3, pp. 63–233.
- Xu et al. [2005] L. Xu, P. Kumar, S. V. Buldyrev, S.-H. Chen, P. H. Poole, F. Sciortino, and H. E. Stanley, Proc. Natl. Acad. Sci. U.S.A. 102, 16558 (2005).
- Schienbein and Marx [2018] P. Schienbein and D. Marx, Phys. Rev. E 98, 022104 (2018).
- Paulson et al. [1974] D. N. Paulson, H. Kojima, and J. C. Wheatley, Phys. Rev. Lett. 32, 1098 (1974).
- Cahn and Hilliard [1958] J. W. Cahn and J. E. Hilliard, J. Chem. Phys. 28, 258 (1958).
- Leggett and Yip [1990] A. J. Leggett and S. K. Yip, in Helium Three, Modern Problems in Condensed Matter Sciences No. 26, edited by L. P. Pitaevskii and W. P. Halperin (Elsevier, Amsterdam, 1990) 3rd ed., Chapt. 8, pp. 523–707.
- Kjäldman et al. [1978] L. H. Kjäldman, J. Kurkijärvi, and D. Rainer, J. Low Temp. Phys. 33, 577 (1978).
- Kotsubo et al. [1987] V. Kotsubo, K. D. Hahn, and J. M. Parpia, Phys. Rev. Lett. 58, 804 (1987).