Unveiling Real-Life Effects of Online Photo Sharing
Abstract
Social networks give free access to their services in exchange for the right to exploit their users’ data. Data sharing is done in an initial context which is chosen by the users. However, data are used by social networks and third parties in different contexts which are often not transparent. In order to unveil such usages, we propose an approach which focuses on the effects of data sharing in impactful real-life situations. Focus is put on visual content because of its strong influence in shaping online user profiles. The approach relies on three components: (1) a set of visual objects with associated situation impact ratings obtained by crowdsourcing, (2) a corresponding set of object detectors for mining users’ photos and (3) a ground truth dataset made of 500 visual user profiles which are manually rated per situation. These components are combined in , a method which learns to rate visual user profiles in each situation. exploits a new image descriptor which aggregates object ratings and object detections at user level and an attention mechanism which boosts highly-rated objects to prevent them from being overwhelmed by low-rated ones. Performance is evaluated per situation by measuring the correlation between the automatic ranking of profile ratings and a manual ground truth. Results indicate that is effective since a strong correlation of the two rankings is obtained. A practical implementation of the approach in a mobile app which raises user awareness about shared data usage is also discussed.
1 Introduction
The ubiquitous use of online social networks (OSNs) shows that their services are appealing to users. Most OSNs implement a business model in which access is free in exchange for user data monetization [11]. Intrusiveness is likely to grow with the wide usage of AI techniques to infer actionable information from users’ data. Automatic inferences happen in the back-end of OSNs or of associated third parties and are not transparent for users. Data can be exploited in contexts unforeseen when sharing them initially. The main objective of our work is to improve user awareness about data processing through feedback contextualization. To do this, we introduce a plausible decision-making system which combines machine learning and domain knowledge.
User awareness is increased by linking the sharing process to impactful situations such as searching for a job, an accommodation, or a bank credit. Photos are in focus because they constitute a large part of shared data and contribute strongly to shaping user profiles [2]. The main technical contribution is a method that rates visual user profiles and individual photos in a given situation by exploiting situation models, visual detectors and a dedicated photographic profiles dataset. The proposed method, named from LEarning to Rate Visual User Profiles, learns a ranking of user profiles which attemps to reproduce human profiles ranking. exploits a new descriptor which combines object impact ratings and object detections in a compact form. The contributions of objects with high ratings are boosted in order to mimic the way humans assess photographic content. We compare manual and automatic rankings of user profile ratings and obtain a positive correlation between them. This result holds promise to help users better understand the effects of online data sharing and, ultimately, to better control their data.
2 Related work
The main promise of OSNs is to connect people and allow them to exchange information within affinity-based networks. Participation in OSNs can have positive or negative effects, depending on the way the shared information is interpreted in different contexts [4]. This interpretation process is influenced by human and/or technical biases. Human biases fall in two main categories that are often studied in relation to demographic factors such as gender or ethnicity [50]. Implicit biases [18] might influence one’s decisions without that person being conscious of them. Explicit biases [9] are assumed and used intentionally. Technical imperfections lead to the occurrence of algorithmic biases. The inherently partial mapping of complex real-life processes into computer systems [16] is a first source of bias. For instance, the introduction of deep architectures brought important progress in classification [8, 26], but accuracy is still affected by internal representation limitations [32]. A second bias is due to the variable accuracy of predictions due to the inherent difficulty of visual objects [7] and/or the availability of skewed [47] and imbalanced data [21]. While affected by biases, approaches like ours are needed to make AI-powered decision-making more transparent to users. Notably, impact and profile ratings are potentially biased toward the opinions of the persons involved in the experiments. Object detection is biased because the detection dataset is incomplete and detectors are imperfect.
Below, we illustrate contexts in which users’ lives are influenced by their online activity. The authors of [1] and [31] create fictitious Facebook profiles in which they vary only one type of personal data to assess its influence during a job search. No significant discrimination due to family structure and sexual orientation is found in [1], while a negative effect is elicited for radical religious stance. The user’s supposed origin has a significant effect on the number of replies a person gets to a job application [31]. The chances to obtain short-term accommodation online are influenced by the assumed racial origin [14]. Rather accurate creditworthiness is automatically obtained in [12] based on one’s interests and the analysis of the list of friends. These studies focus on sensitive signals and contributed to a degree of public awareness about their effects. Our objective is to include weaker signals for which there is little or no awareness. Such signals seem innocuous in the initial sharing context, but their interpretation might change in other situations, and users should be informed about such changes.
The prediction of user traits from shared data received much attention in the last decade. The threats induced by geolocation mining were studied in [15]. In [24], Facebook likes were exploited to predict sexual orientation, political opinions, race and personality traits. A hierarchical organization of privacy aspects and methods that predict privacy traits were proposed in [34]. The authors of [13] implemented an instructional awareness system which provides feedback about content whose publishing might be harmful to the users. These works explore interesting aspects of privacy but do not provide a systematic way to map predictions to real-life situations and do not focus on visual data.
The understanding of the effects of visual content sharing was pioneered by [2], with the introduction of disclosure dimensions such as security, identity and convenience. The study concludes that user feedback should provide warnings to prevent mistakes, inform about the effects of data aggregation and estimate the appropriate audience. The authors of [54] used hand-crafted visual features to predict the privacy status of an image with encouraging results but far from practical usability. Transfer learning from generalist deep models as a way to improve privacy prediction was proposed in [43]. An important step forward was made in [33], with the creation of a taxonomy of privacy-related attributes and of a dataset dedicated to privacy prediction. Interestingly, the resulting model provided more consistent predictions compared to users’ judgments, indicating that users might fail to follow their own privacy-related preferences. A multimodal prediction model which mixes visual content and tags is introduced in [48]. Performance is improved by exploiting predictions from neighboring photos from the user’s stream. These approaches are relevant insofar they focus on improving users’ control over shared data by predicting the privacy for individual images. Our approach is different because feedback is proposed both at user profile and image levels. Equally important, it is linked to situations to better model real usage of shared data.
Image analysis is central in our study because it extracts actionable information from shared photos. A choice between deep learning-based image classification and detection is needed. Classification [20, 25] provides global labels for each image, while detection [28, 37] delineates image regions which contain specific objects. Detection is better suited in our work since useful information is most often conveyed by localizable objects, which might be missed in classification. Object detection witnessed the proposal of increasingly accurate methods [19, 37, 38, 39]. However, the most accurate models are often too complex for edge computing. This is important insofar one objective here is to inform users about the potential effects of sharing before it is done on their smartphones. More compact models which search for a trade-off between performance and complexity were proposed in [17, 36, 41]. Consequently, we compare models which are usable on smartphones and are either generic [39] or specifically designed for edge computing [41]. Note that the use of other detection models could further boost reported performance.
3 Proposed method
3.1 Preliminary experiment
We hypothesize that linking feedback about the effects of personal data sharing to real-life situations improves its efficiency compared to existing approaches. We designed an experiment to test this hypothesis using four real-life situations: bank loan, accommodation search, IT job search and waiter job search. A set of 20 photos that depict objects with potentially negative effects is selected. Objects with different negative ratings for each situation as obtained in Subsection 3.3 are kept. They include: casino, knife, cannabis leaf, rifle, etc. Participants assume that they are about to share a photo and that an AI-driven assistant advises against sharing. They see the following messages which implement:
- •
-
•
proposed feedback: ”You are in situation Y. The app predicts that the image should not be shared because it automatically detected object X in the image. Object X is negatively perceived in situation Y.”
The rest of the interface is identical. Each participant sees only one type of message to avoid interferences between feedback types. Images are presented randomly to avoid ordering effects. Participants are asked to answer the following question: ”Would you follow the advice provided by the app and not share the image?”. They can respond ”No”, ”Maybe” or ”Yes”. We encode these three responses as 0, 1 and 2 for results analysis. There were 50 participants for each of classical and proposed feedback. The average scores for the existing and proposed feedback are 0.86 and 1.13 respectively, with the corresponding standard deviations being 0.87 and 0.91. The large standard deviation values are normal since the negativeness of depicted objects is variable. A t-test with independent samples is applied to the sets of averaged photo scores. It shows that the difference is significant with . We can conclude to a strongly increased efficiency of the proposed feedback compared to the classical one. To instantiate feedback related to real-life situations, we introduce a method which learns to rate the effect of shared data both for individual images and entire user profiles.
3.2 Notations
The following notations are used below: an user whose profile is rated; the set of photos of defined as and analyzed automatically to rate the profile; a set of visual objects ; an object detector which detects the occurrence of visual object in the photo; a situation model defined by a set of visual objects rated via crowdsourcing ; a set of visual profiles for users with manual profile ratings collected by crowdsourcing; an automatic profile rating of in situation .
3.3 Crowdsourcing Situation Ratings
The interpretation of a object might vary between contexts, and so would the effects of sharing its images. Situations are modeled by crowdsourcing visual objects ratings. Impactful situations were selected: accommodation search (ACC below), bank credit demand (BANK), job search as IT engineer (IT) and job search as a waitress/waiter (WAIT). ACC and BANK are applicable to a large part of the population. IT and WAIT are relevant for population segments, but the respective job searches require different profiles. Detectable objects from the OpenImages [27], ImageNet [40] and COCO [29] datasets were rated to boost detector coverage. A limitation here is that task-relevant objects are missing and could be enriched.
A rating interface is created which includes for each situation: the object name, illustrative thumbnails and a 7-points Likert scale with ratings between -3 (strongly negative influence) to +3 (strongly positive influence). There were 56 participants in total, with 14 rating sets per situation. The final rating is obtained by averaging their contributions. The resulting detection dataset includes 269 objects with for at least one situation. Inter-rater agreement, which is important for tasks prone to bias such as the one proposed here, is computed using the average deviation index () [6]. The obtained varies between for and for . These values are well below , the maximum acceptable value for a 7-points Likert scale defined in [5]. Beyond rater agreement, the qualification of annotators is important. We define expertise as having working experience in BANK, IT and WAIT and having a landlord experience for ACC. Depending on the situation, the number of annotators with expertise in each situation was: two for BANK, six for IT, four for WAIT and four for ACC. Their ratings were generally well aligned with those provided by the other annotators. For instance, the agreement between average scores of experts and of other participants is only for . This finding indicates that the obtained ratings are representative.
The mean object ratings are -0.13 for BANK, 0.03 for ACC, 0.09 for IT and 0.27 for WAIT (standard deviations are 0.68, 0.7, 0.58 and 0.6 respectively). This illustrates the tendency of participants to be stricter when deciding about a bank loan than elsewhere. The is intuitive because granting a loan has tangible monetary consequences, which are easily internalized by participants. Inversely, WAIT, a situation with less serious implications, has the highest rating.
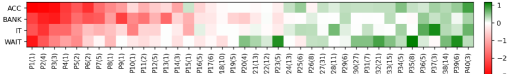
A clustering of visual objects based on their rating similarities across situations is shown in Fig. 1.It includes 40 patterns (cluster centroids) discovered by using the lowest silhouette criterion in K-means. These patterns confirm that object interpretation varies across situations. Averaged negative ratings are stronger since they reach -3, while averaged positive ratings have a maximum value of 1.15. Consistent with mean ratings, BANK and ACC have a larger number of negatively rated objects compared to IT and WAIT. While the negative range is stronger, a majority of objects have low positive scores. Patterns P27, P30 and P32 include 31, 27 and 21 objects, respectively. Some cluster ratings vary strongly between situations. P23, P35 and P39 are positive for WAIT but neutral or even negative elsewhere. These patterns include objects related to junk food and alcohol. P1, P2 and P3, which include objects related to weapons, have only negative ratings. The relatively low number of strong ratings indicates that the dataset should be enriched with highly rated objects in order to allow a finer-grained computation of visual profile ratings. More details about objects crowdsourcing are given in the supp. material.
3.4 Focal rating
Figure 1 indicates that a majority of objects have low ratings and they might overwhelm the less numerous but more significant highly-rated objects. Boosting the influence of latter is important and this is done using Eq. 1:
| (1) |
where: and control the strength of the focal rating. This function is inspired by attention mechanisms [49] which were used to improve the performance of deep learning applications, such as object detection [28]. Note that is needed to preserve the sign of after scaling with . will have little influence on objects that have low initial . The higher the absolute value of is, the more its effect will be boosted by Eq. 1. The effect of focal rating is illustrated in the supp. material.
3.5 Crowdsourcing Visual User Profile Ratings
We collect manual ratings for users in situation via crowdsourcing. Like object rating, visual profiles are evaluated using a 7-point Likert scale that goes from -3 (strongly unappealing) to +3 (strongly appealing). Ratings are collected from 9 participants for 500 users from the YFCC dataset [46] with 100 images per profile. YFCC was sampled because it includes images that were shared publicly under Creative Commons licenses which allow reuse. The images of each profile are shown on a single page, along with the possible situation rating. Participants are asked to look at all the photos and provide a global rating for each user in each situation. As illustrated in the supplementary material, the evaluated situations are presented in the interface. Profiles were presented randomly to participants to avoid ordering bias. Similar to Subsection 3.3, inter-rater agreement is analyzed using the index [6]. values are for ACC, for BANK, for IT and for WAIT. These values are within the acceptability bounds defined in [5] (). There were at least two expert annotators for each situation whose ratings were well aligned with those of other participants.
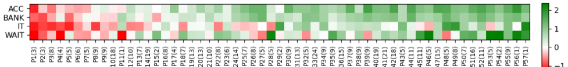
A clustering based on the similarity of profile ratings across situations which minimizes silhouette is presented in Fig. 2. There are 57 patterns discovered for the 500 profiles in the dataset. The ratings of the same users vary significantly from a situation to another. Our hypothesis that profile perception is context-dependent is confirmed. Unlike the object rating patterns from Fig. 1, positive ratings are in the majority here and positive ratings are stronger. The most populous patterns are positive, with 24 users in P33, 21 in P41 and 19 in P40. Most negative patterns include a limited number of profiles. Patterns such as P26, P27, P28 are rated positively in some situations and negatively in others. This finding supports the creation of per-situation rating predictors. Due to space limitations, details about profile rating crowdsourcing are given in the supp. material.
3.6 Baseline Rating of Visual User Profile
We attempt to obtain a reliable estimation of profile ratings in the modeled situations by using: (1) object ratings from Subsection 3.3, (2) object detections proposed by models learned with dataset and (3) the set of visual profiles rated in Subsection 3.5. Given a photo , detectors search for objects from and scores are predicted for all these objects by default. In practice, a threshold is needed to decide if an object is actually present. We define:
| (2) |
where: is the detector for object which evaluates the confidence of the raw prediction of in photo ; is a detection threshold for .
The threshold value in Eq. 2 can be set to a single value for all objects. This value can be optimized by maximizing the correlation between automatic and manual profile ratings over a validation set . However, it does not account for performance variations of object detectors. Instead, we implement a filtering-based attribute selection mechanism [35] which: (1) determines optimal thresholds for individual detectors and (2) selects only the individual detectors which are most relevant in context. We compute:
| (3) |
where: is the optimal correlation between manual and automatic rankings of profiles obtained using a single ; is the detection threshold associated to which ranges from 0.01 to 1 and is tested with a step of 0.01; is the Pearson correlation coefficient; and are the sets of automatic and manual rankings of profile ratings from obtained for each tested.
Eq. 3 optimizes the correlation between automatic and manual user ratings when a single detector is activated. If several values of maximize , the smallest of them is used to keep more occurrences of . The outputs of Eq. 3 need to be aggregated in order to decide which subset of is best in . The optimal is selected with:
| (4) |
where: is a correlation value between -1 and 1, with a step of 0.01; is a subset of which activates only a subset of detectors; and the , and are the same as in Eq. 3.
Eq. 4 provides the correlation threshold which selects the best subset of object detectors for visual profiles in . Individual detectors from are activated with:
| (5) |
High values of create a sparse . Only highly relevant detectors which provide strong correlations for situation are activated. The disadvantage of using a high is that the coverage is low, and only a subset of profiles can be reliably characterized. Inversely, low values of lead to a dense and ensure good profile coverage at the expense of the relevance of individual detectors. Eq. 5 finds a balance between the relevance of individual detectors and profile coverage.
The baseline rating of user profiles in combines object ratings for detections from obtained with Eq. 5. It is defined as:
| (6) |
where: is the total number of detections of filtered using Eq. 5, - the cardinality of the subset of photos with at least one visual detector activated.
The denominator produces an averaged profile rating and facilitates the comparison of visual profiles that include a variable number of images. Assuming that the numerator gives the same result for two users, the rating will be lower for the one which has more images with detections activated. In this way, profiles that include fewer but more salient detected objects are prioritized.
3.7 Learning to Rate Visual User Profiles
The baseline method from Subsection 3.6 performs a simple aggregation of available components but does not exploit them fully. We hypothesize that a supervised learning approach is better suited for profile rating. builds on the baseline and includes an image-level descriptor, a module which makes descriptors more compact at user level, and a model which performs the final prediction.
3.7.1 Image-level descriptor
Individual photos are a core factor in the manual rating of user profiles. It is thus interesting to aggregate object detections at the image level. Such a descriptor is equally interesting insofar it provides understandable feedback about individual photo contributions to the profile rating. The descriptor includes three attributes defined as follows:
| (7) |
where: is the filtered confidence of the detection with the optimal estimated in Eq. 3 for each ; is total number of detections; is the rating; , and are the positiveness, negativeness and confidence attributes of the image; is the Iverson bracket, valued 1 if the inner condition is true and zero otherwise.
and are designed to favor images that include objects with strong impact ratings. The higher the absolute values of are on average, the more salient and will be. gives an average of the valid detection scores from the image and favors images that include high confidence object detections over the others. Note that Eq. 7 is applicable if at least a valid detection exists in the image. Otherwise, the image is not considered in .
3.7.2 User-level descriptor
Image-level descriptors is aggregated at user level to mimic the way humans rate visual user profiles. This is challenging because visual objects with different ratings appear in isolation or jointly in one or several profile images. The user-level descriptor aggregation method is described in Algorithm 1. First, we construct , a set of image descriptors for each user . The sets are aggregated into , which is exploited to train a clustering model . is subsequently used to infer clusters which group together patterns in the underlying structure of each user profile. K-means, with clusters, is chosen for its effectiveness and simplicity. Other values were tried but did not improve the obtained results. The mean and variance of image descriptors from the clusters are concatenated in a final feature vector . It constitutes a better representation of the user profile compared to raw use of object ratings and object detections. captures in a compact form patterns from an initial high-dimensional space defined by an array of object detectors and thus avoids the curse of dimensionality [22]. The proposed descriptor is an alternative to classical dimensionality reduction techniques [42, 51]. A comparison to the two forms of compression of raw representations is proposed.
3.7.3 LERVUP training
Visual profile rating is modeled as a regression problem that exploits the user-level descriptor described in Algorithm 1. training is deployed as a pipeline process. First, individual object detections are validated within each image. Second, the image-level descriptor is constructed per image. Third, clustering is applied to group together similar image descriptors and discover relevant patterns for the entire training set. Fourth, the discovered patterns are concatenated to build the user descriptor. Finally, a random forest regression model is used to learn the rating of visual user profiles. Random forest was chosen because it is robust to data that contain non-linear relationships between features and target variables [23, 44, 53]. Note that the training is scalable since its optimization takes less than an hour per situation on a standard Intel Core processor.
4 Evaluation
The main objective of this first evaluation is to assess the feasibility of the task. Note that the user profiles dataset is not large enough to split it into train, validation and test subsets which have sufficient size. We thus split the dataset in training and validation sets , and which include 400 and 100 profiles, respectively. The optimal configuration of each method on is obtained using grid search and reported below. Details about optimized parameters and their ranges are given in the supp. material. Results are also provided for the ablation of 50% of user profiles or 50% visual objects.
4.1 Object Detection Dataset and Models
The coverage ensured by the detection dataset is important to enable processing of different types of visual content. As we mentioned, we merge three existing datasets: OpenImages [27], ImageNet [40] and COCO [29]. Whenever an object is present in more than one dataset, a balanced sampling is performed. The resulting dataset includes 269 objects and 137976 images. We limit imbalance by retaining at most 1000 images per object. The average and standard deviation of the distribution are 513 and 305, respectively.
Detectors are trained with mobile and generic models. The mobile model (MOBI) is a MobileNetV2 [41] with depthwise convolutions, which offer a good precision/speed tradeoff. The detection head is a Single Shot MultiBox Detector [30], a fast single-stage method that is adapted for edge computation. The generic model (RCNN) uses Inception-ResNet-v2 [45] with atrous convolutions and a Faster RCNN module [39] for detection. While not designed specifically for mobile devices, tests showed that it is usable on recent Android smartphones. Details about detector training are provided in the supp. material.
4.2 Methods
We test the following variants of the proposed methods:
- •
-
•
- version of with (Eq. 1).
-
•
and - supervised methods using random forest but with the raw features used in and 16-dimensional PCA-compressed feature which offer the best compression performance.
- •
-
•
and - variants of learned with half of the profiles and half of the objects from , respectively.
| RCNN | MOBI | |||||||
| ACC | BANK | IT | WAIT | ACC | BANK | IT | WAIT | |
| 0.40 | 0.28 | 0.36 | 0.65 | 0.38 | 0.27 | 0.41 | 0.58 | |
| 0.45 | 0.28 | 0.36 | 0.65 | 0.42 | 0.26 | 0.41 | 0.58 | |
| 0.45 | 0.33 | 0.36 | 0.65 | 0.42 | 0.30 | 0.41 | 0.58 | |
| 0.31 | 0.23 | 0.35 | 0.59 | 0.36 | 0.19 | 0.43 | 0.47 | |
| 0.45 | 0.30 | 0.43 | 0.60 | 0.32 | 0.09 | 0.24 | 0.63 | |
| 0.48 | 0.48 | 0.46 | 0.66 | 0.44 | 0.27 | 0.47 | 0.68 | |
| 0.55 | 0.50 | 0.50 | 0.68 | 0.49 | 0.42 | 0.51 | 0.68 | |
| 0.47 | 0.49 | 0.47 | 0.66 | 0.35 | 0.28 | 0.48 | 0.67 | |
| 0.43 | 0.42 | 0.47 | 0.66 | 0.47 | 0.35 | 0.48 | 0.64 | |
4.3 Results
The performance of the different methods tested is presented in Table 1. Correlations are analyzed using Cohen’s interpretation of the Pearson correlation coefficient [10]. Correlation is considered weak for values between 0.1 and 0.3, moderate between 0.3 and 0.5 and strong above 0.5. All evaluated methods provide a positive correlation between manual and automatic rankings of the profile ratings, with a wide majority of reported correlations in the moderate or strong ranges. This is a first positive result since the evaluated task is a complex one. Performance variations observed along different axes are discussed below.
The comparison of the two object detectors is globally favorable to RCNN. This result is intuitive insofar RCNN is built with a higher capacity deep network architecture. WAIT is the easiest situation, with up to 0.68 correlation obtained for both detectors. This good behavior for WAIT is explained by the fact that MOBI is known to provide good detections for large objects [41]. However, MOBI also has the worst results by a large margin compared to RCNN. The maximum correlation value obtained with MOBI for BANK is 0.42 while the corresponding value for RCNN is 0.5. These results point out that further performance improvement should be achievable with better object detectors.
The best global results are obtained with . Six out of eight of the correlations provided by this method are in the strong range defined by [10], with the other in the moderate range. clearly outperforms the baselines. This finding validates the utility of the learning-based approach, which models automatic profile ranking as a regression problem. is also better than , with up 15 points gained over it (BANK with MOBI detector). The boosting of highly-rated objects via the attention mechanism from Eq. 1 is thus validated.
The four modeled situations have variable performance. WAIT is the easiest situation (correlation up to 0.68) because the detection dataset contains a large number of food and beverage-related objects, which are often easy to detect. WAIT approximates an upper-bound performance one can expect with the available detection dataset. BANK is the most challenging situation tested, particularly for MOBI, which offers a maximum correlation of 0.42. More object detectors are required to improve results for this situation.
Among the baselines, is better than and . The introduction of focal rating has a smaller effect on the baseline compared to . Object selection (Eq. 4) and the use of individual detection thresholds (Eq. 3) have a larger impact than focal rating.
Results for and are particularly interesting since these methods exploit a random forest training like . The difference is that raw user representations, complete or compressed, are fed into , while exploits the proposed compact descriptor. The difference of performance in favor of validates the relevance of the proposed descriptor.
To test the influence of the amount of training data, we ablate half of the user profiles in and half of the visual objects in , respectively. The comparison of results obtained with the full training set () to the ablated versions confirms that additional data is clearly beneficial. Interestingly, removing objects has a stronger effect on RCNN results, while removing users has more impact on MOBI results. An explanation for this finding is that RCNN detection is more precise than MOBI and thus benefits more from the availability of a larger dataset. The ablation results have practical significance since the more data are clearly useful. Note that the effort needed to add the profiles and objects is significant and datasets enrichment is left for future work.
4.3.1 LERVUP implementation
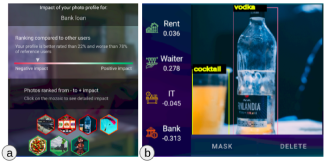
We describe an implementation of the proposed approach in an Android app which raises users’ awareness 111https://ydsyo.app/. It provides feedback about the effect of image sharing in the modeled situations. The app is designed to enforce user privacy and the entire processing is done on the user’s device. It is possible to create a profile made of local images, of images already shared on social media, or a combination of them. We note that user assistance is most effective for local images than for those which were already shared. A traffic light coding of the feedback (from red - negative to green - positive) [3] is used in the app to facilitate its understanding. Fig. 3 summarizes profile-level feedback (a) and photo-level feedback (b). Individual profile ratings are difficult to interpret in isolation. A reference community is created by sampling 5000 visual YFCC profiles which are processed with . The target profile rating is provided by comparison to the reference community. The same page includes thumbnails for images ranked by their impact in the situation. The user can select any photo for a detailed view of its effects (Fig. 3 (b)). Feedback is based on the photo impact rating given by Eq. 7 and is color-coded for each situation. The detected objects are highlighted using bounding boxes. The same screen contains two buttons that instantiate a control mechanism for local photos. ”DELETE” removes the photo from the device. ”MASK” changes its visibility to avoid uploads to social networks. Such control is desirable also for photos which were already shared but is not permitted by existing APIs.
5 Discussion and Conclusion
We presented a new approach that unveils potential real-life effects of photo sharing. It is implemented for four situations but is extensible in terms of situations, types of data included, object detection models and profile rating methods. Below, we discuss the implications of the work, point out its merits, limitations and perspectives of improvement.
The main objective is to help users understand how their shared data could reflect on their real lives. While promising, the approach is affected by a combination of human and technical biases. However, such biases are inherent to any AI-driven computer system and will also appear in real decision-making processes, which are mimicked here. For instance, crowdsourced object and profile ratings will reflect an average bias of the participants who provided inputs in the experiments. In a real context, where shared data is analyzed by a single person to reach a decision, the bias will be personal. Averaging ratings is a good way to reduce bias since any extreme individual opinions will be smoothed. In the future, it would be interesting to collect data from a larger pool of participants and cluster them in order to see if there are large rating differences between sub-communities. It is also important to note that we encode both positive and negative human biases since participants are asked to rate objects and profiles on a symmetric scale. This approach is more balanced than that of studies whose objective is to elicit negative biases [13, 15]. Ideally, decision-making processes should be bias-free but it is realistic to assume that biases cannot be eliminated. It is thus important to act toward at least removing the most damaging of them, which are related to sensitive demographics such as ethnicity, religion or gender. This topic will be part of our future work.
Technical biases are due to imperfections in the detection model, the available data and the model. Detection model imperfection can be reduced via the use of more powerful deep detection architectures [28, 36]. However, since the rating is most useful if done on the users’ devices, models should remain tractable at the edge. A second technical bias is due to detector availability. Three existing datasets are merged to improve detector coverage. They seem sufficient for WAIT, which is well mapped in the detection dataset, but probably not for the other situations. We will extend the dataset with priority given to new objects which are highly rated in at least one situation. A third technical bias is due to data imbalance. We limited the maximum number of images per object to reduce imbalance while also preserving accuracy. The imbalance will be further reduced with new annotations for both existing and new detectors. A fourth bias is related to the focus on images. The approach is extensible to other relevant data types, such as likes and texts studied in [24] and [34]. We intend to exploit them in order to obtain more relevant and broader profile ratings. Finally, provides performance gains compared to a series of baselines. The proposed method constitutes a first attempt to tackle profile rating, and important improvements over it are possible.
is implemented to mimic real decision-making processes and make them more transparent. A key challenge regarding transparency is related to the explainability of the decision-making process. The experiment presented in Section 3 indicates that the high-level explanation of situation-based feedback is more efficient than existing feedback. Future work will focus on: (1) adding sufficient profiles to the dataset in order to obtain train, validation and test splits which are large enough and (2) improving the explainability of learned models, especially that of deep object detectors, which is the most challenging [52]. The rest of the processing is easier to explain from a technical perspective but still requires a fair amount of AI-related knowledge.
The code is available 222https://github.com/v18nguye/lervup_official. An anonymized and modified version of the dataset is provided 333https://www.aicrowd.com/challenges/imageclef-2021-aware/.
Acknowledgment This work was supported by the European Commission under European Horizon 2020 Programme, grant number 951911 - AI4Media. This work was supported by the Fondation MAIF. It was made possible by the use of the FactoryIA supercomputer, financially supported by the Ile-de-France Regional Council.
References
- [1] Alessandro Acquisti and Christina Fong. An experiment in hiring discrimination via online social networks. Management Science, 66(3):1005–1024, 2020.
- [2] Shane Ahern, Dean Eckles, Nathaniel Good, Simon King, Mor Naaman, and Rahul Nair. Over-exposed?: privacy patterns and considerations in online and mobile photo sharing. In Mary Beth Rosson and David J. Gilmore, editors, Proceedings of the 2007 Conference on Human Factors in Computing Systems, CHI 2007, San Jose, California, USA, April 28 - May 3, 2007, pages 357–366. ACM, 2007.
- [3] Ben Anderson, Michael Smyth, Roger P Knott, Marius Bergan, Julie Bergan, and James L Alty. Minimising conceptual baggage: making choices about metaphor. In BCS HCI, pages 179–194, 1994.
- [4] Moira Burke, Justin Cheng, and Bethany de Gant. Social comparison and facebook: Feedback, positivity, and opportunities for comparison. In Regina Bernhaupt, Florian ’Floyd’ Mueller, David Verweij, Josh Andres, Joanna McGrenere, Andy Cockburn, Ignacio Avellino, Alix Goguey, Pernille Bjøn, Shengdong Zhao, Briane Paul Samson, and Rafal Kocielnik, editors, CHI ’20: CHI Conference on Human Factors in Computing Systems, Honolulu, HI, USA, April 25-30, 2020, pages 1–13. ACM, 2020.
- [5] Michael J Burke and William P Dunlap. Estimating interrater agreement with the average deviation index: A user’s guide. Organizational research methods, 5(2):159–172, 2002.
- [6] Michael J Burke, Lisa M Finkelstein, and Michelle S Dusig. On average deviation indices for estimating interrater agreement. Organizational Research Methods, 2(1):49–68, 1999.
- [7] Zhaowei Cai, Quanfu Fan, Rogerio S Feris, and Nuno Vasconcelos. A unified multi-scale deep convolutional neural network for fast object detection. In European conference on computer vision, pages 354–370. Springer, 2016.
- [8] Dan CireşAn, Ueli Meier, Jonathan Masci, and Jürgen Schmidhuber. Multi-column deep neural network for traffic sign classification. Neural networks, 32:333–338, 2012.
- [9] Jessica A Clarke. Explicit bias. Nw. UL Rev., 113:505, 2018.
- [10] Jacob Cohen. Statistical power analysis for the behavioral sciences. Academic press, 2013.
- [11] Kevin Curran, Sarah Graham, and Christopher Temple. Advertising on facebook. International Journal of E-business development, 1(1):26–33, 2011.
- [12] Sofie De Cnudde, Julie Moeyersoms, Marija Stankova, Ellen Tobback, Vinayak Javaly, and David Martens. Who cares about your facebook friends? credit scoring for microfinance. Technical report, University of Antwerp, 2015.
- [13] N. E. Díaz Ferreyra, Rene Meis, and Maritta Heisel. Online Self-disclosure: From Users’ Regrets to Instructional Awareness. In Andreas Holzinger, Peter Kieseberg, A Min Tjoa, and Edgar Weippl, editors, 1st International Cross-Domain Conference for Machine Learning and Knowledge Extraction (CD-MAKE), volume LNCS-10410 of Machine Learning and Knowledge Extraction, pages 83–102, Reggio, Italy, Aug. 2017. Springer International Publishing. Part 2: MAKE Smart Factor.
- [14] Benjamin Edelman, Michael Luca, and Dan Svirsky. Racial discrimination in the sharing economy: Evidence from a field experiment. American Economic Journal: Applied Economics, 9(2):1–22, 2017.
- [15] Gerald Friedland and Jaeyoung Choi. Semantic computing and privacy: a case study using inferred geo-location. Int. J. Semantic Computing, 5(1):79–93, 2011.
- [16] Batya Friedman and Helen Nissenbaum. Bias in computer systems. ACM Transactions on Information Systems (TOIS), 14(3):330–347, 1996.
- [17] Golnaz Ghiasi, Tsung-Yi Lin, and Quoc V. Le. NAS-FPN: learning scalable feature pyramid architecture for object detection. In IEEE Conference on Computer Vision and Pattern Recognition, CVPR 2019, Long Beach, CA, USA, June 16-20, 2019, pages 7036–7045. Computer Vision Foundation / IEEE, 2019.
- [18] Anthony G Greenwald and Mahzarin R Banaji. Implicit social cognition: attitudes, self-esteem, and stereotypes. Psychological review, 102(1):4, 1995.
- [19] Kaiming He, Georgia Gkioxari, Piotr Dollár, and Ross B. Girshick. Mask R-CNN. In IEEE International Conference on Computer Vision, ICCV 2017, Venice, Italy, October 22-29, 2017, pages 2980–2988. IEEE Computer Society, 2017.
- [20] Kaiming He, Xiangyu Zhang, Shaoqing Ren, and Jian Sun. Deep residual learning for image recognition. In 2016 IEEE Conference on Computer Vision and Pattern Recognition, CVPR 2016, Las Vegas, NV, USA, June 27-30, 2016, pages 770–778. IEEE Computer Society, 2016.
- [21] Chen Huang, Yining Li, Chen Change Loy, and Xiaoou Tang. Learning deep representation for imbalanced classification. In Proceedings of the IEEE conference on computer vision and pattern recognition, pages 5375–5384, 2016.
- [22] Gordon Hughes. On the mean accuracy of statistical pattern recognizers. IEEE transactions on information theory, 14(1):55–63, 1968.
- [23] Murat Kayri, Ismail Kayri, and Muhsin Tunay Gencoglu. The performance comparison of multiple linear regression, random forest and artificial neural network by using photovoltaic and atmospheric data. In 2017 14th International Conference on Engineering of Modern Electric Systems (EMES), pages 1–4. IEEE, 2017.
- [24] Michal Kosinski, David Stillwell, and Thore Graepel. Private traits and attributes are predictable from digital records of human behavior. Proceedings of the National Academy of Sciences, 110(15):5802–5805, 2013.
- [25] Alex Krizhevsky, Ilya Sutskever, and Geoffrey E. Hinton. Imagenet classification with deep convolutional neural networks. In Peter L. Bartlett, Fernando C. N. Pereira, Christopher J. C. Burges, Léon Bottou, and Kilian Q. Weinberger, editors, Advances in Neural Information Processing Systems 25: 26th Annual Conference on Neural Information Processing Systems 2012. Proceedings of a meeting held December 3-6, 2012, Lake Tahoe, Nevada, United States, pages 1106–1114, 2012.
- [26] Alex Krizhevsky, Ilya Sutskever, and Geoffrey E Hinton. Imagenet classification with deep convolutional neural networks. Communications of the ACM, 60(6):84–90, 2017.
- [27] Alina Kuznetsova, Hassan Rom, Neil Alldrin, Jasper R. R. Uijlings, Ivan Krasin, Jordi Pont-Tuset, Shahab Kamali, Stefan Popov, Matteo Malloci, Tom Duerig, and Vittorio Ferrari. The open images dataset V4: unified image classification, object detection, and visual relationship detection at scale. CoRR, abs/1811.00982, 2018.
- [28] Tsung-Yi Lin, Priya Goyal, Ross B. Girshick, Kaiming He, and Piotr Dollár. Focal loss for dense object detection. In IEEE International Conference on Computer Vision, ICCV 2017, Venice, Italy, October 22-29, 2017, pages 2999–3007. IEEE Computer Society, 2017.
- [29] Tsung-Yi Lin, Michael Maire, Serge J. Belongie, James Hays, Pietro Perona, Deva Ramanan, Piotr Dollár, and C. Lawrence Zitnick. Microsoft COCO: common objects in context. In David J. Fleet, Tomás Pajdla, Bernt Schiele, and Tinne Tuytelaars, editors, Computer Vision - ECCV 2014 - 13th European Conference, Zurich, Switzerland, September 6-12, 2014, Proceedings, Part V, volume 8693 of Lecture Notes in Computer Science, pages 740–755. Springer, 2014.
- [30] Wei Liu, Dragomir Anguelov, Dumitru Erhan, Christian Szegedy, Scott E. Reed, Cheng-Yang Fu, and Alexander C. Berg. SSD: single shot multibox detector. In Bastian Leibe, Jiri Matas, Nicu Sebe, and Max Welling, editors, Computer Vision - ECCV 2016 - 14th European Conference, Amsterdam, The Netherlands, October 11-14, 2016, Proceedings, Part I, volume 9905 of Lecture Notes in Computer Science, pages 21–37. Springer, 2016.
- [31] Matthieu Manant, Serge Pajak, and Nicolas Soulié. Can social media lead to labor market discrimination? evidence from a field experiment. Journal of Economics & Management Strategy, 28:225–246, 2019.
- [32] Anh Nguyen, Jason Yosinski, and Jeff Clune. Deep neural networks are easily fooled: High confidence predictions for unrecognizable images. In Proceedings of the IEEE conference on computer vision and pattern recognition, pages 427–436, 2015.
- [33] Tribhuvanesh Orekondy, Bernt Schiele, and Mario Fritz. Towards a visual privacy advisor: Understanding and predicting privacy risks in images. In IEEE International Conference on Computer Vision, ICCV 2017, Venice, Italy, October 22-29, 2017, pages 3706–3715. IEEE Computer Society, 2017.
- [34] Georgios Petkos, Symeon Papadopoulos, and Yiannis Kompatsiaris. Pscore: A framework for enhancing privacy awareness in online social networks. In 10th International Conference on Availability, Reliability and Security, ARES 2015, Toulouse, France, August 24-27, 2015, pages 592–600. IEEE Computer Society, 2015.
- [35] Tu Minh Phuong, Zhen Lin, and Russ B Altman. Choosing snps using feature selection. In 2005 IEEE Computational Systems Bioinformatics Conference (CSB’05), pages 301–309. IEEE, 2005.
- [36] Zheng Qin, Zeming Li, Zhaoning Zhang, Yiping Bao, Gang Yu, Yuxing Peng, and Jian Sun. Thundernet: Towards real-time generic object detection on mobile devices. In 2019 IEEE/CVF International Conference on Computer Vision, ICCV 2019, Seoul, Korea (South), October 27 - November 2, 2019, pages 6717–6726. IEEE, 2019.
- [37] Joseph Redmon and Ali Farhadi. YOLO9000: better, faster, stronger. In 2017 IEEE Conference on Computer Vision and Pattern Recognition, CVPR 2017, Honolulu, HI, USA, July 21-26, 2017, pages 6517–6525. IEEE Computer Society, 2017.
- [38] Joseph Redmon and Ali Farhadi. Yolov3: An incremental improvement. CoRR, abs/1804.02767, 2018.
- [39] Shaoqing Ren, Kaiming He, Ross B. Girshick, and Jian Sun. Faster R-CNN: towards real-time object detection with region proposal networks. In Corinna Cortes, Neil D. Lawrence, Daniel D. Lee, Masashi Sugiyama, and Roman Garnett, editors, Advances in Neural Information Processing Systems 28: Annual Conference on Neural Information Processing Systems 2015, December 7-12, 2015, Montreal, Quebec, Canada, pages 91–99, 2015.
- [40] Olga Russakovsky, Jia Deng, Hao Su, Jonathan Krause, Sanjeev Satheesh, Sean Ma, Zhiheng Huang, Andrej Karpathy, Aditya Khosla, Michael S. Bernstein, Alexander C. Berg, and Fei-Fei Li. Imagenet large scale visual recognition challenge. International Journal of Computer Vision, 115(3):211–252, 2015.
- [41] Mark Sandler, Andrew G. Howard, Menglong Zhu, Andrey Zhmoginov, and Liang-Chieh Chen. Mobilenetv2: Inverted residuals and linear bottlenecks. pages 4510–4520, 2018.
- [42] Bernhard Schölkopf, Alexander Smola, and Klaus-Robert Müller. Kernel principal component analysis. In International conference on artificial neural networks, pages 583–588. Springer, 1997.
- [43] E. Spyromitros-Xioufis, S. Papadopoulos, A. Popescu, and Y. Kompatsiaris. Personalized privacy-aware image classification. In ICMR ’16 Proceedings of the 2016 ACM on International Conference on Multimedia Retrieval, pages 71–78, New York, United States, 2016. Association for Computing Machinery, Inc. Conference of 6th ACM International Conference on Multimedia Retrieval, ICMR 2016 ; Conference Date: 6 June 2016 Through 9 June 2016; Conference Code:122023.
- [44] Vladimir Svetnik, Andy Liaw, Christopher Tong, J Christopher Culberson, Robert P Sheridan, and Bradley P Feuston. Random forest: a classification and regression tool for compound classification and qsar modeling. Journal of chemical information and computer sciences, 43(6):1947–1958, 2003.
- [45] Christian Szegedy, Sergey Ioffe, Vincent Vanhoucke, and Alexander A. Alemi. Inception-v4, inception-resnet and the impact of residual connections on learning. In Satinder P. Singh and Shaul Markovitch, editors, Proceedings of the Thirty-First AAAI Conference on Artificial Intelligence, February 4-9, 2017, San Francisco, California, USA, pages 4278–4284. AAAI Press, 2017.
- [46] Bart Thomee, David A Shamma, Gerald Friedland, Benjamin Elizalde, Karl Ni, Douglas Poland, Damian Borth, and Li-Jia Li. Yfcc100m: The new data in multimedia research. Communications of the ACM, 59(2):64–73, 2016.
- [47] Tatiana Tommasi, Novi Patricia, Barbara Caputo, and Tinne Tuytelaars. A deeper look at dataset bias. In Domain adaptation in computer vision applications, pages 37–55. Springer, 2017.
- [48] Ashwini Tonge and Cornelia Caragea. Dynamic deep multi-modal fusion for image privacy prediction. In Ling Liu, Ryen W. White, Amin Mantrach, Fabrizio Silvestri, Julian J. McAuley, Ricardo Baeza-Yates, and Leila Zia, editors, The World Wide Web Conference, WWW 2019, San Francisco, CA, USA, May 13-17, 2019, pages 1829–1840. ACM, 2019.
- [49] Wenguan Wang and Jianbing Shen. Deep visual attention prediction. IEEE Transactions on Image Processing, 27(5):2368–2378, 2017.
- [50] Joan C Williams. Double jeopardy? an empirical study with implications for the debates over implicit bias and intersectionality. Harvard Journal of Law & Gender, 37:185, 2014.
- [51] Svante Wold, Kim Esbensen, and Paul Geladi. Principal component analysis. Chemometrics and intelligent laboratory systems, 2(1-3):37–52, 1987.
- [52] Christine T Wolf. Explainability scenarios: towards scenario-based xai design. In Proceedings of the 24th International Conference on Intelligent User Interfaces, pages 252–257, 2019.
- [53] Ahmed Mohamed Youssef, Hamid Reza Pourghasemi, Zohre Sadat Pourtaghi, and Mohamed M Al-Katheeri. Landslide susceptibility mapping using random forest, boosted regression tree, classification and regression tree, and general linear models and comparison of their performance at wadi tayyah basin, asir region, saudi arabia. Landslides, 13(5):839–856, 2016.
- [54] Sergej Zerr, Stefan Siersdorfer, Jonathon S. Hare, and Elena Demidova. Privacy-aware image classification and search. In William R. Hersh, Jamie Callan, Yoelle Maarek, and Mark Sanderson, editors, The 35th International ACM SIGIR conference on research and development in Information Retrieval, SIGIR ’12, Portland, OR, USA, August 12-16, 2012, pages 35–44. ACM, 2012.