A Multi-Epoch Study of Radio Continuum Emission from Massive Protostars
Abstract
We report the results of the Jansky Very Large Array (JVLA) observation of five massive protostars at 6 and 22.2 GHz.
The aim of the study was to compare their current fluxes and positions with previous observations to search for evidence of variability.
Most of the observed sources present the morphologies of a thermal core, hosting the protostar and exhibiting no proper motion, and associated non-thermal radio lobes that are characterised by proper motions and located away from the thermal core. Some of the protostars drive jets whose lobes have dissimilar displacement vectors, implying precession of the jets or the presence of multiple jet drivers. The jets of the protostars were found to have proper motions that lie in the range 170650 kms-1, and precessions of periods 4050 years and angles 210∘, assuming that their velocities 500 kms-1. The core of one of the sources, S255 NIRS 3, which was in outburst at the time of our observations, showed a significant change in flux compared to the other sources. Its spectral index decreased during the outburst, consistent with the model of an expanding gas bubble. Modelling the emission of the outburst as that of a new non-thermal lobe that is emerging from a thermal core whose emission enshrouds that of the lobe also has the potential to account for the increase in flux and a decrease in the spectral index of the source’s outburst.
Key words: stars: formation stars: massive stars: protostars stars: variability
1 Introduction
Multi-epoch study of astrophysical objects is crucial in identifying any changes that they display. Massive protostellar jets, for example W75N B(Carrasco-González et al. 2015), show evidence of changes in both size and shape. Indeed, protostars are known to manifest variability in a number of ways (Marti et al. 1995). They show displacement through tidal interactions with their binary companions (Paron et al., 2016) and jet proper motions. Knowledge of variability of the objects can thus be instrumental in; identifying their driving sources and associated knots (Caratti o Garatti et al., 2009), estimating the rates at which the jets accelerate and/or decelerate, and providing clues to driving mechanisms and close binary formations.
Unlike in low-mass (Suters et al. 1996, Forbrich et al. 2006) and very low-luminosity protostars (Choi et al., 2014) where flux variability has been observed in 20%-30% of the sources, only a few massive protostars are known to manifest variability, some of which may be associated with jet properties. An infrared study of variability in protostars by Contreras Peña et al. (2017) showed that the changes may be linked to variation in accretion rates. Indeed, a number of studies attribute flux variability to periods of accretion burst (Zhu et al. 2009, Vorobyov & Basu 2006) that occur within relatively stable rates of inflows. Such accretion activities should manifest through their jets as outflows are tightly linked to inflows. A likely evidence for accretion burst in massive protostars is the discrepancy between their observed and theoretical estimates of accretion rates (Purser et al. 2016, Krumholz et al. 2009). Intervals of high accretion rates, in the form of bursts, could be a key aspect of stellar formation.
Massive protostars can experience rare but intense outbursts of radio emission. The phenomenon was reported in two 20 MYSOs, S255 NIRS 3 (Caratti o Garatti et al., 2017) and V723 Carinae (Tapia et al., 2015). Other objects known to be variable at different wavelengths include NGC 6334I (Hunter et al., 2017), V645 Cygni (Clarke et al., 2006) and G323.46-0.08 (Proven-Adzri et al., 2019). Such outbursts are relatively rare in massive stars and there is considerable scope for a large scale survey. However, the number of objects of interest vis-a-vis the available instruments does not allow for systematic monitoring over long periods of time, only permitting sporadic multi-epoch observations (Teixeira et al. 2018, Thomas et al. 2013, Marti et al. 1995). Given the value of multi-epoch observations, a sample of five massive protostars, previously observed in 2012 was re-observed in March 2018 to search for and study variability in jets of massive protostars.
2 Observation and Data
2.1 Source selection
Four objects were selected from a 2012 C-band survey (Purser et al. 2020 in prep) for re-observation at the same frequency band in 2018 to search for evidence of positional and/flux variability. The identified sources are spatially resolved at C-band and have lobes with measurable proper motions. Besides the four objects; G133.7150+01.2155, G173.4839+02.4317, G192.6005-00.0479 and G196.4542-01.6777, hereafter G133.7150, G173.4839, G192.6005 and G196.4542 respectively, a fifth source, G173.4815+02.4459, hereafter G173.4815, was observed within the primary beam of G173.4839.
The time difference between the two observations, approximately five and a half years, allowed for detection of displacements within the jets at the sources’ distances of 25 kpc. For example, a jet located within a distance d2.05.0 kpc, driving out mass at a typical velocity v500 km s-1 (Marti et al. 1995; Curiel et al. 2006) should manifest an angular shift of 0.120.3′′ between the two epochs. Assuming an astrometric precision (Walker 1997, Monet et al. 2010), a 1 shift of 0.03′′ should be detectable for components with a SNR=10 and a beam. The difference in the epochs also provides an opportunity to search for evidence for flux variability and precession, features that were noted by Purser et al. (2020 in prep). The thermal cores were also selected for observation at 22.2 GHz to allow for a more accurate estimate of their free-free SEDs, free from effects of dust and non-thermal emission. Again, the estimated spectral indices would not be subject to variability-related errors. Table 1 shows a list of the sources and some of their properties.
| Source | Common | RA(J2000) | DEC(J2000) | Lbol | Distance | |
| Name | (L⊙) | (kpc) | ||||
| W3 IRS5e | 02h25′40.77′′ | +62∘05′52.4′′ | 140000 | 2.3a | ||
| S233 IRf | 05h39′09.92′′ | +35∘45′17.2′′ | 2900 | 1.8b | ||
| S255g | 06h12′54.01′′ | +17∘59′23.1′′ | 45000 | 1.8c | ||
| S269g | 06h14′37.06′′ | +13∘49′36.4′′ | 94000 | 5.3d | ||
| aNavarete et al. 2019 | bSnell et al. 1990 | cBurns et al. 2016 | dHonma et al. 2007 | eWynn-Williams et al. 1972 | ||
| fLadeyschikov et al. 2016 | gAvedisova 2002 | |||||
| *Red MSX Source Survey | ||||||
2.2 VLA observation
The four objects were observed on the 29 March 2018 using NRAO’s JVLA telescope in A configuration at 6 GHz. Two of them, G192.6005 and G196.4542, were observed again on 05 May 2018 at 22.2 GHz, in the same configuration, to allow for estimation of spectral indices. The observations, done under the project code 18A-158, are of angular resolutions, and ; bandwidths, 4 and 8 GHz; and integration times, 20 minutes and 30 minutes at 6 GHz and 22.2 GHz respectively. Besides the continuum emission, methanol and water masers of frequencies; 6.7 GHz and 22.2 GHz, bandwidths; 4.0 MHz and 8.0 MHz, and spectral channels; 256 and 128, respectively, were also observed to aid in the calibration of the data. A list of the observed sources and the calibrators used in scaling their fluxes and phases at 6.0 and 22.2 GHz is shown in Table 2. The set of calibrators used in the 2012 observation were maintained to minimise comparison errors and maximise positional accuracy.
| Source | Phase Calibrators | |||
| Phase Cal | (mJy) | Size () | PA(∘) | |
| At GHz | ||||
| J02286721 | 12805 | |||
| J05553948 | 398010 | 170 30 | ||
| J05592353 | 2511 | 160 10 | ||
| J05592353 | 2511 | 160 10 | ||
| At GHz | ||||
| J05592353 | 1931 | |||
| J05592353 | 1931 | |||
Calibration and imaging were done using the NRAO’s data reduction software, CASA (Common Astronomy Software Applications; McMullin et al. 2007). C-band images were created using Briggs (Briggs, 1995) weighting of robustness 0.5, except in , where robustness was set at -1 due to the presence of diffuse emission of its field. In K-band, imaging of and was done with robustness parameters of 0.0 and 0.5 respectively. was in outburst and its field was affected by strong side-lobes which were suppressed by the Briggs weighting of robustness 0.0. The HPBW of the synthesised beams, used in deconvolving the dirty maps at both C- and K- bands, are shown in Table 3. Some of the images were generated after self-calibration of their visibilities, either once or twice, to improve their signal to noise ratios. Phase only self-calibration, and in some cases, followed by a combination of a phase and amplitude self-calibration were performed on the images. The resultant images have rms noise values shown in Table 3.
The rms noise for three of the fields, at 6 GHz, is 6 Jy/beam, however, in G133.7150’s field, the rms is higher, 21 Jy/beam, due to extended emission in the field. At 22.2 GHz, the rms noise is slightly higher than the rms noise at 6 GHz i.e an average value of 10 Jy/beam.
| Source | Synthesised beams | |||||
|---|---|---|---|---|---|---|
| (′′) | PA (∘) | rms(Jy/b) | (′′) | PA (∘) | rms(Jy/b) | |
| -64.1 | 21 | |||||
| -21.3 | 6 | |||||
| 15.1 | 6 | -51.23 | 9.5 | |||
| 4.3 | 6 | 76.45 | 11 | |||
3 Results
3.1 Continuum and Maser Emission
All the sources were detected at the frequencies of the observations, five at 6 GHz and two of them at 22.2 GHz. At 6 GHz, all the fields of the objects display evidence of multiple radio sources. Eleven were detected in the field of G133.7150, three in both G173.4815 and G173.4839, nine in G192.6005 and four sources in G196.4542. In some cases, the 6 GHz emission manifested elongated morphology, enclosing multiple components e.g G196.4542. G192.6005 and G196.4542, observed at both 6 GHz and 22.2 GHz, have radio sources that were detected at both frequencies. Four sources were detected at both frequencies within G192.6005’s field and one in G196.4542’s field. These sources show more compact structures at 22.2 GHz compared to 6 GHz, even-though their emission at 22.2 GHz also manifests extended features. In addition, both methanol and water maser species were detected in G192.6005 and G196.4542, however, the 6.7 GHz methanol maser was absent in the fields of both G133.7150 and G173.4839 which were only observed at C-band.
Fluxes, sizes and positions of the sources were estimated using the CASA task . Besides the uncertainties reported by , additional errors, added in quadrature, were included to account for errors due to calibration of the fluxes and positional accuracy of the observations. The uncertainties due to calibration of the fluxes were estimated to be 10% of a source’s flux. Likewise, a typical value of the positional accuracy of the JVLA, estimated as 10% of the HPBW of a synthesised beam, was used.
3.2 Radio sources
3.2.1 G133.7150+01.215
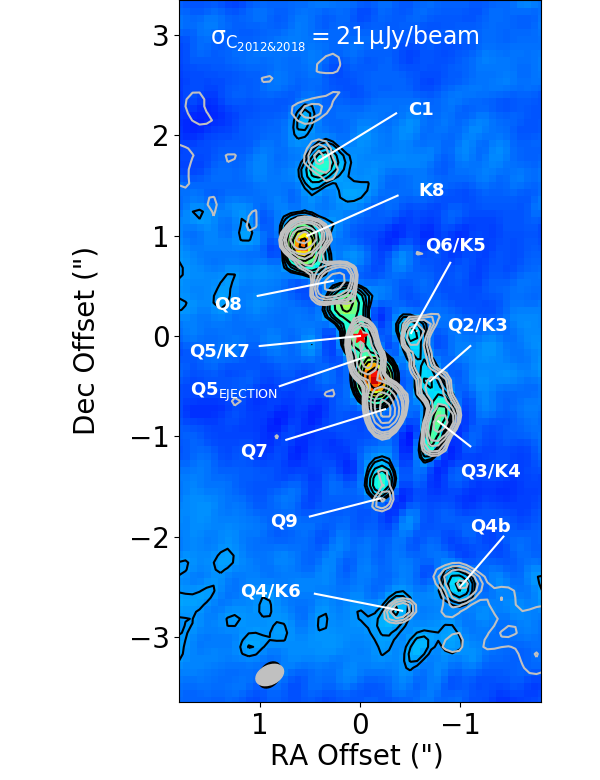
G133.7150, also known as W3 IRS5, harbours compact radio sources, three of which have mid-IR counterparts (van der Tak et al., 2005). All the radio sources detected in van der Tak et al. (2005) and Purser et al. (2020 in prep) were detected at 6 GHz except Q10 (Purser et al. 2020 in prep). The labelling in van der Tak et al. (2005) and Purser et al. (2020 in prep) was adopted here (see Figure 1). Table 4 lists all the sources detected above 3.
| Source | Peak flux | S | Major Axis | Minor Axis | PA |
|---|---|---|---|---|---|
| (mJy/beam) | (mJy) | (arcsecs) | (arcsecs) | (deg) | |
| C1 | 0.180.03 | 0.250.08 | 0.350.03 | 0.220.02 | 3010 |
| Q2 | 0.310.02 | 0.400.04 | |||
| Q3 | 0.650.03 | 0.800.05 | |||
| Q6 | 0.300.02 | 0.350.03 | |||
| Q4 | 0.250.03 | 0.270.06 | |||
| Q4b | 0.240.04 | 0.590.07 | 0.360.09 | 0.170.09 | 4125 |
| Q5 | 0.990.12 | 1.680.31 | |||
| Q7 | 1.200.11 | 1.870.26 | |||
| K8 | 0.98 0.09 | 1.130.20 | |||
| Q9 | 0.160.02 | 0.210.10 | |||
| Q8 | 0.770.11 | 1.000.25 |
van der Tak et al. (2005) established shifts in the positions of some of G133.7150’s radio sources, translating to an average transverse velocity of kms-1, an estimate comparable to the proper motion of K8 (Wilson et al., 2003). They also observed that the position angles (PAs) of the shifts are different, implying that G133.7150 drives a precessing jet. Comparing the locations of some of the radio sources in 2012 (Purser et al. 2020 in prep) with their positions in 2018, as measured here, confirms that they are moving away from Q5, perhaps the core of the jet (see Table 5 and Figure 2). Indeed Q5 has a mid-IR counterpart and its position, at Q-band, in both van der Tak et al. (2005) and Purser et al. (2020 in prep) only manifests a marginal offset of 0.040.01 after a period of sixteen years. Moreover, C1, K8, Q7, Q8 and Q9 have negative spectral indices while Q5’s spectral index is positive (Purser et al. 2020 in prep), implying that Q5 is a thermal core, and C1, K8, Q7, Q8 and Q9, are its associated non-thermal lobes. Massive protostars with comparable morphologies were reported in Purser et al. (2016), Obonyo et al. (2019) and Sanna et al. (2019). Q4b also has a negative spectral index and may be one of the lobes. Q4, on the other hand, has a mid-IR counterpart and its spectral index, 0.960.15, shows that it is thermal (Purser et al. 2020 in prep), perhaps another core. Besides the sources in van der Tak et al. (2005) and Purser et al. (2020 in prep), a new source, denoted as Q5Ejection (see Figure 1), was detected in the 2018 observation. This source seems to be a new ejection from the core of the jet.
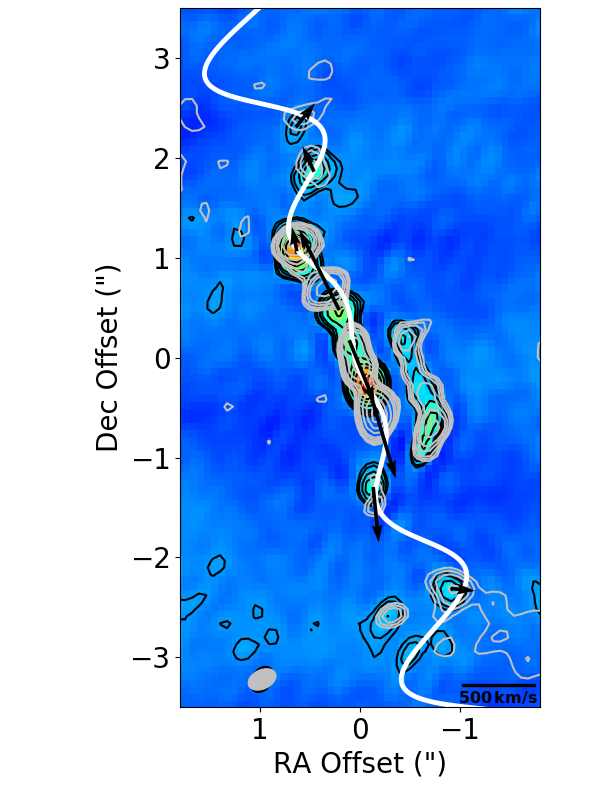
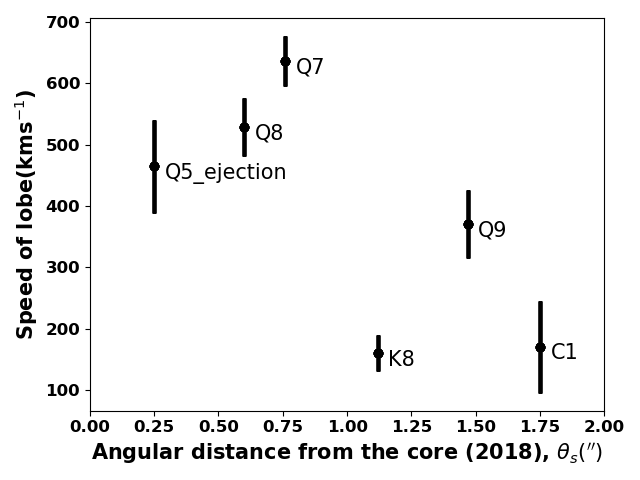
The information about the positional variability in G133.7150 can be used to estimate the proper motions of its lobes. The time gap of 1971 days permitted considerable angular displacements of the lobes, ranging from 0.08′′ to 0.31′′ as shown in Table 5. With the recent estimate of the distance to the object, 2.30.2 kpc (Navarete et al., 2019), the lower limits of the proper motions of the lobes, calculated on the assumption that the jet axis is 90∘ to the line of sight, lie in the range; 17070 kms-1 for 0.080.01 and 65050 kms-1 for 0.310.02. The average value of the proper motions of the lobes is 39090 kms-1.
Figure 3 shows that the inner lobes have higher proper motions compared to the outer lobes. Moreover, their proper motions increase with distance, depicting an acceleration, especially near the core. This is also suggested by the non-detection of lobe d2 (Claussen et al., 1994) in the 1996 observation (van der Tak et al., 2005). The lobe, also denoted as Md2 in Tieftrunk et al. (1997), was detected by Claussen et al. (1994) and Tieftrunk et al. (1997) at 15 GHz and 5 GHz respectively in 1989 but not in 1996 (van der Tak et al., 2005), suggesting that it had moved to the position of K8 in 8 years, covering an angular distance of 0.99′′ at an average velocity kms-1. The disappearance of d2 also implies that K8 is a terminal shock. Lobes K8, Q9 and C1, on the other hand, have lower velocities with no clear pattern, implying that they were decelerated, either due to a drop in their energies or as a result of interaction with ambient particles. Indeed, K8, Q9 and C1 seem most affected by the impact of the ambient medium, as they display the least displacement. For example, the proper motion of K8 is relatively stable. Its average velocity between 1989-1996 is 12020 kms-1, a value that is comparable with its velocity between 2012-2018.
| Source | Position in 2012 | Position in 2018 | offset | PA of PM | ||
|---|---|---|---|---|---|---|
| RA(J2000) | Dec(J2000) | RA(J2000) | Dec(J2000) | (′′) | (deg) | |
| C1 | 02:25:40.8350.002 | +062:05:54.2760.016 | 02:25:40.8400.003 | +62:05:54.3530.025 | 0.080.03 | 2422 |
| Q5EJ | 02:25:40.7830.002 | +062:05:52.5420.007 | 02:25:40.7710.002 | +062:05:52.3280.031 | 0.230.04 | 2007 |
| K8 | 02:25:40.8610.001 | +062:05:53.4520.007 | 02:25:40.8610.002 | +062:05:53.5310.013 | 0.080.01 | 512 |
| Q7 | 02:25:40.7600.001 | +062:05:52.1390.006 | 02:25:40.7460.001 | +062:05:51.8400.017 | 0.310.02 | 1985 |
| Q8 | 02:25:40.8000.001 | +062:05:52.8740.012 | 02:25:40.8170.002 | +062:05:53.1070.014 | 0.260.02 | 275 |
| Q9 | 02:25:40.749 0.001 | +062:05:51.1090.022 | 02:25:40.7500.002 | +062:05:50.9260.017 | 0.180.03 | 1785 |
The distribution of C1, Q4, Q7, Q8, Q9 and K8 on the sky creates a pattern that is point-symmetric about Q5. This, coupled with the directions of motion of C1, Q8, Q7 and Q9 suggests the presence of a precessing jet. A simple model, similar to the one described in Eisloffel et al. (1996), was adopted in assessing the nature of the precession. In this model, the path of a jet head follows a conical spiral whose projection on the plane of the sky is a sinusoid. If the angle between the axis of precession and the line of sight is perpendicular, then the model can be described mathematically by equation 1 (Eisloffel et al., 1996), where and are the axial and radial displacements of the jet head from the location of the driving source respectively. is the position angle of the jet, is the velocity of the jet, is the precession angle, is the time of evolution of the jet and is the period of precession.
| (1) |
This simple model does not consider the angle of inclination of the jet to the plane of the sky and any variations in velocity along a jet, seen in G133.7150. Considering the wide range of the velocities of the lobes, only the first three lobes of the jet, perhaps the least affected by surroundings or loss of energy, was used in calculating the typical velocity of the jet’s lobes, 54050 kms-1. A constant velocity of 500 kms-1 and an inclination angle of 90∘ were therefore adopted in the calculations. The model, shown in Figure 2, was obtained for a jet whose position angle , precession period years and precession angle . This model, which we fit by inspection, seems to agree with the positions of the lobes and the directions of the displacement vectors despite its simplicity. The proper motion of some of the maser group B in Imai et al. (2000) also display comparable features. All the derived quantities are comparable to the calculations by Purser (2017) who used the position angles of the lobes to fit a precession model, however, Purser (2017)’s precession angle, 3715, is higher than our estimate.
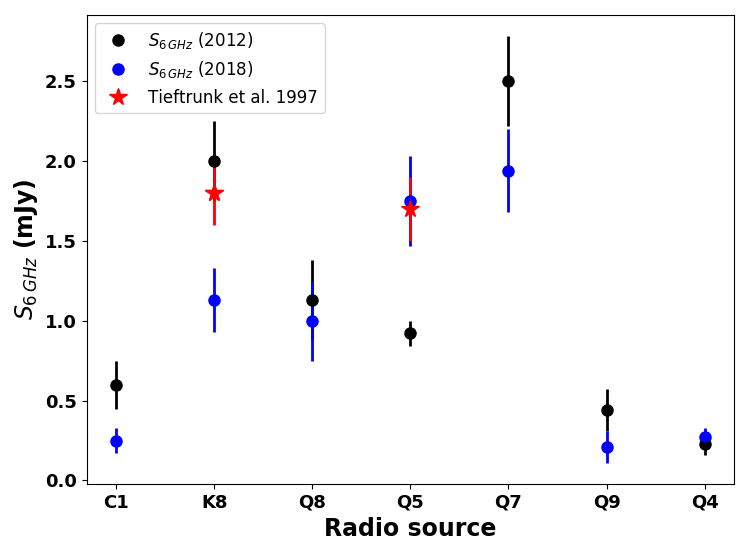
van der Tak et al. (2005) noted a difference between the fluxes they derived and estimates from Tieftrunk et al. (1997), in some of the radio sources e.g Q5 and K8, suggesting flux variability. The flux densities of the radio sources in 2012 were compared with their fluxes in 2018 to identify the sources that experience flux variability. The differences, though marginal, is greatest in Q5 and K8 (see Figure 4), perhaps due to changes during ejection of new lobes at Q5 and merging of lobes at K8. K8’s flux was found to be lower in 2018 compared to its flux in both Tieftrunk et al. (1997) and Purser et al. (2020 in prep). Q5’s flux, on the other hand, is comparable to Tieftrunk et al. (1997) in 2018 but lower than Purser et al. (2020 in prep)’s estimate.
Radio sources Q2, Q3 and Q6 do not seem to be associated with the MYSO at Q5. Their alignment and morphology of emission depicts Q2 as a thermal jet, with Q3 and Q6 as its lobes. However, their spectral indices, 0.160.13, 0.760.10 and 0.580.20 (Purser et al. 2020 in prep) respectively, suggest that they may be thermal cores. Purser et al. (2020 in prep) classified Q3 as a jet with lobes and both Q2 and Q6 as jet candidates. Indeed, the presence of water masers (Imai et al., 2000) near the radio sources suggests that they are jets, however, only Q3 has a mid-IR counterparts and is a known core.
3.2.2 G173.4839+02.4317
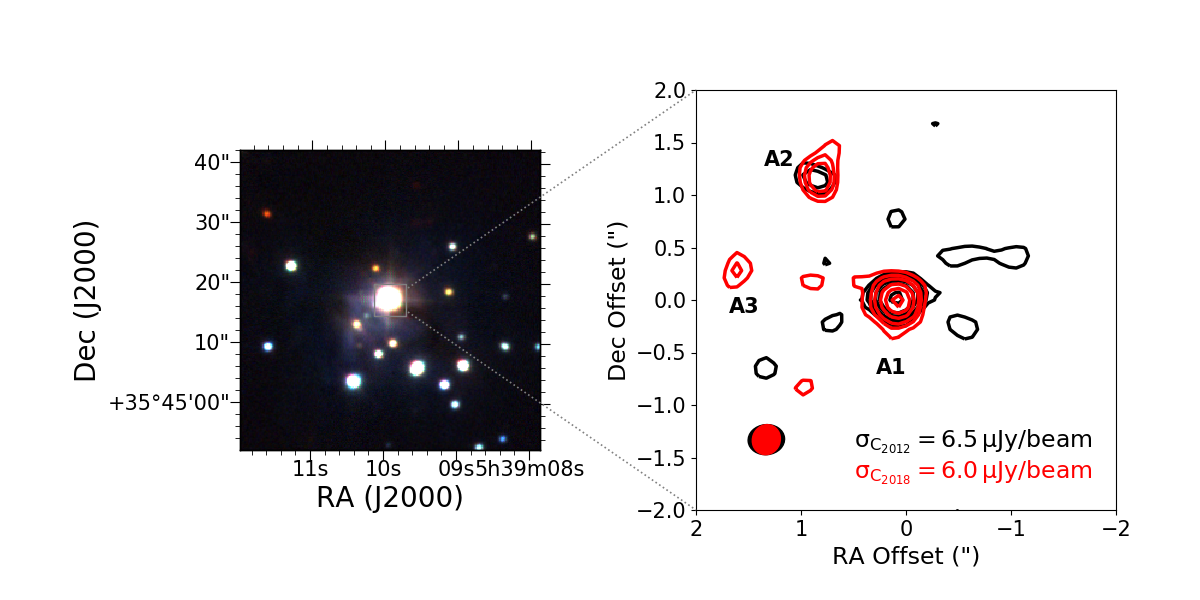
Two radio sources, A1 and A2, detected by Purser et al. (2020 in prep) in 2012, were detected in 2018 (see Figure 5). A third source, A3, located to the east of A1, was also detected at 5. The flux densities of A1, A2 and A3 are 0.220.02 mJy, 0.090.02 mJy and 0.040.01 mJy respectively. Neither A1 nor A2 manifest clear changes in both flux and positions. Identifying the nature of the sources is not straightforward from the limited information, however, their relative stability in both position and flux, low reddening seen in the 2MASS infrared image and bright Br emission in A1 (Cooper et al., 2013) suggests that they may be HII-regions (Purser et al. 2020 in prep). The spectral indices (Purser et al. 2020 in prep) of their emission also suggest that they are HII regions. However, the 2.12 m H2 map by Navarete et al. (2015) detected a single outflow in the SE-NW direction.
3.2.3 G173.4815+02.4459
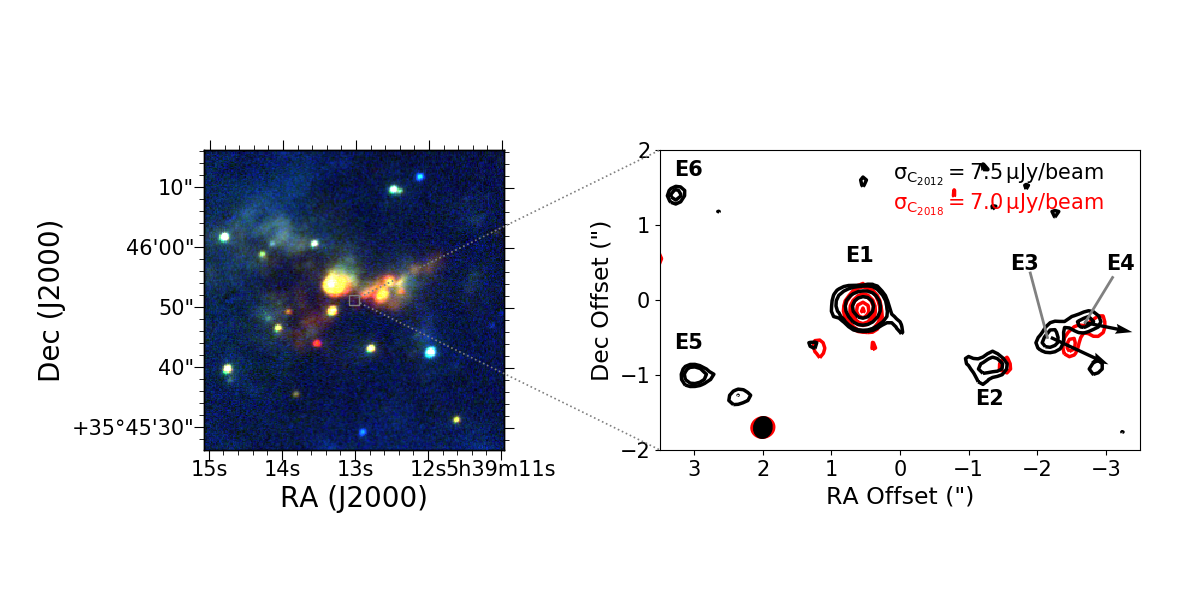
The primary beam of G173.4839 at 6cm enabled the detection of another RMS MYSO, G173.4815, located at , approximately away from the pointing centre of the observation. Three radio sources, E1, E3 and E4, shown in Figure 6, were detected in the field of the MYSO unlike in Purser et al. (2020 in prep) where six radio sources were detected. Purser et al. (2020 in prep) identified E1, a methanol maser source (Minier et al., 2000), as the core of an ionized jet while E3 and E4 were classified as lobes. Indeed, we measure the displacement of both E3 and E4 toward the west which implies that they are lobes and their driving sources are located to the east. This field is known to host three mm cores (Beuther et al. 2002, Beuther et al. 2007) and multiple outflows, identified from CO and shock-excited H2 emission (Ginsburg et al. 2009, Navarete et al. 2015, Varricatt et al. 2010). One of the cores is co-located with E1 (Purser et al. 2020 in prep), reaffirming that it is a core and the potential driver of the jet that harbours E3 and E4. The displacement vectors of E3 and E4, shown in Figure 6, suggest the presence of a precessing jet or multiple jet drivers. The magnitudes of their angular displacements are 0.30′′ and 0.18′′, translating to velocities of 53050 and 32030 kms-1 respectively, assuming that the distance of the source is 2.00.4 kpc (Kawamura et al., 1998) and that the motion is on the plane of the sky.
Flux densities of the radio sources, derived from the 2018 observation, were found to be comparable to 2012 fluxes (Purser et al. 2020 in prep) i.e 0.350.01 mJy, 0.050.02 mJy and 0.040.02 mJy for E1, E3 and E4 respectively.
3.2.4 G192.6005-00.0479
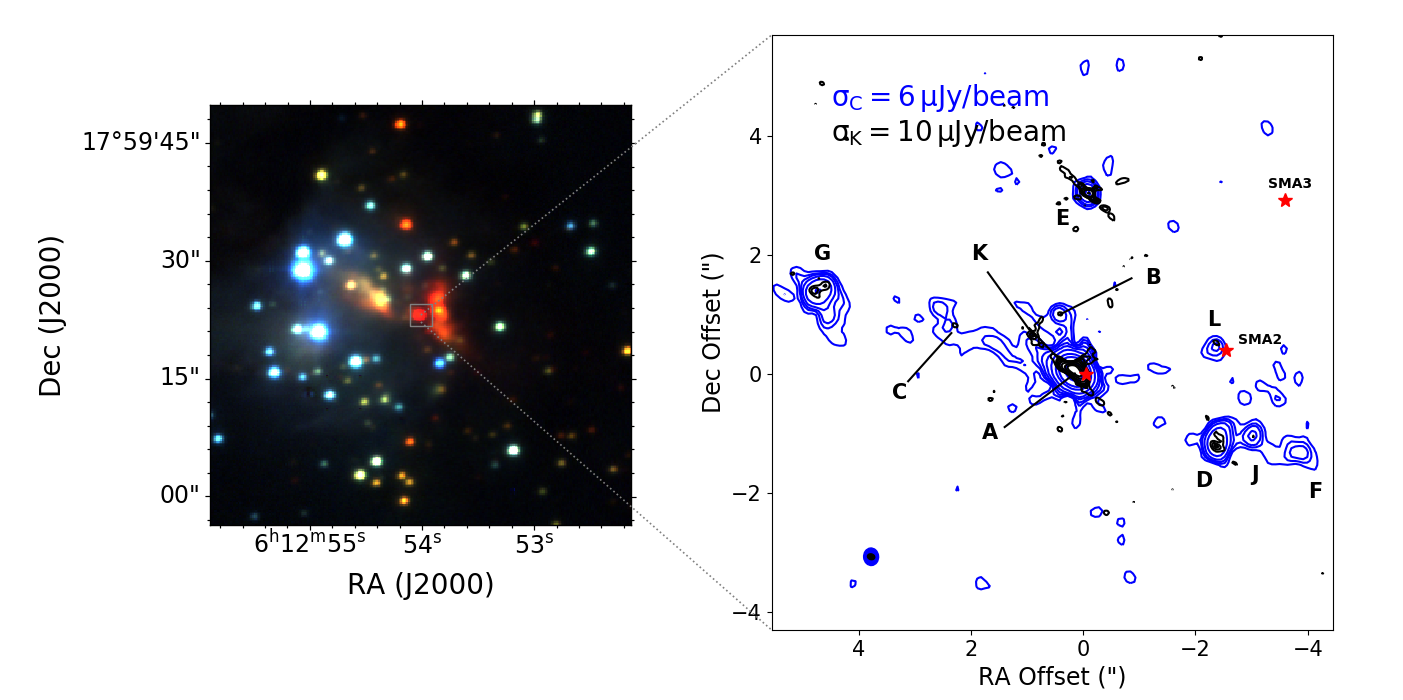
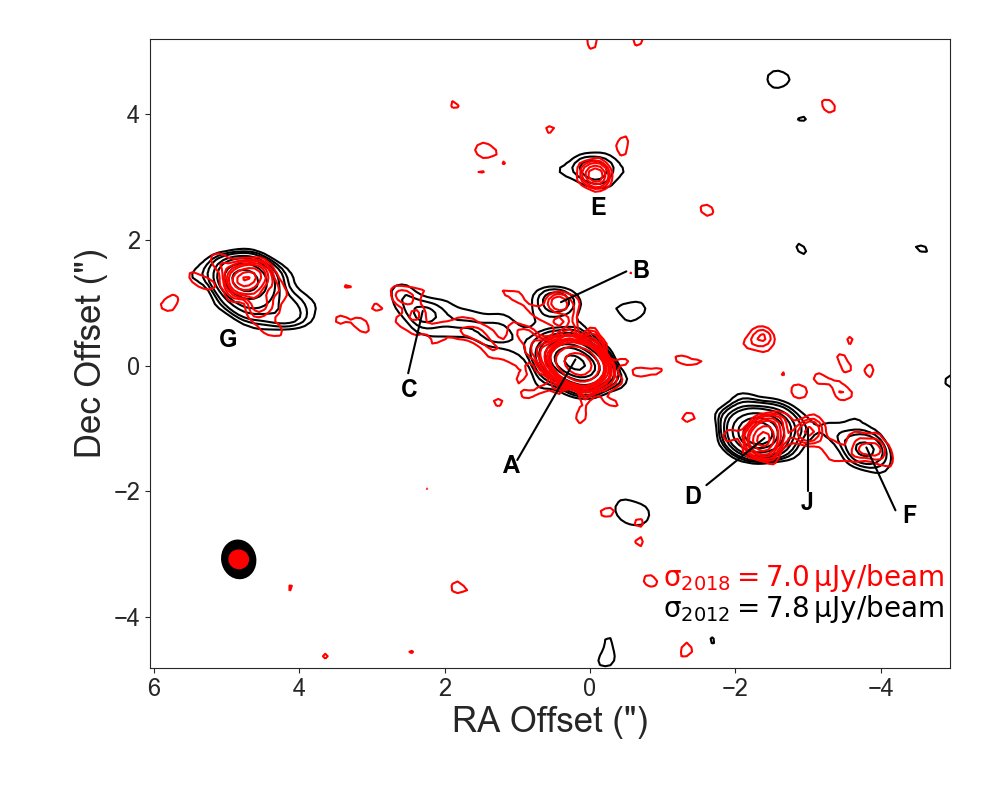
G192.6005 is located in the S255 star forming region. Its continuum map at both C- and K-bands exhibits the presence of a protostellar core, denoted as A (also known as S255 NIRS 3) and five jet lobes named C, D, F, G and J (see Table 6 and Figure 7). The core of the protostars was resolved at both C- and K-bands, showing an elongation in a NE-SW direction at a position angle of 551. Its orientation is similar to the alignment of A, C, D, F, G and J. Moreover, the infrared emission in the field has a similar orientation, further confirming the presence of a jet in the NE-SW direction. Besides the protostar, there are other radio sources in the field, i.e B, E and K, that do not show any clear association with NIRS 3. B has a spectral index , indicating that it is a non-thermal lobe while K’s index implying that it is a thermal source, perhaps an HII region. E, detected at both frequency bands has a spectral index of 1.180.08, another potential HII region. Only two of the radio sources in the field, A and L, have sub-millimetre counterparts (Liu et al., 2018) i.e thermal cores. L whose sub-millimetre counterpart is SMA2 was weakly detected at C-band and not K-band where rms noise is 10 mJy/beam. A third sub-millimetre core, SMA3, does not have a radio counterpart at both C- and K-bands.
Previous C-band observation of the region by Purser (2017) revealed a similar distribution of the radio sources. The morphologies of the radio sources are also comparable. A and C, for example, are elongated in the NE-SW direction even-though C seems to be evolving into a new shape, perhaps due to an interaction between the fast moving particles of the jet and its slow moving clumpy counterparts. Cesaroni et al. (2018) also detected the core, A, and its lobes but their images were more extended due to the lower resolution of their observations.
| Object | Position | Integrated Flux (mJy) | Peak flux (mJy/Beam) | Nature | ||||
|---|---|---|---|---|---|---|---|---|
| Dec | RA | C-band | K-band | C-band | K-band | |||
| A | 06h12′54.02′′ | +017∘59′23.1′′ | 15.110.09 | 24.720.80 | 0.370.02 | Core | ||
| B | 06h12′54.04′′ | +017∘59′24.1′′ | 0.130.03 | Lobe | ||||
| D | 06h12′53.84′′ | +017∘59′21.9′′ | 0.550.03 | 0.320.02 | Lobe | |||
| E | 06h12′54.00′′ | +017∘59′26.1′′ | 0.170.04 | 0.150.02 | HII-region | |||
| F | 06h12′53.74′′ | +017∘59′21.78′′ | 0.190.03 | 0.060.02 | Lobe | |||
| G | 06h12′54.33′′ | +017∘59′24.5′′ | 0.650.04 | 0.340.02 | Lobe | |||
| J | 06h12′53.80′′ | +017∘59′22.1′′ | 0.170.03 | 0.070.02 | Lobe | |||
| K | 06h12′54.07′′ | +017∘59′23.7′′ | 0.05 | HII-region | ||||
| L | 06h12′53.85′′ | +017∘59′23.5′′ | 0.090.02 | 0.07 | 0.050.01 | thermal core | ||
G192.6005-00.0479’s Core
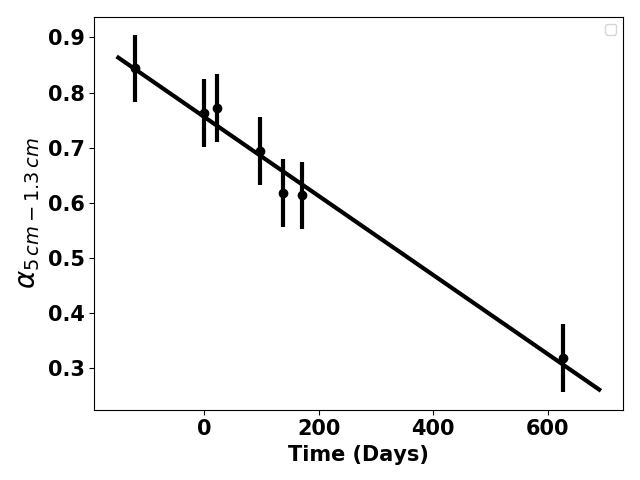
The protostellar core of G192.6005, source A, also known as S255 NIRS 3, is a thermal radio source of spectral index 0.370.02. It displayed a significant rise in flux density after July 2016 (Cesaroni et al., 2018). The flux density in 2012 was 0.790.02 mJy (Purser, 2017), a value comparable to Cesaroni et al. (2018)’s estimates of March and July 2016. Cesaroni et al. (2018) monitored the core from 11 March 2016 to 27 December 2016, a period totalling six epochs, following earlier reports of maser flaring (Fujisawa et al., 2015) and IR brightening (Stecklum et al., 2016) of the source. Their observations at both C- and K-bands manifest a clear increase in flux density of the core as shown by the right hand panel of figure 8.
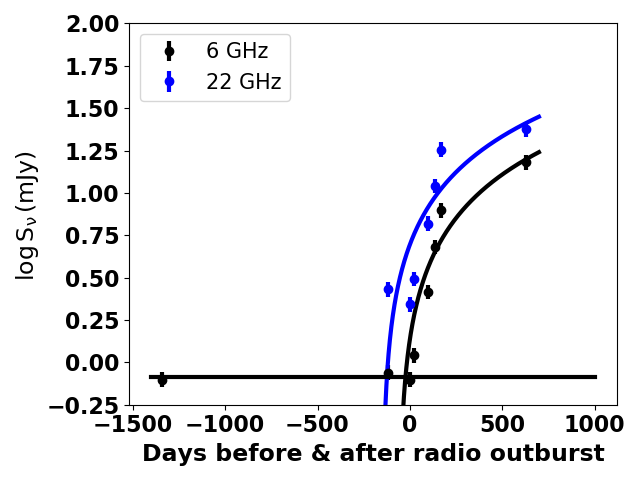
The data from Cesaroni et al. (2018), Purser (2017) and this observation, shown in Table 7, were plotted to display the changes in the flux of the core for the period covering the eight epochs. As observed by Cesaroni et al. (2018), the core experienced an exponential rise in radio flux after July 2016. However, the observation of 2018 shows a clear deviation of the fluxes from the initial trend of the outburst. Whereas this deviation suggests that the outburst is either on a decline or plateauing, its methanol maser light curve (Szymczak et al., 2018) points to a decline. More evidence of the decline was reported by Liu et al. (2018) after analysing the source’s 900 m continuum emission and 349.1 GHz methanol maser emission.
| Date | 2012 | 2016 | 2018 | |||||
|---|---|---|---|---|---|---|---|---|
| Nov. | Mar. | Jul. | Aug. | Oct | Nov. | Dec. | Mar. | |
| Days before & after outburst | -1342 | -121 | 0 | 22 | 97 | 137 | 170 | 627 |
| Wavelength | (mJy) | (mJy) | (mJy) | (mJy) | (mJy) | (mJy) | (mJy) | (mJy) |
| 2.70.3 | 2.20.2 | 3.10.3 | 6.60.7 | 111 | 182 | 24.720.80 | ||
| 0.790.08 | 0.870.09 | 0.790.08 | 1.10.1 | 2.60.3 | 4.80.5 | 7.90.8 | 15.110.09 | |
Clearly, predicting the nature of the outburst is not straightforward given the large time-gap between the data from Cesaroni et al. (2018) and the 2018 observation. To understand it further, the evolution of its spectral index was studied (see left panel of Figure 8). The spectral index of the central core, at each of the epochs, was derived using a combination of data from our 2018 observation and the C- and K-band data from Cesaroni et al. (2018). Uncertainties in the fluxes were all assumed to be 10% of the flux for consistency with the errors used in Cesaroni et al. (2018). The index show a reduction with time: 0.840.06 in March 2016, 0.760.06 in July 2016 during the early stages of the outburst and 0.360.05 in 2018, over 600 days after the outburst. Taking 10 July 2016 as the onset of the outburst i.e (Cesaroni et al., 2018), the spectral index of the radio emission shows a linear relation with time , . If the linear trend continues, the emission from the outburst should transition into an optically thin regime () after 1400 days unless a restoring mechanism acts. The continued downward trend in spectral index implies a drop in optical depth. Some of the factors that can result in the decline of the optical depth along a line of sight through the jet are: a drop in the jet number density , a decrease in the path length through the jet , a rise in the temperature of the jet and a drop in its ionization fraction (Reynolds, 1986) i.e , where and are the free-free absorption coefficient and 0.212 respectively. Effectively, the drop in optical depth suggests a number of possibilities which may include a combination of recombination of charged particles and/or a decrease in the jet density due to expansion and diffusion of jet particles. However, if the rise in flux is occasioned by an increase in the number density of the emitters, it would imply a higher opacity of the outburst. To explain the anti-correlation of the outburst’s flux and spectral index, Cesaroni et al. (2018) considered a model of an expanding gas bubble whose opening angle and the amount of ions injected into increases with time. While their model can explain the phenomenon, simulations of radio outbursts in galactic jets (Lindfors et al. 2006, Türler et al. 2000) and the model of synchrotron and free-free emission radiated by a colliding wind binary (Dougherty et al., 2003) suggest that the S255 NIRS3 outburst could instead be due to a combination of synchrotron and free-free emission. The evolution of the synchroton emission, modelled in 3C 279 (Lindfors et al., 2006) and 3C 273 (Türler et al., 2000), shows a rapid rise and then a decline. Such a rise in the intensity of synchrotron emission, if present in S255 NIRS3, could lower the overall index of the outburst. We therefore suggest that the anti-correlation of the intensity of S255 NIRS3’s outburst with the spectral index of its emission may be an indirect indicator of the presence of non-thermal radiation from the core.
Evolution of the spectral index during the outburst shows a well-behaved linear correlation with time. This correlation can be used to predict the flux of the source at a given frequency using the equation , where , , , , and are C-band flux, K-band flux, C-band frequency, K-band frequency, evolving spectral index and age of the outburst, respectively. Least-squares fitting of a logarithmic function of the form described above on the flux vs time data points displays a trend that points to a plateauing outburst.
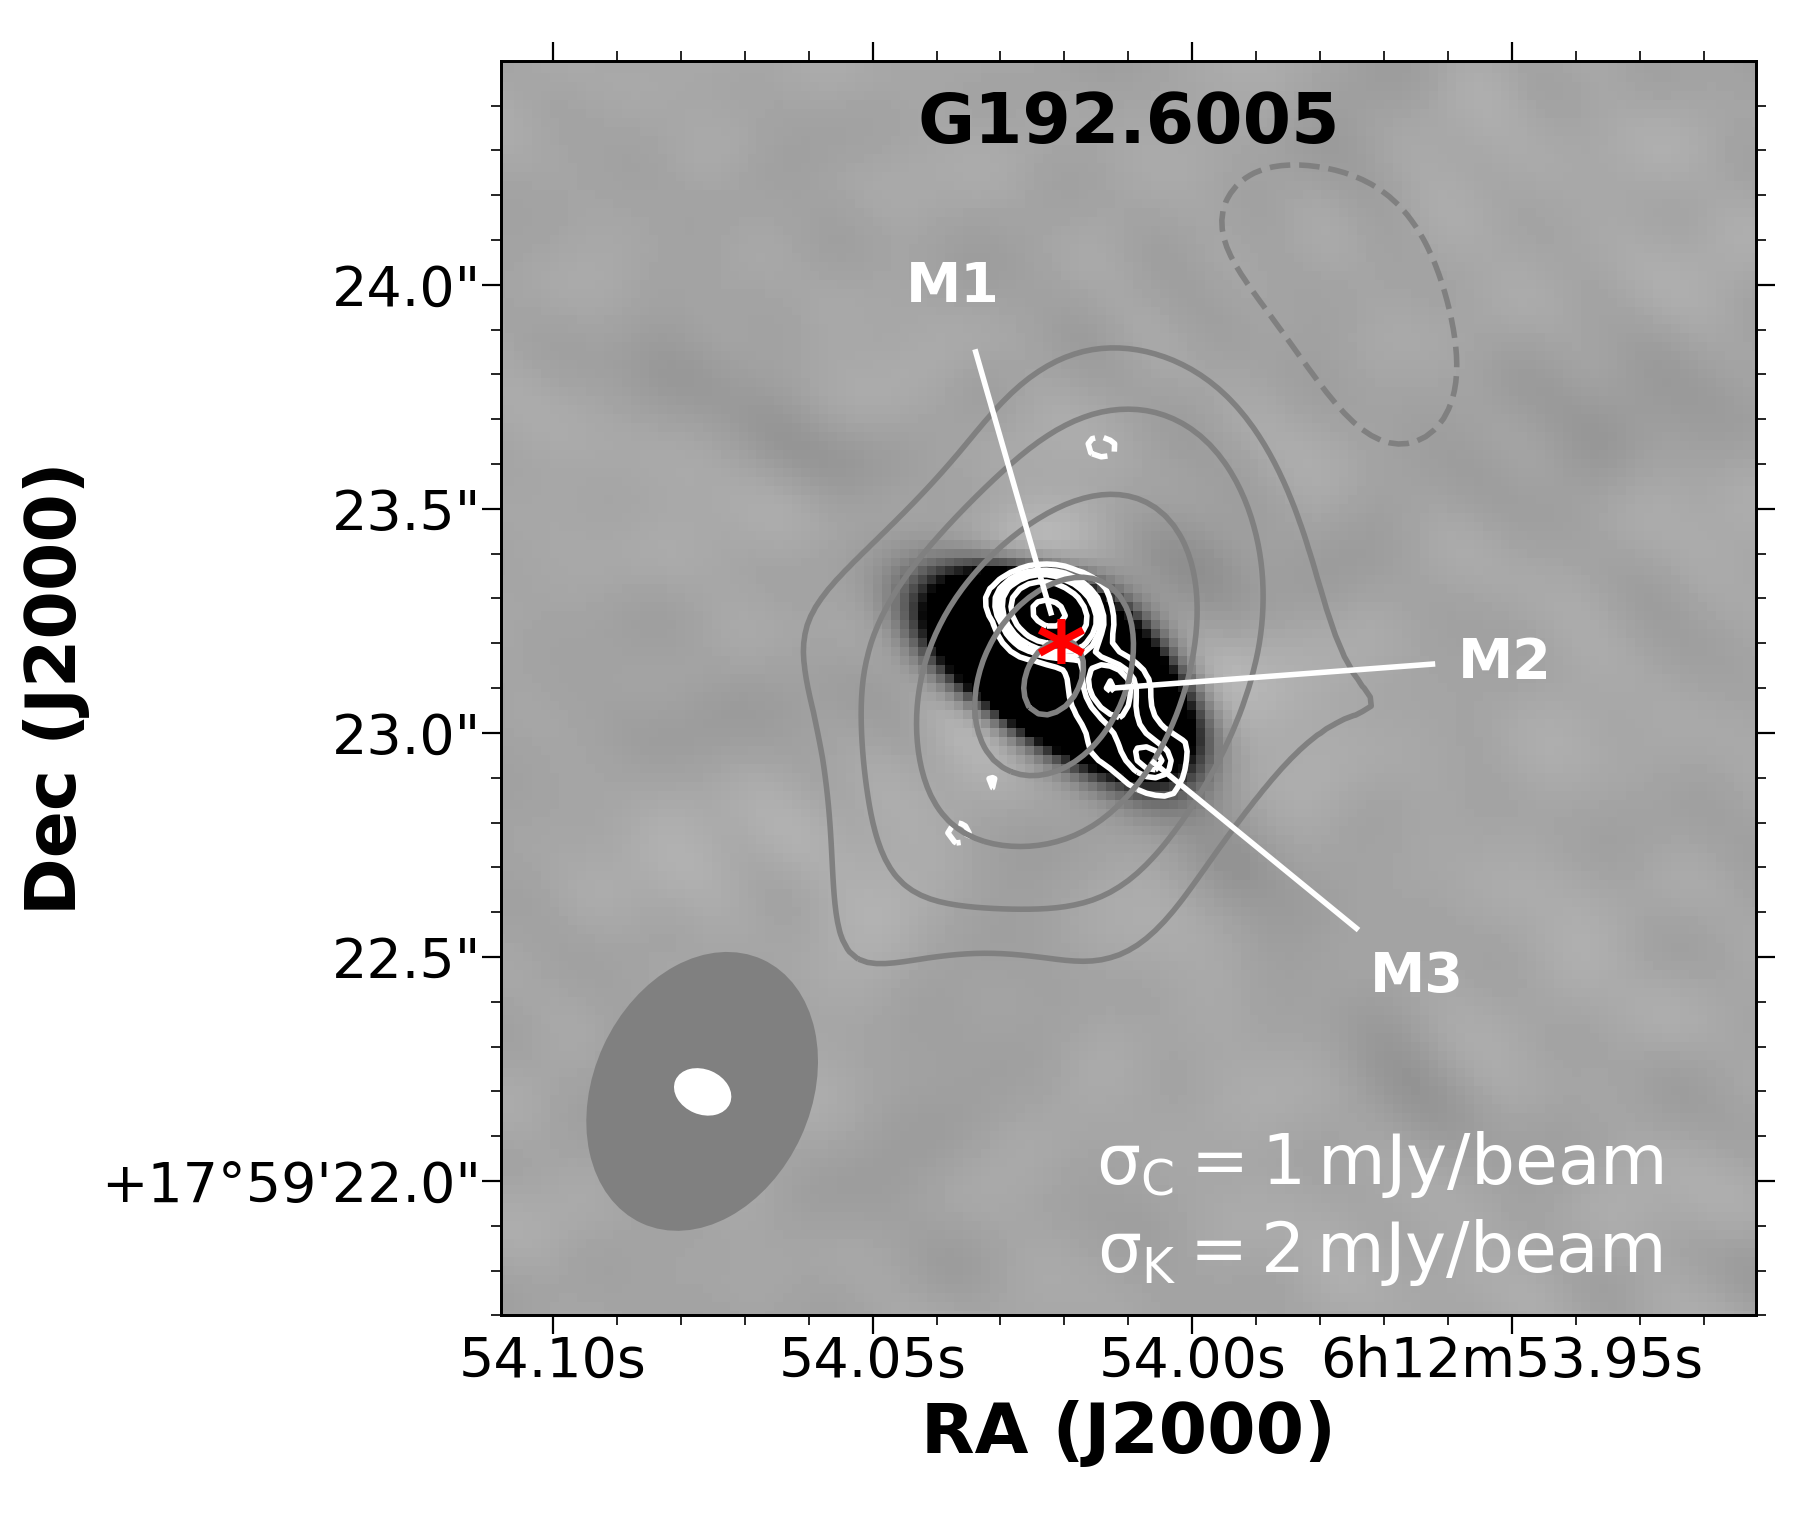
In addition to continuum emission, S255 NIRS 3 radiates 6.7 GHz methanol maser emission and 22.2 GHz water maser emission. Contour maps of the intensities of the water and methanol maser emission for the 2018 observation are shown in Figure 9. The methanol maser is marginally resolved and does not show a clear morphology, however, the water masers trace a resolved structure that is well-aligned with the continuum emission. Moscadelli et al. (2017) compared the locations of the 6.7 GHz methanol maser, before and during outburst, and noticed that most of the maser locations were farther away from the core during outburst, implying a change in the circumstellar environment of the source (Cesaroni et al., 2018). Szymczak et al. (2018) analysed data, collected through long-term monitoring of 6.7 GHz methanol maser emission from S255 NIRS 3, reporting a rise in its intensity in two epochs. In the 2018 observation, the flux density of the emission is 43.42.7 mJy, a value lower than the average flux of the radiation during quiescence. The intensity map of the water masers displays three peaks which are potential locations of the jets’ knots. The peaks are arranged in a linear fashion with angular separation between M1, M2 and M3 displaying a quasi-regular pattern, implying that the processes that are responsible for their formation may be semi-regular; i.e., periodic ejection or precession.
The mass-loss rate of S255 NIRS3 was calculated using the C-band flux of 2018 and compared with its rate before the outburst (Purser et al. 2020 in prep). In the calculations, the jet parameters that were adopted in Cesaroni et al. (2018) were used i.e a terminal velocity km s-1, ionisation fraction and an inclination angle of 85o, giving a comparable mass loss rate of . This rate is approximately an order of magnitude higher than its rate during quiescence i.e (Purser et al. 2020 in prep). Assuming implies an accretion rate which is lower than the estimate from Caratti o Garatti et al. (2017), suggesting that the factor of 10% under-estimates accretion rates. Indeed Hartigan et al. (1994) finds the ratio to be 1% in low mass stars, a value that generates a rate that is comparable to Caratti o Garatti et al. (2017).
Radio lobes in G192.6005-00.0479
Four radio sources, D, F, G and J, were found to have negative spectral indices, typical of non-thermal lobes. They are also aligned in a direction similar to the orientation of the radio emission of A and infrared emission in the field. This implies that they are lobes of a jet emanating from core A. Sources B and K, located to the north of A, are its closest neighbours, however, the location of B and spectral index of K are inconsistent with lobes of a jet driven by A. B is misaligned with the jet and K is a thermal radio source of spectral index . The spectral index of B, , shows that it is a non-thermal lobe, however, its associated core is unclear.
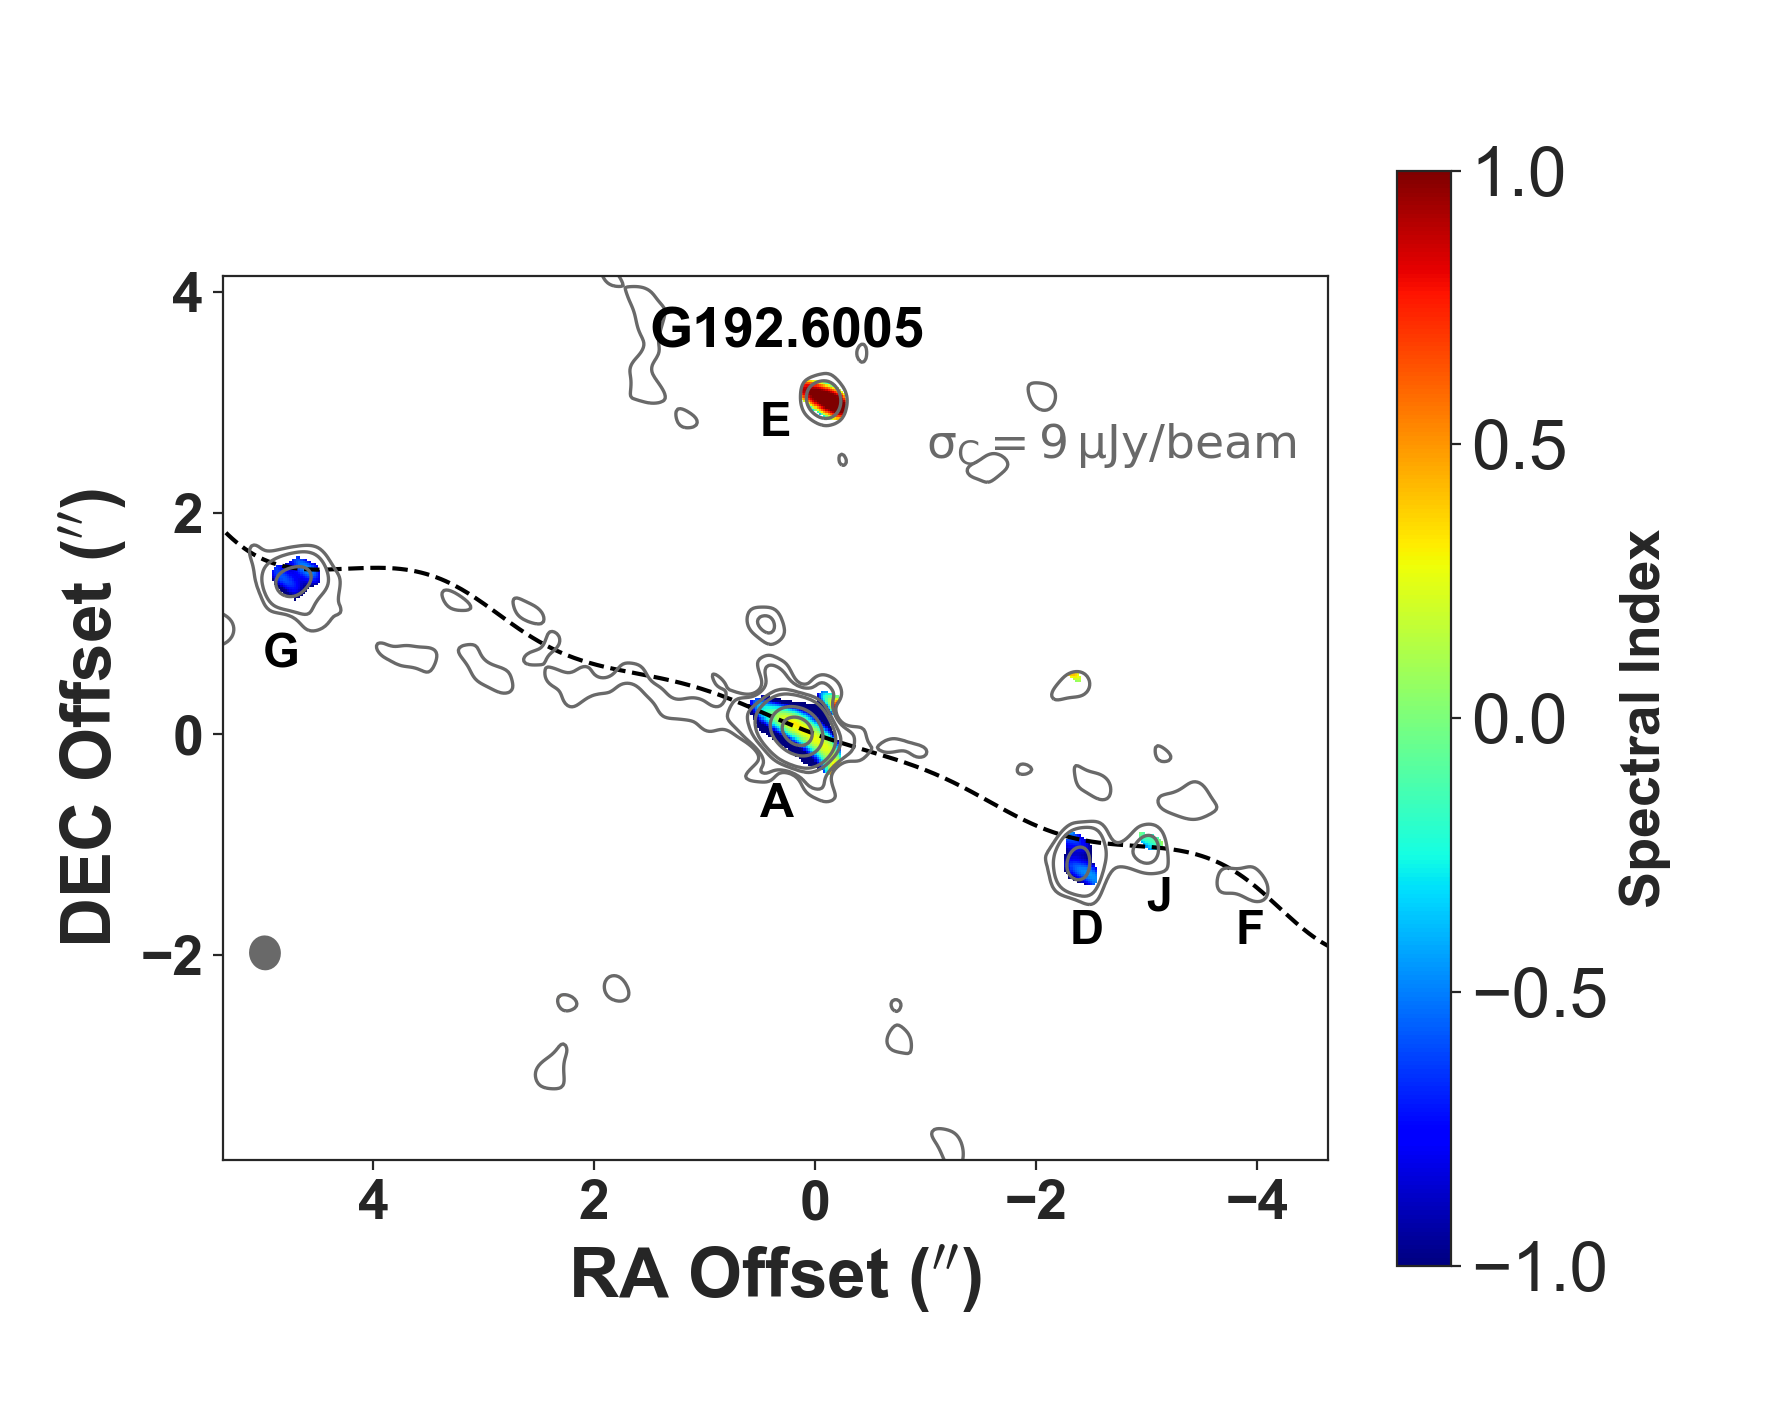
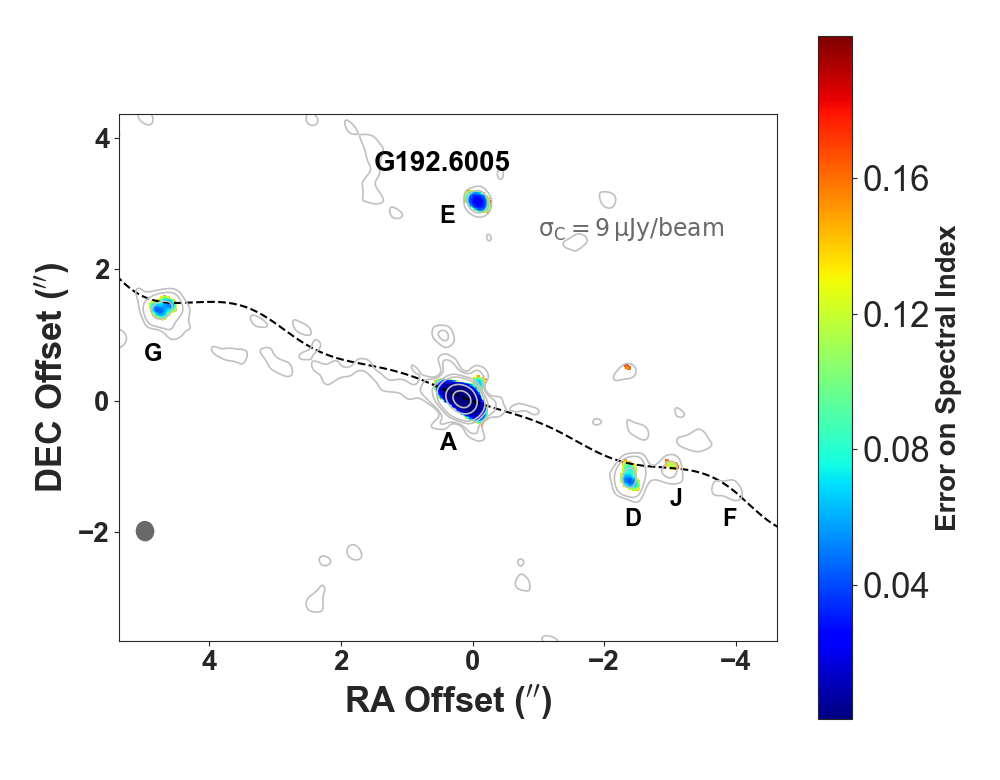
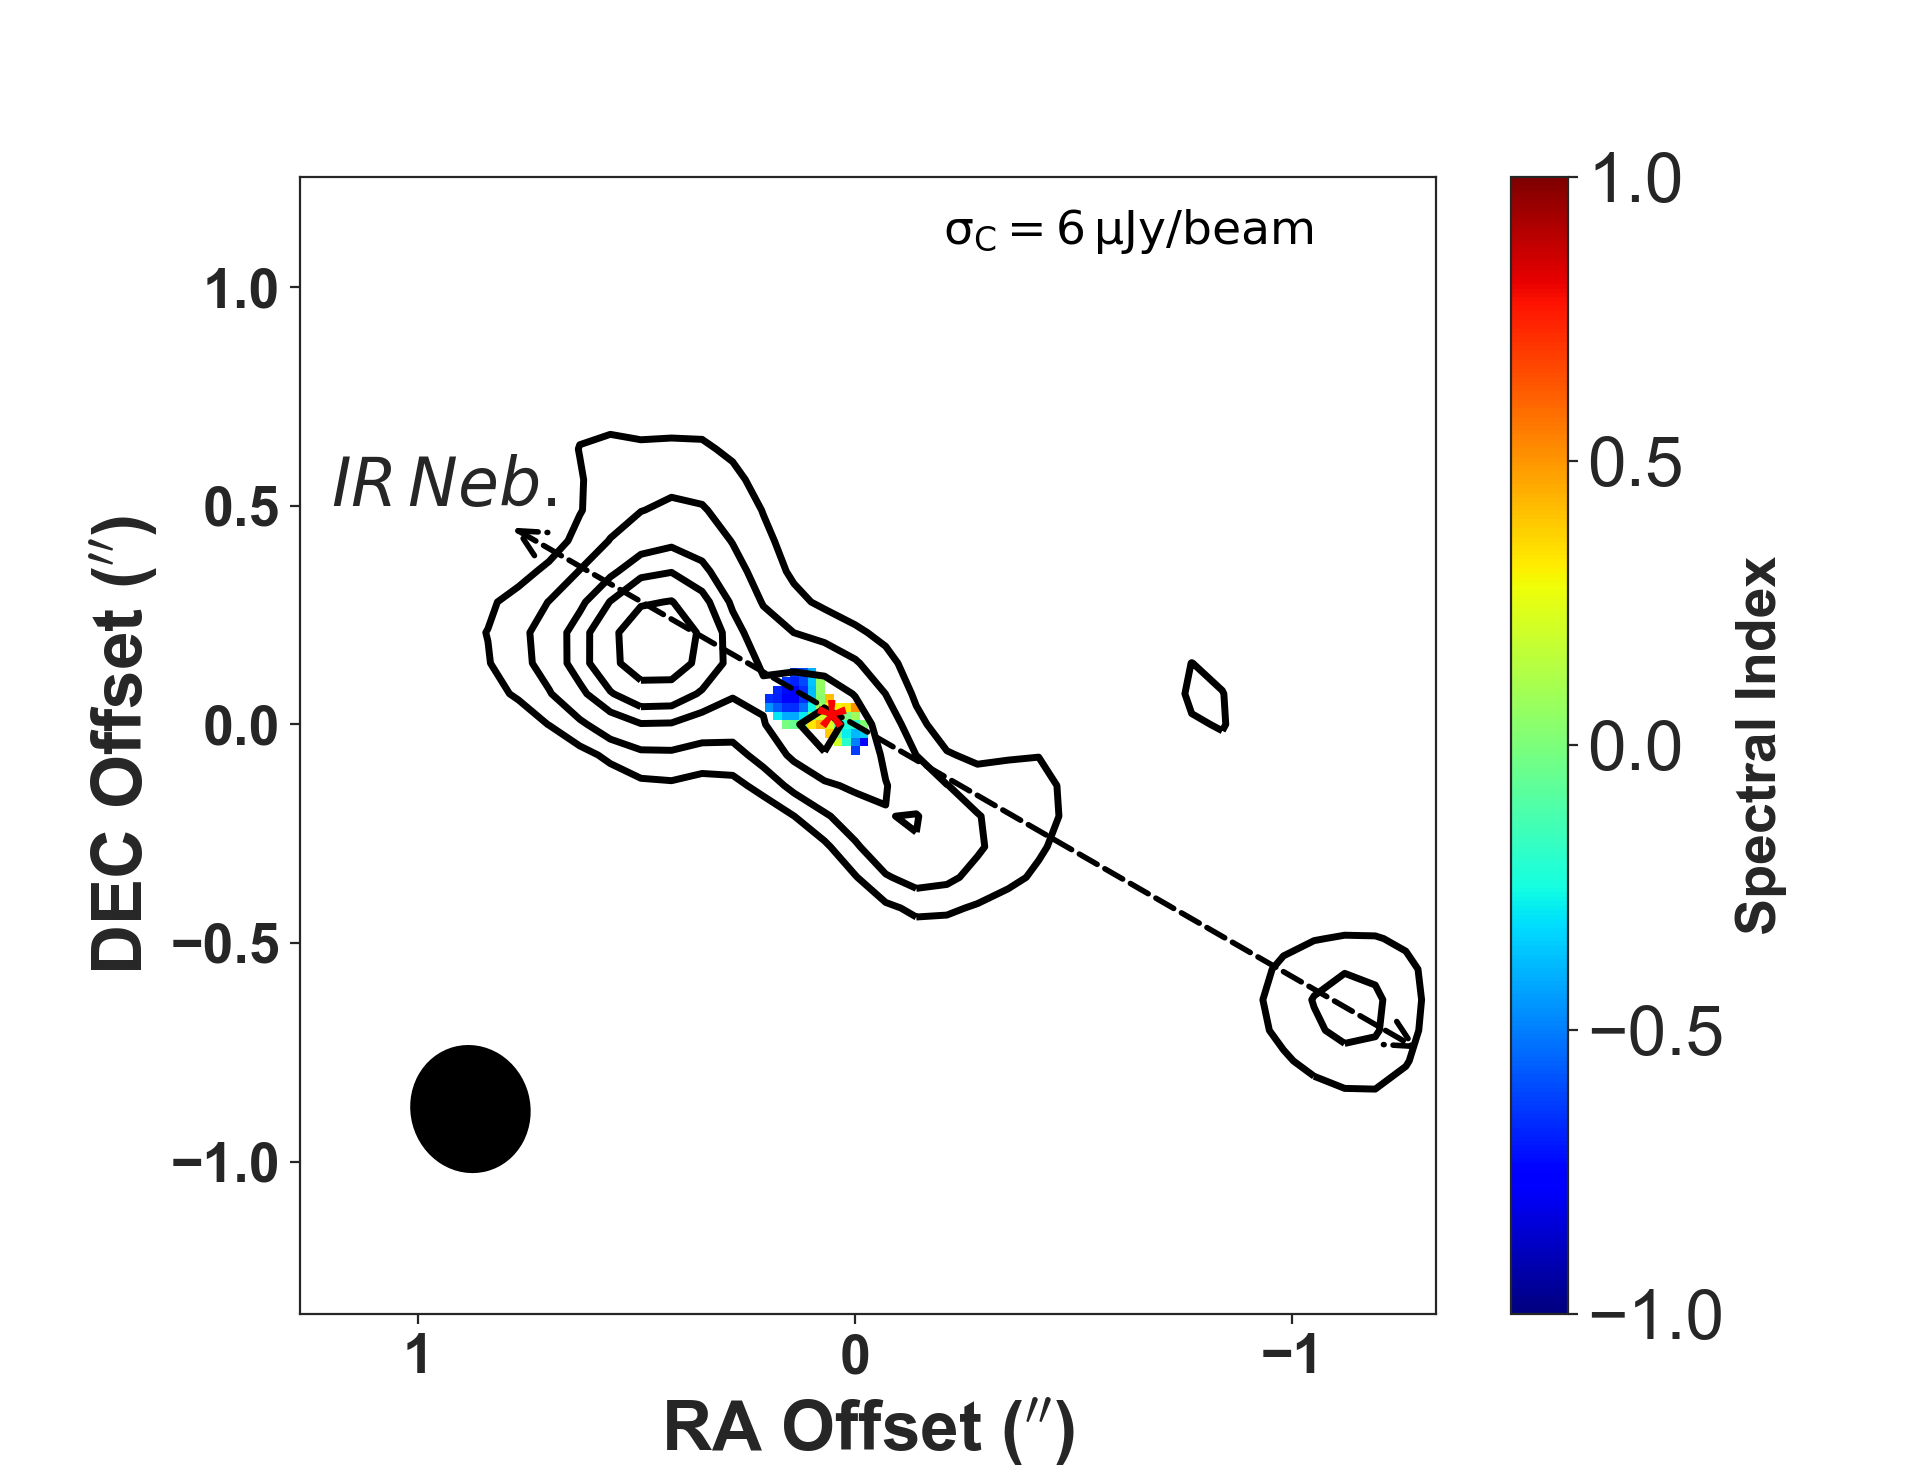
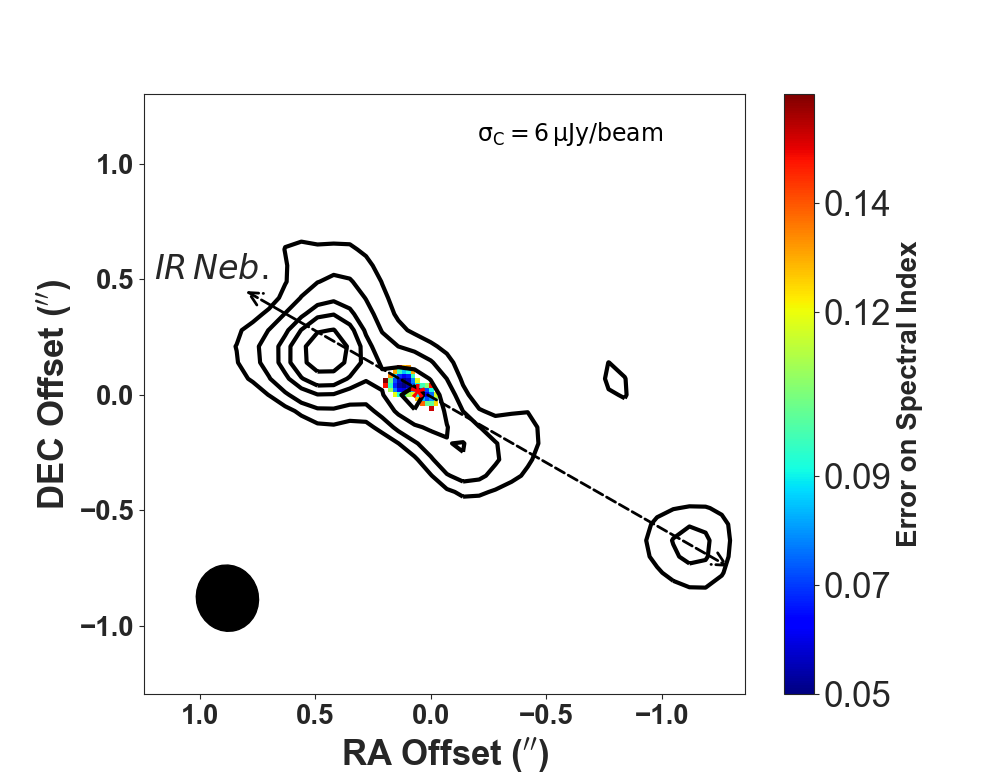
A spectral index map of the field was generated from C- and K- band data of similar uv coverage. The full uv-coverage of C- and K- band data are k and k respectively, however, the overlap which occurs at 38-950k was used. The map, shown in Figure 10, reveals the thermal core A and two non-thermal lobes, G and D. The orientations of G and D, at K-band, are perpendicular to the direction of the flow of jet particles, and . The misalignment of some of the radio lobes, e.g, D, J and F, also suggests precession. The precession model in equation 1 for a jet of precession angle and period 50 years seems to fit the distribution of the radio sources (see Figure 10), assuming that the jet drives out mass at a velocity 500 kms-1 and has an inclination angle 90∘.
Considering that the bow shocks, G and D, may be internal and not terminating shocks, it is not possible to estimate the kinematic length and age of the jet with certainty. However, the angular separations of D and G from core A are 2.5′′ and 4.8′′ respectively, translating to physical distances of 0.02 pc and 0.04 pc respectively. Assuming a jet velocity of 500 kms-1 implies that it took 39 years and 78 years for the jet particles to travel from the core to D and G respectively. Their minimum energy and minimum magnetic field strengths, calculated from the equipartition theorem (Ainsworth et al., 2014) are 4.51041 ergs and 1.1 mG respectively. In both F and J, the minimum B-field is 0.8 mG while their minimum energies are 2.31041 ergs and 2.11041 ergs respectively.
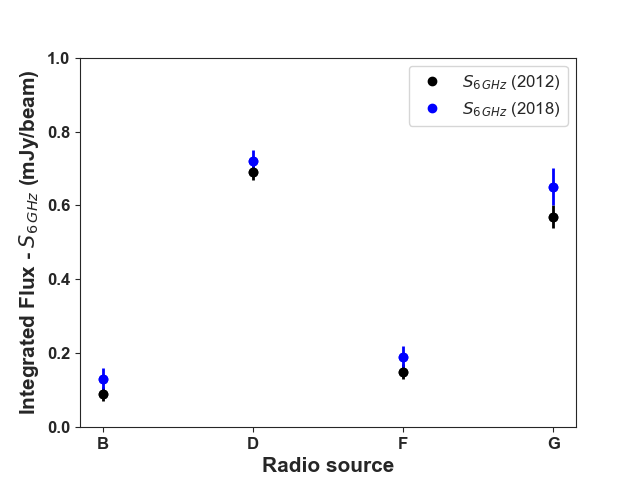
The peak emissions of C and D in 2018 displayed slight angular displacements from their 2012 positions, however, the fluxes of all the lobes did not show any significant change (see Figure 11). Adjacent to lobe D is a new lobe labelled J. This lobe was not detected in 2012 (Purser, 2017) and may be a new condensation, stemming out of D. The flux of D in 2012 was compared with the sum of the fluxes of D and J in 2018 since J may be part of D in the 2012 observation. The angular displacements of the peaks of C and D were found to be 0.2′′ and 0.14′′, translating to proper motions of 316 kms-1 and 22020 kms-1 respectively, at the distance of the core, 1.8 kpc.
3.2.5 G196.454201.6777
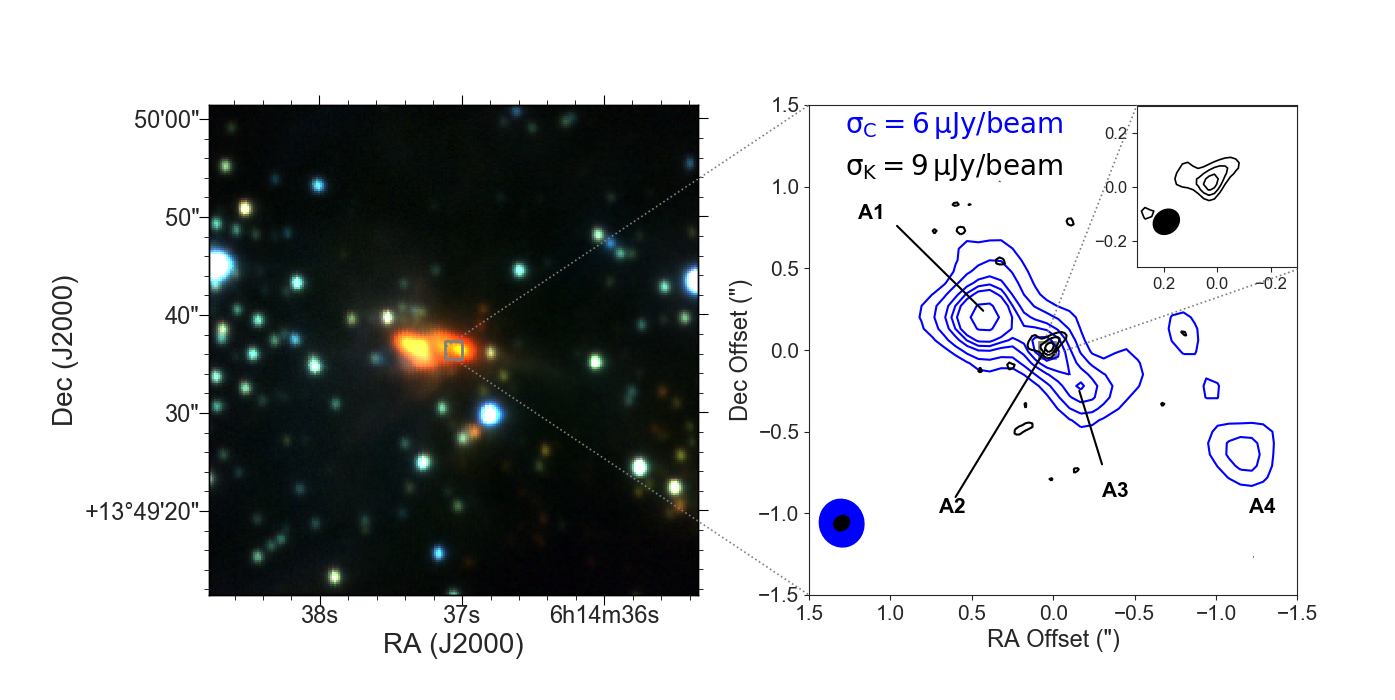
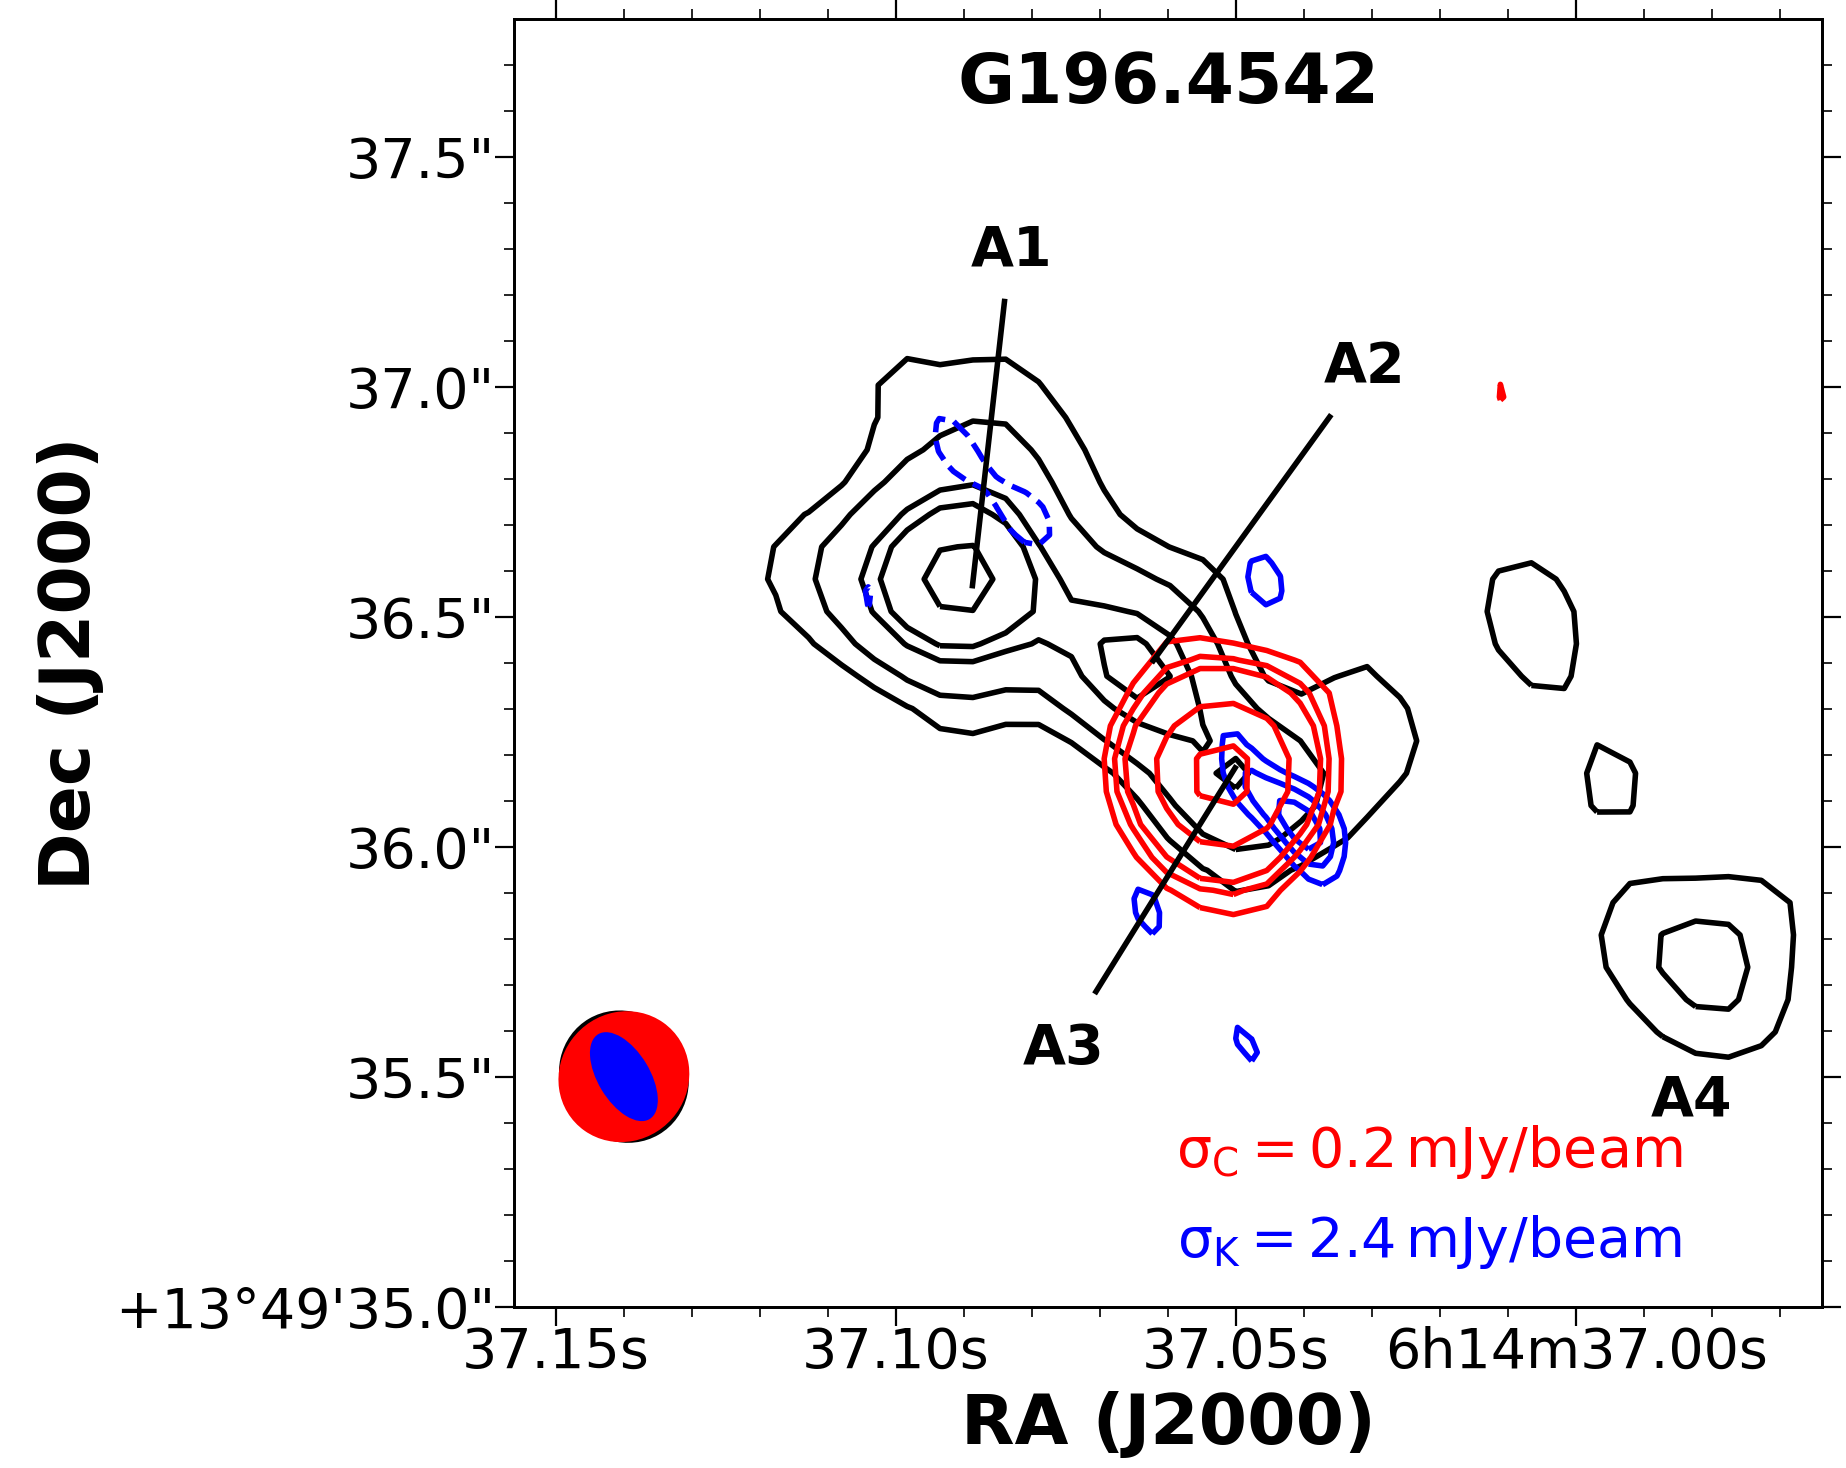
Our C-band map of this source, the star-forming region S269 (Jiang et al., 2003), is shown in Figure 12. It shows emission from four compact radio sources, A1-A4, with a weak extended emission surrounding A1-A3. The orientation of the C-band emission is comparable to the alignment of infrared emission in the field, suggesting that A1, A2, A3 and A4 are components of a jet aligned in the same direction. A near infrared study of the region by Jiang et al. (2003) also detected H2 emission knots that are aligned in a NE-SW direction. A2 was detected at both C- and K-bands while A1, A3 and A4 were only detected at C-band, implying that A2 is the core of the jet and A1, A3 and A4 are its non-thermal lobes. The spectral index map of the field, derived from images of similar uv-coverage, also confirms that A2 is the core while the rest are non-thermal lobes (see Figure 13). A list of the radio sources, their flux densities and spectral indices is given in Table 8. The radio sources do not show significant changes in flux or position except the flux of A1 which dropped by 25%.
Besides continuum emission, radiation from methanol (6.7 GHz) and water (22.2 GHz) masers was also detected. The methanol and water maser’s flux densities are 6.40.4 mJy and 347 mJy respectively. Their peaks are located 0.3 ′′ and 0.5 ′′ to the SW of the core. The peak of the 6.7 GHz emission coincides with the location of A3 while that of the 22.2 GHz emission manifests an elongation that extends from A3 towards the SW (see Figure 14). These masers appear to trace the the outer parts of the jet, away from the core.
w
| Object | Position | Integrated Flux (mJy) | Nature | |||
|---|---|---|---|---|---|---|
| Dec | RA | C-band | K-band | |||
| A1 | 06h14′37.09′′ | +013∘49′36.6′′ | 0.300.02 | 0.08 | -1.33 | Lobe |
| A2 | 06h14′37.06′′ | +013∘49′36.4′′ | 0.100.02 | 0.130.02 | Core | |
| A3 | 06h14′37.05′′ | +013∘49′36.2′′ | 0.090.02 | Lobe | ||
| A4 | 06h14′36.98′′ | +013∘49′35.8′′ | 0.070.02 | Lobe | ||
4 Conclusions
We present new JVLA observations of five protostellar jets at C- and K-bands. Four of the jets manifest variability in flux, position or both except G173.4839. All the jets have thermal cores whose positions are relatively fixed. However, their lobes are transitional objects that undergo noticeable positional variability. The proper motions of the jet knots/lobes show a wide range of velocities. The minimum and maximum estimates of their proper motions were found to be 17070 kms-1 and 65050 kms-1 respectively. In some jets, e.g. in , the proper motion of the lobes was found to show a spread, implying that the lobes undergo periods of acceleration and deceleration as they move away from the core. A keen look at the change in the position of the lobes suggests that they move both radially and tangentially manifesting precession, e.g in and , most likely due to close binary interaction.
The fluxes of both cores and lobes of some of the jets also displayed variability. Flux variability in the cores can be attributed to accretion activities while in lobe, diffusion and recombination of ionized particles can result in lower fluxes. Lobe K8 of G133.7150 displayed the largest change in flux, perhaps due to an instance of merger with a subsequent lobe. Conversely, higher magnetic flux density and energised flow can result in a higher radio flux. Of the four MYSOs, flux variability was strongest in S255 NIRS3 which was in outburst. The opacity of its emission was found to decrease with time, consistent with a model of an expanding jet bubble. Similarly, emission from a new non-thermal lobe that is emerging from a core whose emission enshrouds that of the lobe has the potential to account for the increase in flux and a decrease in the spectral index of the outburst. Predictions suggest that the outburst is either plateauing or declining. The mass-loss rate (Reynolds, 1986) of S255 NIRS3 during outburst shows that massive protostars are capable of attaining the high accretion rates (Hartigan et al., 1994) needed to overcome radiation pressure through accretion bursts.
5 Acknowledgement
Special thanks to the UK’s Science and Technology Facilities Council (STFC) who supported the research through WOO’s PhD studentship under the DARA project-grant number ST/M007693/1. We are also grateful to Prof R. Cesaroni for sharing their January 2018 observation with us.
6 Data Availability
Data Availability Statement: The data underlying this paper are available at the JVLA Data Archive: https://archive.nrao.edu/archive/advquery.jsp
References
- Ainsworth et al. (2014) Ainsworth, R. E., Scaife, A. M. M., Ray, T. P., Taylor, A. M., Green, D. A., & Buckle, J. V. 2014, ApJ, 792, L18
- Avedisova (2002) Avedisova, V. S. 2002, VizieR Online Data Catalog, V/112A
- Beuther et al. (2007) Beuther, H., Leurini, S., Schilke, P., Wyrowski, F., Menten, K. M., & Zhang, Q. 2007, A&A, 466, 1065
- Beuther et al. (2002) Beuther, H., Schilke, P., Gueth, F., McCaughrean, M., Andersen, M., Sridharan, T. K., & Menten, K. M. 2002, A&A, 387, 931
- Briggs (1995) Briggs, D. S. 1995, in Bulletin of the American Astronomical Society, Vol. 27, American Astronomical Society Meeting Abstracts, 1444
- Burns et al. (2016) Burns, R. A., Handa, T., Nagayama, T., Sunada, K., & Omodaka, T. 2016, MNRAS, 460, 283
- Caratti o Garatti et al. (2009) Caratti o Garatti, A., Eislöffel, J., Froebrich, D., Nisini, B., Giannini, T., & Calzoletti, L. 2009, A&A, 502, 579
- Caratti o Garatti et al. (2017) Caratti o Garatti, A., Stecklum, B., Garcia Lopez, R., Eislöffel, J., Ray, T. P., Sanna, A., Cesaroni, R., Walmsley, C. M., Oudmaijer, R. D., de Wit, W. J., Moscadelli, L., Greiner, J., Krabbe, A., Fischer, C., Klein, R., & Ibañez, J. M. 2017, Nature Physics, 13, 276
- Carrasco-González et al. (2015) Carrasco-González, C., Torrelles, J. M., Cantó, J., Curiel, S., Surcis, G., Vlemmings, W. H. T., van Langevelde, H. J., Goddi, C., Anglada, G., Kim, S.-W., Kim, J.-S., & Gómez, J. F. 2015, Science, 348, 114
- Cesaroni et al. (2018) Cesaroni, R., Moscadelli, L., Neri, R., Sanna, A., Caratti o Garatti, A., Eisloffel, J., Stecklum, B., Ray, T., & Walmsley, C. M. 2018, A&A, 612, A103
- Choi et al. (2014) Choi, M., Lee, J.-E., & Kang, M. 2014, ApJ, 789, 9
- Clarke et al. (2006) Clarke, A. J., Lumsden, S. L., Oudmaijer, R. D., Busfield, A. L., Hoare, M. G., Moore, T. J. T., Sheret, T. L., & Urquhart, J. S. 2006, A&A, 457, 183
- Claussen et al. (1994) Claussen, M. J., Gaume, R. A., Johnston, K. J., & Wilson, T. L. 1994, ApJ, 424, L41
- Contreras Peña et al. (2017) Contreras Peña, C., Lucas, P. W., Minniti, D., Kurtev, R., Stimson, W., Navarro Molina, C., Borissova, J., Kumar, M. S. N., Thompson, M. A., Gledhill, T., Terzi, R., Froebrich, D., & Caratti o Garatti, A. 2017, MNRAS, 465, 3011
- Cooper et al. (2013) Cooper, H. D. B., Lumsden, S. L., Oudmaijer, R. D., Hoare, M. G., Clarke, A. J., Urquhart, J. S., Mottram, J. C., Moore, T. J. T., & Davies, B. 2013, MNRAS, 430, 1125
- Curiel et al. (2006) Curiel, S., Ho, P. T. P., Patel, N. A., Torrelles, J. M., Rodríguez, L. F., Trinidad, M. A., Cantó, J., Hernández, L., Gómez, J. F., & Garay, G. 2006, ApJ, 638, 878
- Dougherty et al. (2003) Dougherty, S. M., Pittard, J. M., Kasian, L., Coker, R. F., Williams, P. M., & Lloyd, H. M. 2003, A&A, 409, 217
- Eisloffel et al. (1996) Eisloffel, J., Smith, M. D., Davis, C. J., & Ray, T. P. 1996, AJ, 112, 2086
- Forbrich et al. (2006) Forbrich, J., Preibisch, T., & Menten, K. M. 2006, A&A, 446, 155
- Fujisawa et al. (2015) Fujisawa, K., Yonekura, Y., Sugiyama, K., Horiuchi, H., Hayashi, T., Hachisuka, K., Matsumoto, N., & Niinuma, K. 2015, The Astronomer’s Telegram, 8286, 1
- Ginsburg et al. (2009) Ginsburg, A. G., Bally, J., Yan, C.-H., & Williams, J. P. 2009, ApJ, 707, 310
- Hartigan et al. (1994) Hartigan, P., Morse, J. A., & Raymond, J. 1994, ApJ, 436, 125
- Honma et al. (2007) Honma, M., Bushimata, T., Choi, Y. K., Hirota, T., Imai, H., Iwadate, K., Jike, T., Kameya, O., Kamohara, R., Kan-Ya, Y., Kawaguchi, N., Kijima, M., Kobayashi, H., Kuji, S., Kurayama, T., Manabe, S., Miyaji, T., Nagayama, T., Nakagawa, A., Oh, C. S., Omodaka, T., Oyama, T., Sakai, S., Sato, K., Sasao, T., Shibata, K. M., Shintani, M., Suda, H., Tamura, Y., Tsushima, M., & Yamashita Kazuyoshi. 2007, PASJ, 59, 889
- Hunter et al. (2017) Hunter, T. R., Brogan, C. L., MacLeod, G., Cyganowski, C. J., Chandler, C. J., Chibueze, J. O., Friesen, R., Indebetouw, R., Thesner, C., & Young, K. H. 2017, ApJ, 837, L29
- Imai et al. (2000) Imai, H., Kameya, O., Sasao, T., Miyoshi, M., Deguchi, S., Horiuchi, S., & Asaki, Y. 2000, ApJ, 538, 751
- Jiang et al. (2003) Jiang, Z., Yao, Y., Yang, J., Baba, D., Kato, D., Kurita, M., Nagashima, C., Nagata, T., Nagayama, T., Nakajima, Y., Ishii, M., Tamura, M., & Sugitani, K. 2003, ApJ, 596, 1064
- Kawamura et al. (1998) Kawamura, A., Onishi, T., Yonekura, Y., Dobashi, K., Mizuno, A., Ogawa, H., & Fukui, Y. 1998, ApJS, 117, 387
- Krumholz et al. (2009) Krumholz, M. R., Klein, R. I., McKee, C. F., Offner, S. S. R., & Cunningham, A. J. 2009, Science, 323, 754
- Ladeyschikov et al. (2016) Ladeyschikov, D. A., Kirsanova, M. S., Tsivilev, A. P., & Sobolev, A. M. 2016, Astrophysical Bulletin, 71, 208
- Lindfors et al. (2006) Lindfors, E. J., Türler, M., Valtaoja, E., Aller, H., Aller, M., Mazin, D., Raiteri, C. M., Stevens, J. A., Tornikoski, M., Tosti, G., & Villata, M. 2006, A&A, 456, 895
- Liu et al. (2018) Liu, S.-Y., Su, Y.-N., Zinchenko, I., Wang, K.-S., & Wang, Y. 2018, ApJ, 863, L12
- Marti et al. (1995) Marti, J., Rodriguez, L. F., & Reipurth, B. 1995, ApJ, 449, 184
- McMullin et al. (2007) McMullin, J. P., Waters, B., Schiebel, D., Young, W., & Golap, K. 2007, in Astronomical Society of the Pacific Conference Series, Vol. 376, Astronomical Data Analysis Software and Systems XVI, ed. R. A. Shaw, F. Hill, & D. J. Bell, 127
- Minier et al. (2000) Minier, V., Booth, R. S., & Conway, J. E. 2000, A&A, 362, 1093
- Monet et al. (2010) Monet, D. G., Jenkins, J. M., Dunham, E. W., Bryson, S. T., Gilliland, R. L., Latham, D. W., Borucki, W. J., & Koch, D. G. 2010, arXiv e-prints, arXiv:1001.0305
- Moscadelli et al. (2017) Moscadelli, L., Sanna, A., Goddi, C., Walmsley, M. C., Cesaroni, R., Caratti o Garatti, A., Stecklum, B., Menten, K. M., & Kraus, A. 2017, A&A, 600, L8
- Navarete et al. (2015) Navarete, F., Damineli, A., Barbosa, C. L., & Blum, R. D. 2015, MNRAS, 450, 4364
- Navarete et al. (2019) Navarete, F., Galli, P. A. B., & Damineli, A. 2019, MNRAS, 487, 2771
- Obonyo et al. (2019) Obonyo, W. O., Lumsden, S. L., Hoare, M. G., Purser, S. J. D., Kurtz, S. E., & Johnston, K. G. 2019, MNRAS, 486, 3664
- Paron et al. (2016) Paron, S., Fariña, C., & Ortega, M. E. 2016, A&A, 593, A132
- Proven-Adzri et al. (2019) Proven-Adzri, E., MacLeod, G. C., Heever, S. P. v. d., Hoare, M. G., Kuditcher, A., & Goedhart, S. 2019, MNRAS, 487, 2407
- Purser (2017) Purser, S. J. D. 2017, PhD thesis, University of Leeds
- Purser et al. (2016) Purser, S. J. D., Lumsden, S. L., Hoare, M. G., Urquhart, J. S., Cunningham, N., Purcell, C. R., Brooks, K. J., Garay, G., Gúzman, A. E., & Voronkov, M. A. 2016, MNRAS, 460, 1039
- Reynolds (1986) Reynolds, S. P. 1986, ApJ, 304, 713
- Sanna et al. (2019) Sanna, A., Moscadelli, L., Goddi, C., Beltrán, M., Brogan, C. L., Caratti o Garatti, A., Carrasco-González, C., Hunter, T. R., Massi, F., & Padovani, M. 2019, A&A, 623, L3
- Snell et al. (1990) Snell, R. L., Dickman, R. L., & Huang, Y. L. 1990, ApJ, 352, 139
- Stecklum et al. (2016) Stecklum, B., Caratti o Garatti, A., Cardenas, M. C., Greiner, J., Kruehler, T., Klose, S., & Eisloeffel, J. 2016, The Astronomer’s Telegram, 8732, 1
- Suters et al. (1996) Suters, M., Stewart, R. T., Brown, A., & Zealey, W. 1996, AJ, 111, 320
- Szymczak et al. (2018) Szymczak, M., Olech, M., Wolak, P., Gérard, E., & Bartkiewicz, A. 2018, A&A, 617, A80
- Tapia et al. (2015) Tapia, M., Roth, M., & Persi, P. 2015, MNRAS, 446, 4088
- Teixeira et al. (2018) Teixeira, G. D. C., Kumar, M. S. N., Smith, L., Lucas, P. W., Morris, C., Borissova, J., Monteiro, M. J. P. F. G., Caratti o Garatti, A., Contreras Peña, C., Froebrich, D., & Gameiro, J. F. 2018, A&A, 619, A41
- Thomas et al. (2013) Thomas, N. H., Hora, J. L., & Smith, H. A. 2013, in American Astronomical Society Meeting Abstracts, Vol. 221, American Astronomical Society Meeting Abstracts #221, 256.26
- Tieftrunk et al. (1997) Tieftrunk, A. R., Gaume, R. A., Claussen, M. J., Wilson, T. L., & Johnston, K. J. 1997, A&A, 318, 931
- Türler et al. (2000) Türler, M., Courvoisier, T. J. L., & Paltani, S. 2000, A&A, 361, 850
- van der Tak et al. (2005) van der Tak, F. F. S., Tuthill, P. G., & Danchi, W. C. 2005, A&A, 431, 993
- Varricatt et al. (2010) Varricatt, W. P., Davis, C. J., Ramsay, S., & Todd, S. P. 2010, MNRAS, 404, 661
- Vorobyov & Basu (2006) Vorobyov, E. I. & Basu, S. 2006, ApJ, 650, 956
- Walker (1997) Walker, R. C. 1997, ApJ, 488, 675
- Wilson et al. (2003) Wilson, T. L., Boboltz, D. A., Gaume, R. A., & Megeath, S. T. 2003, ApJ, 597, 434
- Wynn-Williams et al. (1972) Wynn-Williams, C. G., Becklin, E. E., & Neugebauer, G. 1972, MNRAS, 160, 1
- Zhu et al. (2009) Zhu, Z., Hartmann, L., & Gammie, C. 2009, ApJ, 694, 1045