Underwater image filtering: methods, datasets and evaluation
Abstract
Underwater images are degraded by the selective attenuation of light that distorts colours and reduces contrast. The degradation extent depends on the water type, the distance between an object and the camera, and the depth under the water surface the object is at. Underwater image filtering aims to restore or to enhance the appearance of objects captured in an underwater image. Restoration methods compensate for the actual degradation, whereas enhancement methods improve either the perceived image quality or the performance of computer vision algorithms. The growing interest in underwater image filtering methods–including learning-based approaches used for both restoration and enhancement–and the associated challenges call for a comprehensive review of the state of the art. In this paper, we review the design principles of filtering methods and revisit the oceanology background that is fundamental to identify the degradation causes. We discuss image formation models and the results of restoration methods in various water types. Furthermore, we present task-dependent enhancement methods and categorise datasets for training neural networks and for method evaluation. Finally, we discuss evaluation strategies, including subjective tests and quality assessment measures. We complement this survey with a platform (https://puiqe.eecs.qmul.ac.uk/), which hosts state-of-the-art underwater filtering methods and facilitates comparisons.
1 Introduction
Images taken in water are degraded by the selective attenuation of light, which causes colour casts and blurring [1, 2, 3]. Light attenuation reduces the illuminant on objects and the intensity of the reflected light reaching the camera [4, 5]. The extent of the degradation depends on the depth of an object under the water surface, its distance from the camera and the water composition [6, 7, 1]. While artificial lighting can be used to compensate for the attenuated illuminant, this further degrades the image with a spherical overexposed area and an increased backscattering from suspended particles.
Underwater image filtering methods can be used to restore or enhance the content of an image. Restoration methods use a physics-based model [8, 9] to compensate for the effects of degradation in underwater images [10, 11, 12, 13, 14, 15, 16, 17, 18, 19, 20, 21, 22, 23, 24, 25, 26]. Some methods need special devices such as polarisation filters [10, 11] or require the knowledge of the distance between the objects and the camera [20]. Furthermose, only a few methods compensate for the degradation through the depth [20, 23, 21]. Enhancement methods modify colours and contrast either to improve the perceive quality of an image [27, 28, 29, 30, 31, 32, 33, 34, 35, 36, 37, 38, 39, 40] or to improve the performance of computer vision algorithms [41, 42, 43, 44, 45, 46, 47, 48, 49]. In recent years, learning-based methods that use neural networks have gained increasing popularity [50, 51, 52, 53, 54, 55, 56, 57, 58, 59, 60, 61, 62, 63]. The results of these methods heavily depend on the images used in training. However, images appropriate for the filtering purpose are difficult to generate, select or synthesise.
In this paper, we categorise, analyse and compare underwater image filtering methods for restoration and enhancement. We discuss the merits and limitations of these methods and of the evaluation measures used for their validation. We also revisit the fundamental oceanology knowledge to understand the causes of degradation in the water medium and present how degraded images can be modelled (Sec. 2). We discuss methods for restoration (Sec. 3) and enhancement (Sec. 4), and then focus specifically on those based on neural networks (Sec. 5). Moreover, we discuss commonly employed datasets (Sec. 6) and evaluation approaches (Sec. 7), and their limitations. Finally, we discuss open problems and future research directions (Sec. 8). We complement our survey with an online Platform for Underwater Image Quality Evaluation (PUIQE) [64], which enables testing the filtering methods and evaluation measures covered in this survey. The novelty of this survey is highlighted in Table I, which summarises and compares ours with previous surveys on this topic [65, 66, 67, 68, 69, 70, 71, 72].
2 Image formation in water
In this section, we revisit the physics of degradations caused by the water medium and discuss underwater image formation models.
2.1 What degrades underwater images?
Light attenuation reduces by absorption the intensity of light travelling through a medium and redirects by scattering its propagation [1]. This attenuation causes colour cast and blurring. Absorption reduces the intensity of ambient light that illuminates objects and affects the observed water colour that is related to the ambient light at depth [3]. The longer the distance the light travels, the more it is absorbed. Absorption also reduces the light reflected by objects along the object-camera distance [7], which in this paper we refer to as the range. Molecules and particles suspended in water change the direction of propagation of the light. This scattering increases the spatial width of the light beam along the range, thus blurring edges and details of the captured objects [73].
Water environments can be classified into two main categories, namely oceanic and coastal waters, according to the Jerlov system [3], which considers light transmittance across one metre of water. In oceanic waters red is the most attenuated colour channel, whereas in coastal waters blue is the most attenuated colour channel. Oceanic and coastal waters are in turn divided into five subcategories, totalling 10 Jerlov water types (see Fig. 1(a)).
| Ref. | Year | Restor. | Enhancement | Learn. | Datasets | Evaluation | ||
| Quality | Task | IQA | Subj. | |||||
| [65] | 2010 | ✓ | ✓ | ✓ | ||||
| [66] | 2017 | ✓ | ✓ | ✓ | ||||
| [67] | 2019 | ✓ | ✓ | ✓ | ||||
| [68] | 2019 | ✓ | ✓ | ✓ | ✓ | |||
| [69] | 2019 | ✓ | ✓ | ✓ | ✓ | ✓ | ||
| [70] | 2019 | ✓ | ✓ | ✓ | ||||
| [71] | 2019 | ✓ | ✓ | ✓ | ✓ | |||
| [72] | 2020 | ✓ | ✓ | ✓ | ||||
| Ours | ✓ | ✓ | ✓ | ✓ | ✓ | ✓ | ✓ | |
The attenuation depends on the composition of water that may vary over time even at the same geo-location [74]. The optical properties can be divided into inherent and apparent. The inherent optical properties of water depend only on the water compositions [75]. Examples of inherent properties include the beam absorption coefficient, , and the beam scattering coefficient, , which quantify the absorption and scattering of a collimated light beam, respectively. The beam attenuation coefficient, , is the sum of the beam absorption and scattering coefficients [6]. The apparent optical properties of water depend instead on both the water composition and the ambient light. An example of apparent property is the diffuse attenuation coefficient of downwelling irradiance, , that quantifies the attenuation of ambient light [3]. The intensity of ambient light illuminating an object at the vertical depth can then be described as [3, 76]:
| (1) |
where is the ambient light intensity at the water surface. The deeper the object is under the water surface, the more attenuated the illuminant and hence the stronger the colour cast on that object. Furthermore, due to the exponential decrease in ambient light intensity (Eq. 1), water types with large diffuse attenuation coefficients or scenes with large changes in the depth will have a non-uniform water colour. In addition, a portion of the ambient light is backscattered towards the camera and veils the object with the water colour, [8]. The farther from the camera an object, the stronger the veiling effect on its appearance.
| (a) | (b) |
The intensity of the reflected light diminishes exponentially along its propagation in water [2], modulated by the beam attenuation coefficient(s) and the distance travelled. The portion of the transmitted light intensity can be expressed as [7]:
| (2) |
where is the initial light intensity and is the intensity after the light has travelled a distance of . As attenuation depends on the wavelength, each colour is degraded differently (see Fig. 1(b)). Moreover, the transmission of lights of different wavelengths ( and ), can be related as where is the attenuation coefficient of the subscripted wavelength .
The spatial spread, , of the reflected light beam due to scattering along a range of can be derived from the optical properties of the water and approximated as [77]:
| (3) |
where is the average cosine angle that indicates the average scattering direction deviating from the original propagation. Typical oceanic waters have values between 0.80 and 0.95 that correspond to average angles between 17.8°and 36.6°. A larger scattering coefficient or a longer range travelled by the light results in a larger spread of the beam. Therefore, at different ranges the degradation of the appearance of objects varies in their degree of colour cast and blurring.
As colour cast and blurring are caused by light attenuation that varies with the water type, depth and range, methods designed for a particular water environment or range may fail in other environments. For example, methods designed for shallow water or for scenes with objects at a short range usually under-perform in deeper waters and for objects farther from the camera, respectively.
2.2 Image formation models
This section reviews underwater image formation models that describe the degradation along the range, where the objects are under the illuminant attenuated along the depth. We discuss the earliest McGlamery-Jaffe model [4, 5], the Schechner-Karpel model [8] – which is the most used model in underwater image filtering – and the Akkaynak-Treibitz model that revises the Schechner-Karpel model [9]. The degraded image I comprises pixels that represent the objects in the scene or pure water mass. In the following, unless otherwise stated, all the arithmetic operations on images, including multiplications and divisions , are element-wise.
The McGlamery-Jaffe model [4, 5] describes I as a linear combination of the attenuated lights that are directly reflected from objects, D, and the attenuated scattered reflected light from objects, F, and transmitted backscattered light, B, as
| (4) |
The complete McGlamery-Jaffe model involves camera parameters and water properties, such as the volume scattering functions and the point spread function that governs scattering in F. The water property information is particularly difficult to obtain as they are constantly changing even at the same geo-location [74] and can only be measured with specialised devices [5], hence this model is mainly used in underwater navigation or monitoring where the devices are readily available [5].
The Schechner-Karpel model considers how the un-attenuated reflected light (effective scene radiance, J) is degraded along the objects’ distance from the camera, encoded in the range map z [8]. The model describes I as a combination of J and the backscattered ambient light (background light, A) that represents the water colour, as
| (5) |
where is the transmission map that describes the degradation extent of J with value of each entry between 0 and 1 (Eq. 2). The farther an object from the camera is, the smaller the value of T is. The term describes the contribution of A in the degraded image. All entries in , which has the same dimensions as T, have values of 1. Moreover, the relationship between transmission maps of different colour channels can be obtained from Eq. 2, for example as
| (6) |
where and are the attenuation coefficients of red and green, respectively.
Akkaynak and Treibitz [9] noted that the transmissions for J and A are in fact different. In particular, the attenuation coefficients, and , which quantify the two transmissions, depend on different variables. While both coefficients vary with E, , and the camera spectral function, also varies with z, whereas also varies with the beam scattering coefficient . Thus the revised model in Eq. 4 takes the following form:
| I | (7) | |||
To compensate for the degradation along the range with Akkaynak-Treibitz model, J is obtained as
| (8) |
Similarly, for the Schechner-Karpel model (Eq. 4), J is obtained with the above equation where . Note that underestimating the transmission overcompensates colours, as the smaller the values of the estimated T (), the stronger the compensation is. Furthermore, an inaccurately estimated A can distort the water colour. In particular, challenging scenes have a non-uniform A, which is caused by the exponential decrease in ambient light intensity.
Eq. 8, which only compensates for the degradation along the range, can be extended to compensate for the attenuation through the depth if the illuminant E is known. The scene radiance under a white (un-attenuated) illuminant, , can be obtained as [78]:
| (9) |
In the next section we discuss the restoration methods that use physics-based models to obtain J or .
3 Restoration
In this section, we present restoration methods that use the physics-based models. These methods estimate the background light and transmission map(s) in Eq. 8 using extra information of the scene [10, 11, 20] and priors that are learned using neural networks [25, 26, 24] or derived from observations [12, 13, 14, 15, 16, 17, 18, 19, 20, 22, 21, 23, 25]. Some methods also estimate the illuminant in Eq. 9 using priors [23, 20] or from the estimated background light [21].
The transmission map, whose entries’ values vary within the image, receives most effort from state-of-the-art among all the elements to be estimated. Other elements such as the background light are often assumed to be uniform within the image, although this is not universally true. Table II summarises the restoration methods.
| Reference | Compensate | Non-uni. | -dep. | Scene Info. | Prior | Water type | Evaluation | |||||||||||
| Depth | Range | Nat. | Art. | NN | Outdoor | Water | Texture | Stat. | Oceanic | Coastal | Task | Subjective | Generic | UW-IQA | ||||
| [10] | Schechner and Karpel | ✓ | ✓ | ✓ | ✓ | ✓ | ||||||||||||
| [11] | Treibitz and Schechner | ✓ | ✓ | ✓ | ✓ | |||||||||||||
| [24] | Hu et al. | ✓ | ✓ | ✓ | ✓ | ✓ | ||||||||||||
| [25] | Shin et al. | ✓ | ✓ | ✓ | ||||||||||||||
| [26] | Wang et al. | ✓ | ✓ | ✓ | [79] | |||||||||||||
| [12] | Drews et al. | ✓ | ✓ | ✓ | ||||||||||||||
| [13] | Emberton et al. | ✓ | ✓ | ✓ | ✓ | ✓ | ||||||||||||
| [14] | Carlevaris-Bianco et al. | ✓ | ✓ | ✓ | ||||||||||||||
| [15] | Galdran et al. | ✓ | ✓ | ✓ | ✓ | ✓ | ✓ | |||||||||||
| [16] | Peng and Cosman | ✓ | ✓ | ✓ | ✓ | ✓ | ✓ | ✓ | [80],[81] | |||||||||
| [17] | Li and Cavallaro | ✓ | ✓ | ✓ | ✓ | ✓ | ✓ | ✓ | ✓ | |||||||||
| [18] | Li et al. | ✓ | ✓ | ✓ | ✓ | ✓ | ✓ | ✓ | ✓ | [80] | ||||||||
| [19] | Hou et al. | ✓ | ✓ | ✓ | ✓ | ✓ | ✓ | [80] | ||||||||||
| [21] | Chiang and Chen | ✓ | ✓ | ✓ | ✓ | ✓ | ✓ | ✓ | ✓ | ✓ | ✓ | |||||||
| [20] | Akkaynak and Treibitz | ✓ | ✓ | ✓ | ✓ | ✓ | ✓ | ✓ | ✓ | |||||||||
| [22] | Emberton et al. | ✓ | ✓ | ✓ | ✓ | ✓ | ✓ | ✓ | [80, 82] | |||||||||
| [23] | Berman et al. | ✓ | ✓ | ✓ | ✓ | ✓ | ✓ | ✓ | ||||||||||
3.1 Using scene information
Information about the scene is used to simplify the estimation. This information can be obtained with devices, such as polarised filters, in image acquisition [10, 11], or by algorithms that require specific set-up in the scene [20].
Polarised filters can be used to capture the transmitted background light, . Since light is partially polarised, B can be described as the superposition (addition) of one unpolarised and one polarised components. Positioning the polarised filters at two orthogonal orientations captures the two linearly polarised components (at maximum and minimum intensities) of B, which can then be added up to obtain the values of B. The transmission map T can then be derived from B with A, which can be manually selected from the image [10] or automatically estimated using the degree of polarisation [11].
Information about the objects’ range, z, can simplify the estimation of transmission maps to that of beam attenuation coefficient (Eq. 2). The exact z can be obtained from Structure from Motion algorithm, that only estimates the range in relative scales, by placing an object of known size in the scene [20]. An optimisation algorithm then estimates the range-dependent attenuation coefficients (for Akkaynak-Treibitz model [9]) using, as inputs, the known z and a local illuminant (estimated by the local space average colour [83]) [20]. Moreover, pixels representing either objects faraway from the camera (large z) or objects with low reflected light intensities (small J) have intensities similar to the background light, i.e. as . By identifying such pixels in I with low RGB intensities from each of several equidistant z value clusters, A is then estimated using non-linear regression [20].
Using a device or set-up restricts the methods to images captured by the specific device, and therefore cannot be applied to already captured images.
3.2 Using priors
When only the degraded image I is available, estimating A and T requires priors that describe how the image was degraded. These priors may be learnt using neural networks [25, 26, 24], or refer to the appearance of colour [23, 17, 12, 13, 14, 15, 22, 21] or textures [17, 16] in the degraded underwater image.
Neural networks employed in the estimation were trained on pairs of degraded images I and the corresponding A and T [25, 26, 24]. These methods synthesise I from degradation-free images using Eq. 4. The ranges of the scene in images can estimated using a range estimation algorithm [84] for images [24] or already provided by the dataset (e.g. the Middlebury Stereo dataset [85]) [24]. The transmission map T can then be synthesised with the obtained z (Eq. 2). Some methods also randomly generate T [25, 26] which does not reflect the dependency on range, or randomly generate A which does not respect the physics laws of attenuation [25, 26, 24]. These methods hence train on unrealistic synthesised images, which hinders the power of neural networks.
Most methods estimate a uniform A from the pixels with the smallest values in T, which represent the furthest points in the scene [12, 13, 14, 15, 16, 22, 21]. Misestimating T would then lead to misestimating A. An alternative is to select A directly from pixels representing the water mass in I. These pixels can be identified by low intensity variance in a local window [23] or those following the oceanic water colour (derived from empirical data [86]) [17]. Moreover, a non-uniform A can be estimated when both the change in depth in the scene and the attenuation coefficients are known [21]. However, this information is generally unavailable. Another approach directly estimates the change in A from pixels representing water in I, without extra information about the scene, using linear regression (Eq. 1) [17].
| Prior | Outdoor | Water-specific | Texture | ||||
| DCP* | Haze-line* | UDCP* | ARC* | CB | Laplacian py. | ||
 |
 |
 |
 |
 |
 |
 |
|
 |
 |
 |
 |
 |
 |
 |
|
 |
 |
 |
 |
 |
 |
 |
|
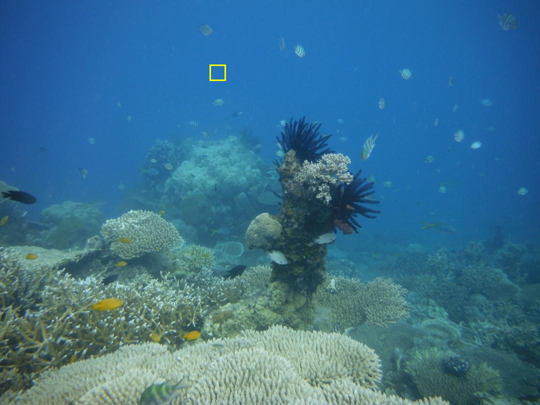
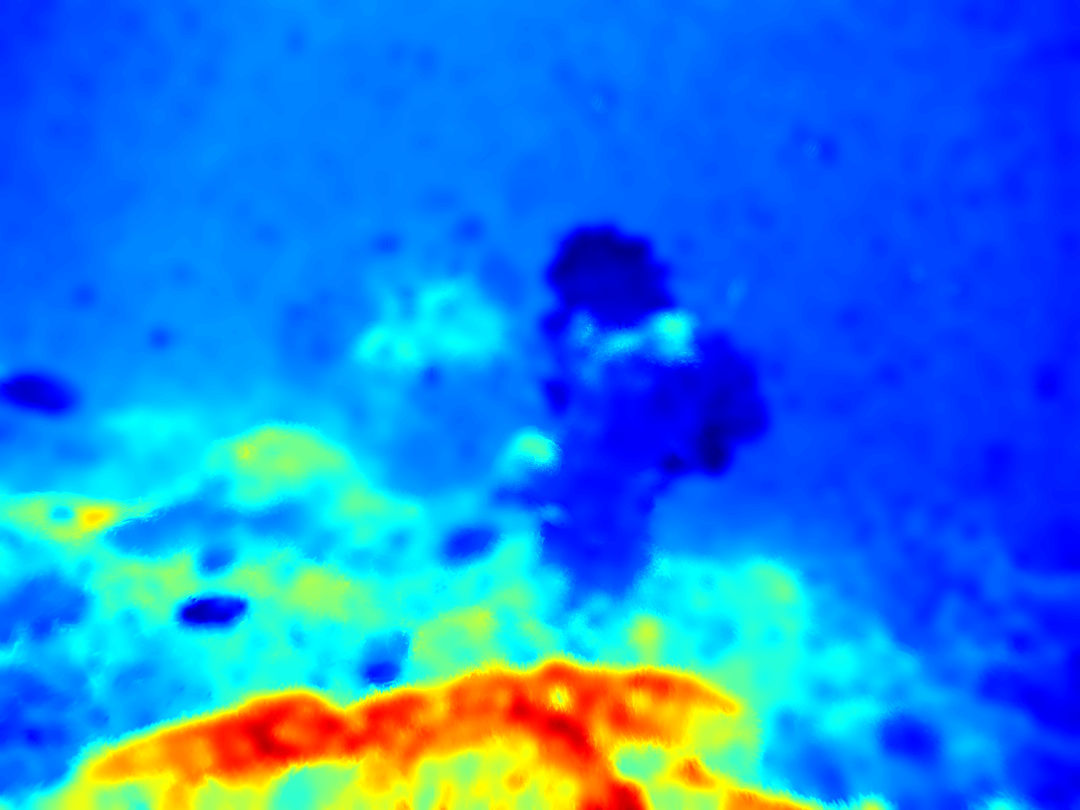
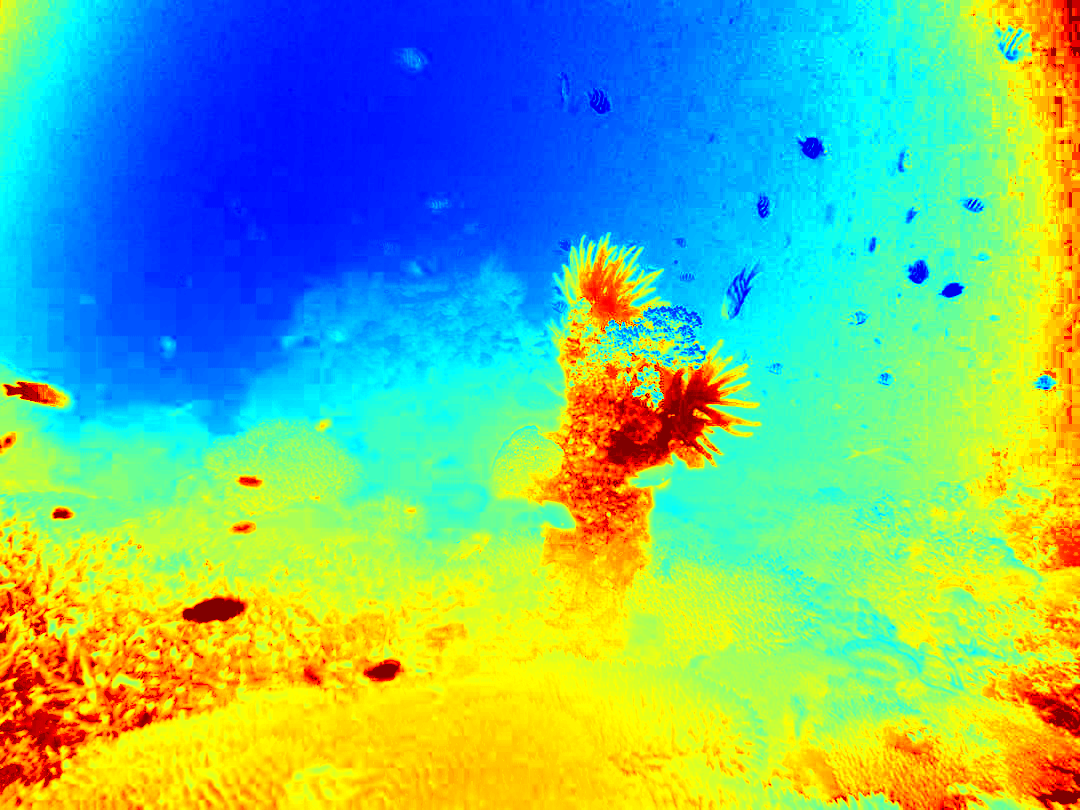
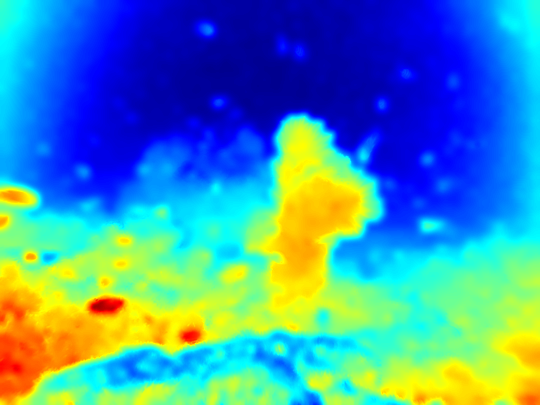
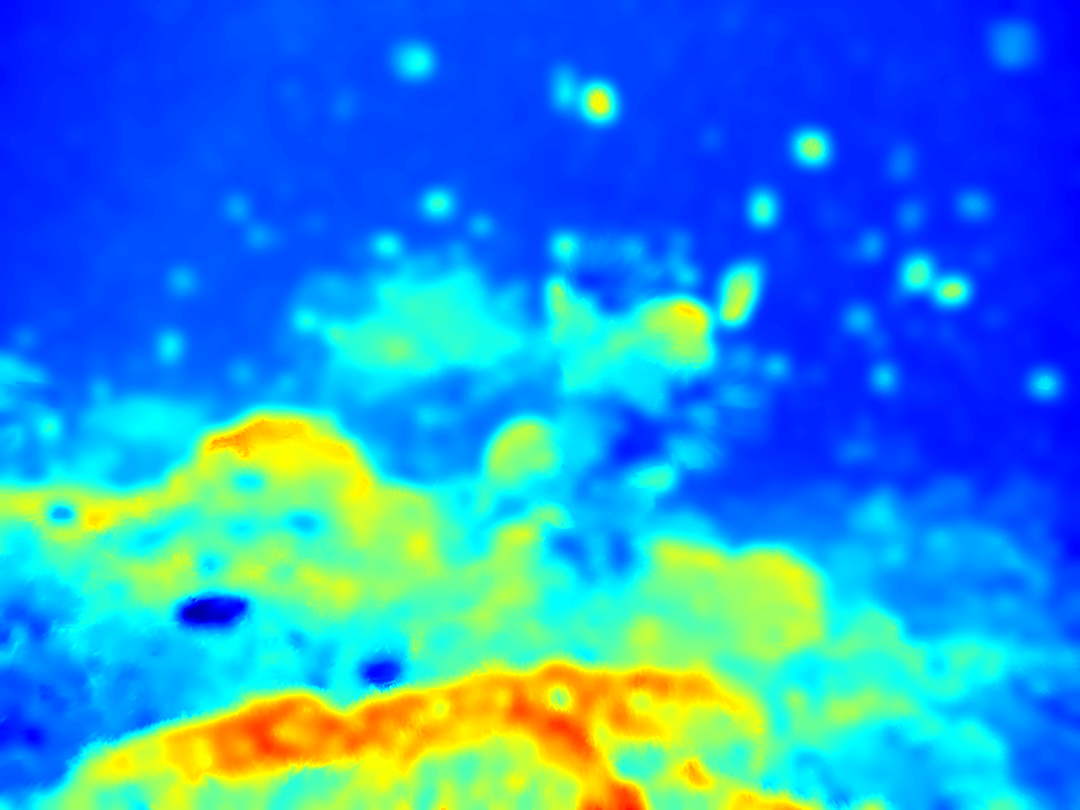
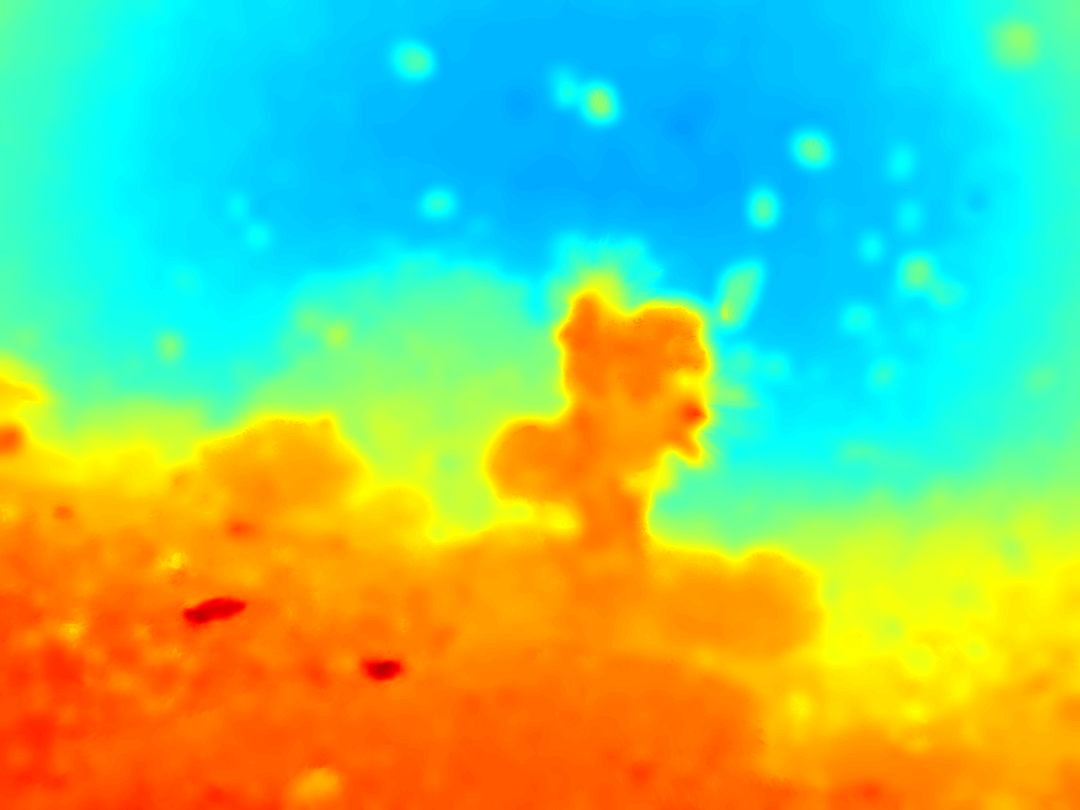
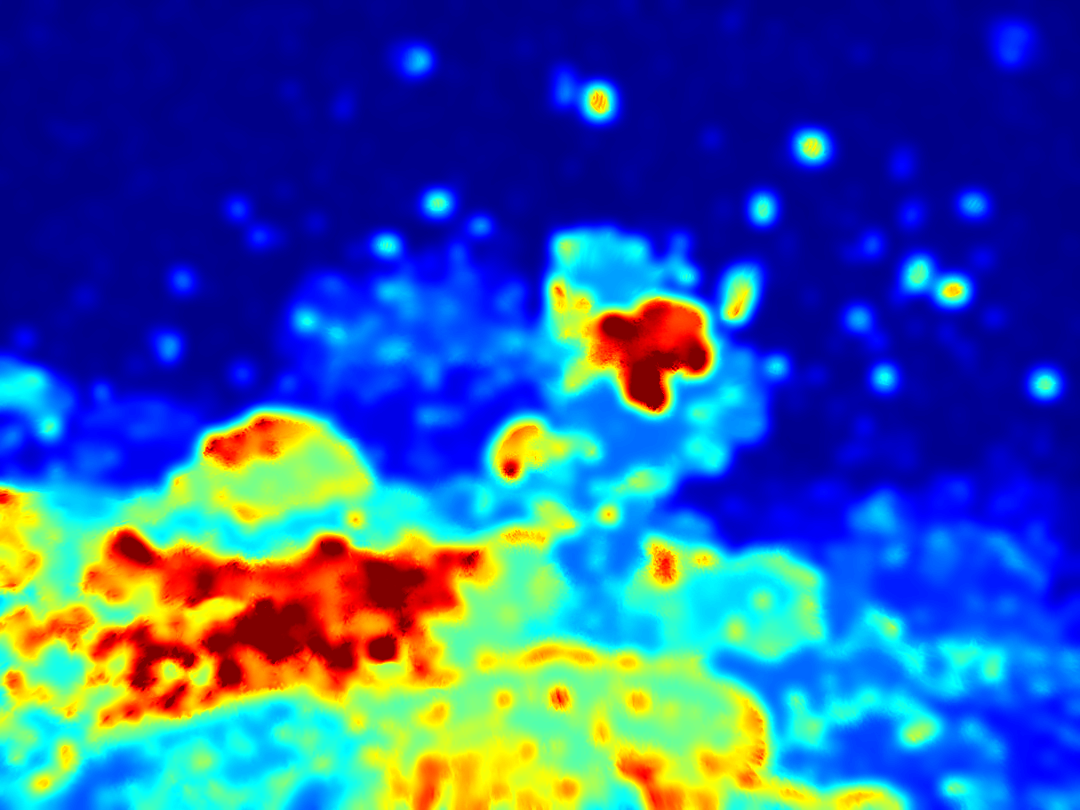
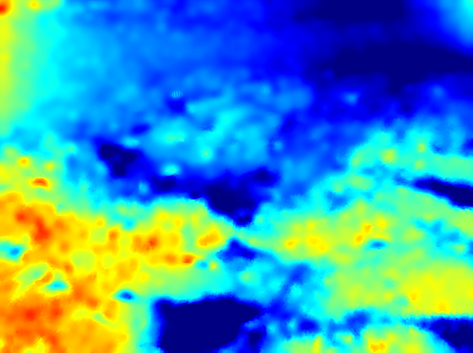
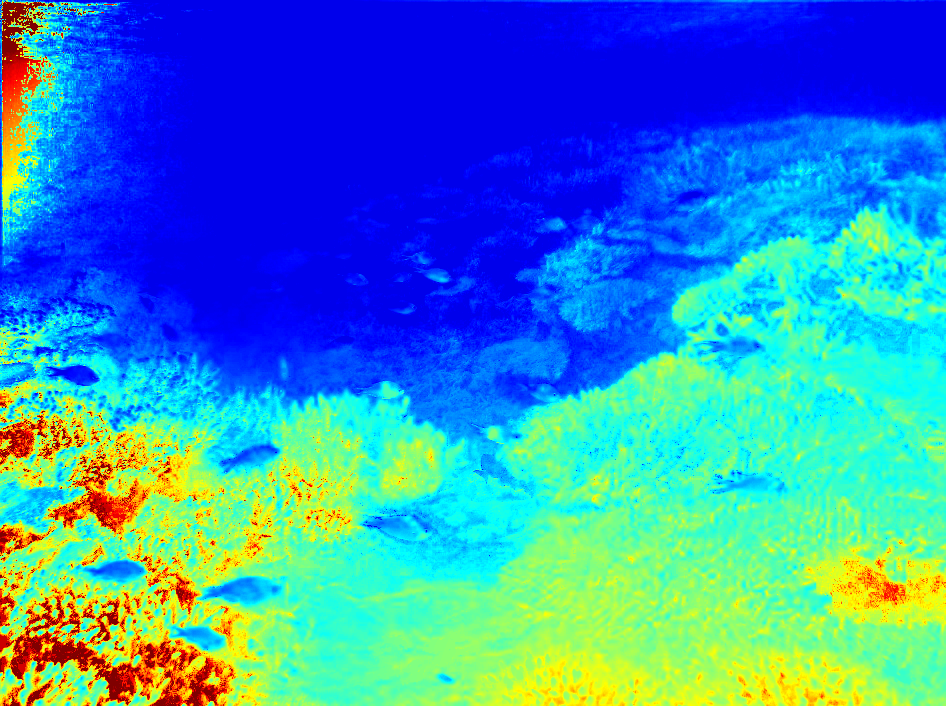
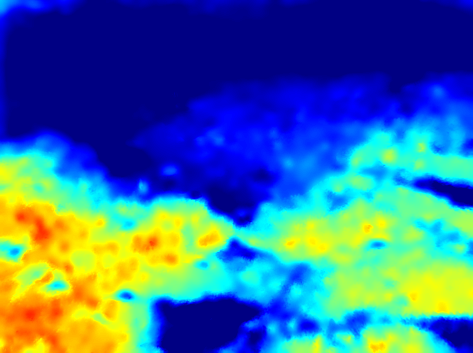
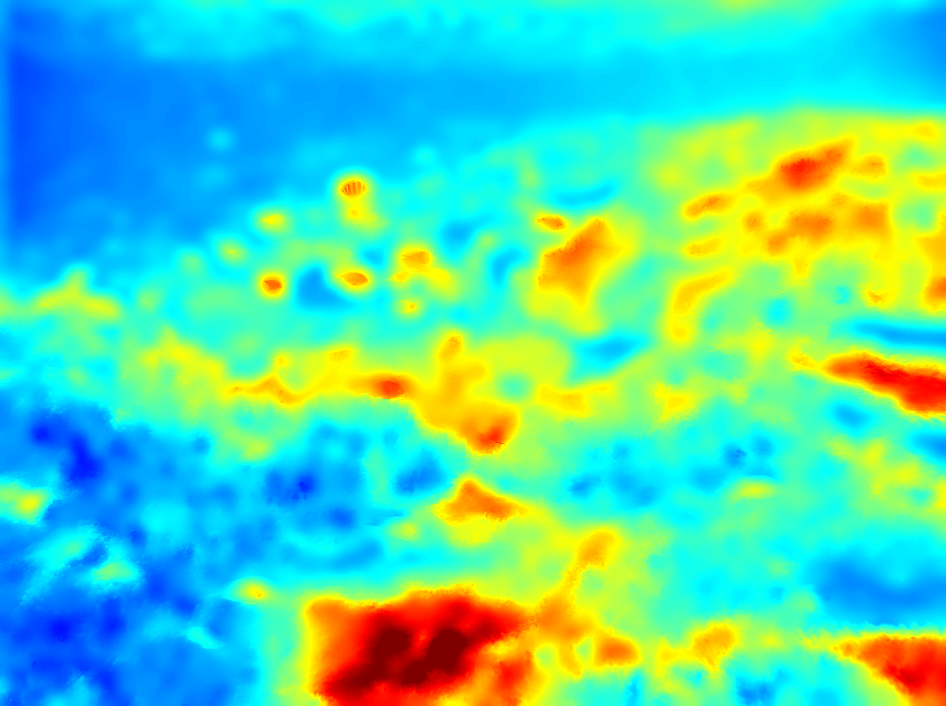
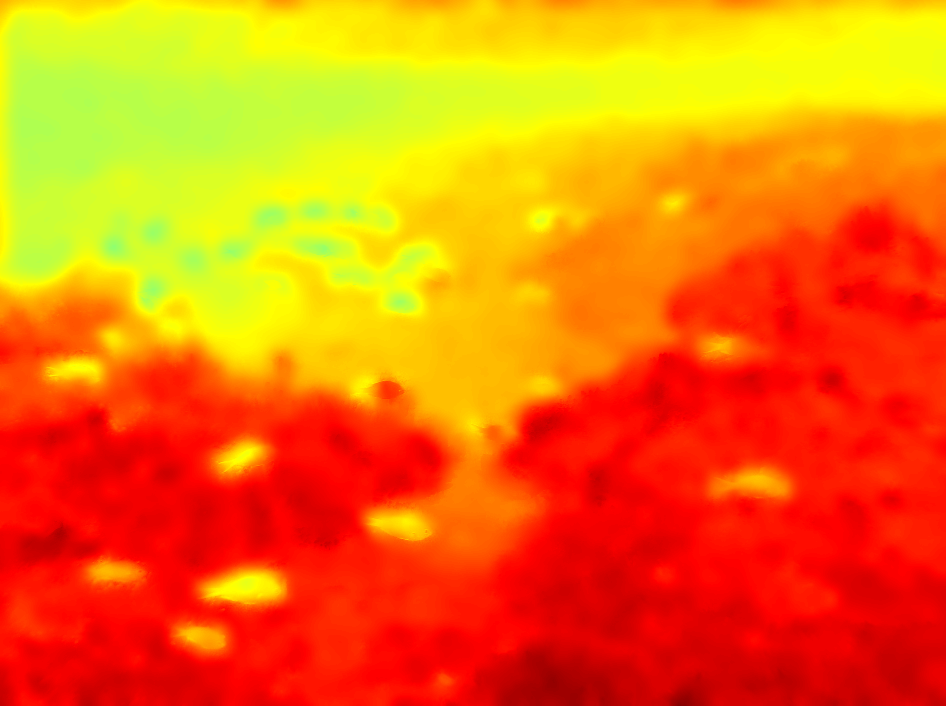
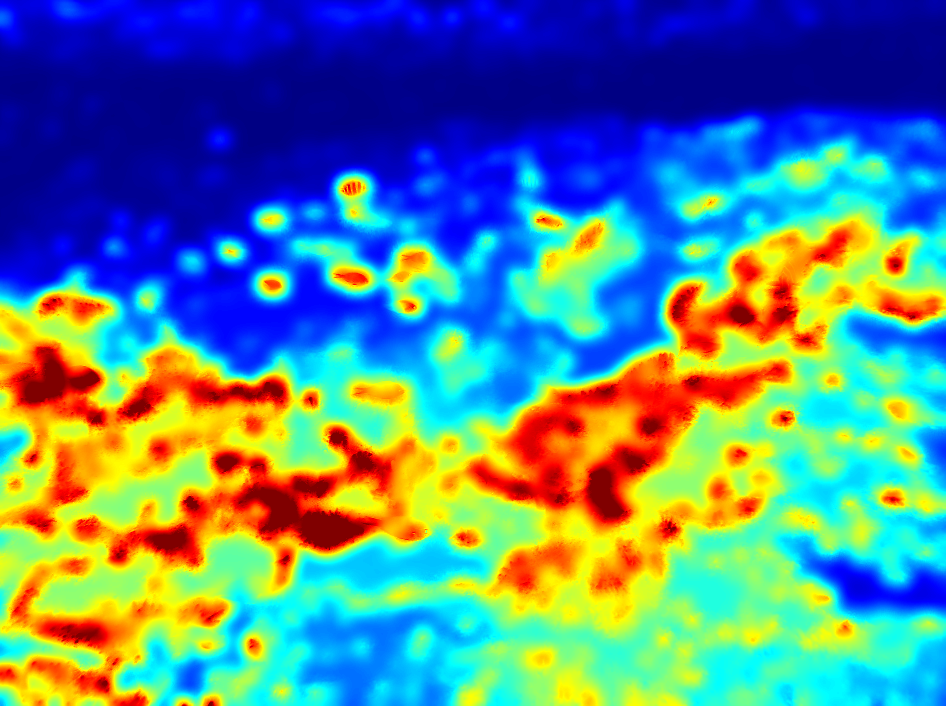
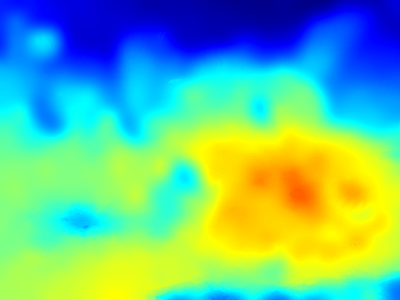
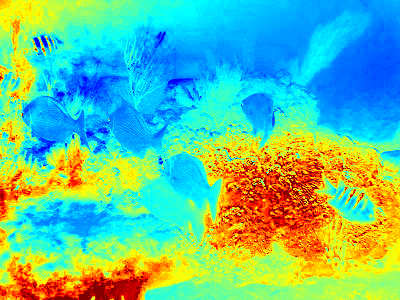
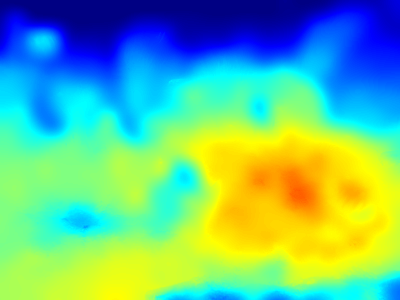
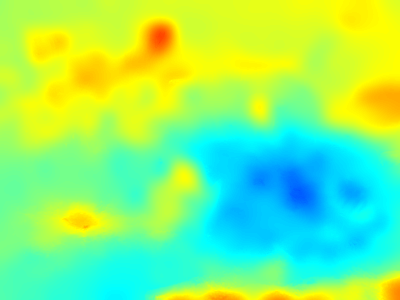
Many of the priors are employed to estimate T (Fig. 2). The outdoor colour priors proposed for dehazing are a popular choice111Hazy images are caused by the attenuation of light in air. As the wavelength dependence is negligible, the attenuation is non-selective. [22, 23, 21]. However, the main degradation source in hazy images is the veiling effect of haze [89], while that in water is the selective attenuation of light [8]. Therefore applying outdoor priors to underwater images generally misestimates the elements. The main outdoor priors exploiting the veiling effect are Dark Channel Prior (DCP) [87] and Haze-Line Prior [88]. DCP observes that the minimum intensity across the three colour channels (the Dark Channel) is usually close to zero in an haze-free image. In an hazy image, the Dark Channel’s intensity is increasingly shifted towards that of the haze colour (represented by A) with range. The smaller the Dark Channel value, the closer an object should be to the camera and hence the smaller the T. However, when DCP is applied to oceanic water [21] to estimate T and A, objects faraway from the camera are misestimated to be close, as most of the red light is attenuated. Alternatively, Haze-line Prior [88] makes use of the overall distribution of the RGB intensities, which can be well-represented by distinct RGB clusters [90]. The presence of haze shifts the RGB intensities towards the haze colour, thus forming a haze-line in the colour space. The smaller the difference between the pixel intensity’s to the haze colour, the smaller the T. However, Haze-line prior is not effective in water since the scene is under the attenuated illuminant and does not follow the same colour distribution as the in-air scene that are under an unattenuated light.
Water-type specific priors exploit the selective colour degradation in the water type. For example, priors specific to oceanic water consider red light as the most attenuated. Notable priors for oceanic water are the Underwater Dark Channel Prior [12], the one proposed by Carlevaris-Bianco et al. (CB) [14] and the Automatic Red Channel (ARC) [15]. The Underwater Dark Channel Prior (UDCP) [12] discards the most degraded red colour channel and states that objects closer to the camera, with less degraded colours, have low intensities in either of the blue or green channels. The further an object is, the higher the Underwater Dark Channel intensity. However, UDCP misestimates T for objects that are naturally high in blue and green colours. For example, a white object close to the camera is considered faraway as the pixels have a high intensity in all colour channels. Alternative to only using blue and green channels, Carlevaris-Bianco et al. (CB) proposed to consider the difference between the red colour channel and the less attenuated between blue and green colour channels [14]. This CB prior states that the closer the object is to the camera, the larger the colour difference; however, objects naturally low in red colour can still be misestimated. The Automatic Red Channel Prior (ARC) [15] directly exploits the loss in red intensity, and the increase in blue and green intensity along the range. ARC misestimates objects naturally low in red intensity as located faraway.
Textures are increasingly blurred along the range by scattering in all water types. This observation can be used as a prior to estimate T. The degradation of texture can be measured by the variance of intensities in a local window [16] or by the responses of high-frequency components in the image [91], which can be identified with a band-pass Laplacian pyramid [17]. Texture priors are often combined with colour priors to estimate T more accurately. For example, a linear combination with UDCP [16] averages out the error in either priors, whereas a combination that takes the maximum between texture prior and ARC [17] avoids underestimating T.
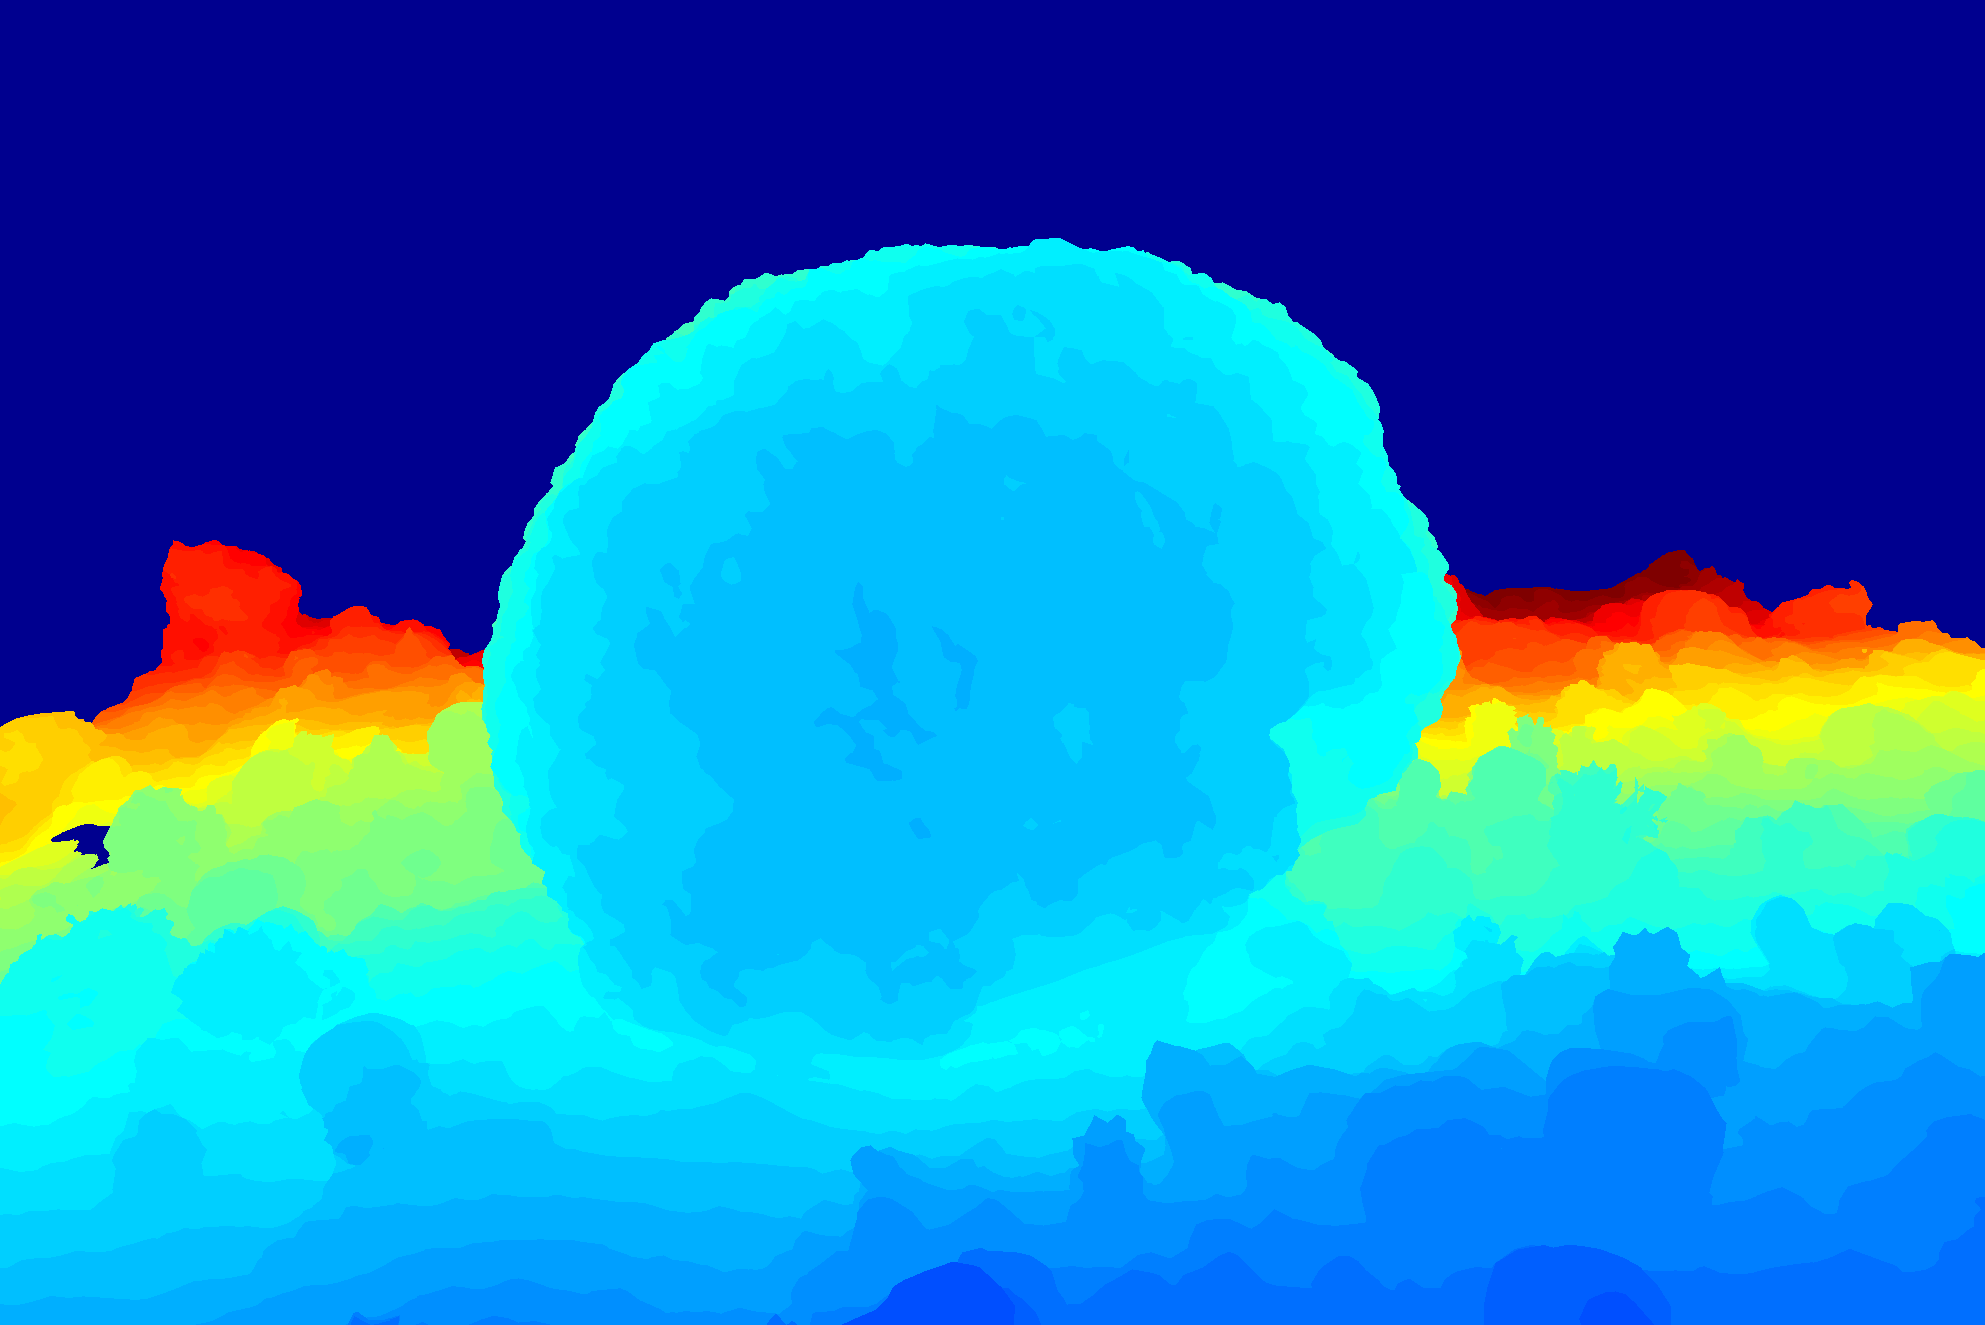
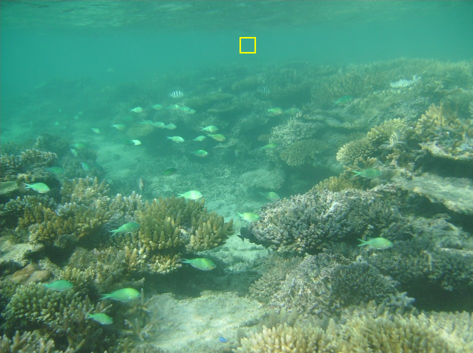
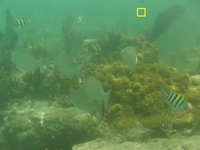
Fig. 2 shows the transmission maps estimated by the aforementioned priors in oceanic and coastal waters. Each of oceanic and coastal water has two images with different degree of colour cast. The images contain coral reefs and fishes at different ranges from the camera. All of these priors have their own shortcomings: DCP and UDCP misestimate the white regions on the fish to be faraway from the camera (row 1); Haze-line often estimates the water regions to be close to the camera; CB overestimates the transmission map values (most regions are estimated to be close to the camera) and fails to estimate the transmission map in most of the colour-casted coastal water (row 4); ARC misestimates coral regions that are naturally high in red colour (row 1) and the water region in coastal water to be close to the camera (row 4); the texture prior works for textured regions in both oceanic and coastal waters, but misestimates flat regions (row 1).
To address the different degradation extents in each colour channel caused by selective attenuation, one can derive T for each colour channel using Eq. 6. The ratio between attenuation coefficients (the exponent) can be extracted from empirical data of the 10 Jerlov water types directly [23, 20] or approximated using an empirical relationship between the diffuse attenuation coefficient and background light [16, 17, 18]. Instead of using different T for each colour channel, an alternative approach is to adjust the estimated A by the average colour channel intensity when using Eq. 8 [15].
To remove the colour cast on objects and restore (Eq. 9),the illuminant E can be estimated using colour statistics priors, such as the Gray World assumption [78] and the Spatial Principal Component Analysis [92], that are hypothesised on the reflectances of objects in air [13, 23, 20]. These colour statistics do not consider non-reflective objects (e.g. water mass) and can result in inaccurate estimations when pure water mass is visible in the image. E can also be estimated directly from the estimated A [21], which requires the generally unavailable diffuse attenuation coefficients of the water type to be known. Moreover, all these methods remove the colour cast in the entire scene, which could distort the water colour in the restored image.
Finally, using artificial light in-situ introduces a spherical overexposed area, which is not modelled in Eq. 4. To avoid overcompensating for these areas, a saturation prior can be used that considers these regions to have a similar intensity in each colour channel [15] or a comparison between the mean luminance of foreground and background [21]. In addition to these direct approaches, a combination of only considering the blue channel and UDCP can also handle these bright regions in oceanic water [16].
Table II compares the restoration methods we discussed. Most methods are designed for oceanic waters and only a few methods also consider coastal waters [23, 20, 18, 22]. Furthermore, only a few methods address the degradation caused by the illuminant attenuated through the depth under the water surface [23, 21, 20, 22].
4 Enhancement
In this section, we discuss enhancement methods that improve the quality images as perceived by humans or the performance of computer vision tasks.
4.1 Human vision
Enhancement methods for human vision operate in the spatial or in the frequency domain and may use colour spaces that are appropriate for human perception, such as CIELab [93] and HSL [94]. Most enhancement methods employ oceanology knowledge or human visual system preferences. Table III summarises the underwater enhancement methods.
| Reference | Fusion | Optimised aspect | Domain | Colour space | Water type | Evaluation | ||||||||||
| Colour | Contrast | Denoise | Spatial | Frequency | RGB | Lab | HSL | Oceanic | Coastal | Task | Subjective | Generic | UW-IQA | |||
| [27] | Fu et al. | ✓ | ✓ | ✓ | ✓ | ✓ | ✓ | |||||||||
| [28] | Tang et al. | ✓ | ✓ | ✓ | ✓ | ✓ | [95] | |||||||||
| [29] | Gao et al. | ✓ | ✓ | ✓ | ✓ | ✓ | ✓ | [80, 81] | ||||||||
| [31] | Zhang et al. | ✓ | ✓ | ✓ | ✓ | ✓ | ✓ | |||||||||
| [32] | Protasiuk et al. | ✓ | ✓ | ✓ | ✓ | [81] | ||||||||||
| [35] | Iqbal et al. | ✓ | ✓ | ✓ | ✓ | ✓ | ||||||||||
| [36] | Serikawa and Lu | ✓ | ✓ | ✓ | ✓ | ✓ | ✓ | |||||||||
| [37] | Prabhakar and Kumar | ✓ | ✓ | ✓ | ✓ | ✓ | ||||||||||
| [38] | Dai et al. | ✓ | ✓ | ✓ | ✓ | ✓ | ✓ | ✓ | ✓ | [80, 81] | ||||||
| [33] | Ancuti et al. | ✓ | ✓ | ✓ | ✓ | ✓ | ✓ | ✓ | ✓ | |||||||
| [34] | Ancuti et al. | ✓ | ✓ | ✓ | ✓ | ✓ | ✓ | ✓ | ✓ | ✓ | [80, 81, 96] | |||||
| [39] | Khan et al. | ✓ | ✓ | ✓ | ✓ | ✓ | ✓ | ✓ | ✓ | |||||||
| [40] | Vasamsetti et al. | ✓ | ✓ | ✓ | ✓ | ✓ | ✓ | ✓ | ✓ | |||||||
| [69] | Li et al. | ✓ | ✓ | ✓ | ✓ | ✓ | ||||||||||
The colour cast can be removed by estimating the illuminant in the scene using white balancing algorithms, such as Gray World [78] and MaxRGB [97]. White balancing algorithms may operate in the RGB [28, 33, 69] or CIELab [27, 31] colour spaces. However, white balancing alone cannot handle the range-dependent degradation extent. The colour degradation along the range can be compensated by assuming that the colour channels in the opponent colour pairs [98] have similar intensity values in an undegraded image [34]. To increase contrast, approaches such as gamma correction [33, 34, 69], histogram equalisation (e.g. CLAHE [99]) in RGB and HSL colour spaces [39], and adjusting each colour channel’s value according to the overall colour cast factor [40] are also used. To address the blurring caused by scattering, unsharp masking can be employed to emphasise the edges [100] in the spatial domain or by directly enhancing the edges, represented by high-frequency components, in the frequency domain [38]. A degradation linked to sharpness is the noise, normally caused by backscattering or the image acquisition process. While denoising can be achieved by low-pass filtering in the frequency domain [37], this might introduce additional blurring to the edges. A balance between denoising and edge preservation can be achieved with a joint trilateral filter [36].
Fusion is also used to combine differently filtered versions of a degraded image [33, 34, 69], in order to apply the most suitable enhancement filter for different image regions. The inputs to a fusion algorithm can be combined to optimise contrast, saturation and edge details [34], and also to suppress over- or under-exposure [33]. The inputs can be combined using weights estimated by neural networks trained on a dataset collected from subjective tests [69] or derived from saliency [33, 34]. Fusion can also be performed on the decomposition of the wavelet coefficients in frequency space, before converting the enhanced image back to RGB colour space [40, 39].
4.2 Computer vision tasks
Underwater computer vision tasks include the detection, tracking, and recognition of fish [101, 102, 41, 103], other sea animals [104, 42], and plankton [105]; the classification of coral reefs [106] and the positioning of vehicles [107]. These tasks enable marine species discovery [108], coral preservation [109, 110, 111], ocean exploration with unmanned vehicles [107] and archaeological excavation [112, 113],. However, the algorithms for these tasks are generally designed for in-air images and hence do not perform well on the degraded underwater images [114].
Underwater computer vision tasks may focus on objects of interest (detection, counting, recognition and tracking) or consider the whole scene (3D scene reconstruction). Objects of interest include marine animals (detection) [42, 41], corals (recognition), cables [115], pipelines [44] or other man-made objects [46, 43, 45]. Scene reconstruction is the basis for scene mapping, which is important for archaeology and excavation as knowing the scene in advance can optimise the time divers stay underwater. Scene reconstruction typically involves establishing the correspondence between two images by matching a set of detected feature points [116].
Most methods aim to make the condition of the image closer to those taken in-air, by correcting the colour degradations and deblurring the image. Colour degradations can be compensated by removing the colour cast with white balancing [49, 45] and increasing the contrast with histogram equalisation [48]. A few methods also address the wavelength-dependent attenuation by exponentially increasing the intensity in each colour channel with respect to the attenuation coefficients obtained from empirical experiments [44, 46]. Moreover, image noise caused by backscattering of suspended particles can be removed using bilateral filter [47] or morphological opening and closing of the segmented foreground binary image in object recognition [41], whereas the edges can be enhanced by unsharp masking in the luminance channel of the CIELab colour space [43], or with the Wallis filter [117, 48]. Table IV compares the enhancement targets of the aforementioned methods.
| Reference | Enhancement | Task | |||||||
| col. | edge | den. | det. | count. | recog. | track. | reconst. | ||
| [41] | Lakshmi and Krishnan | ✓ | ✓ | ✓ | ✓ | ||||
| [42] | Mehrnejad et al. | ✓ | ✓ | ||||||
| [43] | Rizzini et al. | ✓ | ✓ | ✓ | |||||
| [44] | Foresti et al. | ✓ | ✓ | ||||||
| [45] | Kallasi et al. | ✓ | ✓ | ||||||
| [46] | Lee et al. | ✓ | ✓ | ✓ | |||||
| [47] | Lopez-Vazquez et al. | ✓ | ✓ | ✓ | |||||
| [48] | Skarlatos et al. | ✓ | ✓ | ✓ | |||||
| [49] | Johnson-Robertson et al. | ✓ | ✓ | ||||||
Unlike methods for restoration (Sec. 3) and enhancement for human vision (Sec. 4.1), enhancement methods for computer vision tasks are still at an early stage. Most methods combine image filtering techniques in the approach but without validating the method in real life deployment. Due to the lack of ground-truths, these methods are mainly evaluated with laboratory recreated environments.
5 Learning-based methods
| Reference | Acronym | Target images | Type | Loss function | Evaluation | |||||||||
| Physics | NN | Test | Colour | Deblur | Perceptual | Additional | Task | Subjective | Generic | UW-IQA | ||||
| [50] | Li et al. | WaterGAN | R | CNN | ✓ | ✓ | ||||||||
| [58] | Li et al. | UWCNN | R | CNN | SSIM | ✓ | ||||||||
| [51] | Uplavikar et al. | UIE-DAL | R | Auto-encoder | MSE | ✓ | ||||||||
| [52] | Yu et al. | Underwater-GAN | R | GAN | ✓ | GAN | ✓ | |||||||
| [55] | Li and Cavallaro | Cast-GAN | R+D, S | GAN | SSIM | ✓ | GAN | ✓ | ||||||
| [53] | Hashisho et al. | UDAE | ✓ | Auto-encoder | MS-SSIM | ✓ | ||||||||
| [59] | Guo et al. | UWGAN* | ✓ | GAN | GAN | ✓ | [80, 81] | |||||||
| [57] | Fabbri et al. | UGAN | ✓ | GAN | Grad-Diff | GAN | ✓ | |||||||
| [63] | Li et al. | FGAN | ✓ | GAN | GAN | [81, 80] | ||||||||
| [54] | Islam et al. | FUnIE-GAN | ✓ | ✓ | GAN | ✓ | GAN | ✓ | [81] | |||||
| [56] | Sun et al. | P2P | ✓ | CNN | MSE | ✓ | ||||||||
| [61] | Li et al. | UWGAN* | ✓ | CycleGAN | SSIM | CycleGAN | ✓ | ✓ | ||||||
| [62] | Lu et al. | M-Cycle GAN | ✓ | CycleGAN | MS-SSIM | CycleGAN | [81] | |||||||
-
*
Note that the two networks are different, even if they have the same acronym.
Learning-based methods that use neural networks have been increasing employed for underwater images [50, 51, 52, 53, 54, 55, 56, 57, 58, 59, 60, 61, 62, 63]. In this section, we discuss the target images used to train neural networks, the chosen network architectures and loss functions. Table V compares learning-based methods and their features.
Target images used in training may be images free of degradation to be used for underwater image restoration [58, 50, 55, 51, 52] or images selected for quality to be used for underwater image enhancement [54, 59, 26, 57, 53, 63, 69, 62, 61]. Most methods’ training require a target image for each of the degraded image (supervised) [50, 51, 52, 53, 54, 55, 56, 57, 58, 59, 60, 63], whereas a few methods only require specifying the degraded and target image datasets but not the correspondence between images (weakly supervised) [62, 61].
Because of the difficulty of capturing the underwater scene without the water medium, target images free of degradation are difficult to obtain. Degraded images are instead synthesised using physics-based models [58, 50, 55]. The corresponding target images are taken from existing datasets, such as NYU-D dataset [125], with natural indoor scenes, and SINTEL [126], with computer-generated images (see Sec. 6). Several methods use images from NYU-D dataset as target J and synthesise I with Eq. 4 [58, 50, 52, 51]. Because the attenuated illuminant and scattering are not modelled, networks trained on these images only compensate for the range but not the depth nor blurred textures. Furthermore, the limited colour palette of NYU-D images results in a similarly limited colour palette in the processed images [57].
To compensate for the degradation through the depth, the degraded image I can be synthesised with in Eq. 4, where the attenuated illuminant E at depth is synthesised using Eq. 1 [55]. Moreover, the range-dependent scattering can be modelled by applying successive Gaussian blurring (Eq. 3) to J [55]. To obtain a more diverse colour palette in the target images, can be derived from SINTEL [126] by modifying the colours of each object, so that they follow the colour distributions of natural, in-air images (e.g. the Berkeley Segmentation Dataset [127]) [55]. The aforementioned restoration methods synthesise I for the 10 Jerlov water types using the diffuse attenuation [3] of the water type [58, 50, 52, 51], or also the beam attenuation coefficients [86] from empirical data [55].
Target images can also be selected via subjective tests [52, 26, 57, 63, 69]. For example, the target images used to train WaterNET [69] are the most chosen (by 50 participants) among images filtered with 12 enhancement methods. Each participant was asked ’which one is better’ in a double-stimulus subjective test, where the degraded image was also shown but could not be selected. Alternatively, the target images can be synthesised after learning the enhancement with a Generative Adversarial Network [123], trained on small datasets whose images are annotated by humans as ’good’ or ’bad’ qualities [53, 54]. Moreover, in weakly supervised training, the selection of target image is no longer restricted to images capturing the same scene as the degraded image. The target image datasets can then contain ’less degraded’ underwater images, chosen from a subjective test [61], or even in-air images [62].
Underwater neural networks trained in a supervised manner can employ end-to-end Convolutional Neural Networks (CNNs) that process a degraded image and use skip connections [58, 63, 56]. The CNNs can also be guided by additional information such as the range, which can be estimated by earlier network layers [50]. In this case, the error in range estimation may accumulate through the subsequent layers and affect the output image. Auto-encoders for underwater image filtering typically use the U-Net [128] architecture with skip connections between the encoder and the decoder to maintain contextual information in the reconstructed image [51, 53]. Several networks employ Generative Adversarial Network (GAN [123]) framework [52, 54, 55, 57, 58, 59, 63]. The GAN consists of a generator network, that filters the degraded image, and a discriminator network, that determines whether the an image is the target image or has been filtered by network. Moreover, networks trained in a weakly supervised manner typically use a CycleGAN [124], that consists of a first GAN that learns the filtering from the degraded to the target image set, and a second GAN that learns to process the filtered image back to the original degraded image. However, without explicitly stating the target image of each degraded image, CycleGAN is less stable and more difficult to train [124].
Loss functions for underwater image filtering generally measure the similarity between a target image and the network-filtered image. The similarity is quantified through colour differences or by comparing the structure (texture) in local windows. Colour differences are measured pixel-by-pixel using the norm [53, 58, 54, 57, 63], the norm [50, 53] or the mean square error [51, 56]. Image structures are measured using Structural SIMilarity (SSIM [118] and multi-scale SSIM [119]) [53, 58, 55, 62, 61] or the image gradient [120] difference [57]. Furthermore, a perceptual loss function [121] is often used to suppress artifacts that are common in images processed by neural network [55, 54, 52]. Finally, networks employing a GAN or CycleGAN framework include the corresponding GAN or CycleGAN loss term [54, 56, 61, 62]. A review of underwater image filtering entirely dedicated to neural networks is presented by Anwar and Li [72].
6 Datasets
Datasets are indispensable for the development of methods [129, 130] and the evaluation of their performance [131]. In this section, we discuss datasets categorises into natural (Sec. 6.1) and chemically or digitally degraded (Sec. 6.2). Table VI summarises the datasets and the associated information. Fig. 3 shows examples of notable datasets.
6.1 Natural datasets
| Category | Reference | Dataset | Annotation/ Information | Content | Number of images |
| Natural | [132] | RUIE UIQS | Quality determined by IQA [80] | Marine life | 3,630 |
| RUIE UCCS | Colour cast | 300 | |||
| RUIE UHTS | Marine life location & type | 300 | |||
| [54] | EUVP unpair | Quality determined by subjective test | Marine life and divers | 6,665 | |
| [69] | UIEB | Preferred image by subjective test | Marine life and divers | 890 | |
| [133] | LifeCLEF Fish/ Coral task | Fish/ Coral species and locations | Fish/ Coral | Over 20,000 | |
| [134] | SQUID | Range, colour chart | River bed, rocks, wrecks | 57 | |
| [20] | Sea-thru | Range, colour chart | River bed, rocks, corals | 1,157 | |
| Digitally degraded | [58] | PR 2019 Synthetic | Reference image | Indoor scenes | 14,490 |
| [57] | Fabbri et al. | Reference image | Marine life and divers | 6,143 | |
| [54] | EUVP pair | Reference image | Marine life and divers | 24,848 | |
| Chemically degraded | [135] | TURBID | Reference image | Man-made objects | 112 |
Natural datasets capture scenes that are naturally degraded by the water medium. The annotations of these datasets include the perceived quality of images, images characteristics, or computer vision results (e.g. bounding boxes and segmentation masks).
The Real-world Underwater Image Enhancement (RUIE) dataset [132] consists of three subsets, namely Underwater Image Quality Set (UIQS), Underwater Colour Cast Set (UCCS) and Underwater Higher-level Task-driven Set (UHTS). The images were captured by 24 cameras mounted at fixed locations over three hours. The changing tide and sunlight over time create varying scenes’ depth and illumination conditions in the dataset. UIQS contains 3,630 images for evaluation purposes, separated into 5 groups according to their quality quantified by an underwater image quality measure (UCIQE [80], see Sec. 7) (Fig. 3(a)). UCCS consists of 300 images from UIQS grouped by the overall colour cast, measured by the average b channel intensity in the CIELab colour space (Fig. 3(d)). UIQS and UCCS are suitable for evaluating the filtered images’ quality. UHTS contains 300 images with bounding boxes of three marine species (scallop, sea cucumbers and sea urchins), and is mainly suitable for evaluating the performance of specific applications such as detection and classification.
The Enhancement of Underwater Visual Perception dataset (EUVP) unpair collection [54] and the Underwater Image Enhancement Benchmark (UIEB) [69] are annotated for image quality. The EUVP unpair collection consists of 6,665 images 222There is a mismatch between the image numbers mentioned in the paper and the website, here we consider the numbers in website. (Fig. 3(b)), each annotated as ’good’ or ’bad’ quality by 6 participants in a subjective test that asked ’whether the background and foreground are identifiable’. The paired images are provided with reference images generated by a neural network that learnt the domain transformation between the undegraded and distorted images from a subjective test, but no analysis was performed on the fidelity of these images with respect to the human perception. UIEB presents a large-scale natural dataset with corresponding reference images that can be used to train neural networks or evaluate IQA measures (Fig. 3(c)). The dataset contains 890 images collected from those used in publications and online repositories or captured by the authors. The ’reference’ image is the most chosen by 50 participants in a subjective test among a set of images processed by 12 filtering methods (9 methods were proposed for underwater images [34, 27, 12, 136, 137, 138, 15, 18, 16], 2 for dehazing [87, 139] and 1 image filtering software [140]). Participants were asked ’which one is better’ in a double-stimulus of filtered images, where the degraded image is also shown (but cannot be selected). Note that the selection of reference images was not confirmed by a statistical significance test.
The application-specific LifeCLEF Fish/ Coral task [133] provides annotations of the species and their locations. The Fish task dataset comprises 93 videos manually annotated with bounding boxes for the fish and a label for their species. The Coral task dataset contains the segmentation masks of 13 types of coral substrates in the image.
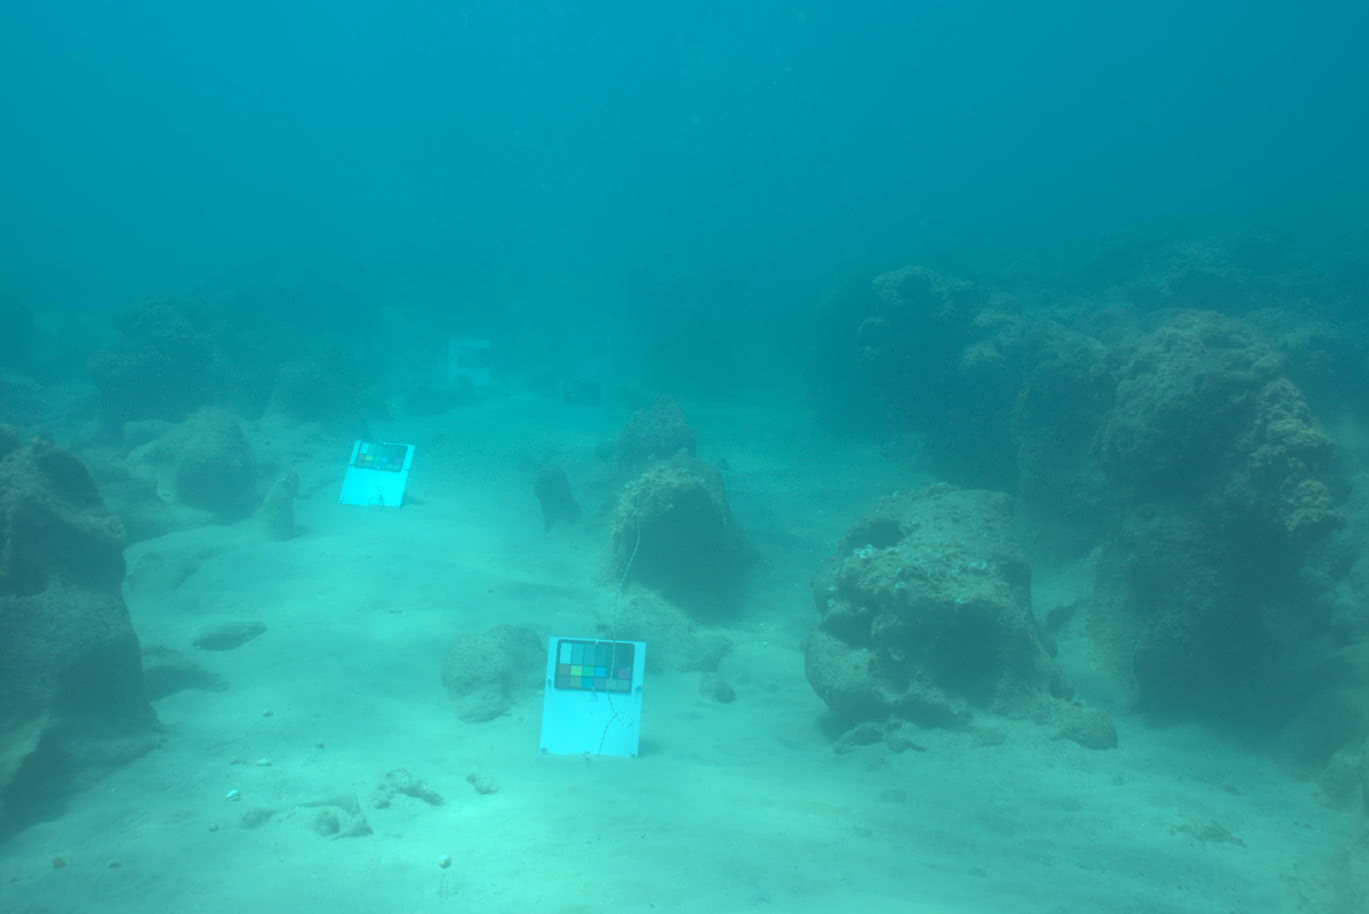
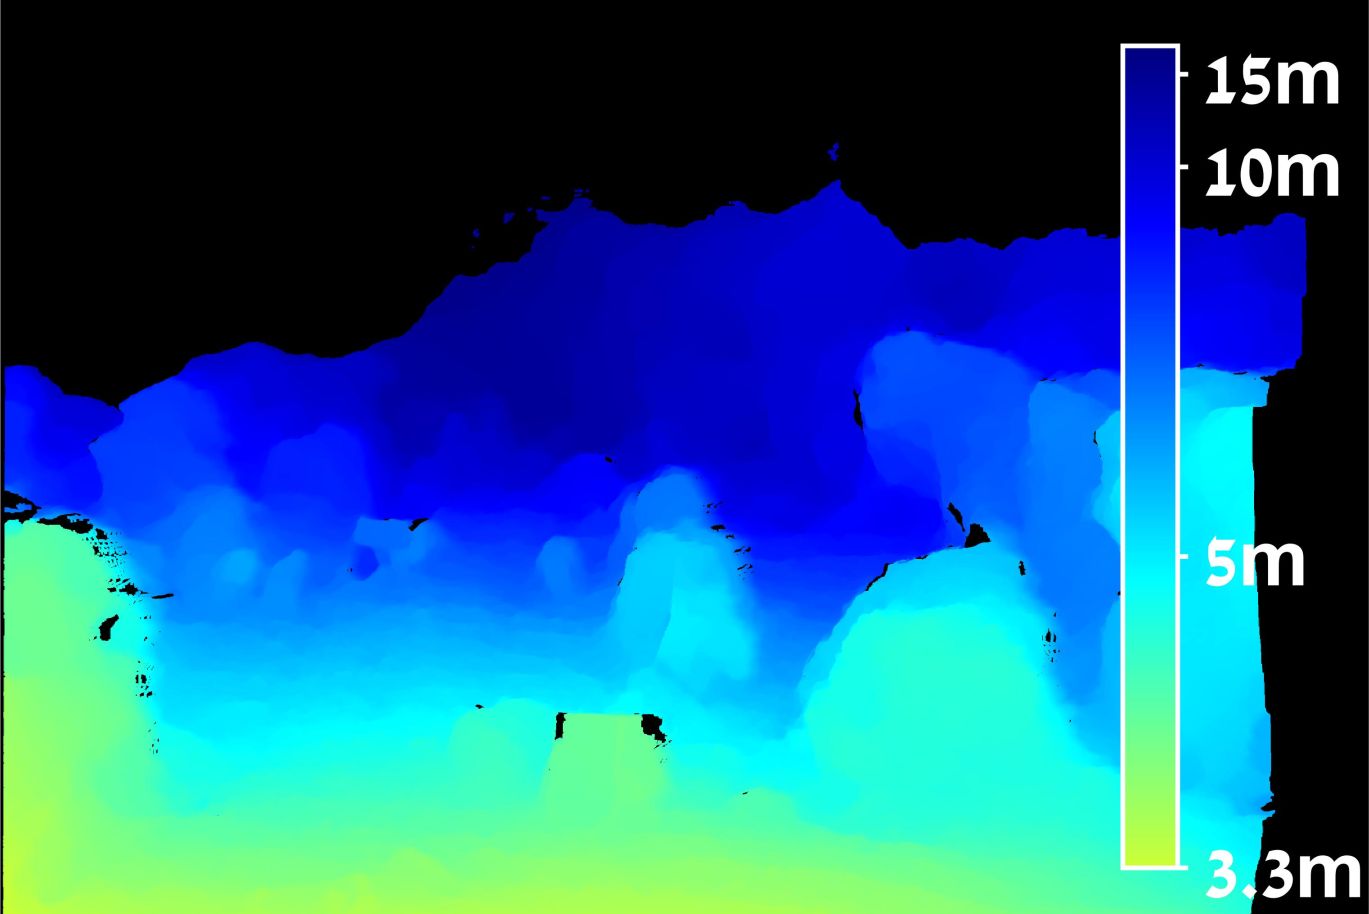
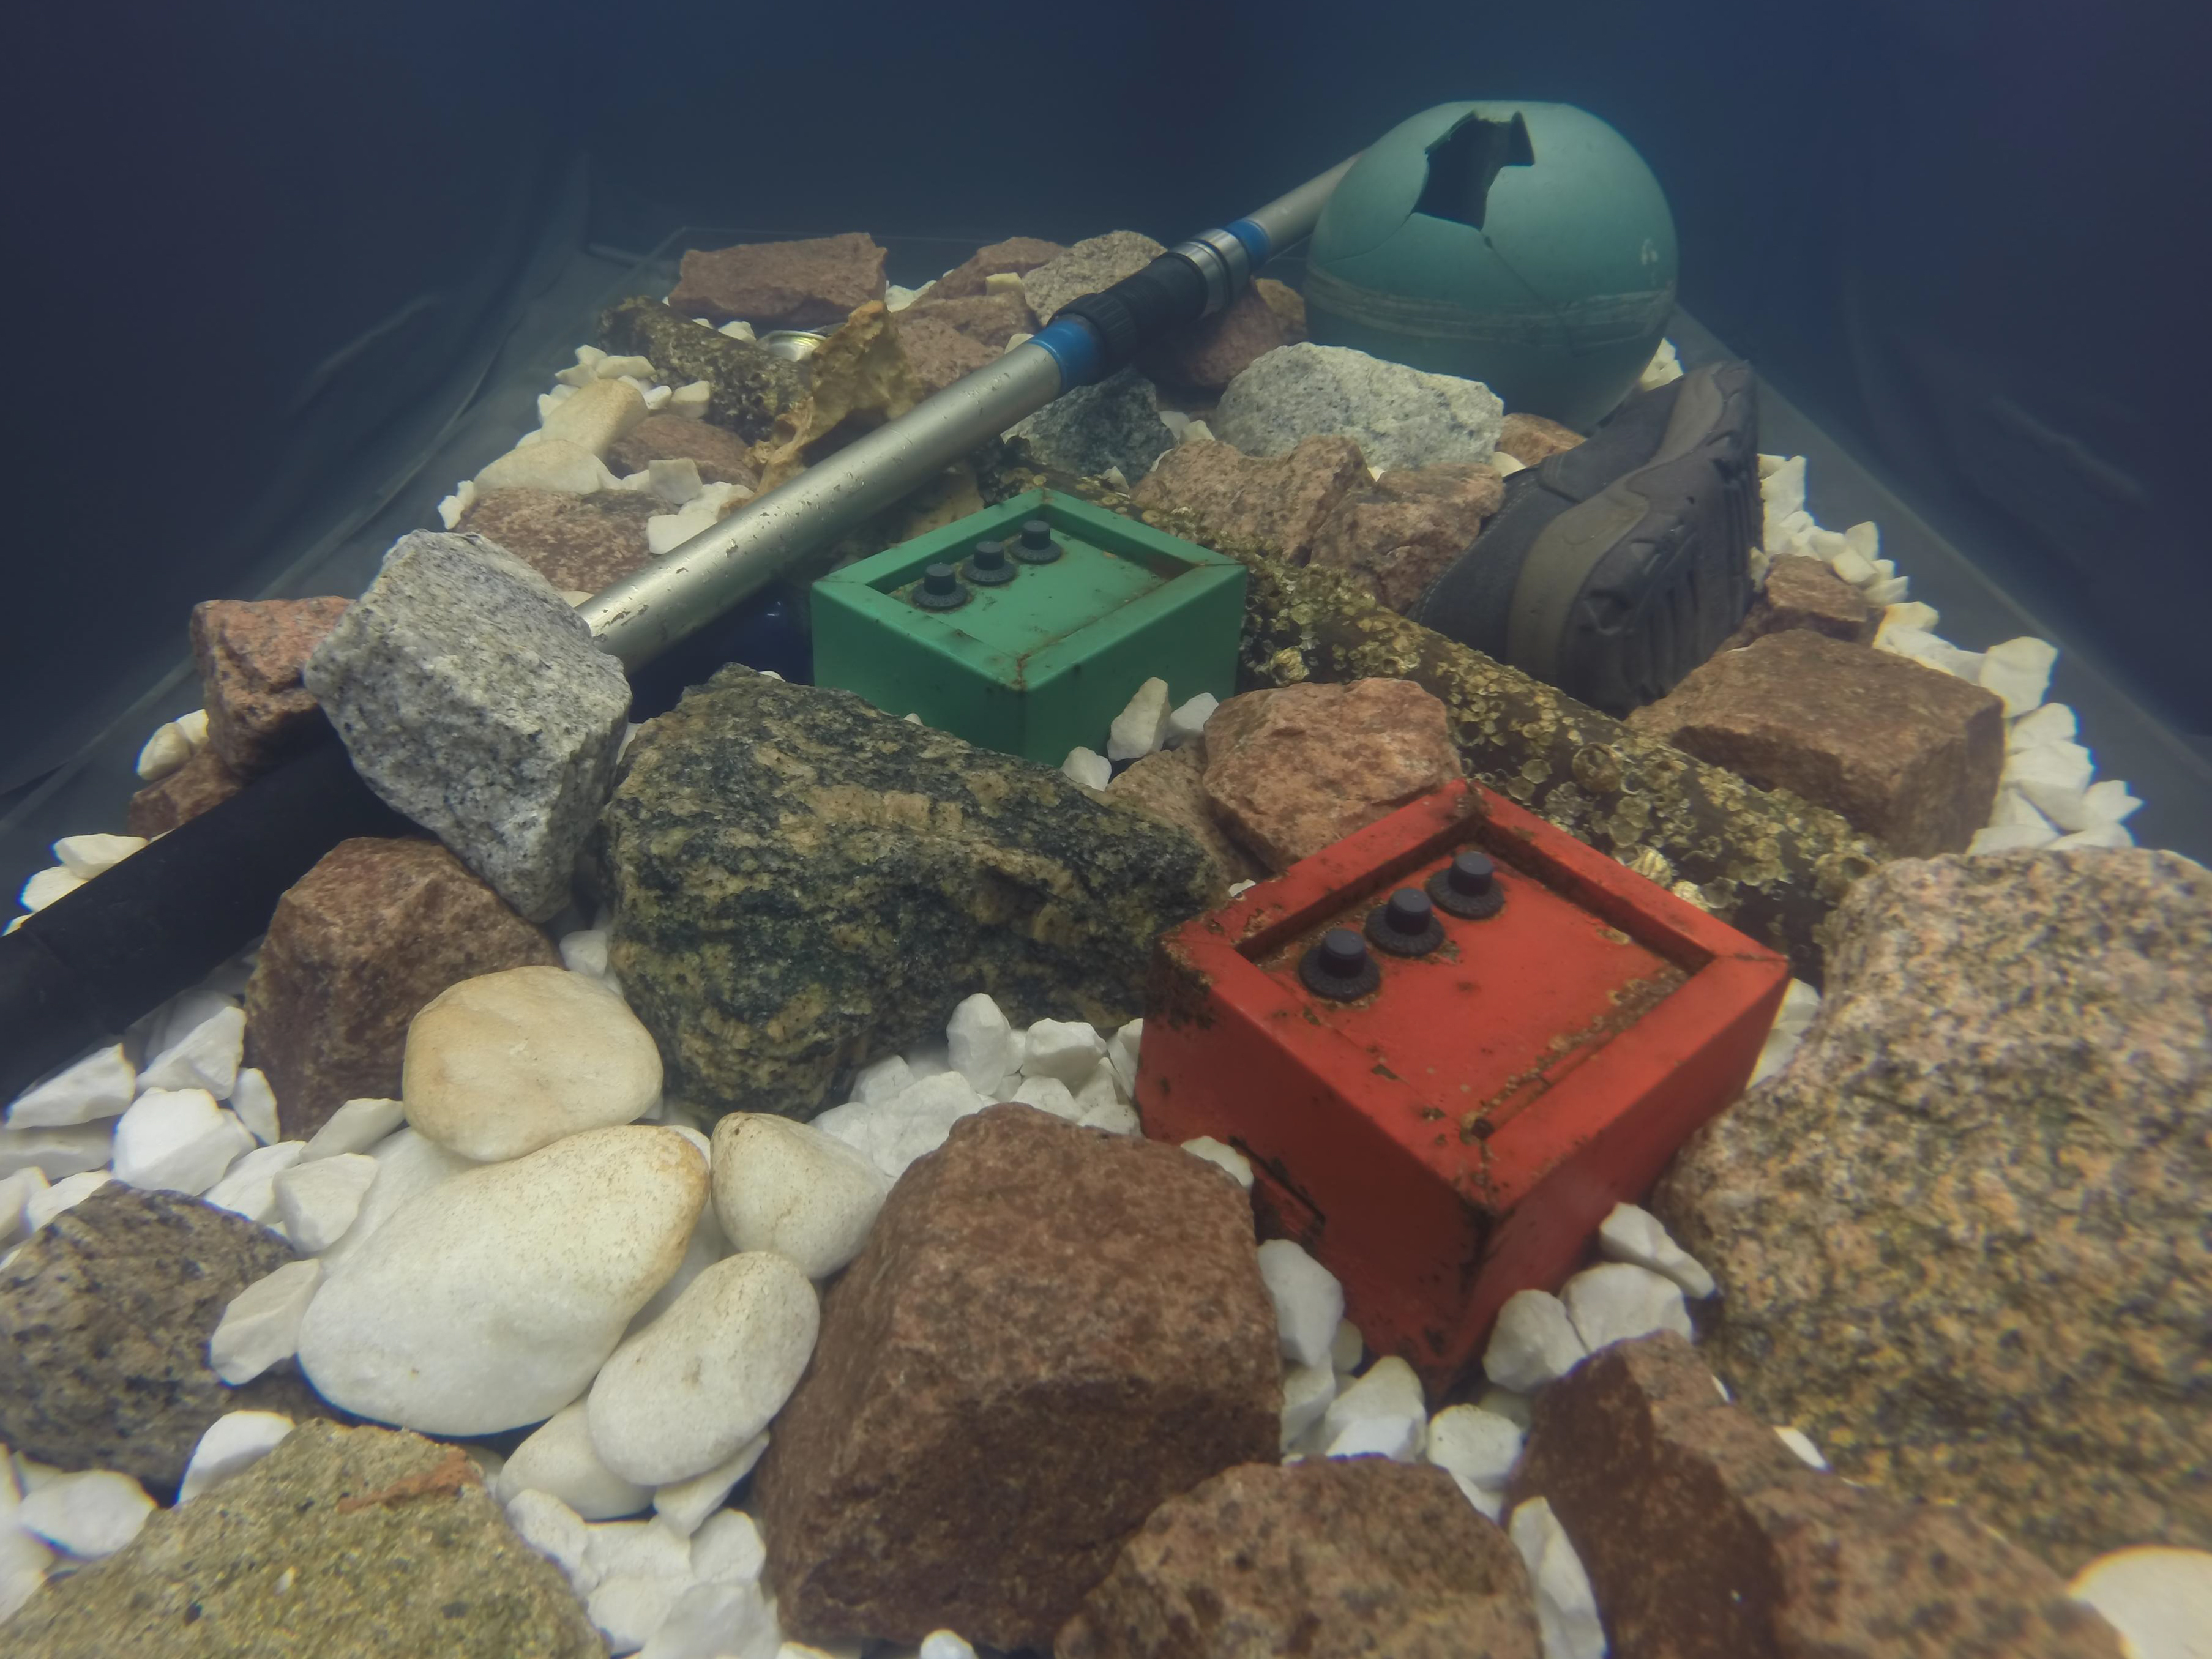
The Stereo Quantitative Underwater Image Dataset (SQUID) [134] and Sea-thru [20] include scene range information and colour charts to facilitate the evaluation of colour accuracy. SQUID [134] has 4 sets of images captured by a stereo camera with colour charts placed in the scene at different ranges. One set of the images captures a shipwreck and three sets capture coral reefs. The range information in SQUID was calculated from a checkerboard of known size with the MATLAB stereo calibration toolbox and Epicflow [141]. However, some ranges are missing due to occlusions (Fig. 3(e)). Sea-thru [20] comprises 5 sets totalling 1,157 images in clear and turbid water, with different viewing angles, and at ranges between 4 and 10 metres (Fig. 3(f)). The ranges were obtained, using Structure from Motion algorithm, from stereo images where an object of known size is placed in the scene333An object of known size is required since Structure from Motion only estimates the range in relative scales..
6.2 Digitally or chemically degraded datasets
Degradations can be generated digitally or with chemical reagents added to a water body. Digitally degraded images are synthesised with physics-based models (e.g. Eq. 4) or neural networks. Chemically degraded datasets add reagents to pure water to mimic degradations occurring naturally underwater. These datasets have reference degradation-free images that can be used for quantitative evaluation.
As for digitally degraded datasets, the PR 2019 Synthetic Underwater Image Dataset [58] contains 1,449 images synthesised from the NYU-D indoor dataset [125] with Eq. 4 (Fig. 3(h)). The dataset is synthesised for 10 Jerlov water types and different degradation levels. Fabbri et al. [57] presented a dataset of underwater images for training a CycleGAN [124] using degraded images from ImageNet and manual annotations for distortion. 6,143 images with distortion and 1,817 images without distortion were used for training. CycleGAN then generated the image pair with no distortion for the 6,143 images. The EUVP pair collection [54] uses the same approach and training dataset as Fabbri et al. [57] (Fig. 3(g)). A total of 24,840 reference underwater images are generated by the trained CycleGAN. The former approach does not model the range-dependent scattering, whereas the latter lacks proof that all the characteristics of water distortion are accurately synthesised in datasets.
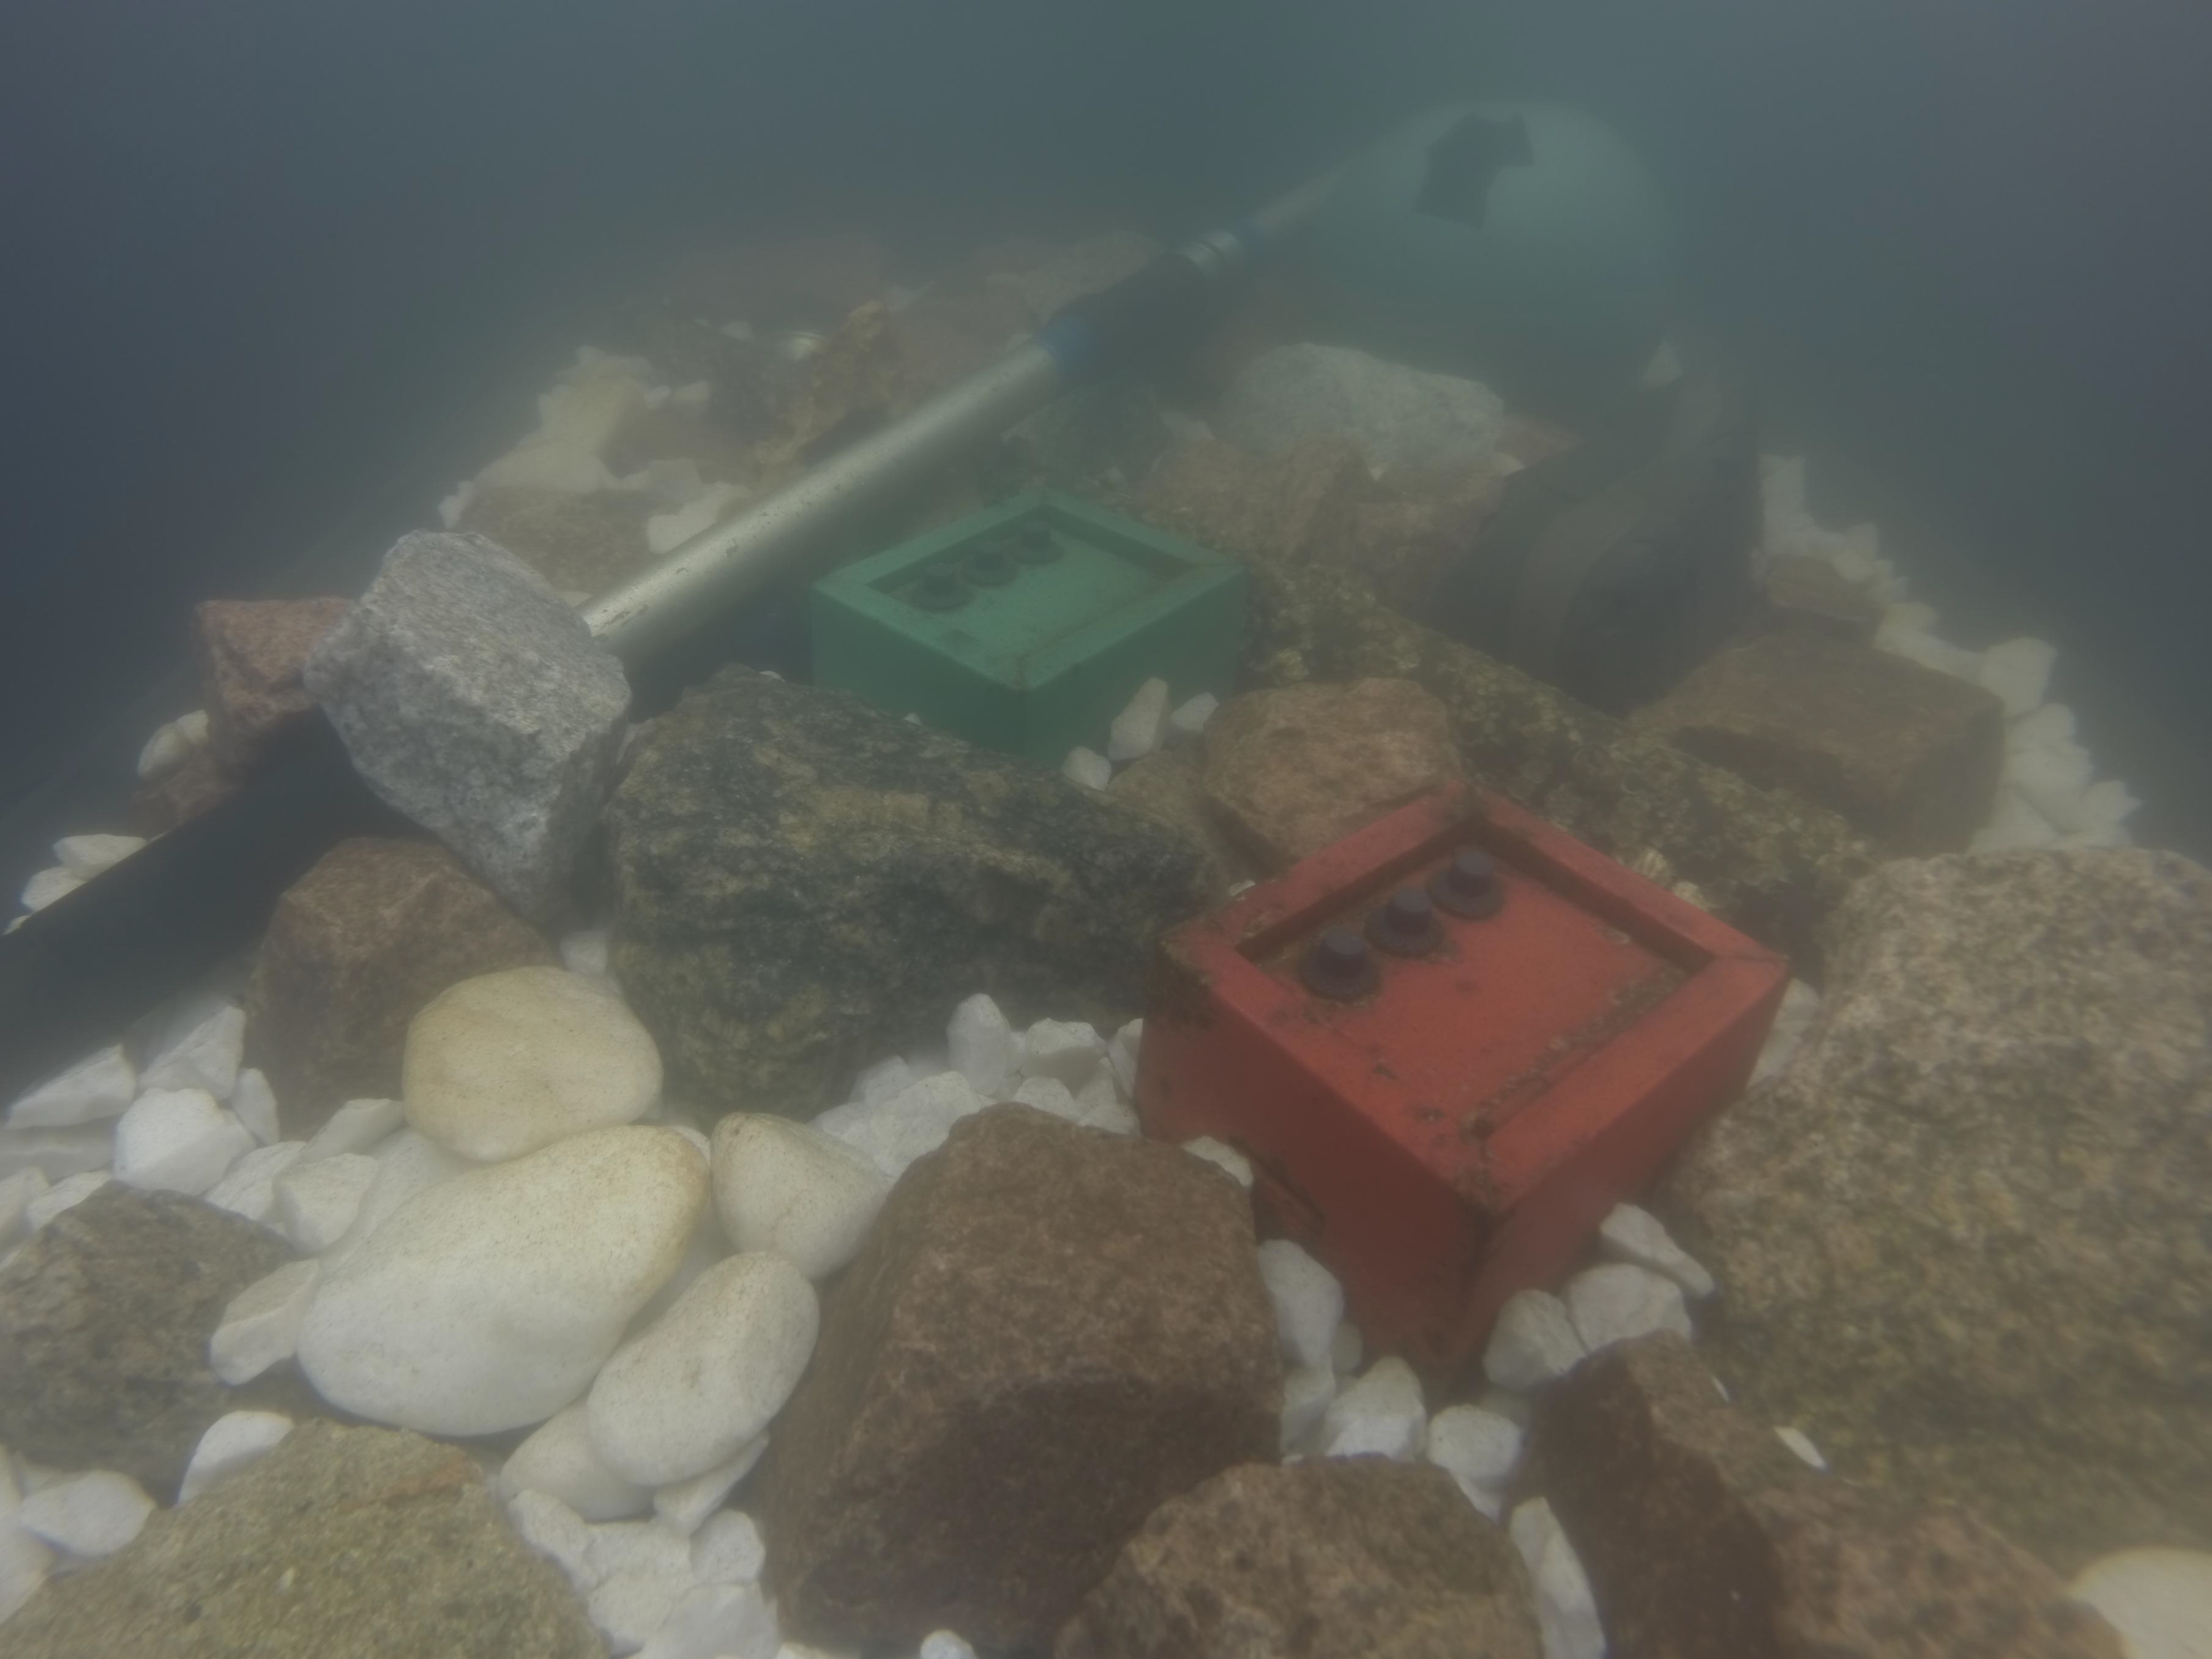
A notable chemically degraded dataset is TURBID [135] that captures artificial objects (such as plastic corals and metal boxes) placed on a sand floor in a water tank. To recreate the degradations occurring in natural water, milk was added for turbidity, methylene blue for a blue water appearance (DeepBlue subset, Fig. 3(i)) and chlorophyll for a green water appearance (Chlorophyll subset, Fig. 3(j)). TURBID provides reference images captured in a controlled water environment. However, the added reagents do not fully replicate the contributing factors of natural water environments, and hence may not be representative of underwater images captured in natural oceanic or costal waters.
|
|||||||||||||||
|
|||||||||||||||
|
|||||||||||||||
|
|||||||||||||||
|
|||||||||||||||
7 Evaluation
In this section, we discuss evaluation approaches to validate a task with objective measures (Sec. 7.1), as well as subjective tests (Sec. 7.2) and automatic quality assessment measures, which aim to produce results that align with human judgement (Sec. 7.3).
7.1 Task evaluation
Task evaluation consists of applying computer vision algorithms to quantify the improvement of underwater image filtering results or in assessing these results for a specific reference object or image region.
Several authors used the performance of computer vision algorithms to assess the effectiveness of filtering methods. Examples include feature point matching, employed in [34, 29]; image segmentation, employed in [34]; object detection, employed in [54, 57]; and pose estimation, employed in [54]. These evaluations are generally presented and discussed for a few images only and, in absence of a ground truth, no quantitative analysis can be performed.
The accuracy of colour reproduction can be evaluated, using a standard colour chart, by measuring the discrepancy between the colour of a patch in a filtered image and the colour of the same patch as its appears in a scene captured under a white illuminant. The colour difference can be measured as angular error [142] (in [23, 29]), Euclidean distance (in [50]), or CIE2000 [143] (in [34, 29]). This evaluation depends on the availability of images containing a colour chart and is limited to a specific water environment.
To assess the extent of water colour preservation, the change in water colour between the degraded and filtered image can measured, considering that the colour of the water mass should not be substantially modified during filtering. This evaluation can be used to assess, for images with visible pure water regions, the quality of the restoration along the range (i.e. the distance between an object and the camera). The change can be measured as the mean square error between the RGB intensities in pixels of the annotated water mass regions [17].
7.2 Subjective tests
Subjective tests for underwater images are challenging to design and, unlike standard quality assessment [144, 145], no established protocol exists. However, a set of specific instructions may help participants focus on what to evaluate.
Table VII summarises the existing subjective tests for underwater image filtering results.
| Reference | Rank/select | Score | Against | Number of | Task/ Question | ||||||
| Double | Multi | degraded | Images | Methods | Part. | ||||||
| R | [13] | Emberton et al. | ✓ | 10 | 4 | 10 | select the preferred image out of 4 | ||||
| [22] | Emberton et al. | ✓ | 100 | 4 | 12 | select the preferred image out of 4 | |||||
| [55] | Li and Cavallaro | ✓ | ✓ | 12 | 3 | 21 | ’select the image that looks more like it is taken under a white illuminant’ | ||||
| [58] | Li et al. | ✓ | 20 | 5 | 20 | rank 5 images based on their perceived visual quality | |||||
| [17] | Li and Cavallaro | ✓ | ✓ | 26 | 5 | 23 | ’select the most attractive image’ out of 5 images | ||||
| [19] | Hou et al. | ✓ | 50 | 7 | 20 | score the 7 images from worst to best (1-7) based on preference | |||||
| E | [32] | Protasiuk et al. | ✓ | 4 | 10 | 10 | rank 4 images from least to most realistic (1-4) | ||||
| [54] | Islam et al. | ✓ | ✓ | 4 | 9 | 9 | out of 9 images, rank the top 3 based on quality | ||||
| [31] | Zhang et al. | ✓ | 4 | 1 | 30 | ’whether colour patches on a colour chart can be distinguished’ | |||||
| DS | [69] | UIEB | ✓ | ✓ | 890 | 12 | 50 | ’which one is better’ | |||
| [54] | EUVP | ✓ | 6,665 | 1 | 6 | ’whether the background and foreground are identifiable’ | |||||
Comparative experiments aim at the selection of the preferred images through double-stimulus tests [13, 22], multi-selection tests [17], or ranking of multiple filtered images [19, 58]. Other subjective tests [32, 31, 54] asked participants to score images based on ’how realistic they are’ [32] or to indicate whether the colour patches on a colour chart can be distinguished [31]. These experiments evaluated a few images only (4 in [31] and 40 in [32]). To validate the extent of colour cast removal, participants can be requested to select, in a double-stimulus test, the image that ’looks more like it is taken under a white illuminant’ [55].
Fig. 4 compares the filtering results of eight representative state-of-the-art methods, of which five are for restoration (Automatic Red Channel (ARC) [15], Depth-compensated Background Light Restoration (DBL) [17], Wavelength Compensation Image Dehazing (WCID) [21], Underwater Haze-line (UWHL) [23] and UWCNN [58]) and three for enhancement (Colour Balance and Fusion by Ancuti et al. (Fusion) [34], FUnIE [54] and WaterNET [69]). The selected images are typically used in publications and cover the two main Jerlov oceanic and coastal water categories, with scenes with non-uniform water colour and objects at a varying range from the camera. Among the restoration methods, WCID and UWHL are the only two that aim to compensate for the degradation through the depth under the water surface. WCID and DBL address the non-uniform water colour. ARC and DBL are designed for oceanic waters. UWHL is designed for all water types by iteratively restoring the images using the properties of the 10 Jerlov water types and selects the restored image that best fits the gray-world assumption. UWCNN also presents 10 networks trained for the 10 Jerlov water types, and we show the results for oceanic (type I) and coastal (type 3) water types.
ARC slightly darkens the images, owning to the use of weighted background light to replace the colour-channel dependent transmission map. Methods designed for oceanic water (ARC and DBL) have a limited performance on images taken in coastal waters. Although DBL fails to compensate for the degradation or remove any colour cast in green water, it compensates for the colour degradation along the range. Moreover, DBL successfully addresses the non-uniform water colour (Fig. 4 row 2). UWHL can compensate for the colour degradations in oceanic water, although it may produce over-saturated images (Fig. 4 row 1). UWHL can also remove the colour cast in heavily green casted images (Fig. 4 rows 5 to 7). However, the global white balancing used to remove the cast distorts the water colour and introduces unnatural reds in the scene. UWCNN, which was trained for oceanic type I waters, introduces a pink cast to oceanic images. This might be caused by the synthesised training dataset (PR synthesised dataset [58]), which does not contain objects naturally present in water: the network learned the colour distribution of indoor objects and overcompensates for the loss in red. While this network fails - as expected - to compensate for the colour casts in coastal waters, UWCNN trained for coastal type 3 fails to restore any images taken in either coastal or oceanic water. This confirms that, because of the lack of appropriate training datasets, neural networks, which are to date trained on synthetic datasets, are still underperforming in the underwater image restoration task.
The above aims to provide an unbiased analysis of the methods’ performances. However, readers might still ignore the visible artifacts and consider some of the said failure images to be of better qualities. We note that subjective tests are time-consuming to conduct and can be potentially biased by the pool of participants, if the pool is not selected and trained carefully. To overcome this problem, automatic assessment measures have been developed.
7.3 Automatic assessment
| Cat. | Measure | App. | attributes | Comb. | Subjective Test | ||||
| Colour | Visibility | Img. | Part. | Task | |||||
| FR | [96] | score | ✓ | ✓ | equal | \cellcolorblack!40not applicable | |||
| [82] | PKU-EAQA | rank | ✓ | ✓ | SVM | 400 | 30 | compare | |
| NR | [80] | UCIQE | score | ✓ | reg. | 44 | 12 | score | |
| [95] | CCF | score | ✓ | ✓ | reg. | 87 | 20 | score | |
| [81] | UIQM | score | ✓ | ✓ | reg. | 126 | 10 | score | |
We discuss generic Image Quality Assessment (IQA) measures used in underwater literature and IQA measures specifically designed for underwater images (Table VIII). IQA measures can be categorised as no-reference (NR) or full-reference (FR). NR measures require only the image under consideration, whereas FR measures require a reference image to measure the relative degradations.
| Original | ARC [15] | DBL [17] | UWHL [23] | UWCNN-I [58] | UWCNN-3 [58] | FUnIE [54] | Fusion [34] | WaterNET [69] |
Generic IQAs used in the underwater literature measure the ’reconstruction’ error or desirable properties of an image. The reconstruction error can be measured by FR IQA measures such as mean square error, PSNR and Structural Similarity [118]. As reference images are unavailable (Sec. 6.1), authors use as reference the degraded (original) image [36, 37, 38, 39, 31, 32, 52, 53, 56] or the filtered version of the degraded image preferred in a subjective test [69]. Alternatively, desirable properties such as sharpness, contrast and naturalness can be considered. Sharpness can be measured with a visible-edge count or entropy [26, 18, 39, 40], but noise introduced in the filtering process may also increase the sharpness scores, thus causing incorrect quality predictions. Contrast can be measured by Global Contrast Factor [146], Patch-based Contrast Quality Index [79], or Visibility Metric, originally proposed for hazy images [147]. The (un)naturalness of an image can be measured with the Blind/Referenceless Image Spatial Quality Evaluator (BRISQUE) [148], which quantifies distortions, including noise and blurring [16]. These IQAs have not yet been comprehensively validated for underwater images and are thus unsuitable as a standalone quality indicators.
Underwater-specific IQAs are designed to measure degradations caused by absorption and scattering in water (Table VIII). We discuss two FR-IQAs, namely [96] and PKU-EAQA [82], and three NR-IQAs, namely CCF [95], UCIQE [80] and UIQM [81]. All IQAs except derived the combination of their attributes by subjective tests.
An ideal reference image is required for , which combines the colour difference in the CIELab colour space [143] and structural similarity [118] with equal importance. However, this measure was not validated by a subjective test. PKU-EAQA [82] is a ranking measure that assesses the relative quality between two images. The ranking is based on colour degradation features (colour motion [149]) and edge details (GIST [150]) using a Support Vector Machine (SVM). The SVM is trained on a dataset consisting of relative ranks between 400 images (from 100 images, each processed by 4 methods) obtained from a subjective test with 30 participants.
Three underwater NR-IQAs are UCIQE [80], UIQM [81], and CCF [95]. UCIQE [80] measures only colour degradations, using statistics in the CIELab colour space [93], namely the standard deviation in chroma, average in saturation and difference between extreme values in luminance (defined in [151]). The chroma and saturation statistics only focus on individual pixel intensity values and not on the spatial distribution of intensities. The difference in luminance only concerns extreme pixels that could be easily biased towards distortion. In the subjective test, the participants were asked to score the image from ’Very annoying’, ’Annoying’, ’Slightly annoying’, ’Perceptible but not annoying’, and ’Imperceptible’. UCIQE is a linear combination with weights obtained from a subjective test with 12 participants and 44 underwater images. UIQM [81] accounts for the colour degradation with measurements of colourfulness using the opponent colour theory [98], and blurring degradation with measurements of edge sharpness [152] and contrasts [153]. UIQM is a linear combination with weights obtained from a subjective test with 10 participants and 126 images (14 different images processed by 8 methods and the original). However, the question asked in the subjective test is not reported in the publication. CCF [95] measures the colour degradation with a colourfulness index [151], and blurring and lack of visibility with a contrast measure [154] and a foggy index [155]. In the subjective test, 20 participants evaluated images of a colour chart captured at different distances in a water tank with different turbidity caused by adding aluminium hydroxide. The participants were asked to score from 1 to 5, which corresponds to ’Bad’, ’Poor’, ’Fair’, ’Good’ and ’Excellent’. The main limitation of this measure is that evaluating images taken in chemically created water environment may not fully reflect that of natural underwater images. Appendix details the definitions of the aforementioned NR-IQAs.
Although underwater-specific IQAs are straightforward and simple to use, they may fail in evaluating certain types of scenes [22]. Furthermore, existing IQAs are not directly comparable with each other as different collections of images were employed in their validation. To illustrate these limitations, Table IX reports the IQA measures on the images in Fig. 4. Since the three NR-IQA measures have different ranges, we use as the original images’ measured quality as a reference: a measure value higher than the original image (green shade) indicates the filtering method has improved the image quality, and vice versa (red shade). Out of the 56 filtered images, in only 35 instances (62.5%) that the three measures are in agreement (all consider the image quality has increased or decreased). Furthermore, the IQAs may not capture obvious distortions. An example is the images processed by UWHL [23] (Fig. 4 row 3), in which an unnatural red colour is introduced to the water region. However, all three measures indicate improvements in image quality, with UIQM and UCIQE indicating the processed image has the best quality among all the processed images. The lack of comparison between measures, and hence a standard quantitative evaluation scheme, is still an obstacle for using these measures to help improve (and compare) filtering methods.
|
8 Conclusion and outlook
We presented an extensive survey on underwater restoration and enhancement methods. We categorised the key design principles and discussed which methods are suited to different environments. We also covered datasets and loss functions employed in training neural networks and discussed their limitations. Moreover, we categorised and described underwater datasets based on their source of degradation. Finally, we discussed evaluation strategies, including subjective tests, and presented the limitations of popular image quality assessment measures. To conclude the survey, we highlight open research issues.
The success of deep neural networks in many computer vision tasks has not yet been replicated for underwater image filtering. Accurately modelled degraded images should be synthesised for training, accounting for oceanology models (see Section 2). While existing methods mainly use the Schechner-Karpel model [8], a more sophisticated model, such as the one proposed by Akkaynak-Treibitz [9], could be used to accurately account for the attenuation along the range and incorporate camera responses. Moreover, the attenuated illuminant and scattering should be incorporated, as done in [55].
Existing restoration methods focus mainly on compensating the colour degradation along the distance between an object and the camera [10, 11, 12, 13, 14, 15, 16, 17, 18, 19, 24, 25, 26]. A desirable research direction is removing the colour cast caused by attenuation through the depth under the water surface and considering the water colour when the water mass is visible. Other directions include compensating for the blurring and restoring images captured with artificial light.
Most enhancement methods apply the filtering on the whole image [27, 28, 29, 30, 31, 32, 35, 36, 37, 38]. However, the enhancement of captured objects and pure water mass should differ. Image fusion focuses on combining the processed versions by properties of the image (saliency or edges) [33, 34, 39, 40, 69]. Regions that are most worthy of enhancement could be more explicitly identified using saliency [34] or attention mechanisms in learning-based methods [156].
To conclude, defining a robust and accurate evaluation is an important open issue in underwater image filtering. Datasets that provide colour references (e.g. Sea-thru [20] and SQUID [134]) should be used to validate colour accuracy in restoration methods, whereas subjective tests should be used for enhancement methods, instead of relying completely on IQAs which have several limitations, as we have shown in Section 7.3. A thoroughly validated IQA measure, with a description of its applicable scenarios and limitations, would contribute to a standardised evaluation approach for underwater images and support progress in this field. To this end, to complement our survey, we provide a companion online platform, PUIQE [64], which supports underwater image filtering and evaluation.
Appendix: IQA definitions
This appendix summarises the definitions of no-reference underwater-specific image quality assessment measures (IQAs) discussed in Sec. 7.3, namely UCIQE [80], UIQM [81] and CCF [95].
Let an image of height and width be in RGB colour space and be in CIELab colour space, where L is the luminance channel. Let be the total number of pixels in the image. Let represent the grayscale image of I, computed as the average intensity between the R,G and B colour channels. Let be divided into blocks and let represent one of these blocks, . Unless otherwise stated, all operations are element-wise. We have modified the notations from the publications to avoid possible confusion among the three measures.
i. UCIQE (Yang and Sowmya [80])
UCIQE measures the colour degradation in the CIELab colour space, assuming the more colourful an image is, the better the image quality. Colourfulness in natural images can be represented by a combination of quantities including statistics of chroma C and saturation S [151], defined as
| C | (A.1) | |||
| S |
UCIQE quantifies the colourfulness by the standard deviation in chroma, , the difference between the top 1% and bottom 1% of values in L, , and the average of saturation, . The weights that combine the attributes are derived from the Mean Opinion Score (MOS) of testing images from the subjective test. The IQA is defined as
| (A.2) |
UCIQE states that the higher the value, the better the image quality.
ii. UIQM (Panetta et al. [81])
UIQM is a combination of three attributes: colourfulness (UICM), sharpness (UISM) and contrast (UIConM).
UICM uses an asymmetric alpha-trimmed statistics [157] that avoids the effect of outlier intensities on the measure, using the opponent colour components [98]
| RG | (A.3) | |||||
| YB |
Let be the intensity values in RG sorted in ascending order. The alpha-trimmed average for RG, , is defined as the average intensity in RG with the top and bottom values discarded, as
| (A.4) |
whereas the alpha-trimmed variance of RG, , is defined as
| (A.5) |
The alpha-trimmed mean and variance of YB, and , are similarly defined. UICM is defined as
| (A.6) |
UISM accounts for the sharpness degradation caused by forward scattering in each colour channel. Let be the function that applies the Sobel operator on a grayscale image [158]. For example, is the edge image obtained by applying the Sobel operator on R. UISM is defined in terms of the enhancement measure estimation function [153], , that measures the average logarithmic contrast ratio of blocks in the edge image, as
| (A.7) |
where is the natural logarithm function, and are the maximum and minimum values in the block, respectively. UISM is defined as
| (A.8) |
where the weights for each of is chosen to reflect human visual system’s response on the colour channel [159].
UIConM measures the relative contrast sensitivity using the logarithmic entropy [153] of the Michelson Contrast with PLIP operators 444The Michelson Contrast of is defined as . [160] in a block . The non-linear PLIP addition, subtraction and multiplication (, and , respectively) are used instead of their corresponding arithmetic operations (, and ) as they are more consistent with human visual perceptions [152]. The attribute is defined as
| (A.9) |
where is the PLIP Michelson Contrast, defined as
| (A.10) |
The IQA is defined as
| (A.11) |
UIQM states that the higher the value, the better the image quality.
iii. CCF (Wang et al. [95])
CCF is a combination of three attributes: colourfulness, contrast and fog density.
Colourfulness in CCF uses the colour model proposed by Ruderman et al. [161].
| (A.12) | ||||||||
where is the average intensity of . The opponent colour components are then defined as (compared to Eq. A.3)
| (A.13) | ||||||
Colourfulness is defined as
| (A.14) |
where and ( and ) are the variance and average of (), respectively.
The contrast attribute is defined in terms of the change of intensity of responses to an edge operator in an ’edge block’ - defined as blocks with more than 0.2% of the pixels being identified as an edge by the Sobel operator [158]. The size of the block is chosen to be , which approximates the size of the foveal region representing the highest visual acuity of human visual system [154]. Let where , be the one of the edge blocks of . Contrast of the image is defined as the sum of the intensity variances of the edge blocks, as
| (A.15) |
where is the average intensity in the block .
The fog density was proposed to measure the visibility in outdoor hazy images by Choi et al. [162]. It is defined as the ratio between the image’s Mahalanobis distance [163] to a pre-collected set of 500 foggy images, , and that to a set of 500 fog-free images, . The attribute is defined as
| (A.16) |
The IQA is defined as
| (A.17) | ||||
CFF states that the higher the value, the better the image quality.
References
- [1] C. Mobley, Light and Water: Radiative Transfer in Natural Waters. Academic Press, Jan. 1994.
- [2] B. Wozniak and J. Dera, Light absorption in sea water. Springer, New York, Jan. 2011.
- [3] N. G. Jerlov, Marine optics. Elsevier, Jan. 1976.
- [4] B. L. McGlamery, “A computer model for underwater camera systems,” in Ocean Opt. VI, SPIE, vol. 0208, Mar. 1980.
- [5] J. S. Jaffe, “Computer modeling and the design of optimal underwater imaging systems,” IEEE J. Ocean. Eng., vol. 15, no. 2, pp. 101–111, Apr. 1990.
- [6] S. Q. Duntley, “Light in the sea,” J. Opt. Soc. Am., vol. 53, no. 2, pp. 214–233, Feb. 1963.
- [7] D. F. Swinehart, “The Beer-Lambert law,” J. Chem. Educ., vol. 39, no. 7, pp. 333–335, July 1962.
- [8] Y. Y. Schechner and N. Karpel, “Clear underwater vision,” in Proc. IEEE Conf. Comput. Vis. Pattern Recognit., June 2004, pp. 536–543.
- [9] D. Akkaynak and T. Treibitz, “A revised underwater image formation model,” in Proc. IEEE Conf. Comput. Vis. Pattern Recognit., June 2018, pp. 6723–6732.
- [10] Y. Y. Schechner and N. Karpel, “Recovery of underwater visibility and structure by polarization analysis,” IEEE J. Ocean. Eng., vol. 30, no. 3, pp. 570–587, July 2005.
- [11] T. Treibitz and Y. Y. Schechner, “Active polarization descattering,” IEEE Trans. Pattern Anal. Mach. Intell., vol. 31, no. 3, pp. 385–399, Mar. 2009.
- [12] P. Drews Jr, E. do Nascimento, F. Moraes, S. Botelho, and M. Campos, “Transmission estimation in underwater single images,” in Proc. IEEE Int. Conf. Comput. Vis. Workshop, Dec. 2013, pp. 825–830.
- [13] S. Emberton, L. Chittka, and A. Cavallaro, “Hierarchical rank-based veiling light estimation for underwater dehazing,” in Proc. British Mach. Vis. Conf., Sep. 2015, pp. 125.1–125.12.
- [14] N. Carlevaris-Bianco, A. Mohan, and R. M. Eustice, “Initial results in underwater single image dehazing,” in OCEANS 2010 MTS/IEEE Seattle, Sep. 2010, pp. 1–8.
- [15] A. Galdran, D. Pardo, A. Picon, and A. Alvarez-Gila, “Automatic Red-Channel underwater image restoration,” J. Vis. Commun. Image Represent., vol. 26, pp. 132–145, Jan. 2015.
- [16] Y. T. Peng and P. C. Cosman, “Underwater image restoration based on image blurriness and light absorption,” IEEE Trans. Image Process., vol. 26, no. 4, pp. 1579–1594, Apr. 2017.
- [17] C. Y. Li and A. Cavallaro, “Background light estimation for depth-dependent underwater image restoration,” in Proc. IEEE Int. Conf. Image Process., Oct. 2018, pp. 1528–1532.
- [18] C. Li, J. Guo, R. Cong, Y. Pang, and B. Wang, “Underwater image enhancement by dehazing with minimum information loss and histogram distribution prior,” IEEE Trans. Image Process., vol. 25, no. 12, pp. 5664–5677, Dec. 2016.
- [19] G. Hou, J. Li, G. Wang, H. Yang, B. Huang, and Z. Pan, “A novel dark channel prior guided variational framework for underwater image restoration,” J. Vis. Commun. Image Represent., vol. 66, pp. 1047–3203, Jan. 2020.
- [20] D. Akkaynak and T. Treibitz, “Sea-thru: A method for removing water from underwater images,” in Proc. IEEE Conf. Comput. Vis. Pattern Recognit., June 2019, pp. 1682–1691.
- [21] J. Chiang and Y. Chen, “Underwater image enhancement: Using wavelength compensation and image dehazing,” IEEE Trans. Image Process., vol. 21, no. 4, pp. 1756–1769, Apr. 2012.
- [22] S. Emberton, L. Chittka, and A. Cavallaro, “Underwater image and video dehazing with pure haze region segmentation,” Comput. Vis. Image Underst., vol. 168, pp. 145–156, Mar. 2018.
- [23] D. Berman, T. Treibitz, and S. Avidan, “Diving into haze-lines: Color restoration of underwater images,” in Proc. British Mach. Vis. Conf., Sep. 2017, pp. 44.1–44.12.
- [24] Y. Hu, K. Wang, X. Zhao, H. Wang, and Y. Li, “Underwater image restoration based on convolutional neural network,” in Proc. Asian Conf. on Mach. Learning, vol. 95, Nov. 2018, pp. 296–311.
- [25] Y. Shin, Y. Cho, G. Pandey, and A. Kim, “Estimation of ambient light and transmission map with common convolutional architecture,” in OCEANS 2016 MTS/IEEE Monterey, Sep. 2016, pp. 1–7.
- [26] Y. Wang, J. Zhang, Y. Cao, and Z. Wang, “A deep CNN method for underwater image enhancement,” in Proc. IEEE Int. Conf. Image Process., Sep. 2017, pp. 1382–1386.
- [27] X. Fu, P. Zhuang, Y. Huang, Y. Liao, X. Zhang, and X. Ding, “A retinex-based enhancing approach for single underwater image,” in Proc. IEEE Int. Conf. Image Process., Oct. 2014, pp. 4572–4576.
- [28] C. Tang, U. F. von Lukas, M. Vahl, S. Wang, Y. Wang, and M. Tan, “Efficient underwater image and video enhancement based on retinex,” in Signal, Image and Video Process., Feb. 2014, pp. 4572–4576.
- [29] S. Gao, M. Zhang, Q. Zhao, X. Zhang, and Y. Li, “Underwater image enhancement using adaptive retinal mechanisms,” IEEE Trans. Image Process., vol. 28, no. 11, pp. 5580–5595, June 2019.
- [30] C. Sánchez-Ferreira, L. Coelho, H. Ayala, M. Farias, and C. Llanos, “Bio-inspired optimization algorithms for real underwater image restoration,” Signal Process.: Image Commun., vol. 77, pp. 49 – 65, Sep. 2019.
- [31] S. Zhang, T. Wang, J. Dong, and H. Yu, “Underwater image enhancement via extended multi-scale retinex,” Neurocomputing, vol. 245, pp. 1 – 9, July 2017.
- [32] R. Protasiuk, A. Bibi, and B. Ghanem, “Local color mapping combined with color transfer for underwater image enhancement,” in IEEE Winter Conf. Appl. Comput. Vis., Jan. 2019, pp. 1433–1439.
- [33] C. Ancuti, C. O. Ancuti, T. Haber, and P. Bekaert, “Enhancing underwater images and videos by fusion,” in Proc. IEEE Conf. Comput. Vis. Pattern Recognit., June 2012, pp. 81–88.
- [34] C. O. Ancuti, C. Ancuti, C. D. Vleeschouwer, and P. Bekaert, “Color balance and fusion for underwater image enhancement,” IEEE Trans. Image Process., vol. 27, no. 1, pp. 379–393, Jan. 2018.
- [35] K. Iqbal, M. Odetayo, A. James, R. A. Salam, and A. Z. H. Talib, “Enhancing the low quality images using unsupervised colour correction method,” in Proc. IEEE Int. Conf. Syst., Man, Cybern., Oct. 2010, pp. 1703–1709.
- [36] S. Serikawa and H. Lu, “Underwater image dehazing using joint trilateral filter,” Comput. Electr. Eng., vol. 40, no. 1, pp. 41–50, Jan. 2014.
- [37] C. J. Prabhakar and P. U. Praveen Kumar, “Underwater image denoising using adaptive wavelet subband thresholding,” in 2010 Int. Conf. Signal Image Process., Oct. 2010, pp. 322–327.
- [38] C. Dai, M. Lin, J. Wang, and X. Hu, “Dual-purpose method for underwater and low-light image enhancement via image layer separation,” IEEE Access, vol. 7, pp. 178 685–178 698, Dec. 2019.
- [39] A. Khan, S. S. A. Ali, A. S. Malik, A. Anwer, and F. Meriaudeau, “Underwater image enhancement by wavelet based fusion,” in Proc. IEEE Int. Conf. Underwater Syst. Technology: Theory and Applications (USYS), Dec. 2016, pp. 83–88.
- [40] S. Vasamsetti, N. Mittal, B. C. Neelapu, and H. K. Sardana, “Wavelet based perspective on variational enhancement technique for underwater imagery,” Ocean Eng., vol. 141, pp. 88 – 100, Sep. 2017.
- [41] G. D. Lakshmi and K. R. Krishnan, “Analyzing underwater videos for fish detection, counting and classification,” in Int. Conf. Comput. Vis. Bio-Inspired Comput., S. Smys, J. M. R. S. Tavares, V. E. Balas, and A. M. Iliyasu, Eds., vol. 1108, Jan. 2020, pp. 431–441.
- [42] M. Mehrnejad, A. B. Albu, D. Capson, and M. Hoeberechts, “Towards robust identification of slow moving animals in deep-sea imagery by integrating shape and appearance cues,” in Proc. Int. Conf. Pattern Recognit. Workshop Comput. Vis. Anal. Underwater Imagery (CVAUI), Aug. 2014, pp. 25–32.
- [43] D. L. Rizzini, F. Kallasi, F. Oleari, and S. Caselli, “Investigation of vision-based underwater object detection with multiple datasets,” Int. J. Adv. Robot. Syst., vol. 12, p. 77, June 2015.
- [44] G. L. Foresti and S. Gentili, “A vision based system for object detection in underwater images,” Int. J. Pattern Recognit. Artif. Intell., vol. 14, no. 2, pp. 167–188, Mar. 2000.
- [45] F. Kallasi, D. L. Rizzini, F. Oleari, and J. Aleotti, “Computer vision in underwater environments: A multiscale graph segmentation approach,” in OCEANS 2015 MTS/IEEE Genova, May 2015, pp. 1–6.
- [46] D. Lee, G. Kim, D. Kim, H. Myung, and H.-T. Choi, “Vision-based object detection and tracking for autonomous navigation of underwater robots,” Ocean Eng., vol. 48, pp. 59–68, July 2012.
- [47] V. Lopez-Vazquez, J. M. Lopez-Guede, S. Marini, E. Fanelli, E. Johnsen, and J. Aguzzi, “Video image enhancement and machine learning pipeline for underwater animal detection and classification at cabled observatories,” Sensors, vol. 20, no. 3, Jan. 2020.
- [48] D. Skarlatos, S. Demestiha, and S. Kiparissi, “An ‘open’method for 3D modelling and mapping in underwater archaeological sites,” Int. J. Heritage in the Digital Era, vol. 1, no. 1, pp. 1–24, Mar. 2012.
- [49] M. Johnson-Roberson, O. Pizarro, S. B. Williams, and I. Mahon, “Generation and visualization of large-scale three-dimensional reconstructions from underwater robotic surveys,” J. Field Robot., vol. 27, no. 1, pp. 21–51, Dec. 2009.
- [50] J. Li, K. A. Skinner, R. Eustice, and M. Johnson-Roberson, “WaterGAN: Unsupervised generative network to enable real-time color correction of monocular underwater images,” IEEE Robot. Autom. Lett., vol. 3, pp. 387–394, Apr. 2018.
- [51] P. M Uplavikar, Z. Wu, and Z. Wang, “All-in-one underwater image enhancement using domain-adversarial learning,” in Proc. IEEE Conf. Comput. Vis. Pattern Recognit. Workshop, June 2019.
- [52] X. Yu, Y. Qu, and M. Hong, “Underwater-GAN: Underwater image restoration via conditional generative adversarial network,” in Pattern Recognit. and Information Forensics. Cham: Springer Int. Publishing, Aug. 2019, pp. 66–75.
- [53] Y. Hashisho, M. Albadawi, T. Krause, and U. F. von Lukas, “Underwater color restoration using U-Net denoising autoencoder,” in Proc. Int. Symp. on Image Signal Process. Anal., Sep. 2019, pp. 117–122.
- [54] M. J. Islam, Y. Xia, and J. Sattar, “Fast underwater image enhancement for improved visual perception,” IEEE Robot. Automat. Letters, vol. 5, no. 2, pp. 3227–3234, Apr. 2020.
- [55] C. Y. Li and A. Cavallaro, “Cast-GAN: Learning to remove colour cast in underwater images,” in Proc. IEEE Int. Conf. Image Process., Oct. 2020, pp. 1083–1087.
- [56] X. Sun, L. Liu, Q. Li, J. Dong, E. Lima, and R. Yin, “Deep pixel-to-pixel network for underwater image enhancement and restoration,” IET Image Process., vol. 13, no. 3, pp. 469–474, Feb. 2019.
- [57] C. Fabbri, M. J. Islam, and J. Sattar, “Enhancing underwater imagery using generative adversarial networks,” in Proc. IEEE Int. Conf. Robot. Automat., May 2018, pp. 7159–7165.
- [58] C. Li, S. Anwar, and F. Porikli, “Underwater scene prior inspired deep underwater image and video enhancement,” Pattern Recognit., vol. 98, pp. 1–11, Feb. 2020.
- [59] Y. Guo, H. Li, and P. Zhuang, “Underwater image enhancement using a multiscale dense generative adversarial network,” IEEE J. Ocean. Eng., vol. 45, no. 3, pp. 862–870, 2020.
- [60] M. Hou, R. Liu, X. Fan, and Z. Luo, “Joint residual learning for underwater image enhancement,” in Proc. IEEE Int. Conf. Image Process., Oct. 2018, pp. 4043–4047.
- [61] C. Li, J. Guo, and C. Guo, “Emerging from water: Underwater image color correction based on weakly supervised color transfer,” IEEE Signal Process. Letters, vol. 25, no. 3, pp. 323–327, Jan. 2018.
- [62] J. Lu, N. Li, S. Zhang, Z. Yu, H. Zheng, and B. Zheng, “Multi-scale adversarial network for underwater image restoration,” Optics & Laser Technology, vol. 110, pp. 105 – 113, Feb. 2019.
- [63] H. Li, J. Li, and W. Wang, “A fusion adversarial underwater image enhancement network with a public test dataset,” arXiv:1906.06819, June 2019.
- [64] C. Y. Li, “Platform for underwater image quality evaluation,” available: https://www.puiqe.eecs.qmul.ac.uk/.
- [65] R. Schettini and S. Corchs, “Underwater image process.: State of the art of restoration and image enhancement methods,” EURASIP J. Adv. Signal Process., vol. 746052, Apr. 2010.
- [66] H. Lu, Y. Li, Y. Zhang, M. Chen, S. Serikawa, and H. Kim, “Underwater optical image process.: a comprehensive review,” Mobile Networks and Appl., vol. 22, no. 6, pp. 1204–1211, Dec 2017.
- [67] Y. Wang, W. Song, G. Fortino, L. Qi, W. Zhang, and A. Liotta, “An experimental-based review of image enhancement and image restoration methods for underwater imaging,” IEEE Access, vol. 7, pp. 140 233–140 251, July 2019.
- [68] M. Yang, J. Hu, C. Li, G. Rohde, Y. Du, and K. Hu, “An in-depth survey of underwater image enhancement and restoration,” IEEE Access, vol. 7, pp. 123 638–123 657, Aug. 2019.
- [69] C. Li, C. Guo, W. Ren, R. Cong, J. Hou, S. Kwong, and D. Tao, “An underwater image enhancement benchmark dataset and beyond,” IEEE Trans. Image Process., vol. 29, no. 11, pp. 4376–4389, Nov. 2019.
- [70] J. Raihan A, P. E. Abas, and L. C. De Silva, “Review of underwater image restoration algorithms,” IET Image Process., vol. 13, no. 10, pp. 1587–1596, Sep. 2019.
- [71] W. Zhang, L. Dong, X. Pan, P. Zou, L. Qin, and W. Xu, “A survey of restoration and enhancement for underwater images,” IEEE Access, vol. 7, pp. 182 259–182 279, Aug. 2019.
- [72] S. Anwar and C. Li, “Diving deeper into underwater image enhancement: A survey,” Signal Process.: Image Commun., vol. 89, p. 115978, Nov. 2020.
- [73] R. W. Gould, R. A. Arnone, and P. M. Martinolich, “Spectral dependence of the scattering coefficient in case 1 and case 2 waters,” Appl. Opt., vol. 38, no. 12, pp. 2377–2383, Apr. 1999.
- [74] M. Wernand, “Poseidon’s paintbox : historical archives of ocean colour in global-change perspective,” 2011, utrecht University.
- [75] R. W. Preisendorfer, “Application of radiative transfer theory to light measurements in the sea,” Union of Geodetic Geophysical Institute Monograph, vol. 10, pp. 11–30, Jan. 1961.
- [76] H. R. Gordon, “Can the lambert‐beer law be applied to the diffuse attenuation coefficient of ocean water?” Limnology and Oceanography, vol. 34, pp. 1389–1409, Dec. 1989.
- [77] S. Premoze, M. Ashikhmin, R. Ramamoorthi, and S. Nayar, “Practical rendering of multiple scattering effects in participating media,” in Proc. Eurographics Workshop on Rendering Techniques, June 2004, pp. 363–373.
- [78] G. Buchsbaum, “A spatial processor model for object colour perception,” J. the Franklin Institute, vol. 310, no. 1, pp. 1–26, July 1980.
- [79] S. Wang, K. Ma, H. Yeganeh, Z. Wang, and W. Lin, “A patch-structure representation method for quality assessment of contrast changed images,” IEEE Signal Process. Lett., vol. 22, pp. 2387–2390, Dec. 2015.
- [80] M. Yang and A. Sowmya, “An underwater color image quality evaluation metric,” in IEEE Trans. Image Process., vol. 24, no. 12, Dec. 2015, pp. 6062–6071.
- [81] K. Panetta, C. Gao, and S. Agaian, “Human-visual-system-inspired underwater image quality measures,” IEEE J. Ocean. Eng., vol. 41, no. 3, pp. 541–551, July 2016.
- [82] Z. Chen, T. Jiang, and Y. Tian, “Quality assessment for comparing image enhancement algorithms,” in Proc. IEEE Conf. Comput. Vis. Pattern Recognit., June 2014, pp. 3003–3010.
- [83] M. Ebner and J. Hansen, “Depth map color constancy,” Bio-Algorithms and Med-Systems, vol. 9, no. 4, pp. 167 – 177, Dec. 2013.
- [84] F. Liu, C. Shen, and G. Lin, “Deep convolutional neural fields for depth estimation from a single image,” in Proc. IEEE Conf. Comput. Vis. Pattern Recognit., June 2015, pp. 5162–5170.
- [85] D. Scharstein, R. Szeliski, and R. Zabih, “A taxonomy and evaluation of dense two-frame stereo correspondence algorithms,” in Proc. IEEE Workshop on Stereo and Multi-Baseline Vis., Dec 2001, pp. 131–140.
- [86] M. G. Solonenko and C. D. Mobley, “Inherent optical properties of Jerlov water types,” Appl. Opt., vol. 54, no. 17, pp. 5392–5401, June 2015.
- [87] K. He, J. Sun, and X. Tang, “Single image haze removal using dark channel prior,” IEEE Trans. Pattern Anal. Mach. Intell., vol. 33, no. 12, pp. 2341–2353, Dec. 2011.
- [88] D. Berman, T. Treibitz, and S. Avidan, “Non-local image dehazing,” in Proc. IEEE Conf. Comput. Vis. Pattern Recognit., June 2016, pp. 1674 – 1682.
- [89] S. G. Narasimhan and S. K. Nayar, “Vision and the atmosphere,” Int. J. Comput. Vis., vol. 48, no. 3, pp. 233–254, July 2002.
- [90] M. T. Orchard and C. A. Bouman, “Color quantization of images,” IEEE Trans. Signal Process., vol. 39, no. 12, pp. 2677–2690, Dec. 1991.
- [91] A. Torralba and A. Oliva, “Statistics of natural images categories,” Network: Comput. Neural Syst., vol. 14, pp. 391–412, Sep. 2003.
- [92] D. Cheng, D. K. Prasad, and M. S. Brown, “Illuminant estimation for color constancy: why spatial-domain methods work and the role of the color distribution,” J. Opt. Soc. Am. A, vol. 31, no. 5, pp. 1049–1058, May 2014.
- [93] K. McLaren, “XIII: The development of the CIE 1976 (L*a*b*) uniform colour space and colour-difference formula,” J. Soc. Dyers Colour, vol. 92, no. 9, pp. 338–341, Sep. 1976.
- [94] G. Valensi, “Procédé de télévision en couleurs,” FR Patent 841335, May 1939.
- [95] Y. Wang, N. Li, Z. Li, Z. Gu, H. Zheng, B. Zheng, and M. Sun, “An imaging-inspired no-reference underwater color image quality assessment metric,” Comput. & Electrical Eng., vol. 70, pp. 904 – 913, Aug. 2018.
- [96] H. Lu, Y. Li, X. Xu, L. He, Y. Li, D. Dansereau, and S. Serikawa, “Underwater image descattering and quality assessment,” in Proc. IEEE Int. Conf. Image Process., Sep. 2016, pp. 1998–2002.
- [97] E. H. Land and J. J. McCann, “Lightness and retinex theory,” J. Opt. Soc. Am., vol. 61, no. 1, pp. 1–11, Jan. 1971.
- [98] E. Hering, Grundzűge der Lehre vom Lichtsinn. Springer, Berlin, Heidelberg, month 1920.
- [99] K. Zuiderveld, Contrast Limited Adaptive Histogram Equalization. USA: Academic Press Professional, Inc., Aug. 1994, p. 474–485.
- [100] A. Polesel, G. Ramponi, and V. J. Mathews, “Image enhancement via adaptive unsharp masking,” IEEE Trans. Image Process., vol. 9, no. 3, pp. 505–510, Mar. 2000.
- [101] M.-C. Chuang, J.-N. Hwang, and K. Williams, “Supervised and unsupervised feature extraction methods for underwater fish species recognition,” in Proc. Int. Conf. Pattern Recognit. Workshop Comput. Vis. Anal. Underwater Imagery (CVAUI), Aug. 2014, pp. 33–40.
- [102] G. Wang, J.-N. Hwang, K. Williams, and G. Cutter, “Closed-loop tracking-by-detection for rov-based multiple fish tracking,” in Proc. Int. Conf. Pattern Recognit. Workshop Comput. Vis. Anal. Underwater Imagery (CVAUI), Dec. 2016, pp. 7–12.
- [103] C. Spampinato, J. Chen-Burger, G. Nadarajan, and R. Fisher, “Detecting, tracking and counting fish in low quality unconstrained underwater videos,” in Proc. Int. Conf. Comput. Vis. Theory Appl., vol. 2, Jan. 2008, pp. 514–519.
- [104] L. Corgnati, L. Mazzei, S. Marini, S. Aliani, A. Conversi, A. Griffa, B. Isoppo, and E. Ottaviani, “Automated gelatinous zooplankton acquisition and recognition,” in Proc. Int. Conf. Pattern Recognit. Workshop Comput. Vis. Anal. Underwater Imagery (CVAUI), Aug. 2014, pp. 1–8.
- [105] N. S. Hirata, M. A. Fernandez, and R. M. Lopes, “Plankton image classification based on multiple segmentations,” in Proc. Int. Conf. Pattern Recognit. Workshop Comput. Vis. Anal. Underwater Imagery (CVAUI), Dec. 2016, pp. 55–60.
- [106] M. Soriano, S. Marcos, C. Saloma, M. Quibilan, and P. Alino, “Image classification of coral reef components from underwater color video,” in MTS/IEEE Oceans 2001. An Ocean Odyssey., vol. 2, Nov. 2001, pp. 1008–1013.
- [107] NOAA, “What is a ROV?” Aug. 2019, available: https://oceanexplorer.noaa.gov/facts/rov.html/.
- [108] I. Sturgis and T. Sarah Knapton, “100 species discovered as scientists find new ocean zone,” Aug. 2019, available: https://www.telegraph.co.uk/science/2018/05/07/100-species-discovered-scientists-find-new-ocean-zone/.
- [109] J. Osterloff, I. Nilssen, and J. Järnegren, “Computer vision enables short- and long-term analysis of lophelia pertusa polyp behaviour and colour from an underwater observatory,” Sci. Rep., vol. 9, Apr. 2019.
- [110] James Gorman, New York Times, “Seafloor microscope zooms in on tiniest bits of coral,” July 2016, available: https://www.nytimes.com/2016/07/13/science/seafloor-microscope-coral.html.
- [111] Intel Corporation, “Using artificial intelligence to save coral reefs,” Apr. 2020, available: https://newsroom.intel.com/news/using-artificial-intelligence-save-coral-reefs/.
- [112] E. Blakemore, National Geographic, “Explainer: How underwater archaeology reveals hidden wonders,” Aug. 2019, available: https://www.nationalgeographic.com/culture/archaeology/underwater-archaeology/.
- [113] L. Whitcomb, D. R. Yoerger, H. Singh, and J. Howland, “Advances in underwater robot vehicles for deep ocean exploration: Navigation, control, and survey operations,” in Robotics Research. London: Springer, London, 2000, pp. 439–448.
- [114] S. Botelho, F. Codevilla, J. Gaya, and N. Duarte Filho, “Achieving turbidity robustness on underwater images local feature detection,” in Proc. British Mach. Vis. Conf., Jan. 2015, pp. 154.1–154.1.
- [115] A. Ortiz, M. Simó, and G. Oliver, “A vision system for an underwater cable tracker,” Mach. Vis. Appl., vol. 13, no. 3, pp. 129–140, July 2002.
- [116] T. Moons, L. Van Gool, and M. Vergauwen, “3d reconstruction from multiple images: Part 1 - principles.” Foundations and Trends in Computer Graphics and Vision, vol. 4, pp. 287–404, Jan. 2009.
- [117] R. H. Wallis, “An approach for the space variant restoration and enhancement of images,” Proc. Symposium on Current Mathematical Problems in Image Science, pp. 10–16, Nov. 1976.
- [118] Z. Wang, A. C. Bovik, H. R. Sheikh, and E. P. Simoncelli, “Image quality assessment: From error visibility to structural similarity,” IEEE Trans. Image Process., vol. 13, no. 4, pp. 600–612, Apr. 2004.
- [119] Z. Wang, E. Simoncelli, and A. Bovik, “Multiscale structural similarity for image quality assessment,” in Asilomar Conf. Signals, Syst. Comput., vol. 2, Dec. 2003, pp. 1398 – 1402.
- [120] M. Mathieu, C. Couprie, and Y. LeCun, “Deep multi-scale video prediction beyond mean square error,” in 4th International Conference on Learning Representations, ICLR 2016, Jan. 2016.
- [121] J. Johnson, A. Alahi, and F. Li, “Perceptual losses for real-time style transfer and super-resolution,” in Proc. Eur. Conf. Comput. Vis., Oct. 2016, pp. 694–711.
- [122] P. Isola, J. Zhu, T. Zhou, and A. A. Efros, “Image-to-image translation with conditional adversarial networks,” in Proc. IEEE Conf. Comput. Vis. Pattern Recognit., June 2017, pp. 5967–5976.
- [123] I. Goodfellow, J. Pouget-Abadie, M. Mirza, B. Xu, D. Warde-Farley, S. Ozair, A. Courville, and Y. Bengio, “Generative adversarial nets,” in Proc. Int. Conf. Neural Info. Process. Syst., Dec. 2014, pp. 2672–2680.
- [124] J. Zhu, T. Park, P. Isola, and A. A. Efros, “Unpaired image-to-image translation using cycle-consistent adversarial networks,” in IEEE Int. Conf. Comput. Vis., Oct. 2017, pp. 2242–2251.
- [125] S. Nathan, H. Derek, K. Pushmeet, and F. Rob, “Indoor segmentation and support inference from RGBD images,” in Proc. Eur. Conf. Comput. Vis., Oct. 2012, pp. 746–760.
- [126] J. Wulff, D. J. Butler, G. B. Stanley, and M. J. Black, “Lessons and insights from creating a synthetic optical flow benchmark,” in Proc. Eur. Conf. Comput. Vis. Workshop, Oct. 2012, pp. 168–177.
- [127] D. Martin, C. Fowlkes, D. Tal, and J. Malik, “A database of human segmented natural images and its application to evaluating segmentation algorithms and measuring ecological statistics,” in Proc. Int. Conf. Comput. Vis., July 2001, pp. 416–423.
- [128] O. Ronneberger, P. Fischer, and T. Brox, “U-net: Convolutional networks for biomedical image segmentation,” in Medical Image Computing and Computer-Assisted Intervention, vol. 9351, Oct. 2015, pp. 234–241.
- [129] A. Torralba and A. A. Efros, “Unbiased look at dataset bias,” in Proc. IEEE Conf. Comput. Vis. Pattern Recognit., June 2011, pp. 1521–1528.
- [130] T. Tommasi, N. Patricia, B. Caputo, and T. Tuytelaars, A Deeper Look at Dataset Bias. Cham: Springer Int. Publishing, Sep. 2017, pp. 37–55.
- [131] L. C. H.R. Sheikh, Z.Wang and A. Bovik, “LIVE image quality assessment database release 2,” http://live.ece.utexas.edu/research/quality.
- [132] R. Liu, X. Fan, M. Zhu, M. Hou, and Z. Luo, “Real-world underwater enhancement: Challenges, benchmarks, and solutions,” arXiv:1901.05320, Jan. 2019.
- [133] “CLEF initiative,” available: http://www.clef-initiative.eu/ [Accessed: 01-Oct-2020].
- [134] D. Berman, D. Levy, S. Avidan, and T. Treibitz, “Underwater Single Image Color Restoration Using Haze-Lines and a New Quantitative Dataset,” IEEE Trans. Pattern Anal. Mach. Intell. (Early Access), 2020.
- [135] A. Duarte, F. Codevilla, J. D. O. Gaya, and S. S. C. Botelho, “A dataset to evaluate underwater image restoration methods,” in OCEANS 2016 - Shanghai, Sep. 2016, pp. 1–6.
- [136] C. Li, J. Guo, C. Guo, R. Cong, and J. Gong, “A hybrid method for underwater image correction,” Pattern Recognit. Letters, vol. 94, pp. 62 – 67, July 2017.
- [137] X. Fu, Z. Fan, M. Ling, Y. Huang, and X. Ding, “Two-step approach for single underwater image enhancement,” in 2017 International Symposium on Intelligent Signal Processing and Communication Systems (ISPACS), 2017, pp. 789–794.
- [138] Y. Peng, K. Cao, and P. C. Cosman, “Generalization of the dark channel prior for single image restoration,” IEEE Trans. Image Process., vol. 27, no. 6, pp. 2856–2868, June 2018.
- [139] W. Ren, S. Liu, H. Zhang, J. Pan, X. Cao, and M.-H. Yang, “Single image dehazing via multi-scale convolutional neural networks,” in Proc. Eur. Conf. Comput. Vis., Oct. 2016, pp. 154–169.
- [140] “Dive++,” available: https://apps.apple.com/us/app/dive-video-color-correction/id1251506403/ [Accessed: 01-Oct-2020].
- [141] J. Revaud, P. Weinzaepfel, Z. Harchaoui, and C. Schmid, “EpicFlow: Edge-Preserving Interpolation of Correspondences for Optical Flow,” in Proc. IEEE Conf. Comput. Vis. Pattern Recognit., June 2015, pp. 1164–1172.
- [142] G. D. Finlayson, R. Zakizadeh, and A. Gijsenij, “The reproduction angular error for evaluating the performance of illuminant estimation algorithms,” IEEE Trans. Pattern Anal. Mach. Intell., vol. 39, no. 7, pp. 1482–1488, July 2017.
- [143] G. Sharma, W. Wu, and E. N. Dalal, “The CIEDE2000 color-difference formula: Implementation notes, supplementary test data, and mathematical observations,” Color Research & Appl., vol. 30, no. 1, pp. 21–30, Dec. 2005.
- [144] International Telecommuncation Union, “Recommendation 500-14: Methodology for the subjective assessment of the quality of television pictures,” Sep. 2019.
- [145] Z. Li, A. Aaron, I. Katsavounidis, A. Moorthy, and M. Manohara, “Toward a practical perceptual video quality metric,” June 2016, available: https://netflixtechblog.com/toward-a-practical-perceptual-video-quality-metric-653f208b9652.
- [146] K. Matkovic, L. Neumann, A. Neumann, T. Psik, and W. Purgathofer, “Global contrast factor - a new approach to image contrast,” in Computational Aesthetics, May 2005, p. 159–167.
- [147] “A new visibility metric for haze images, MATLAB Central file exchange,” Jan. 2010. [Online]. Available: http://uk.mathworks.com/matlabcentral/fileexchange/33529-a-new-visibility-metric-for-haze-images/
- [148] A. Mittal, A. Moorthy, and A.Bovik, “No-reference image quality assessment in the spatial domain,” IEEE Trans. Image Process., vol. 21, no. 12, pp. 4695–4708, Aug. 2012.
- [149] M. Stricker and M. Orengo, “Similarity of color images,” in Proc. SPIE, vol. 2420, Mar. 1995, pp. 381–392.
- [150] A. Oliva and A. Torralba, “Modeling the shape of the scene: A holistic representation of the spatial envelope,” Int. J. Comput. Vis., vol. 42, no. 3, pp. 145–175, May 2001.
- [151] D. Hasler and S. Sasstrunk, “Measuring colourfulness in natural images,” Proc. SPIE Electronic Imaging 2003: Human Vis. and Electronic Imaging VIII, vol. 5007, pp. 87–95, June 2003.
- [152] K. Panetta, S. Agaian, Y. Zhou, and E. J. Wharton, “Parameterized logarithmic framework for image enhancement,” IEEE Trans. Syst. Man, Cybern. B, Cybern., vol. 41, no. 2, pp. 460–473, Apr. 2011.
- [153] K. Panetta, A. Samani, and S. Agaian, “Choosing the optimal spatial domain measure of enhancement for mammogram images,” J. Biomed. Imag., vol. 2014, Jan. 2014.
- [154] R. Ferzli and L. J. Karam, “A no-reference objective image sharpness metric based on the notion of just noticeable blur (JNB),” IEEE Trans. Image Process., vol. 18, no. 4, pp. 717–728, Apr. 2009.
- [155] L. K. Choi, J. You, and A. C. Bovik, “Referenceless prediction of perceptual fog density and perceptual image defogging,” IEEE Trans. Image Process., vol. 24, no. 11, pp. 3888–3901, Nov. 2015.
- [156] W. Wang and J. Shen, “Deep visual attention prediction,” IEEE Trans. Image Process., vol. 27, no. 5, pp. 2368–2378, May 2018.
- [157] J. Bednar and T. Watt, “Alpha-trimmed means and their relationship to median filters,” IEEE Trans. Acoust., Speech, Signal Process., vol. 32, no. 1, pp. 145–153, Feb. 1984.
- [158] I. Sobel and G. Feldman, “A 3×3 isotropic gradient operator for image processing,” Pattern Classification and Scene Anal., pp. 271–272, Jan. 1973.
- [159] W. K. Pratt, Digital Image Processing. Wiley, Apr. 1991.
- [160] A. A. Michelson, Studies in Optics. University of Chicago Press, Dec. 1927.
- [161] D. L. Ruderman, T. W. Cronin, and C.-C. Chiao, “Statistics of cone responses to natural images: implications for visual coding,” J. Opt. Soc. Am. A, vol. 15, no. 8, pp. 2036–2045, Aug. 1998.
- [162] A. B. L.K. Choi, J. You, “Referenceless prediction of perceptual fog density and perceptual image defogging,” IEEE Trans. Image Process., vol. 24, no. 11, pp. 3888–3901, July 2015.
- [163] P. C. Mahalanobis, “On the generalised distance in statistics,” in Proc. National Institute Sci. India, Apr. 1936, pp. 49–55.
