Vulnerability analysis in Complex Networks under a Flood Risk Reduction point of view
Abstract
The measurement and mapping of transportation network vulnerability to natural hazards constitute subjects of global interest for a sustainable development agenda and as means of adaptation to climate changes. During a flood, some elements of a transportation network can be affected, causing loss of lives. Furthermore, impacts include damage to vehicles, streets/roads, and other logistics services - sometimes with severe economic consequences. The Network Science approach may offer a valuable perspective considering one type of vulnerability related to network-type critical infrastructures: the topological vulnerability. The topological vulnerability index associated with an element is defined as the reduction on the network’s average efficiency due to the removal of the set of edges related to that element. In this paper we present the results of a systematic literature overview and a case study applying the topological vulnerability index for the highways in the state of Santa Catarina (Brazil). We produce a map considering that index and the areas susceptible to urban floods and landslides. The risk knowledge, combining hazard and vulnerability, is the first pillar of an Early Warning System, and represent an important tool for stakeholders from the transportation sector in a disaster risk reduction agenda.
1 Introduction
In a scenario of global change, some climatic and extreme weather events are expected to increase in frequency and intensity and cause more social and economic impacts in several sectors, such as transportation systems and urban mobility. As presented in several papers in literature, the cost for repairing transport assets after either an urban flood or landslide represents a significant percentage of the total damage cost of several recent disasters around the world (Pregnolato et al., (2017); Koks et al., (2019); Randil et al., (2022); Marulanda et al., (2022)) and in Brazil (Santos et al., (2017); Parizzi, (2022); Zákhia et al., (2022)).
To mitigate those impacts, it is necessary to evaluate the risk associated with disasters and the best ways to deal with them. “Disaster risk reduction is aimed at preventing new and reducing existing disaster risk and managing residual risk, all of which contribute to strengthening resilience and therefore to the achievement of sustainable development” (UNI, (2017)).
For disaster risk reduction, vulnerability is a key concept. There are several types and meanings for vulnerability. According to Wisner, (1994), vulnerability represents “the characteristics of a person or group and their situation that influence their capacity to anticipate, cope with, resist and recover from the impact of a natural hazard (an extreme natural event or process)”. The UN Office for disaster risk reduction also includes assets and systems as subjects to vulnerability: “The conditions determined by physical, social, economic and environmental factors or processes which increase the susceptibility of an individual, a community, assets or systems to the impacts of hazards” (UNI, (2017)).
In the transportation systems’ literature, there are also different meanings for vulnerability (Schlögl et al., (2019)). For example, Berdica, (2002) suggested that network vulnerability should be understood as “susceptibility to incidents that can result in considerable reductions in road network serviceability”, and Taylor et al., (2006) understood network vulnerability as the extent of a failure to impact the original purpose of the system.
Vulnerability is a key idea in Network Science as well. Due to its generality for representing the system topology (relation among the elements on the system), Network Science approaches have been applied to a huge number of very different areas (Newman, (2010)). Section 2.3 presents a Systematic Literature Mapping of papers related to road networks, natural disasters and network vulnerability. The listed works are predominantly from 2020, published in interdisciplinary and transport journals. The most frequent type of disaster and data origin are flooding/landsliding and USA/China.
This paper presents a formulation for a vulnerability index based on efficiencies of the system of networks. It aims to locate the most vulnerable links in a transportation network and to assess whether these links are susceptible to hazards and disruptions. The idea is presented as a case study on a set of highways, which are mapped based on vulnerability index and disaster susceptibility data.
2 Material and Methods
2.1 Study area
Brazil is among the ten countries most affected by weather-related disasters in the last 20 years (UNI, (2017)). Santa Catarina state, located in the Brazilian Southern region, is particularly affected by disasters - there is an annual mean of 64 damage records triggered by hydrological processes, such as floods in Santa Catarina municipalities (Herrmann, (2014)). The maximum value was achieved in 2008, when the material losses summed almost 1 billion US Dollar (Herrmann, (2014)).
According to the last census track (2010), there are 295 municipalities and more than 6 million inhabitants in the state. The State’s HDI - Human Development Index - is 0.774 and it is the third in the Brazilian HDI ranking (IBG, (2017)). Despite the high socio-economic indicators for municipalities from Santa Catarina state, there are many communities at risk in those places due to characteristics of land occupation (Londe et al., (2014, 2015)). The mountainous relief in the east side determined the human settlement in the fluvial plains, which are areas naturally prone to floods. Moreover, industrialization and economic growth attracted many people to the regions and induced interventions in the environment, such as deforestation, landfill and irregular constructions (Londe et al., (2014, 2015)).
The susceptible flood areas used in this study were mapped by the Brazilian Geological Survey (CPRM), based on a database of previous occurrences and in situ evaluation of physical characteristics (CPR, (2017)).
2.2 Topological vulnerability
Several topological measures can be extracted from a network and used to analyze the modeled phenomena or processes - see Costa et al., (2007). One of these simple and important indexes is the shortest path length between two nodes and , defined as the smallest number of links from to , among all the possible paths between and . On the other hand, the efficiency in the communication between nodes and can be defined as inversely proportional to shortest path length between them. The average efficiency of the network is defined as the average of all , considering all pairs of nodes. The topological vulnerability index of an element in a network , , is thus given by
| (1) |
where is the efficiency of the network when the element is inaccessible: all its edges are removed. The first paper considering the pointwise vulnerability index was that of Gol’dshtein et al., (2004), based on two relevant previous works: Latora and Marchiori, (2001, 2004).
According to Pregnolato et al., (2016), network models are typically aspatial: the emphasis has been on topological interactions, not on their geography. Mode details about space-related properties in Network Science can be found in Barthélemy, (2011); Daqing et al., (2011).
Here, we use the concept and tools of a (geo)graph, a network in a geographical space. Recently, this approach was applied for a mobility network analysis (Lima Santos et al., (2019)) and for a rainfall network analysis (Ceron et al., (2019)). In this paper, we represent a set of highways as a network, calculate the topological vulnerability index of its elements and show them on a map. We highlight the spacial location of the most vulnerable element, in order to combine this information with the locations most susceptible to either floods or landslides.
2.3 Systematic Literature Mapping
In this section we present a systematic literature mapping of papers related to road networks, natural disasters and network vulnerability. We collected manuscripts from Google Scholar using the following search protocol: “(graph OR network) AND (transport OR roads OR highways OR streets) AND (disaster OR flood OR flooding OR landslide) AND (vulnerability)”. The aim is to identify gaps and trends in literature.
We select the first forty papers and, as a cut-off criterion, we discard those whose abstracts and title deviates from the subject. We end up with twenty three articles grouped according to Table 1, in chronological publication order.
| Paper | Citations | Journal type | Country of the data | Context of “vulnerability” | Network type | Disaster type | Metric “vulnerability” |
|---|---|---|---|---|---|---|---|
| Balijepalli and Oppong, (2014) | 119 | Geography | England | graph | road network | natural disaster | vulnerability |
| Mattsson and Jenelius, (2015) | 605 | Transport | No Country | graph | road system | natural disaster | vulnerability |
| Lu et al., (2016) | 12 | interdisciplinary | China | transport | urban road network | natural disaster | vulnerability |
| Andersson-Sköld and Nyberg, (2016) | 21 | interdisciplinary | Swedish | disaster | streets | flooding | closeness |
| Postance et al., (2017) | 45 | interdisciplinary | United Kingdom | transport | road network | landslide | vulnerability |
| Helderop and Grubesic, (2019) | 20 | Transport | United States | transport | road network | storm surge flooding | susceptibility |
| Koks et al., (2019) | 159 | interdisciplinary | No Country | transport | road/railway | multi-hazard | vulnerability |
| Lu and Lin, (2019) | 17 | interdisciplinary | China | graph | urban rail transit | vehicle breakdown | vulnerability |
| Pérez-Morales et al., (2019) | 9 | interdisciplinary | Spain | transport | road network | flooding | vulnerability |
| Schlögl et al., (2019) | 25 | interdisciplinary | Austrian | graph | road network | landslide | susceptibility |
| Abdulla et al., (2020) | 119 | Transport Geography | England | graph | road network | flooding | vulnerability |
| Fan et al., (2020) | 18 | interdisciplinary | United States | transport | road networks | flooding | susceptibility |
| Hearn and Pongpanya, (2020) | 1 | Geology | Laos | disaster | road network | landslide | vulnerability |
| Jamshed et al., (2020) | 28 | interdisciplinary | No Country | disaster | rural vulnerability | flooding | vulnerability |
| Mera and Balijepalli, (2020) | 7 | Transport | United Kingdom | transport | streets | natural disaster | vulnerability |
| Wiśniewski et al., (2020) | 4 | Transport | Poland | transport | transport network urban | flooding | vulnerability |
| Wang et al., (2020) | 9 | interdisciplinary | China | transport | highway | flooding | vulnerability |
| Yin et al., (2020) | 8 | interdisciplinary | China | disaster | highway | landslide | susceptibility |
| Zhang et al., (2020) | 14 | Transport | United States | graph | transportation network | landslide | vulnerability |
| Alabbad et al., (2021) | 14 | Environmental Science | United States | graph | road network | flooding | vulnerability |
| Furno et al., (2021) | 1 | interdisciplinary | France | graph | transportation network | traffic Jam | vulnerability |
| Morelli and Cunha, (2021) | 13 | Transport | Brazil | disaster | road network | flooding | vulnerability |
| Shahdani et al., (2022) | 0 | interdisciplinary | Portugal | transport | road transport network | flooding | vulnerability |
Regarding networks, Roads (highways) are the most frequent, followed by streets (urban networks). Nearly all papers quantify vulnerability with the network metric of the same name. The context of the word “vulnerability” relates more often to transport and graphs, with only a few associated to disasters.
In particular, we mention the top three cited papers: Mattsson and Jenelius, (2015) provide a review of problems in transport systems around the globe; Koks et al., (2019) bring a global view of multiple natural disasters; and Abdulla et al., (2020) investigate vulnerability of transport networks from British data. They all explore the problem under different scales: global and country-level.
Some future research directions: mapping of critical segments (roads) and the creation of susceptibility indexes to build catastrophe models in response to extreme events such as flooding and severe wind storms; mapping landslides incidence and; how severe and frequent the phenomena is becoming (Postance et al.,, 2017). The literature also lacks a detailed assessment of how climate transformations impact transport systems (Pérez-Morales et al.,, 2019).
Here we quantify links’ vulnerability in a transportation network and their susceptibility to hazards and disruptions. We showed that the most well-cited works deal with a similar problem but at a country and global level, whereas we address it from a state-level perspective.
3 Results and Discussion
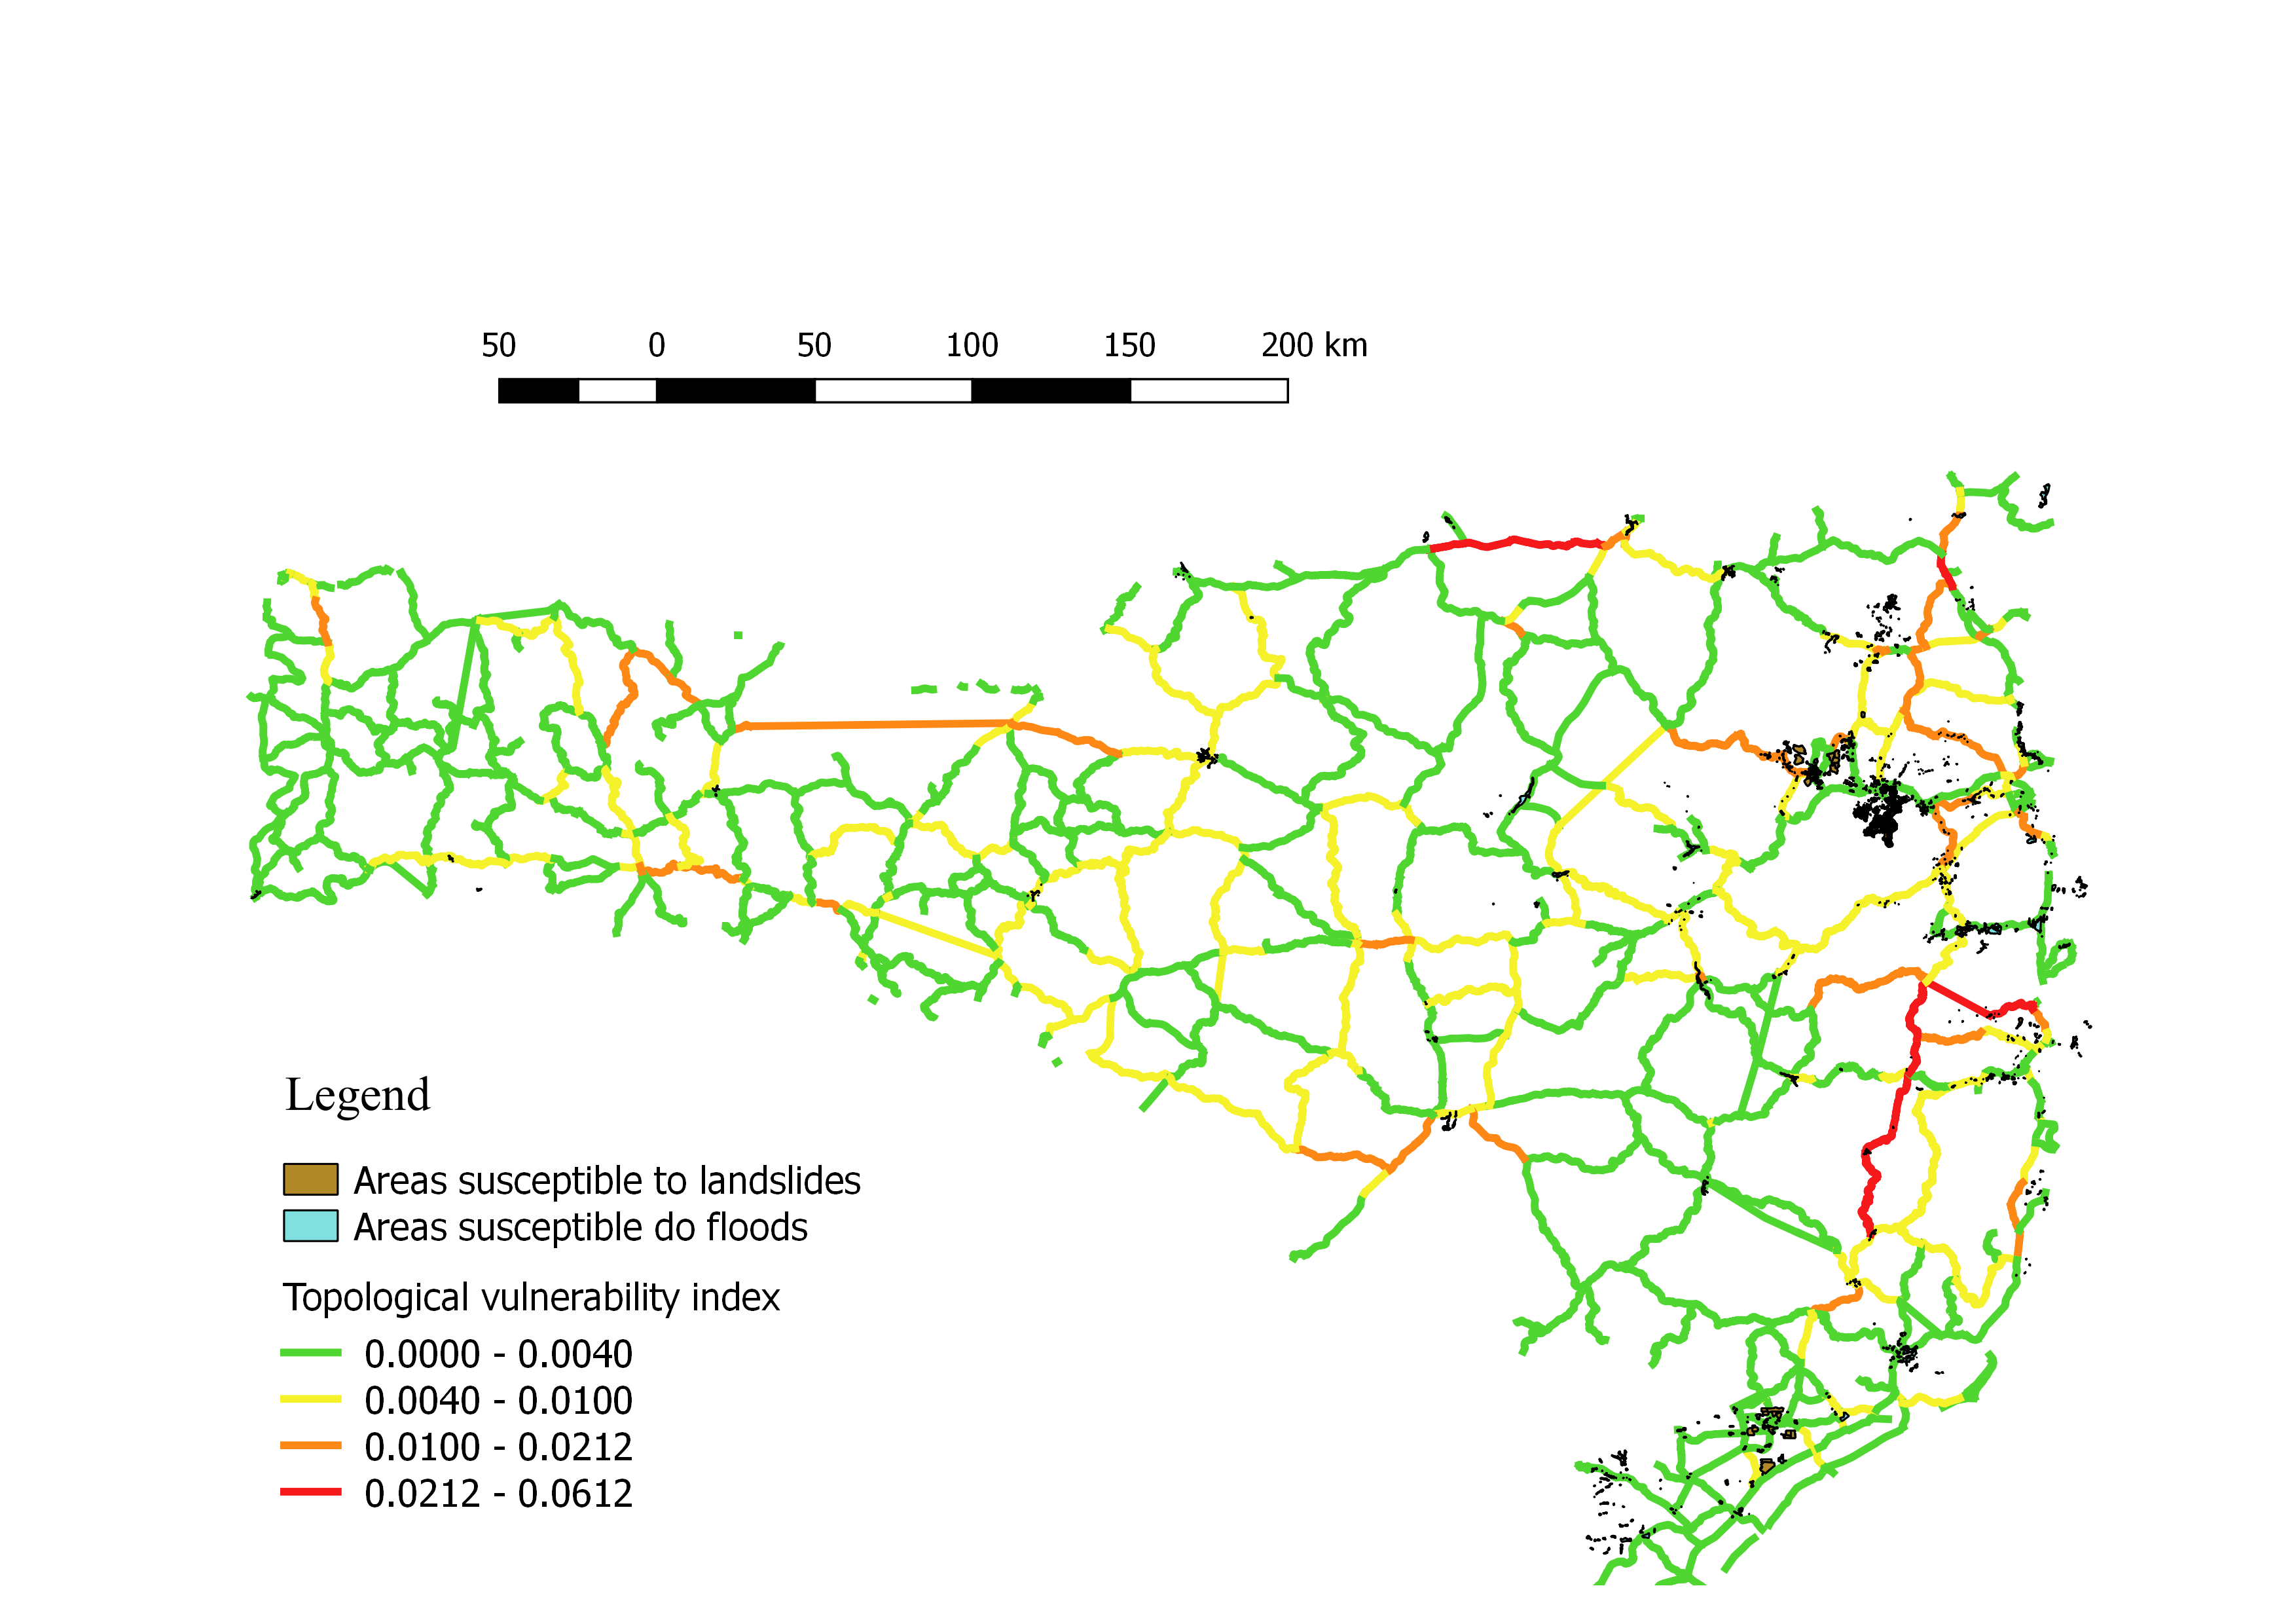
Using the (geo)graph approach, we represent the set of highways as a network. For the Santa Catarina State case study area, the road network presents 1536 nodes/road segments and 2101 directed edges/connections between road segments.
Figure 1 shows the topological vulnerability index map for all highways in the study area. There are 4 classes (colors in Figure 1), that corresponds to Low Vulnerability, Moderate Vulnerability, High Vulnerability, and Extremely High Vulnerability.
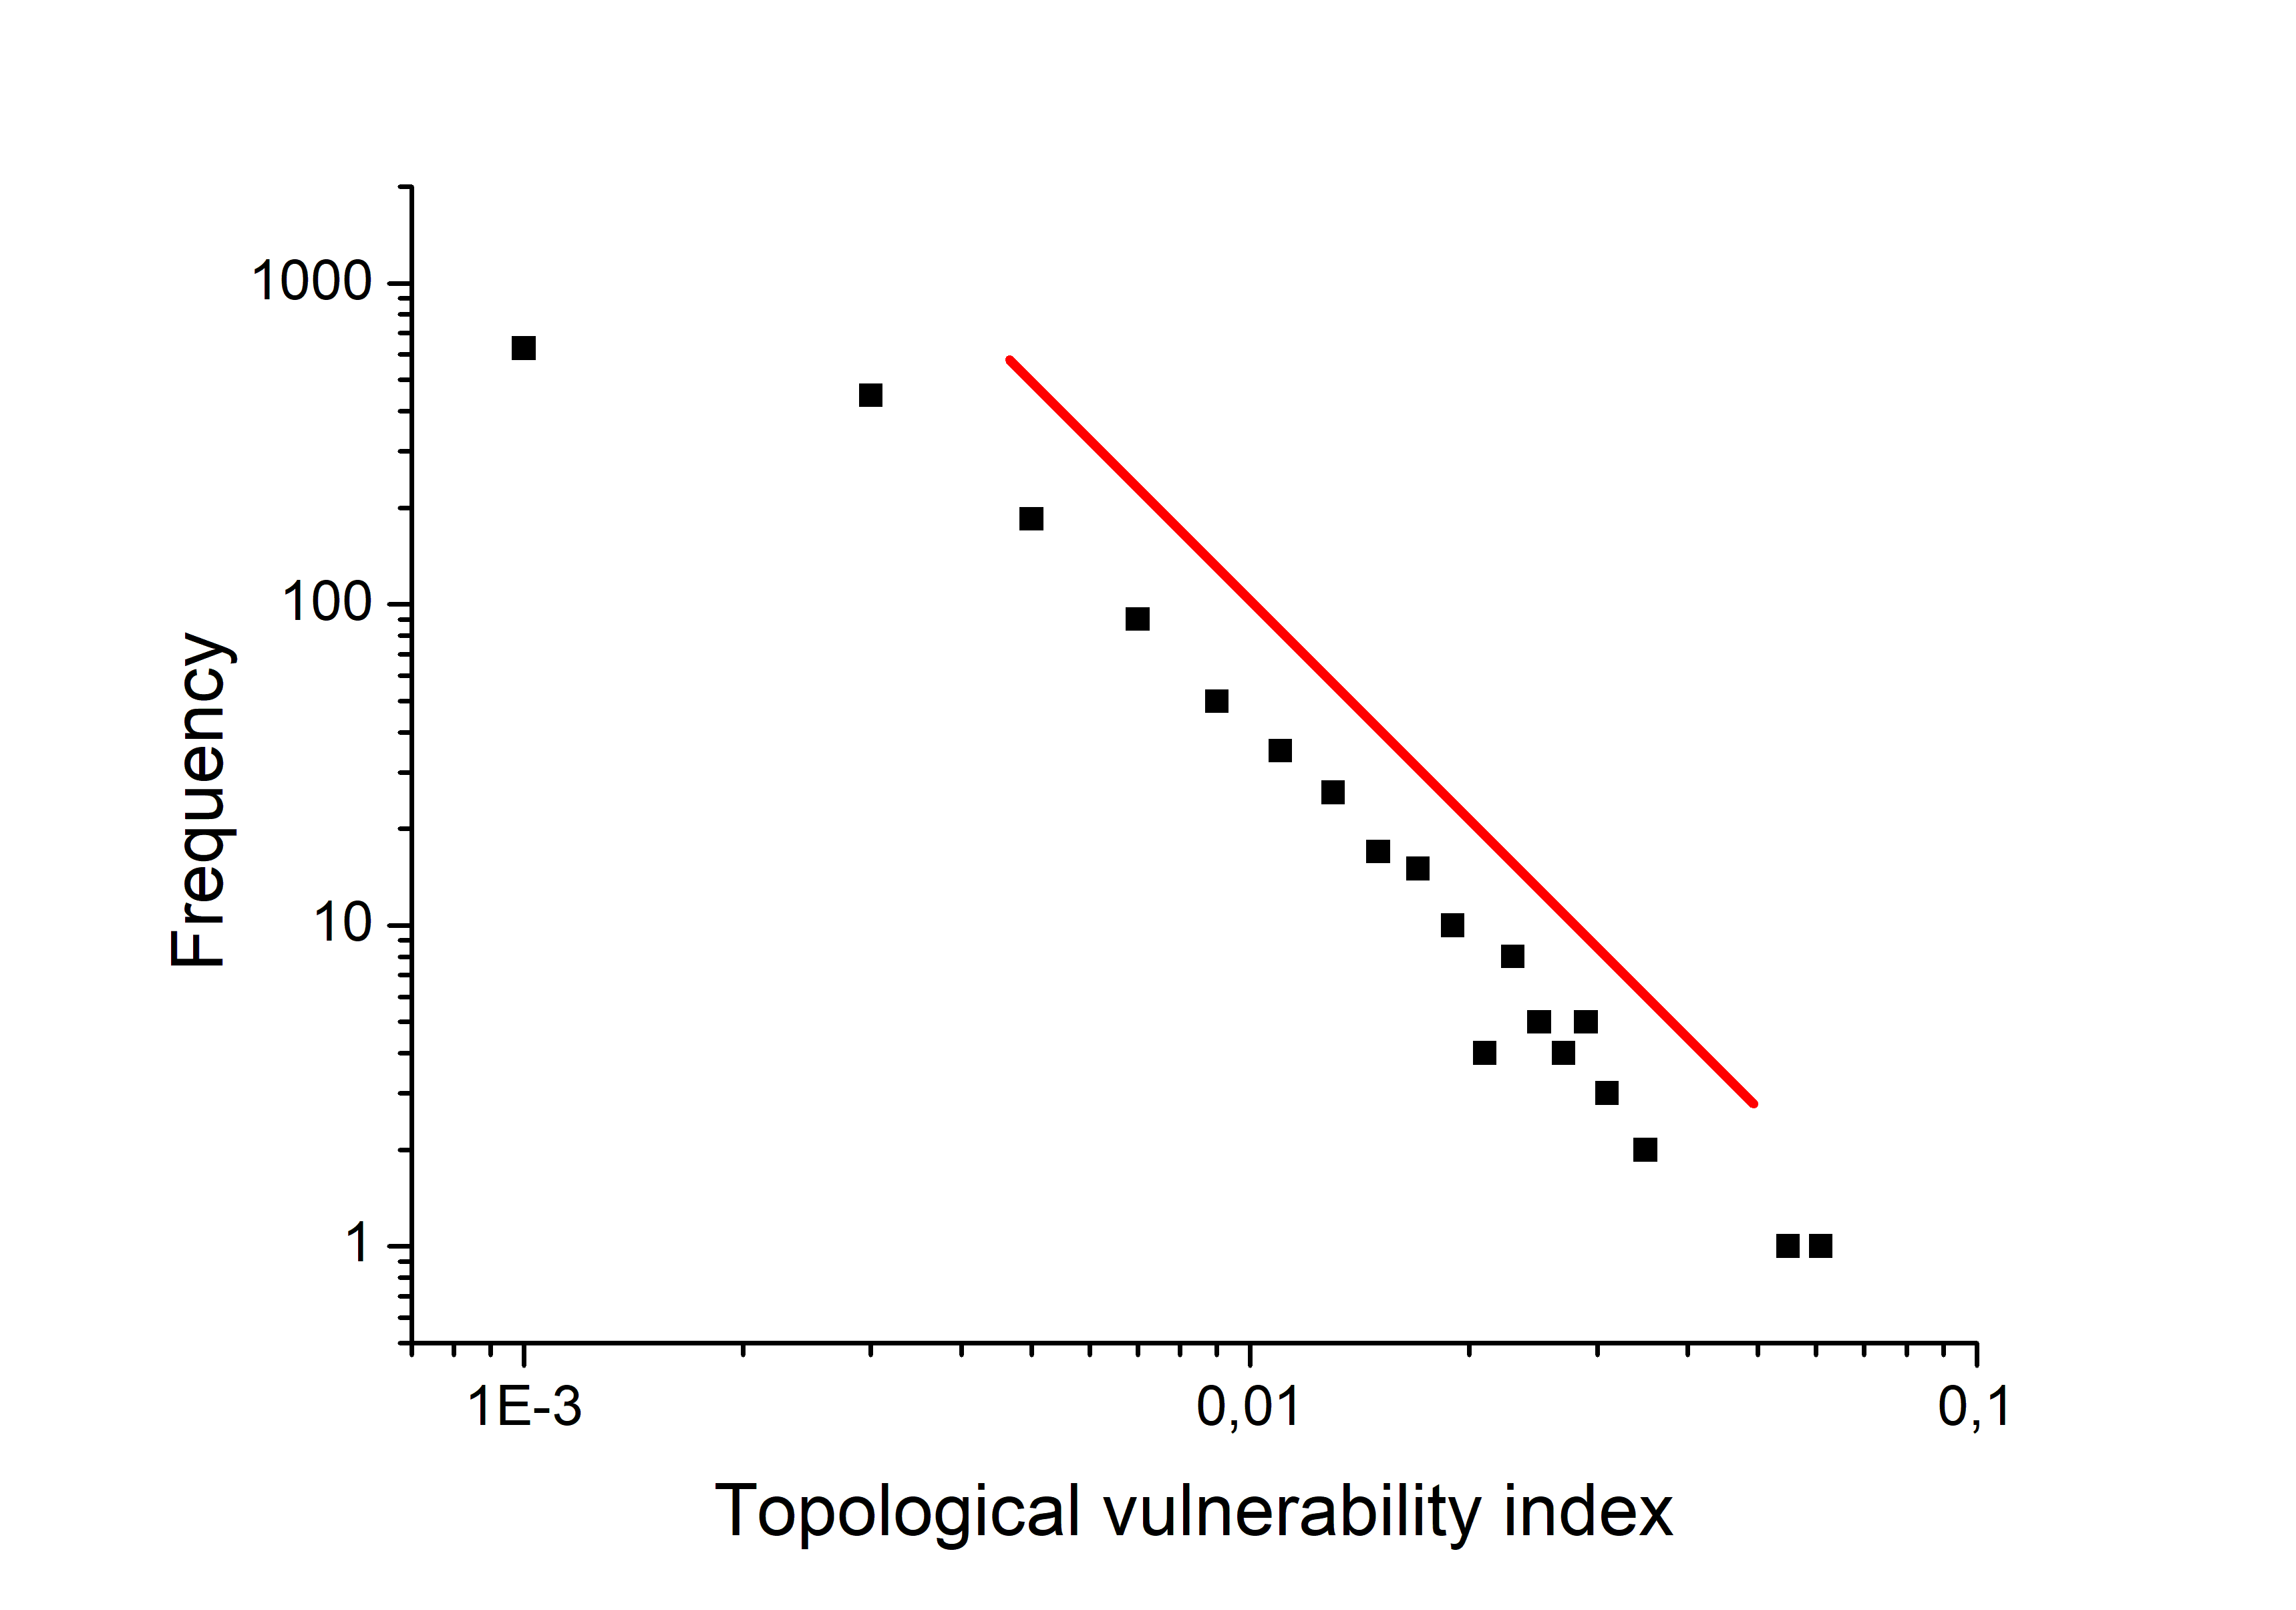
The distribution of topological vulnerability index is highly inhomogeneous - see Figure 2. In Figure 2, on double logarithmic scale, we show this distribution and a power law fitting to it with an exponent as obtained by the Clauset’s method (Clauset et al., (2009)). It means that most highways present low to moderate vulnerability, whereas a small subset is highly vulnerable.
Another important question is about where the most vulnerable elements are, in particular, whether they are close to the areas most susceptible to floods. The four most vulnerable segments are all on the SC-108 highway, including parts without pavement (in the rural area) and parts that cross areas susceptible to floods, in the urban area of Anitápolis/SC. In this city, there are several areas susceptible to floods and flash floods.
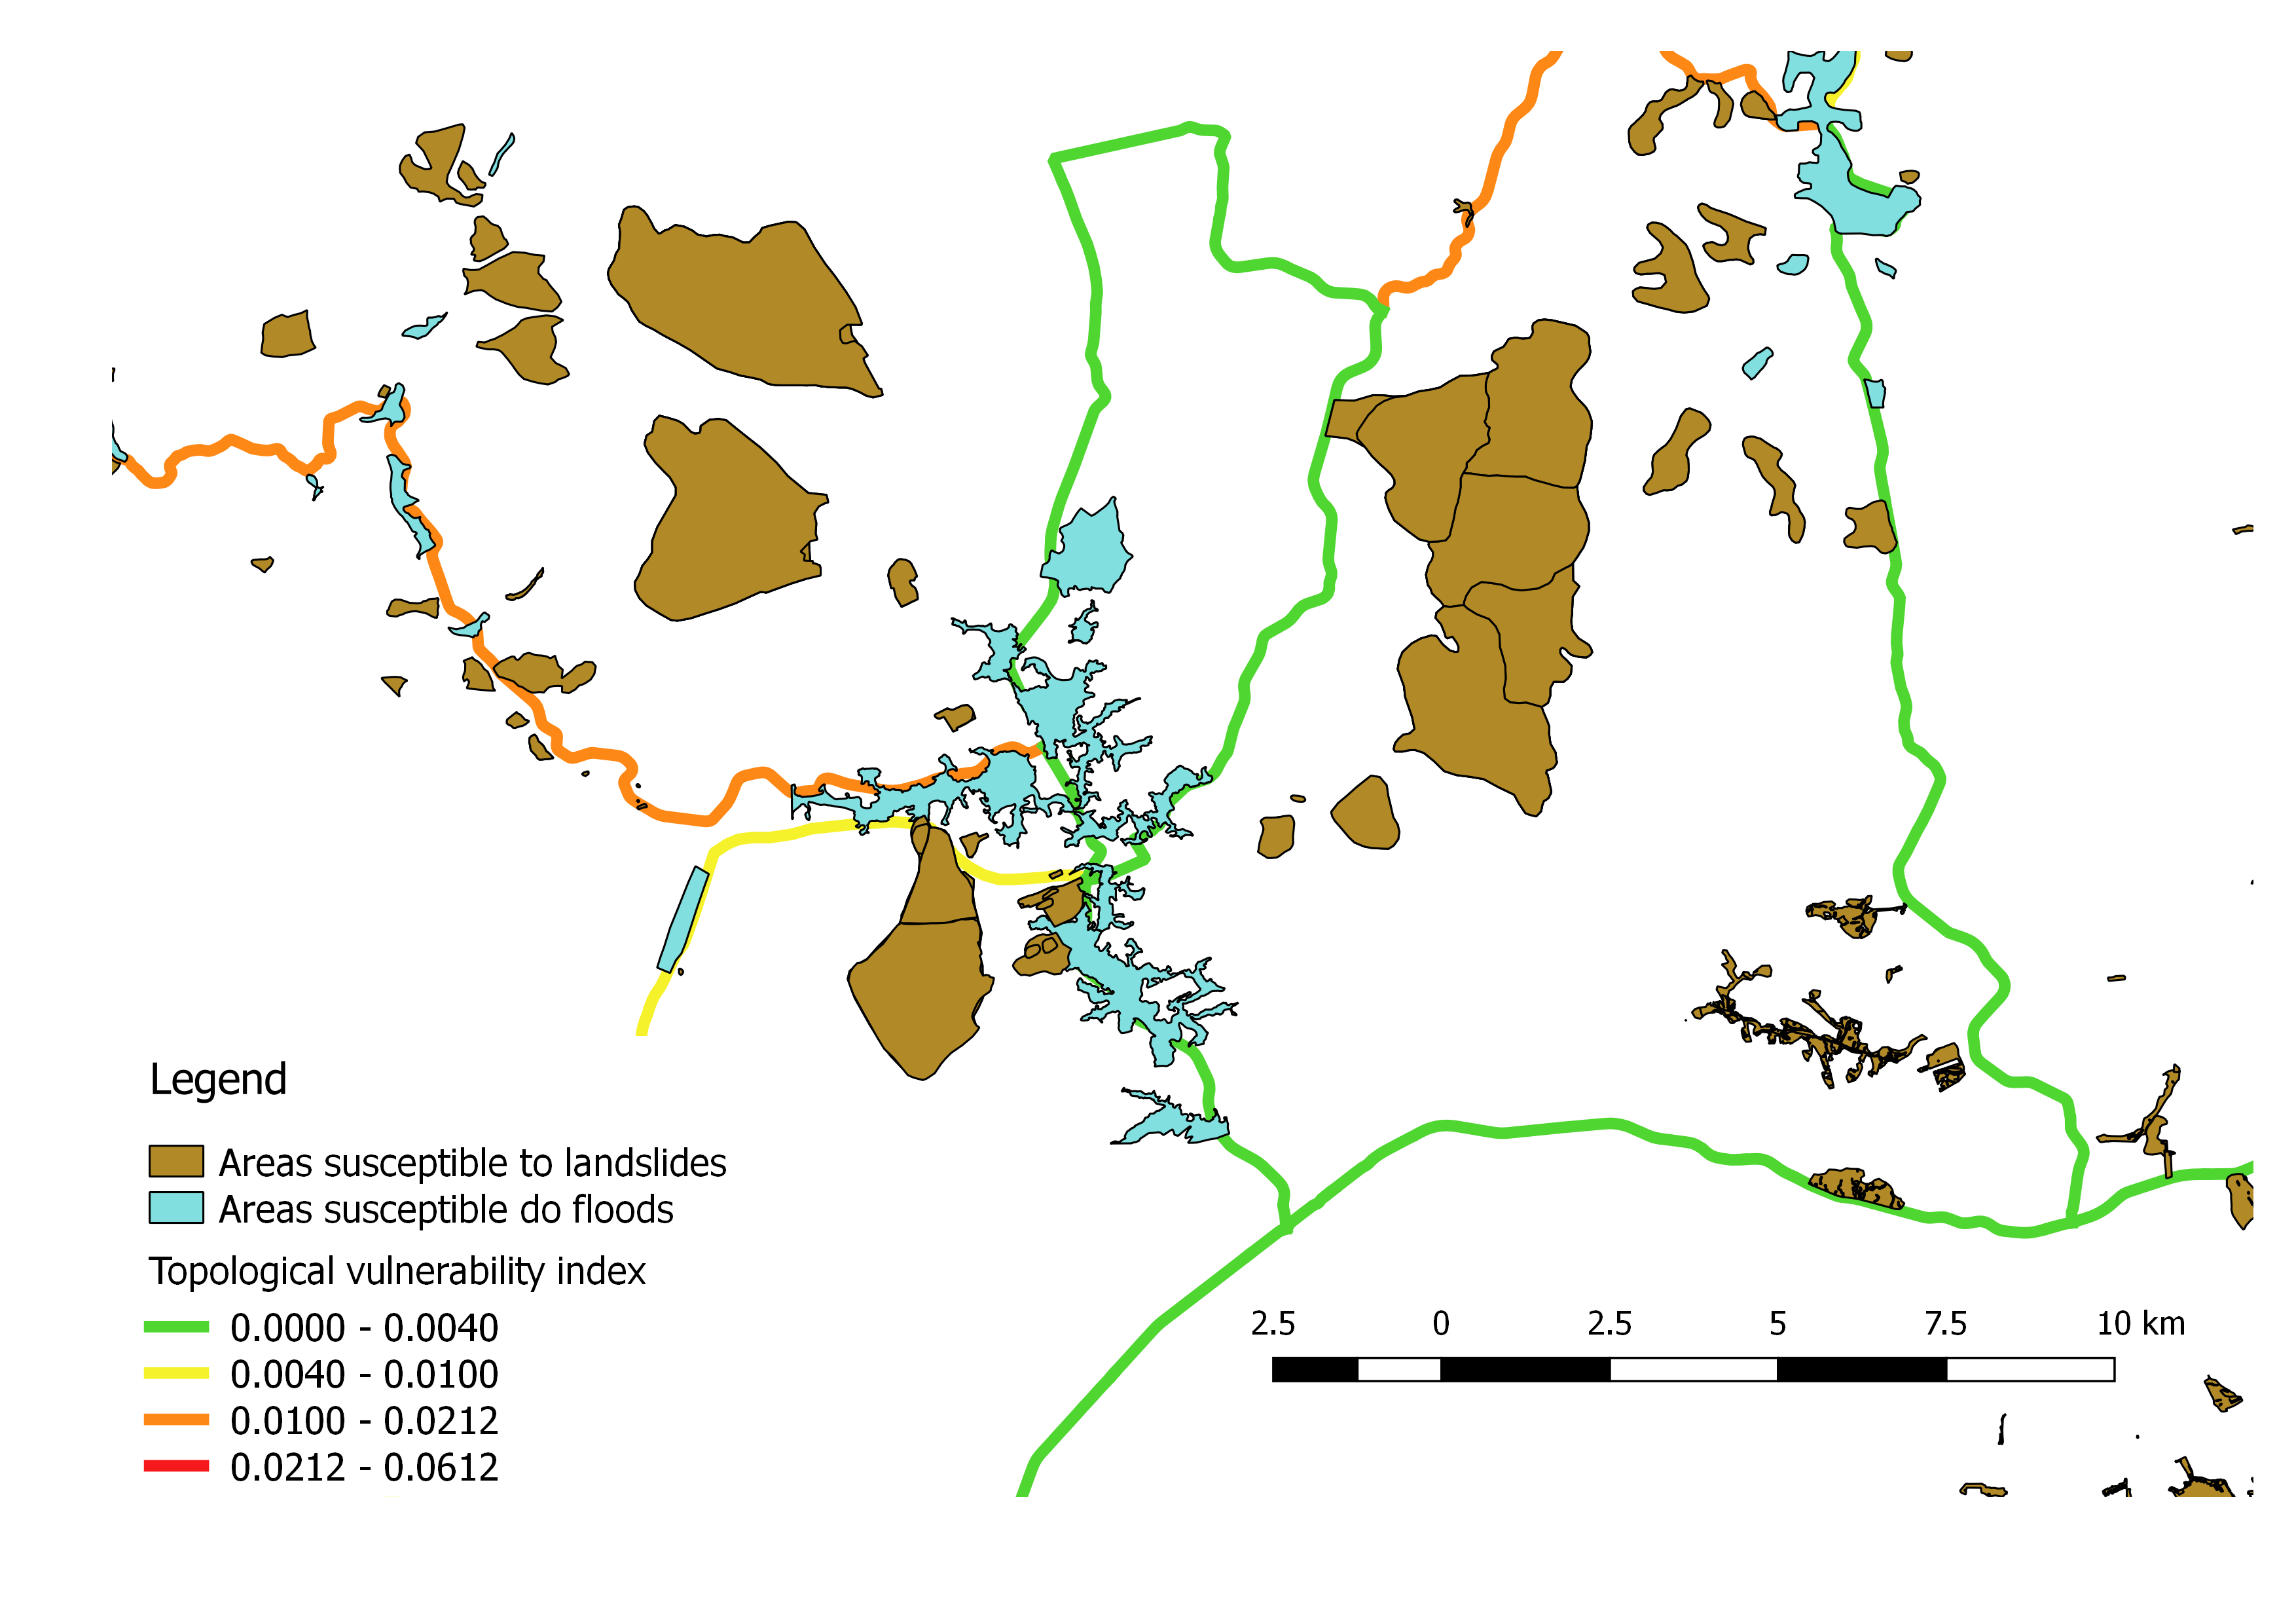
Figure 3 shows the vulnerability index map for a subset of the highways in the study area, and, also, the areas most susceptible to hazards such as floods and landslides. In this subset, it is possible to see that there are some elements with high topological vulnerability index close to urban areas susceptible to flood. In this area, in the cities Rio Negrinho and Mafra, the BR-280 highway crosses the Negrinho River. This area is marked by several records of floods in the rainy season (susceptibility component), which makes traffic in the region unfeasible (impact) (UFSC, 2016).
The highway BR-280 is one of the most important in Santa Catarina state, playing an important role in the transportation of goods to the ports of São Francisco do Sul, Itajaí and Paranaguá. It also promotes the interconnection link between important cities in the region, such as Joinville and Jaraguá do Sul. Thus, there is a large flow of people and goods on this highway.
This representation, considering both vulnerability (as a topological index) and susceptible areas, is an important tool for stakeholders from the transportation sector, considering climate change, disaster risk reduction and sustainable development agenda. The Risk Knowledge, combining hazard and vulnerability, is the first pillar of an Early Warning System (EWS) UNI, (2017). Also, the transportation sector represents direct and indirect economic losses: the first being the destruction of physical assets and the second being a decline in economic value. In this work, the suggested representation ads knowledge about the losses to the disaster risk assessment.
4 Conclusions
In this paper, we represented the set of highways from our study area as a network and calculated the topological vulnerability index. Using the (geo) approach (Lima Santos et al., (2019); Ceron et al., (2019)), it was possible to represent the results in a Geographical Information System.
In our case study, in the south region of Brazil, there are some elements with vulnerability index of approximately 5%, therefore a flood impairing the traffic on this highway’s element can reduce the efficiency of this transportation network by approximately 5%. Also, there are elements high topological vulnerability index close to urban flood areas, for example, in the cities of Mafra and Rio Negrinho, where the BR-280 highway crosses the Negrinho River. This area is marked by several records of floods in the rainy season (susceptibility component), which makes traffic unfeasible in the region (impact). In the study area, the State of Santa Catarina, in Brazil, there is a heavy flow of people and goods, with some important national and international ports and airports.
The topological vulnerability index associated with an element of a network (in our case, a highway segment) is a measure quantifying the way the system reacts to damage on this element. Although it is a measure associated with the element, the topological vulnerability index contains information about the dynamics throughout the whole network (Santos et al., (2019)). The disaster trigger is local but its impacts can be extended to a wider region. The topological vulnerability index captures this relation and it is possibly the most important feature of this index.
Accordingly to the Sendai Framework for Disaster Risk Reduction 2015-2030, one of the most important documents in the Disaster Risk Reduction (DRR) guidelines, there is one global target related to “Substantially reduce disaster damage to critical infrastructure and disruption of basic services” (Aitsi-Selmi et al., (2015)). Many critical infrastructures (such as roads) are of network type, and can be modeled using the Network Science approach (Newman, (2010)). The topological vulnerability index is a network measure particularly interesting in the context of critical infrastructures. The development of a vulnerability map to disasters and their impacts on infrastructures is aligned with the 2030 Agenda for Sustainable Development as well, particularly with the Sustainable Development Goals number 9, 11 and 13, related to Infrastructures, Intelligent Cities and Climate (SDG, (2019)).
To make better urban planning and to lessen the risk of disasters, mapping risk areas is an indispensable step. This mapping can be used to create a risk reduction plan, to define priority areas for attention in the municipalities, to make recommendations for works on infrastructure and to prepare municipal master plans. The mapping of risk areas for Santa Catarina follows the guidelines established from GIDES Project (GID, (2017)), which is a partnership between Brazil and Japan to strengthen the National Strategy for integrated Management of Risks and Disasters. The project’s goal is to reduce risks of disasters through non-structural preventive actions. The mains results are the improvement of assessment systems and risk mapping, warnings and urban planing for disaster prevention.
A possible extension for this investigation is to draft risk scenarios considering other components, such as the dynamic exposure (daily traffic on each highway) and other kinds of vulnerability, for example, one based on traffic engineering parameters, or on the coverage of meteorological sensors (Carvalho et al., (2018)).
Author Contributions
LBLS - Conceptualization, Methodology, Project Administration, Writing GGS - Methodology, Writing TG - Methodology, Writing AASJ - Methodology, Writing LRL - Conceptualization, Methodology, Writing RTR - Methodology, Writing RBB - Methodology, Writing CESO - Methodology, Writing VLSF - Methodology, Writing IMS - Conceptualization, Review Editing
Acknowledgments
Funding: São Paulo Research Foundation (FAPESP), Grant Number 2015/50122-0 and DFG-IRTG Grant Number 1740/2; FAPESP Grant Number 2018/06205-7; CNPq Grant Number 420338/2018-7
Data Availability Statement
The datasets generated and analyzed for this study can be found in https://github.com/gioguarnieri/highways-vulnerability
References
- CPR, (2017) (2017). Cprm - geological survey of brazil. [Online; accessed September 18, 2019].
- GID, (2017) (2017). Gides - gides project. [Online; accessed June 22, 2019].
- IBG, (2017) (2017). Ibge – instituto brasileiro de geografia e estatística. [Online; accessed October 11, 2019].
- UNI, (2017) (2017). Unisdr - global assessment report on disaster risk reduction atlas: unveiling global disaster risk.
- SDG, (2019) (2019). Sdg - sustainable development goals. [Online; accessed September 23, 2019].
- Abdulla et al., (2020) Abdulla, B., Kiaghadi, A., Rifai, H. S., and Birgisson, B. (2020). Characterization of vulnerability of road networks to fluvial flooding using sis network diffusion model. Journal of Infrastructure Preservation and Resilience, 1.
- Aitsi-Selmi et al., (2015) Aitsi-Selmi, A., Egawa, S., Sasaki, H., Wannous, C., and Murray, V. (2015). The sendai framework for disaster risk reduction: Renewing the global commitment to people’s resilience, health, and well-being. International journal of disaster risk science, 6(2):164–176.
- Alabbad et al., (2021) Alabbad, Y., Mount, J., Campbell, A. M., and Demir, I. (2021). Assessment of transportation system disruption and accessibility to critical amenities during flooding: Iowa case study. Science of the Total Environment, 793.
- Andersson-Sköld and Nyberg, (2016) Andersson-Sköld, Y. and Nyberg, L. (2016). Effective and sustainable flood and landslide risk reduction measures: An investigation of two assessment frameworks. International Journal of Disaster Risk Science, 7:374–392.
- Balijepalli and Oppong, (2014) Balijepalli, C. and Oppong, O. (2014). Measuring vulnerability of road network considering the extent of serviceability of critical road links in urban areas. Journal of Transport Geography, 39:145–155.
- Barthélemy, (2011) Barthélemy, M. (2011). Spatial networks. Physics reports, 499(1-3):1–101.
- Berdica, (2002) Berdica, K. (2002). An introduction to road vulnerability: what has been done, is done and should be done. Transport policy, 9(2):117–127.
- Carvalho et al., (2018) Carvalho, T., Jorge, A. A. S., Bernardes, T., Londe, L. R., Soriano, E., and Santos, L. B. (2018). A computational geographical index on road networks for disaster risk reduction. IEEE LATIN AMERICA TRANSACTIONS, 16(5):1454–1459.
- Ceron et al., (2019) Ceron, W., Santos, L. B., Neto, G. D., Quiles, M. G., and Candido, O. A. (2019). Community detection in very high-resolution meteorological networks. IEEE Geoscience and Remote Sensing Letters, 17(11):2007–2010.
- Clauset et al., (2009) Clauset, A., Shalizi, C. R., and Newman, M. E. (2009). Power-law distributions in empirical data. SIAM review, 51(4):661–703.
- Costa et al., (2007) Costa, L. d. F., Rodrigues, F. A., Travieso, G., and Villas Boas, P. R. (2007). Characterization of complex networks: A survey of measurements. Advances in physics, 56(1):167–242.
- Daqing et al., (2011) Daqing, L., Kosmidis, K., Bunde, A., and Havlin, S. (2011). Dimension of spatially embedded networks. Nature Physics, 7(6):481–484.
- Fan et al., (2020) Fan, C., Jiang, X., and Mostafavi, A. (2020). A network percolation-based contagion model of flood propagation and recession in urban road networks. Scientific Reports, 10.
- Furno et al., (2021) Furno, A., Faouzi, N. E. E., Sharma, R., and Zimeo, E. (2021). Graph-based ahead monitoring of vulnerabilities in large dynamic transportation networks. PLoS ONE, 16.
- Gol’dshtein et al., (2004) Gol’dshtein, V., Koganov, G., and Surdutovich, G. I. (2004). Vulnerability and hierarchy of complex networks. arXiv preprint cond-mat/0409298.
- Hearn and Pongpanya, (2020) Hearn, G. J. and Pongpanya, P. (2020). Developing a landslide vulnerability assessment for the national road network in laos. Quarterly Journal of Engineering Geology and Hydrogeology, 54.
- Helderop and Grubesic, (2019) Helderop, E. and Grubesic, T. H. (2019). Streets, storm surge, and the frailty of urban transport systems: A grid-based approach for identifying informal street network connections to facilitate mobility. Transportation Research Part D: Transport and Environment, 77:337–351.
- Herrmann, (2014) Herrmann, M. L. P. (2014). Atlas de desastres naturais do estado de santa catarina: período de 1980 a 2010. IHGSC/Cadernos Geográficos, 2.
- Jamshed et al., (2020) Jamshed, A., Birkmann, J., Feldmeyer, D., and Rana, I. A. (2020). A conceptual framework to understand the dynamics of rural-urban linkages for rural flood vulnerability. Sustainability (Switzerland), 12.
- Koks et al., (2019) Koks, E. E., Rozenberg, J., Zorn, C., Tariverdi, M., Vousdoukas, M., Fraser, S. A., Hall, J. W., and Hallegatte, S. (2019). A global multi-hazard risk analysis of road and railway infrastructure assets. Nature Communications, 10.
- Latora and Marchiori, (2001) Latora, V. and Marchiori, M. (2001). Efficient behavior of small-world networks. Physical review letters, 87(19):198701.
- Latora and Marchiori, (2004) Latora, V. and Marchiori, M. (2004). Vulnerability and protection of infrastructure networks. Physical Review E, 71(1):015103.
- Lima Santos et al., (2019) Lima Santos, L. B., Carvalho, L. M., Ceron, W., Coelho, F. C., Macau, E. E., Quiles, M. G., and V Monteiro, A. M. (2019). How do urban mobility (geo) graph’s topological properties fill a map? Applied Network Science, 4(1):1–14.
- Londe et al., (2014) Londe, L. d. R., Coutinho, M. P., Gregório, D., Torres, L., Santos, L. B. L., and Soriano, É. (2014). Water-related disasters in brazil: perspectives and recommendations. Ambiente & Sociedade, 17:133–152.
- Londe et al., (2015) Londe, L. d. R., Marchezini, V., Conceição, R. S. d., Bortoletto, K. C., Silva, A. E. P., Santos, E. V. d., and Reani, R. T. (2015). Impactos de desastres socioambientais em saúde pública: estudos dos casos dos estados de santa catarina em 2008 e pernambuco em 2010. Revista Brasileira de Estudos de População, 32:537–562.
- Lu et al., (2016) Lu, G., Xiong, Y., Ding, C., and Wang, Y. (2016). An optimal schedule for urban road network repair based on the greedy algorithm. PLoS ONE, 11.
- Lu and Lin, (2019) Lu, Q. C. and Lin, S. (2019). Vulnerability analysis of urban rail transit network within multi-modal public transport networks. Sustainability (Switzerland), 11.
- Marulanda et al., (2022) Marulanda, M., de la Llera, J., and Cardona, O. (2022). A macroeconomic disaster risk analysis: The case study of chile. International Journal of Disaster Risk Reduction, 74:102875.
- Mattsson and Jenelius, (2015) Mattsson, L. G. and Jenelius, E. (2015). Vulnerability and resilience of transport systems - a discussion of recent research. Transportation Research Part A: Policy and Practice, 81:16–34.
- Mera and Balijepalli, (2020) Mera, A. P. and Balijepalli, C. (2020). Towards improving resilience of cities: an optimisation approach to minimising vulnerability to disruption due to natural disasters under budgetary constraints. Transportation, 47:1809–1842.
- Morelli and Cunha, (2021) Morelli, A. B. and Cunha, A. L. (2021). Measuring urban road network vulnerability to extreme events: An application for urban floods. Transportation Research Part D: Transport and Environment, 93.
- Newman, (2010) Newman, M. E. J. (2010). Networks: An Introduction. Oxford University Press.
- Parizzi, (2022) Parizzi, M. G. (2022). Panorama dos desastres climatológicos, hidrológicos, meteorológicos e geológicos durante o período de 2010–2019. Derbyana, 43.
- Postance et al., (2017) Postance, B., Hillier, J., Dijkstra, T., and Dixon, N. (2017). Extending natural hazard impacts: An assessment of landslide disruptions on a national road transportation network. Environmental Research Letters, 12.
- Pregnolato et al., (2016) Pregnolato, M., Ford, A., Robson, C., Glenis, V., Barr, S., and Dawson, R. (2016). Assessing urban strategies for reducing the impacts of extreme weather on infrastructure networks. Royal Society open science, 3(5):160023.
- Pregnolato et al., (2017) Pregnolato, M., Ford, A., Wilkinson, S. M., and Dawson, R. J. (2017). The impact of flooding on road transport: A depth-disruption function. Transportation research part D: transport and environment, 55:67–81.
- Pérez-Morales et al., (2019) Pérez-Morales, A., Gomariz-Castillo, F., and Pardo-Zaragoza, P. (2019). Vulnerability of transport networks to multi-scenario flooding and optimum location of emergency management centers. Water (Switzerland), 11.
- Randil et al., (2022) Randil, C., Siriwardana, C., and Rathnayaka, B. S. (2022). A statistical method for pre-estimating impacts from a disaster: A case study of floods in kaduwela, sri lanka. International Journal of Disaster Risk Reduction, 76:103010.
- Santos et al., (2017) Santos, L. B., Carvalho, T., Anderson, L. O., Rudorff, C. M., Marchezini, V., Londe, L. R., and Saito, S. M. (2017). An rs-gis-based comprehensive impact assessment of floods—a case study in madeira river, western brazilian amazon. IEEE Geoscience and Remote Sensing Letters, 14(9):1614–1617.
- Santos et al., (2019) Santos, L. B. L., Londe, L. R., Carvalho, T. J. d., Menasché, D. S., and Vega-Oliveros, D. A. (2019). About interfaces between machine learning, complex networks, survivability analysis, and disaster risk reduction. In Towards mathematics, computers and environment: a disasters perspective, pages 185–215. Springer.
- Schlögl et al., (2019) Schlögl, M., Richter, G., Avian, M., Thaler, T., Heiss, G., Lenz, G., and Fuchs, S. (2019). On the nexus between landslide susceptibility and transport infrastructure–an agent-based approach. Natural hazards and earth system sciences, 19(1):201–219.
- Schlögl et al., (2019) Schlögl, M., Richter, G., Avian, M., Thaler, T., Heiss, G., Lenz, G., and Fuchs, S. (2019). On the nexus between landslide susceptibility and transport infrastructure - an agent-based approach. Natural Hazards and Earth System Sciences, 19:201–219.
- Shahdani et al., (2022) Shahdani, F. J., Santamaria-Ariza, M., Sousa, H. S., Coelho, M., and Matos, J. C. (2022). Assessing flood indirect impacts on road transport networks applying mesoscopic traffic modelling: The case study of santarém, portugal. Applied Sciences (Switzerland), 12.
- Taylor et al., (2006) Taylor, M. A., Sekhar, S. V., and D’Este, G. M. (2006). Application of accessibility based methods for vulnerability analysis of strategic road networks. Networks and Spatial Economics, 6(3):267–291.
- Wang et al., (2020) Wang, W., Yang, S., Gao, J., Hu, F., Zhao, W., and Stanley, H. E. (2020). An integrated approach for assessing the impact of large-scale future floods on a highway transport system. Risk Analysis, 40:1780–1794.
- Wisner, (1994) Wisner, B. (1994). At risk. At risk: natural hazards, people’s vulnerability and disasters., 23.
- Wiśniewski et al., (2020) Wiśniewski, S., Borowska-Stefańska, M., Kowalski, M., and Sapińska, P. (2020). Vulnerability of the accessibility to grocery shopping in the event of flooding. Transportation Research Part D: Transport and Environment, 87.
- Yin et al., (2020) Yin, C., Li, H., Che, F., Li, Y., Hu, Z., and Liu, D. (2020). Susceptibility mapping and zoning of highway landslide disasters in china. PLoS ONE, 15.
- Zákhia et al., (2022) Zákhia, E. M. S., Alvarenga, L. A., Tomasella, J., Martins, M. A., Santos, A. C. N., and Melo, P. A. (2022). Impactos das mudanças climáticas em uma bacia hidrográfica no sul do estado de minas gerais. Revista Brasileira de Meteorologia, 36:667–681.
- Zhang et al., (2020) Zhang, Q., Yu, H., Li, Z., Zhang, G., and Ma, D. T. (2020). Assessing potential likelihood and impacts of landslides on transportation network vulnerability. Transportation Research Part D: Transport and Environment, 82.