Fourier domain excision of periodic radio frequency interference
The discovery and study of pulsars and Fast Radio Bursts (FRBs) in time-domain radio data is often hampered by radio frequency interference (RFI). Some of this terrestrial RFI is impulsive and bright, and relatively easy to identify and remove. Other anthropogenic signals, however, are weaker yet periodic, and their persistence can drown out astrophysical signals. Here we show that Fourier-domain excision of periodic RFI is an effective and powerful step in detecting weak cosmic signals. We find that applying the method significantly increases the signal-to-noise ratio of transient as well as periodic pulsar signals. In live studies, we detected single pulses from pulsars and FRBs that would otherwise have remained buried in background noise. We show the method has no negative effects on pulsar pulse shape and that it enhances timing campaigns. We demonstrate the method on real-life data from number of large radio telescopes, and conclude that Fourier-domain RFI excision increases the effective sensitivity to astrophysical sources by a significant fraction which can be even larger than an order of magnitude in case of strong RFI. An accelerated implementation of the method runs on standard time-domain radio data formats and is publicly available.
Key Words.:
Methods: data analysis – Methods: observational – – Techniques: miscellaneous – pulsars: general – stars: magnetars – stars: neutron1 Introduction
As both the aperture area and the bandwidth of radio telescopes increase, the sensitivity with which the radio sky can be probed continues to increase. However, the potentially achievable sensitivity is often severely limited by the ever increasing radio frequency interference (RFI). Preventive methods, such as using remote, RFI-free locations for constructing the new telescopes, identifying and isolating the sources of RFI (Anterrieu et al., 2016), and avoiding the known RFI-prone parts of the spectrum (e.g., Maan et al., 2013), remain crucial for obtaining useful data from radio telescopes. However, even after exploiting these and other preventive methods, data obtained from radio telescopes are often significantly contaminated by RFI. Much of the radio spectrum used by new broad-band receivers is outside the protected spectrum. The ever more quickly growing number of radio-emitting satellites affect telescopes even in radio-quiet and remote zones. The efficient mitigation of such RFI remains a challenging process.
The RFI mitigation methods are broadly divided in two categories: pre-detection and post-detection strategies. The pre-detection techniques often use reference signals or relatively simple statistical criteria to identify and mitigate RFI signals in real-time (e.g., Baan et al., 2004; Buch et al., 2016). These techniques are often more suitable for highly impulsive or narrow-band RFI. The hard requirement of real-time baseband processing might also pose implementation challenges, especially for wide-band systems and existing backends. The post-detection techniques mostly involve off-line processing, though some rare but useful examples of real-time excision also exist (e.g. Sclocco et al., 2019). These strategies often use thorough statistical techniques or exploit the expected signatures, either of the signal-of-interest or that of the RFI signal, to identify and mitigate RFI. There is no one unique technique that can be used to mitigate all kinds of RFI, given the ever growing number of RFI sources and the huge diversity in the effects in which they manifest themselves in the radio astronomical data. On one side, mitigation techniques include identifying outliers using the first and second order moments or other simple Gaussian statistics (e.g. Baddi, 2011); or using higher order statistics (Dwyer, 1983) such as the spectral kurtosis (Nita et al., 2007; Nita & Gary, 2010). On the other side, methods focus on specific types of astronomical (e.g. Eatough et al., 2009; Hogden et al., 2012) or RFI signals where otherwise a robust statistics approach might fail (e.g. Deshpande, 2005; Lazarus et al., 2020).
Many robust statistical approaches have been developed to excise primarily the RFI instances with spiky or burst-like characteristics. These techniques are not readily applicable when the data are heavily affected by periodic RFI. One well known source of periodic interference is the overhead 50/60 Hz power-lines which could produce radio noise by partial discharge at insulators and the sharp points of conductors. Moreover, most of the household and commercial electrical appliances also operate on the 50/60 Hz AC, and if not properly designed or shielded, these might generate interference with 50/60 Hz periodicity. Several other sources, such as military, aviation, airport and even ionosphere-research radars could also cause periodic interference, though the periods of such interference are hard to know in advance. Electric fences also cause interference with nearly 1 second periodicity, but the actual period could differ depending on the design. Windmills also cause periodic interference, though the periods could be as short as a few microseconds. The periods of interference from these, and many unknown sources could also vary significantly with time.

Contamination by periodic interference changes the apparent nature of the underlying statistical distribution, making it harder to identify RFI using conventional techniques. Moreover, in case of such contaminations, the excision techniques which identify the strong periodic interference, such as rfifind from the pulsar search and analysis software PRESTO (Ransom et al., 2002), could potentially result in masking a large fraction of data. In case of periodic RFI, it is possible to largely remove the contribution of the periodic interference from data, and hence avoid masking a large fraction as RFI-contaminated. In this work, we describe a technique and present software tools to excise periodic interference in the Fourier domain, restore the underlying statistics, and then use the conventional methods for further RFI mitigation. We demonstrate the efficacy of this approach using real-life observations of primarily two types of astronomical sources, radio pulsars and Fast Radio Bursts (FRBs). Pulsars are fast rotating neutron stars (Hewish et al., 1968), and the radio emission from them is observed in the form of a highly periodic sequence of regular pulses. FRBs are milliseconds-wide highly luminous radio transient events, most-likely of extra-galactic origin (Lorimer et al., 2007; Thornton et al., 2013). While the presented technique and software are readily applicable to pulsar and FRB data, the underlying approach can be applied to time-domain radio data on any other astronomical source.
In what follows, we elaborate on the impact of periodic RFI and its mitigation using the one-dimensional Fourier transform in Section 2. In Section 3, we present details of a software tool RFIClean that we have developed to excise periodic and other RFI from time-domain data in the widely used filterbank format. We then briefly discuss mitigating wide-band, fainter periodic interference using the two-dimensional Fourier transform and other future work in section 4, followed by conclusions in the last section.
2 Periodic RFI: Impact and mitigation
For a time-sequence of radio intensity or power data, , the impulsive RFI-contaminated samples generally lie significantly outside the expected distribution of the non-contaminated samples. With averaging taking place at several stages in the data-recording systems, the distribution of the final time-sequence is often very close to a Gaussian function. However, the presence of strong periodic RFI can significantly change the underlying Gaussian statistics.
Most RFI excision techniques heavily use the first two moments of the underlying distribution, the mean () and standard deviation (), to identify outliers. For a given threshold, , the samples outside are treated as outliers. When the distribution is affected by periodic RFI, measurements of and from the data themselves are likely to deviate significantly from their true values. Particularly, is likely to be overestimated, which could make the threshold based identification of outliers naturally less efficient. For the example shown in Figure 1, the bounds marked in the right panel for the original data demonstrate how ineffective those would be in identifying any outliers. Using more robust methods, e.g., the iterative methods, computing statistics using only RFI-free parts of the data, or using a reference signal, and could be better estimated in some cases. However, these better estimates would then imply identification of significant fractions of data as outliers due to periodic RFI. For the example shown in Figure 1, more than 10% of the data would be rejected as outliers above . Moreover, the remaining fractions of data which are still contaminated by periodic RFI but not identified as outliers, would leave their imprints in any further analysis of such data.
The Fourier transform decomposes the input function into a sum of complex exponentials (i.e., complex sinusoids) of specific frequencies. The amplitudes of the exponentials or the sinusoids would represent the amount of power in the input function at the corresponding frequency. For a discretely, uniformly sampled function of Nt samples, such as the time-sequence shown in Figure 1, the Discrete Fourier Transform (DFT) may be written as
| (1) |
where is the sampling interval and is the Fourier frequency. For real-valued function, . The inverse DFT, which would transform back to , is of similar form but with a normalization constant, 1/, and positive sign of the exponent. For a signal or RFI that modulates sinusoidally with a period , the entire modulation power will be concentrated at in the DFT. If the modulation envelope differs from sinusoid, the modulation power gets distributed between the fundamental and its harmonics. When the modulation period varies with time, the modulation powers gets distributed in more than one Fourier frequency bins around the fundamental and its harmonics in the DFT. A similar effect is seen when the input function length is a non-integer multiple of the modulation period (e.g., see Ransom et al., 2002) In any case, power of a periodically modulated signal is concentrated within a very limited number of bins in the DFT than in the time sequence111An exception is when the modulating signal approaches the Dirac comb function.. Hence, it is much easier to identify periodic signals in the Fourier domain.
For a time-sequence of Gaussian distributed white-noise, the real and imaginary parts of the Fourier transform also have Gaussian distributions with mean and same standard deviations as of the input sequence. Since all the power of any periodic RFI in time-domain will be contained within much fewer frequency bins in the Fourier domain, it is much easier to identify the corresponding samples in the DFT. If these identified outliers are replaced by the expected mean of in the real and imaginary parts of the DFT, an inverse DFT then would provide time-sequence wherein the periodic RFI is effectively mitigated. An example of this mitigation is shown in Figure 1 where the periodic RFI apparent in the second half of the input sequence is successfully mitigated from the output sequence. Note that the Fourier-domain mitigation of periodic RFI does not lead to any loss of data samples in the time-domain. Even in the Fourier domain, for the above example, only 0.6% of the Fourier frequency space was blanked. A more readily evident effect is that the underlying distribution is restored (see the right panel), making the time sequence much more suitable for conventional RFI excision. For the same thresholds, only 0.8% of samples in the Fourier domain-cleaned time sequence are found to be outliers, as opposed to more than 10% in the input sequence. More importantly, restoration of the underlying distribution helps to identify actual impulsive RFI samples which could have otherwise been hindered by the periodic RFI modulation in the input sequence.
3 Mitigating periodic and other RFI from Time-domain data: RFIClean
The above described method to mitigate periodic RFI has been successfully used earlier in pulsar searches and studies (e.g., Faulkner et al., 2004; Smits et al., 2005; Camilo et al., 2007). However, the usage has generally remained limited to bandwidth-averaged timeseries, and for RFI with already known periodicities. As the strength, and possibly even phase, of the periodic interference could be highly variable across the observing bandwidth, its identification and mitigation might not always be efficient in the bandwidth-averaged timeseries. Moreover, mitigating some periodicities that are frequently caused by known RFI (e.g., 50 Hz) in the band-averaged timeseries might also cause losing astronomical signals with unfavorably close by fundamental or (sub-)harmonics [e.g. the initial non-detection of PSR J2030+3641 by Barr et al. (2013) was potentially due to this fact]. Furthermore, with the ever growing number of RFI sources, it is not always possible to know the RFI periodicity in advance. With these considerations, we present below an approach to mitigate periodic RFI (1) before averaging over the bandwidth, (2) only when the RFI is strong enough to be detectable, and (3) without a priori information on its periodicity.
A widely used format for time-domain data recorded at radio telescopes is the filterbank format, i.e., uniformly time-sampled streams at a number of frequency channels across the observing bandwidth. In this section, we describe a software package, RFIClean 222https://github.com/ymaan4/rficlean, which we have developed to identify and mitigate periodic as well as impulsive RFI from filterbank data. The methods used are general purpose in the sense that no a priori information about the periodicity or source of RFI is needed. In the following subsections, we provide an operational overview of the package followed by details on its computational and scientific performance using real data.
3.1 Operational overview and diagnostics
RFIClean reads in and works on the input data block-by-block, where a block represents time series of a user-specified length for a number of radio frequency channels. Three categories of RFI excision are employed. First in these categories is the Fourier domain excision. For each time series, a DFT is computed using the Fastest Fourier Transform in the West (FFTW; Frigo & Johnson, 2005) software library. The Fourier amplitude spectrum is often “red” (i.e., there is more spectral power at lower frequencies than that at higher frequencies) which prohibits efficient identification of any outliers. To avoid the worsening effects of this redness, the amplitude spectrum is divided in to several sections, whereas the length of each section is increased logarithmically as we go from lower to higher Fourier frequencies. The outliers are identified within each of these sections using robustly computed mean and standard deviation, and a specified threshold. For each of the outliers, the real and imaginary parts of the DFT are replaced by 0s. An inverse DFT computed using FFTW then outputs a cleaned time series. This operation is repeated for time series corresponding to each of the radio frequency channels in the input block.
Next, narrow band RFI is identified and excised from the above DFT-cleaned block. For this, the mean and variance spectra are obtained for the block, by computing robust mean and standard deviation of each of the time series. The channels are identified which show either mean or the variance power more than a specified threshold and termed as outliers. The spectral power distribution in data obtained from radio telescopes is often significantly affected by electronic filters and other parts in the backends. This might make the above threshold based identification of contaminated channels in the mean and variance spectra less effective. To overcome any instrument induced spectral variations, we compute the differences between the mean spectrum values at adjacent channels, and denote the resultant spectrum as the difference-mean spectrum. Hence, using the mean spectrum, Smean, the difference-mean spectrum, Smean, is computed as,
| (2) |
where Nf is the number of radio frequency channels. Note that Smean consists of elements. With a similar approach, we use the variance spectrum to compute the difference-variance spectrum. These difference-spectra, nearly free from the effects of the spectral shapes induced by the instrument, are then used to further identify the outlier channels. The time series in every identified outlier channel is replaced by the mean of the adjacent non-contaminated channel. The spectra for the individual time samples are also examined to find any narrow-band and narrow-time RFI, and the identified outliers are replaced by the specified threshold.
In the last excision step, the time series computed by averaging the above DFT-and-spectral-cleaned block over all the channels is then subjected to threshold based excision. This step identifies any impulse-like RFI, and replaces the corresponding samples for each of the frequency channels by the means of their corresponding time series.
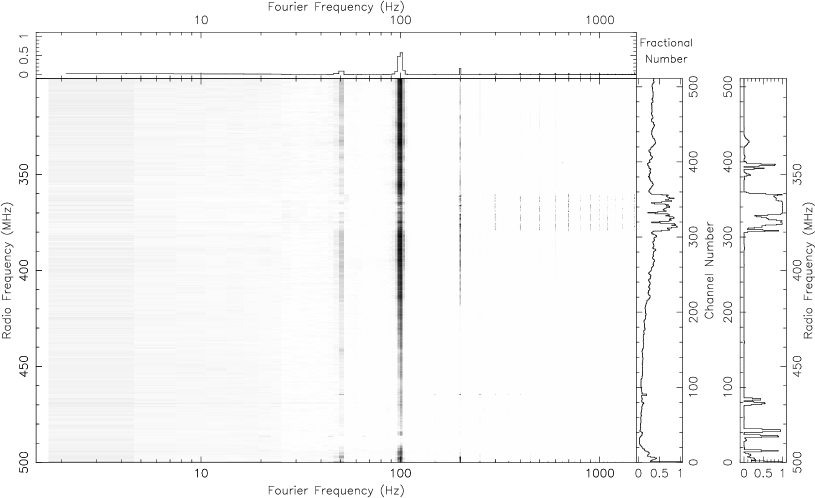
A diagnostic is output at the end, which primarily indicates the fractional number of times a Fourier frequency was zapped for each of the radio frequency channels, and how many times a channel was zapped in the spectral cleaning. An example of a diagnostic plot using time-domain data obtained from the giant metrewave radio telescope (GMRT) is shown in Figure 2. As evident from the main panel, periodic interference at around 50 Hz, and its first two harmonics (100 and 150 Hz) were zapped the most. The top panel suggests that the 100 Hz interference was identified and zapped from the time series for all the radio frequency channels, on average, for about 50% of the times. Corresponding to this interference, the zapped frequencies are spread over 45 Fourier bins, indicating the jitter in period of the interference. More than ten harmonics of 50 Hz are prominently visible particularly in the frequency range 360380 MHz — a part of the spectrum known to be often dominated by interference at GMRT. As apparent from the far right panel in Figure 2, the spectral zapping block identified and excised this fairly broad (about 20 MHz) as well as several narrow band RFI.
3.2 Computational performance
Although RFIClean was primarily developed for excision of RFI in the offline processing of data, the execution time could be of importance for processing large data sets or if real-time excision of periodic RFI is desired. To utilize more than one processing core, RFIClean offers two methods of parallel processing.
In the first method, a given filterbank data set is virtually divided into a number of time-segments, and individual serial instances of RFIClean are used to process these segments simultaneously and write the cleaned data in separate output files. At the end, the output files are concatenated in the correct order to output a single, RFI-excised filterbank file. A bash script is provided along with RFIClean which facilitates the above parallel processing for a specified number of processing cores.
For the second method, we first identified the most compute-intensive functions within RFIClean using the GNU profiler333https://sourceware.org/binutils/docs/gprof/, last visited 11 November 2020.. In the serial form of some of these functions, frequency channels are being processed independently from one another. Hence, it represents a case of a “pleasingly parallel problem”. We modified data structures and parallelized sections of algorithms employing the OpenMP architecture444https://www.openmp.org, last visited 11 November 2020., such that channels can be processed and cleaned in parallel blocks over threads.
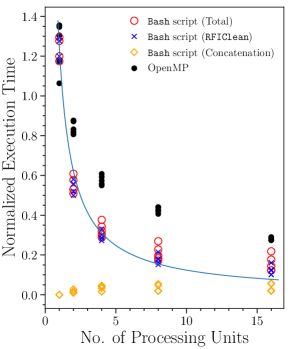
We benchmarked the execution time using five filterbank files parallelized over processing units, where a processing unit corresponds to the number of processes used in the bash-script method, and the number of threads for the OpenMP method, respectively. For this benchmarking, we have used filterbank data with observing durations of about 5, 11, 22, 43 and 87 minutes, each with 2048 frequency channels and 163.8 s sampling time. RFIClean was specified to use 8192 samples long time blocks to identify and excise RFI on a computing machine with 24 CPUs (2 Intel(R) Xeon(R) E5-2620v3 processors), 125 GiB memory and CentOS Linux 7 operating system. We normalized the benchmarked execution times by the observing durations.
Results of the benchmark are shown in Figure 3. For the first method, the execution time scales down close to the expected linear relationship (solid line) with the increasing number of processing cores. While using a large number of cores, the speed-up in this method is primarily limited by disk I/O. The fractional time spent in concatenating the simultaneously processed data into a single output also becomes significant while using large number of cores. For the above mentioned sampling time and number of radio frequency channels, RFIClean can excise periodic and other RFI in real-time using just two processing cores. As the Fourier transform computation time scales as (N log N), the execution time in Figure 3 will also scale accordingly when a different block size is used. Similarly for the second method, RFIClean operates in real time starting as early as . The execution time scales with the number of threads, providing speed-ups (/) up to about 5 when using 16 threads. One can notice that this method is slightly slower than the first method. This is primarily due to the fact that operations related to input read and output write, as well as some of the not so compute-intensive functions, are performed serially in the present version. On the other hand, this method has the advantage of simplicity of execution and setup while providing good acceleration.

3.3 Scientific performance
Here we demonstrate how RFIClean’s usage could improve the fraction of data that is lost in conventional RFI excision, and its efficacy in bringing up faint astronomical signals (particularly in pulsar and FRB searches). We also show that RFIClean can safeguard the periodic signals from bright pulsars while mitigating periodic RFI, does not introduce any artifacts on the pulse profiles obtained from cleaned data, and improves the quality of the precision timing experiments.
For some of the demonstrations below, we have used observations of a very bright pulsar, J04374715, conducted using GMRT on a number of epochs between November 3, 2018 and March 1, 2019. In each observing session, data were recorded with 2048 frequency channels and 0.16384 ms sampling time, and the observing durations varied between 2 and 6 minutes.
3.3.1 RFI excision efficiency
To demonstrate RFIClean’s efficacy in improving the fraction of available data that is not masked by conventional RFI excision methods, we have used rfifind from PRESTO. rfifind examines data for narrow and wide band interference as well as strong periodic interference, produces a mask for the parts of the data that it finds RFI-contaminated and reports the masked percentage of the data. For the above observations on J04374715, the percentage of data that are masked by rfifind before and after using RFIClean are shown in Figure 4. A sharp improvement in the percentage of the data that rfifind finds RFI-free after mitigation using RFIClean is clearly evident for all the observing sessions.
3.3.2 Usefulness in pulsar and FRB searches
In pulsar and FRB/fast-transient searches, the systematic noise due to RFI reduces the S/N of the underlying astronomical signals as well as increases the number of false candidates that a human or machine has to sift through before identifying the genuine ones. The latter also decreases the probability of any faint but genuine candidates to be identified correctly with the required confidence. By efficient excision of periodic as well as narrow/broadband RFI, RFIClean helps in uncovering the underlying faint signals.
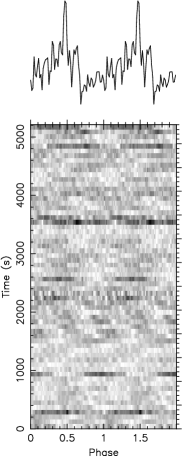
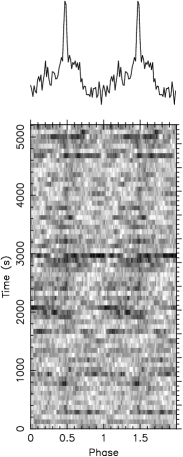
Detection of the recently discovered pulsar J05334524 (Oostrum et al., 2020) at several epochs was in fact possible only after mitigation of periodic RFI using RFIClean. An example of the improvement in the pulsar’s S/N after using RFIClean on a GMRT observation of this pulsar in the 300500 MHz band is shown in Figure 5, where the formal S/N increased from less than 3 to about 25. Detection of the magnetar J18091943 below 500 MHz (Maan et al., 2019) was also immensely aided by RFIClean. In radio searches where information about the pulsar period is already available (e.g., from high-energy counterparts, Maan & Aswathappa, 2014; Maan, 2015), RFIClean can help in realizing high sensitivity by safeguarding the known periodicity (see Section 3.3.3).

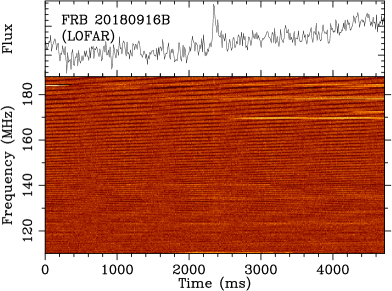
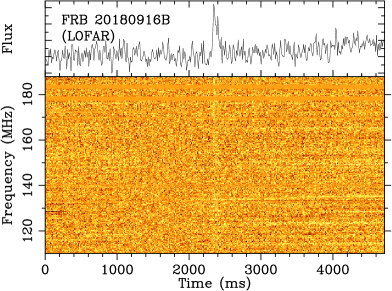
More recently, a number of bursts from the repeating FRB 20180916B have been discovered at 150 MHz using the Low Frequency Array (LOFAR) telescope (Pastor-Marazuela et al., 2020), marking the first convincing detection of any FRB at frequencies below 300 MHz. The first of these detected bursts (L01), which is also the faintest one, was confirmed only after some strong periodic RFI were excised from the LOFAR data. A spectrogram around the burst arrival time obtained from the original data as well as that from data cleaned using RFIClean is shown in Figure 6. In the process of correcting for the large dispersive delay (nearly 79 s!) across the observed bandwidth for FRB 20180916B, the originally undispersed periodic RFI actually got dispersed and it appears in the form of highly slanted stripes in the spectrogram. As evident in Figure 6, RFIClean successfully excised the periodic RFI as well as some narrow-band RFI. In this particular case, due to very uniform amplitude of the periodic RFI across the bandwidth as well as very large dispersive delay that had to be corrected, the RFI’s effect on the formal S/N of the burst was only marginal. However, confirmation of the burst as an astronomical signal as well as study of its flux density and spectrum were possible only after the RFI was mitigated using RFIClean. The mitigation of periodic RFI from these data also reduced the false burst candidates by nearly an order of magnitude.
3.3.3 Usefulness in pulsar timing experiments
Pulsars are excellent celestial clocks. Given the stability of their periods up to one part in , measuring the time-of-arrival (ToA) of their pulses facilitate very high precision astrophysical experiments such as testing the general relativity, constraining the equation of state and detecting sub-Hz gravitational waves.
Measuring the pulse ToA includes comparison with a template profile. Any small change in the pulse-shape, intrinsic or that resulted from the instrumental or processing software artifacts, would result in an offset and/or increased uncertainty in the corresponding ToA measurement. To avoid a possible excision or modification of the periodic signal from strong pulsars, RFIClean can safeguard the Fourier frequencies corresponding to a pulsar’s specified spin period.
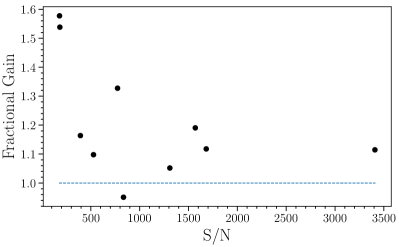
We demonstrate RFIClean’s suitability for high precision pulsar timing experiments using the observations of the strong pulsar J04374715 discussed earlier in this section. As can be seen in the top panel of Figure 7, even without any RFI excision the pulsar’s strong periodic signal is detected with high significance (S/N¿200, after averaging over bandwidth and observing duration) in all the observations. However, using RFIClean further improves the detection significance for most of the observations. The fractional improvement is naturally larger where the original detection significance was smaller. We also note that using rfifind on the data output from RFIClean further improves the S/N by 1020% in many cases (not shown in Figure 7, but assessed separately).
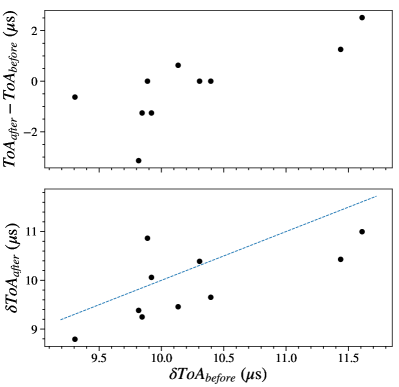
To generate a template, we used psrsmooth from PSRCHIVE (Hotan et al., 2004) on the profile with highest S/N. We then used pat on average profiles obtained from all the observing sessions to compare with the above template and measure the ToAs. The same template was used on the original as well as RFI-excised data. As shown in the middle panel of Figure 7, the ToAs obtained from the original and RFI-excised data are consistent with each other, and any difference is much smaller than the associated uncertainty. This indicates that RFIClean does not inflict any artifacts in the pulsar’s profile shape. The lower panel shows that, even for this strong pulsar, the measurement uncertainties in the ToAs from the RFI-excised data are smaller than their counterparts from the original data for most of the sessions. The improvement in ToA uncertainty is a direct implication of the enhancement in S/N shown in the upper panel. In fact much more significant improvements in ToA uncertainties have been observed for fainter pulsars, making RFIClean not only suitable but useful in improving ToA measurements in pulsar timing experiments.
4 Using twodimensional DFT and other future work
The identification and mitigation of periodic RFI in the previous section is limited by the strength of such RFI within individual channels. If a faint periodic RFI is spread over multiple channels or across the full observed bandwidth, two-dimensional Discrete Fourier Transform (2D DFT) might help in its identification and mitigation. While a detailed exploration in this regard will be a subject of future work, here we present a minimal demonstration of mitigating periodic RFI using 2D DFT.
For a function discretely and uniformly sampled in two dimensions, , such as the filterbank data discussed in the previous section, the 2D DFT may be written as
| (3) |
where and are the sampling intervals, Nt and Nf are the total number of samples, and and are the corresponding Fourier frequencies in the two dimensions. As for the one-dimensional DFT, for a real-valued 2D function, . The inverse DFT, which would transform back to , differs in the signs of the two exponents and a normalization constant, 1/().
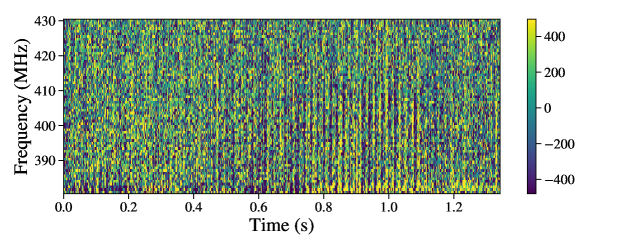
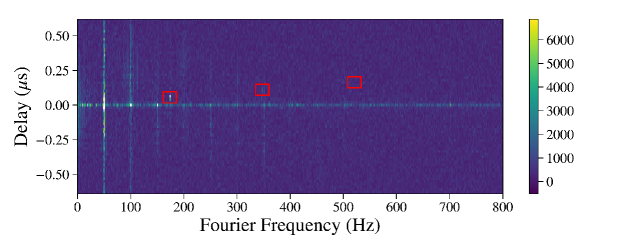
For the demonstration, we have used about 1.3 s of data from one of the GMRT observations on the bright pulsar J04374715 presented in the previous section. To make the interference visually apparent in the spectrograms, the already present interference by 50 Hz (and its harmonics) were manually enhanced by a factor of 4. The resultant spectrogram is shown in the top panel in Figure 8, and the second panel shows its 2D DFT. Here is denoted as Fourier frequency and . Interference at 50 Hz and several of its harmonics is clearly visible. Note that the variation in the interference power along the vertical axis in this 2D DFT depends on how the interference power is distributed along various frequency channels in the spectrogram. In an ideal case, when the interference power is uniformly distributed across all the channels, it will show up only on the =0 row in the 2D DFT.
Note that the periodic signal from the pulsar J04374715 is dispersed due to propagation effects in the ionized interstellar medium. As a consequence, the periodic train of pulses originated from the source exhibits a frequency dependent time delay. Due to this dispersed nature, the modulation power of periodic signal from the pulsar is expected to be offset from the =0 row in the 2D DFT. An offset from the =0 can also be used to distinguish between RFI and astronomical dispersed signals, which enables an efficient way of searching for new pulsars using 2D DFT. Camilo et al. (1996) used this method to search for millisecond pulsars, and more details of the method can be found therein. The expected locations corresponding to the pulsar’s spin frequency and first two harmonics are marked in the 2D DFT by red-colored rectangles in Figure 8. Even within this just 1.3 s of data, the excess power due to the pulsar signal is clearly visible at the locations of the fundamental and first harmonic.
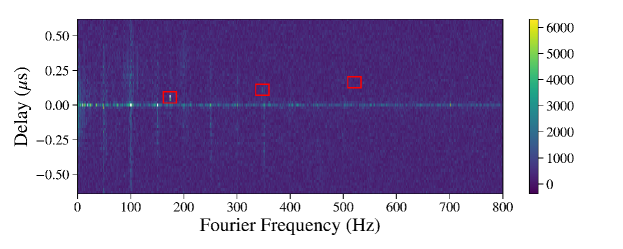
The third panel of Figure 8 shows the 2D DFT after the spectrogram was cleaned using RFIClean. While a noticeable decrease in the interference power, primarily at 50 Hz, is visible, it is evident that the RFI is not fully mitigated. To mitigate the remnant RFI, we computed the vertical average of the 2D DFT and identified the Fourier frequencies where the power exceeded a specified threshold. The data corresponding to these Fourier frequencies were replaced by local mean values in the 2D DFT. The cleaned spectrogram obtained by an inverse transform of the modified 2D DFT is shown in the bottom panel. While this simple approach efficiently mitigated most of the periodic RFI in this simple example, more complex contamination might require more sophisticated approaches.
New features for RFIClean are currently being planned, including reading and writing data in formats other than sigproc filterbank, and implementing the spectral kurtosis method (Nita & Gary, 2010), to mitigate non-periodic RFI even more efficiently. That said, the current version has already shown to be a powerful and sometimes essential tool in discovering and studying new pulsars and FRBs.
5 Conclusions
We have presented a method to identify and mitigate periodic RFI in the Fourier-domain, and showed that mitigating periodic RFI is essential for efficient identification and excision of other kinds of RFI. An accelerated software implementation of the method, RFIClean, is publicly available at http://github.com/ymaan4/rficlean. The method is shown to significantly enhance the effective sensitivity, and we have presented a few examples where it has been instrumental in detecting faint pulsars and FRBs. Given its suitability and usefulness, the method is also already being used in pulsar timing experiments. While our focus has been to show the benefits on pulsar and FRB data, the method is directly applicable to a wide range of radio observations, particularly in the time-domain, of diverse astrophysical sources.
Acknowledgements.
We thank our referee, Scott Ransom, for his comments and suggestions which have helped in improving the paper. The research leading to these results has received funding from the European Research Council under the European Union’s Seventh Framework Programme (FP/2007-2013) / ERC Grant Agreement n. 617199 (‘ALERT’); from Vici research programme ‘ARGO’ with project number 639.043.815, financed by the Netherlands Organisation for Scientific Research (NWO); and from the Netherlands eScience Center (NLeSC) grant ASDI.15.406 (‘AA-ALERT’).This paper is based (in part) on data obtained with the International LOFAR Telescope (ILT) under under project code COM_ALERT, OBSID L775795. LOFAR (van Haarlem et al. 2013) is the Low Frequency Array designed and constructed by ASTRON. It has observing, data processing, and data storage facilities in several countries, that are owned by various parties (each with their own funding sources), and that are collectively operated by the ILT foundation under a joint scientific policy. The ILT resources have benefitted from the following recent major funding sources: CNRS-INSU, Observatoire de Paris and Université d’Orléans, France; BMBF, MIWF-NRW, MPG, Germany; Science Foundation Ireland (SFI), Department of Business, Enterprise and Innovation (DBEI), Ireland; NWO, The Netherlands; The Science and Technology Facilities Council, UK; Ministry of Science and Higher Education, Poland.
References
- Anterrieu et al. (2016) Anterrieu, E., Khazaal, A., Cabot, F., & Kerr, Y. 2016, Remote Sensing of Environment, 180, 76
- Baan et al. (2004) Baan, W. A., Fridman, P. A., & Millenaar, R. P. 2004, AJ, 128, 933
- Baddi (2011) Baddi, R. 2011, AJ, 141, 190
- Barr et al. (2013) Barr, E. D., Guillemot, L., Champion, D. J., et al. 2013, MNRAS, 429, 1633
- Buch et al. (2016) Buch, K. D., Bhatporia, S., Gupta, Y., et al. 2016, Journal of Astronomical Instrumentation, 5, 1641018
- Camilo et al. (1996) Camilo, F., Nice, D. J., Shrauner, J. A., & Taylor, J. H. 1996, ApJ, 469, 819
- Camilo et al. (2007) Camilo, F., Ransom, S. M., Peñalver, J., et al. 2007, ApJ, 669, 561
- Deshpande (2005) Deshpande, A. A. 2005, Radio Science, 40, RS5S12
- Dwyer (1983) Dwyer, R. F. 1983, Proc. IEEE Int. Conf. on Acoustic, Speech, and Signal Processing (New York: IEEE), 8, 607
- Eatough et al. (2009) Eatough, R. P., Keane, E. F., & Lyne, A. G. 2009, MNRAS, 395, 410
- Faulkner et al. (2004) Faulkner, A. J., Stairs, I. H., Kramer, M., et al. 2004, MNRAS, 355, 147
- Frigo & Johnson (2005) Frigo, M. & Johnson, S. G. 2005, Proceedings of the IEEE, 93, 216, special issue on “Program Generation, Optimization, and Platform Adaptation”
- Hewish et al. (1968) Hewish, A., Bell, S. J., Pilkington, J. D. H., Scott, P. F., & Collins, R. A. 1968, Nature, 217, 709
- Hogden et al. (2012) Hogden, J., Vander Wiel, S., Bower, G. C., et al. 2012, ApJ, 747, 141
- Hotan et al. (2004) Hotan, A. W., van Straten, W., & Manchester, R. N. 2004, PASA, 21, 302
- Lazarus et al. (2020) Lazarus, P., Karuppusamy, R., Graikou, E., et al. 2020, CoastGuard: Automated timing data reduction pipeline
- Lorimer et al. (2007) Lorimer, D. R., Bailes, M., McLaughlin, M. A., Narkevic, D. J., & Crawford, F. 2007, Science, 318, 777
- Maan (2015) Maan, Y. 2015, ApJ, 815, 126
- Maan & Aswathappa (2014) Maan, Y. & Aswathappa, H. A. 2014, MNRAS, 445, 3221
- Maan et al. (2013) Maan, Y., Deshpande, A. A., Chandrashekar, V., et al. 2013, ApJS, 204, 12
- Maan et al. (2019) Maan, Y., Joshi, B. C., Surnis, M. P., Bagchi, M., & Manoharan, P. K. 2019, ApJL, 882, L9
- Nita & Gary (2010) Nita, G. M. & Gary, D. E. 2010, PASP, 122, 595
- Nita et al. (2007) Nita, G. M., Gary, D. E., Liu, Z., Hurford, G. J., & White, S. M. 2007, PASP, 119, 805
- Oostrum et al. (2020) Oostrum, L. C., van Leeuwen, J., Maan, Y., Coenen, T., & Ishwara-Chandra, C. H. 2020, MNRAS, 492, 4825
- Pastor-Marazuela et al. (2020) Pastor-Marazuela, I., Connor, L., van Leeuwen, J., et al. 2020, arXiv e-prints, arXiv:2012.08348
- Ransom et al. (2002) Ransom, S. M., Eikenberry, S. S., & Middleditch, J. 2002, AJ, 124, 1788
- Sclocco et al. (2019) Sclocco, A., Vohl, D., & van Nieuwpoort, R. V. 2019, in 2019 RFI Workshop - Coexisting with Radio Frequency Interference (RFI), 1–8, arXiv: 2001.03389
- Smits et al. (2005) Smits, J. M., Mitra, D., & Kuijpers, J. 2005, A&A, 440, 683
- Sosa Fiscella et al. (2020) Sosa Fiscella, V., del Palacio, S., Combi, L., et al. 2020, arXiv e-prints, arXiv:2010.00010
- Susobhanan et al. (2020) Susobhanan, A., Maan, Y., Joshi, B. C., et al. 2020, arXiv e-prints, arXiv:2007.02930
- Thornton et al. (2013) Thornton, D., Stappers, B., Bailes, M., et al. 2013, Science, 341, 53