A High-Resolution View of Fast Radio Burst Host Environments
Abstract
We present Hubble Space Telescope (HST/WFC3) ultraviolet and infrared observations of eight fast radio burst (FRB) host galaxies with sub-arcsecond localizations, including the hosts of three known repeating FRBs. We quantify their spatial distributions and locations with respect to their host galaxy light distributions, finding that they occur at moderate host normalized-offsets of 1.4 ([0.6, 2.1]; 68% interval), occur on fainter regions of their hosts in terms of IR light, but overall trace the radial distribution of IR light in their galaxies. The FRBs in our tested distribution do not clearly trace the distributions of any other transient population with known progenitors, and are statistically distinct from the locations of LGRBs, H-poor SLSNe, SGRBs, and Ca-rich transients. We further find that most FRBs are not in regions of elevated local star formation rate and stellar mass surface densities in comparison to the mean global values of their hosts. We also place upper limits to the IR flux at the FRB positions of AB mag, constraining both satellite and background galaxies to luminosities well below the host luminosity of FRB 121102. We find that 5/8 FRB hosts exhibit clear spiral arm features in IR light, and that the positions of all well-localized FRBs located in such hosts are consistent with their spiral arms, although not on their brightest regions. Our results do not strongly support the primary progenitor channel of FRBs being connected either with the most massive (stripped-envelope) stars, or with events which require kicks and long delay times (neutron star mergers).
1 Introduction
Since the discovery of fast radio bursts (FRBs) in 2007 (Lorimer et al., 2007) – dispersed, millisecond-timescale transients, traced primarily to cosmological distances (Thornton et al., 2013; Cordes & Chatterjee, 2019) – their definitive origins have remained elusive. The emerging association of FRBs with magnetized neutron stars (“magnetars”) was catalyzed by the discovery and sub-arcsecond localization of the repeating FRB 121102 (Spitler et al., 2016; Chatterjee et al., 2017; Tendulkar et al., 2017), which was found to be spatially consistent with a compact, persistent radio source (Chatterjee et al., 2017) postulated to be a synchrotron nebula powered by an embedded magnetar (Marcote et al., 2017; Margalit & Metzger, 2018) or an offset active galactic nucleus (AGN; Marcote et al. 2017; Eftekhari et al. 2020). The association of at least some FRBs with magnetars was further solidified by the detection of multiple FRB events from the Galactic magnetar SGR 1935+2154 (CHIME/FRB Collaboration et al., 2020; Bochenek et al., 2020). However, a myriad of progenitor models still exist (Platts et al., 2019; Petroff et al., 2019), and the precise connection to magnetars for the extragalactic population has yet to be made definitive. Moreover, given the diversity of their observed FRB properties, it is not clear if there is one or multiple progenitor channels for FRB production.
The advent of dedicated FRB experiments are fueling an unprecedented rise in their detection rates (CHIME/FRB Collaboration et al., 2018; Macquart et al., 2010). One of the most promising ways to make progress on their origins is through robust associations to host galaxies, which generally requires precise localizations of (Eftekhari & Berger, 2017). Indeed, different progenitor channels will yield distinct host galaxy demographics and host stellar population properties (e.g., Margalit et al. 2019). It is also expected that different production pathways will be imprinted in how FRBs are distributed with respect to their host galaxies. Prior to recent advancements in our ability to localize FRBs, surveys were only able to produce arc-second localizations for repeating bursts such as 121102 and 180916. Repeating bursts, however, are thought to only make up of all bursts. This means that, as of now, repeating bursts are over-represented in the sample of precisely localized FRBs. With surveys such as CRAFT (Shannon et al., 2018) coming online which provide sub-arcsecond localizations of apparently non-repeating bursts, we can form a more complete picture of FRB host characteristics and therefore production pathways.
Locations have historically played an important role in delineating the progenitors of a wide range of transients. For instance, the spatial distributions and strong correlation with the UV light distributions of their hosts for super-luminous supernovae (SLSNe) and long-duration gamma-ray bursts (LGRBs) is commensurate with their massive star origins (Woosley, 1993; Fruchter et al., 2006; Lunnan et al., 2015; Perley et al., 2016), while the significant offsets of short-duration gamma-ray bursts (SGRBs) and weaker correlation to UV light is indicative of an older stellar progenitor (e.g. Fong & Berger, 2013). Moreover, quantifying the relationship between the locations of core-collapse SNe (CCSNe, Types Ib/c, II) and Type Ia SNe, to detailed morphological features such as spiral arms, can serve as an indirect indicator of the age of their stellar and/or white dwarf progenitors (Audcent-Ross et al., 2020).
For FRBs, two primary pathways that have been considered for magnetar formation are “prompt” magnetars, formed from massive star progenitors, and “delayed”-channel magnetars, formed from existing compact objects and their interactions, e.g., neutron star mergers or accretion-induced collapse (AIC) of a white dwarf to a NS (Nicholl et al., 2017; Margalit et al., 2019). Detailed studies using ground-based observations based on the first dozen well-localized FRBs and their host galaxies have shown that their spatial distributions are inconsistent with engine-driven massive star explosions (LGRBs, SLSNe; Li et al. 2019; Bhandari et al. 2020a; Heintz et al. 2020; Bochenek et al. 2020).
One is therefore motivated to characterize, as precisely as possible, the local environments of FRBs within their host galaxies. Furthermore, the competing progenitor models offer distinct predictions for the ages and masses of the responsible compact object(s). For young progenitors, there must be a direct link to ongoing or recent star-formation activity. Older progenitor channels, meanwhile, may track the underlying stellar mass of the galaxy. Thus motivated, we have designed an experiment to examine the local environments of FRBs, in both active star-formation (via near-UV light) and stellar mass (near-IR) and at the highest spatial resolution afforded by space-borne instrumentation.
Against this backdrop, we present the first comprehensive sample of HST observations for eight FRB host galaxies, six of which are newly presented in this work. In Section 2, we describe our sample, observations and data reduction. In Section 3, we present the spatial distribution of FRBs (angular, physical and host-normalized offsets) and the locations of FRBs with respect to their host light distributions. In Section 4, we present the results of surface brightness profile fits, including the revelation of spiral structure in several hosts; constraints on the star formation rate and stellar mass densities at the FRB positions; and deep limits on possible satellite or background galaxies. In Section 5, we discuss the implications of our results in terms of FRB progenitors. We highlight our main conclusions in Section 6. Throughout the paper, we employ a Planck cosmology with km s-1 Mpc-1, , and (Planck Collaboration et al., 2016). All of the data and analysis code are made available via GitHub111https://github.com/FRBs/FRB.
| FRB | RAHost | DecHost | Instrument | Filter | Date | Exp. Time | |||
|---|---|---|---|---|---|---|---|---|---|
| (J2000) | (J2000) | (mas) | () | (UT) | (sec) | ||||
| 121102 | 05h31m58.69s | 33∘08′52.43′′ | 6.3 | 0.1927 | WFC3/IR | F160W | 2017 Feb 23 | 1197 | |
| WFC3/UVIS | F763M | 2017 Feb 23 | 1940 | ||||||
| 180916 | 01h58m00.29s | 65∘42′53.09′′ | 1.8 | 0.0337 | WFC3/IR | F110W | 2020 Jul 17 | 5623 | |
| WFC3/UVIS | F673N | 2020 Jul 16 | 2877 | ||||||
| 180924 | 21h44m25.256s | 40∘54′00.80′′ | 0.4 | 0.3212 | WFC3/IR | F160W | 2019 Nov 27 | 2470 | |
| 3.1 | WFC3/UVIS | F300X | 2019 Nov 26 | 2492 | |||||
| 190102 | 21h29m39.577s | 79∘28′32.52′′ | 14.2 | 0.2912 | WFC3/IR | F160W | 2020 Jan 14 | 2470 | |
| † | WFC3/UVIS | F300X | 2019 Oct 07 | 2776 | |||||
| 190608 | 22h16m04.903s | 07∘53′55.91′′ | 0.8 | 0.1177 | WFC3/IR | F160W | 2019 Dec 01 | 2295 | |
| 0.8 | WFC3/UVIS | F300X | 2019 Oct 11 | 2400 | |||||
| 190711 | 21h57m40.613s | 80∘21′29.05′′ | 5.2 | 0.522 | WFC3/IR | F160W | 2020 May 11 | 2470 | |
| 7.7 | WFC3/UVIS | F300X | 2020 May 09 | 2780 | |||||
| 190714 | 12h15m55.090s | 13∘01′15.96′′ | 1.1 | 0.2365 | WFC3/IR | F160W | 2020 Apr 30 | 2295 | |
| † | WFC3/UVIS | F300X | 2020 May 19 | 2396 | |||||
| 191001 | 21h33m24.440s | 54∘44′54.53′′ | 0.5 | 0.2340 | WFC3/IR | F160W | 2020 Apr 28 | 2296 | |
| † | WFC3/UVIS | F300X | 2020 Apr 25 | 2580 |
Note. — Data are from programs 15878 (FRB 180924, 190102, 190608, PI: Prochaska), 16080 (FRBs 190711, 190714, and 191001, PI: Mannings), 14890 (FRB 121102, PI: Tendulkar), and 16072 (FRB 180916, PI: Tendulkar).
is the positional uncertainty of the host (RA and Dec components added in quadrature). is the host stellar mass.
† S/N of host galaxy is not sufficient to obtain an uncertainty on the position.
Redshift References– Tendulkar et al. (2017); Bannister et al. (2019); Marcote et al. (2020); Bhandari et al. (2020a); Heintz et al. (2020)
2 Data
2.1 Sample of FRB Host Galaxies
Here we present observations of eight FRB host galaxies obtained with the Wide-Field Camera 3 using the infrared and ultra-violet-visual channels (WFC3/IR and WFC3/UVIS). The data for six of the FRB host galaxies were collected between October 2019 and April 2020 as part of programs 15878 (PI: Prochaska) and 16080 (PI: Mannings), which targeted galaxies for which FRB events have been detected and localized by the Commensal Real-time ASKAP Fast Transients (CRAFT) survey on the Australian Square Kilometer Array Pathfinder (ASKAP; Bannister et al. 2019; Day et al. 2020; Bhandari et al. 2020a; Chittidi et al. 2020; Macquart et al. 2020). These bursts were localized to sub-arcsecond precision, with .
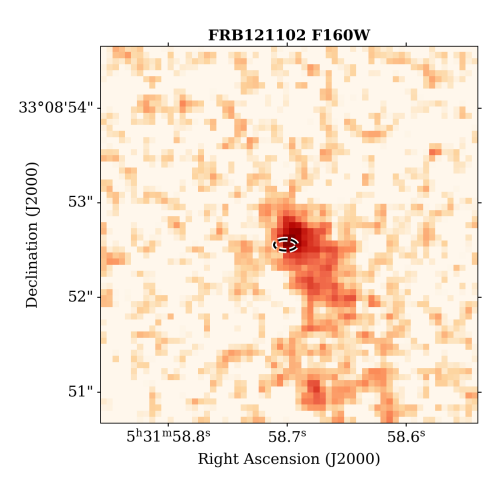
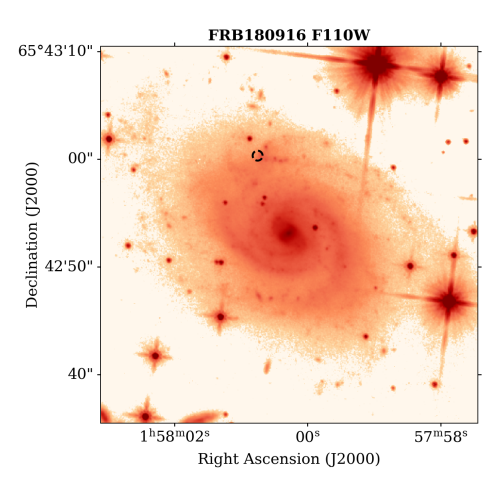
We also include two additional FRB hosts with HST observations, FRB 121102222The Transient Name Server (TNS) name for this burst is FRB 20121102a. (Bassa et al., 2017) under program 14890 (PI: Tendulkar) taken in February 2017 and FRB 180916 (Tendulkar et al., 2020) under program 16072 (PI: Tendulkar) taken in July 2020. FRB 121102 was discovered by the Arecibo telescope (Spitler et al., 2016), and subsequently localized via repeating bursts with the Very Large Array (VLA; Chatterjee et al. 2017), and with Very Long Baseline Interferometry (EVN VLBI; Marcote et al. 2017) with . FRB 180916 is the closest and most precisely localized FRB with (Marcote et al., 2020). Our sample thus comprises all eight FRB host galaxies for which there exist available HST observations. Table 1 summarizes all of these data and Table 2 summarizes coordinates and the localization errors of the FRBs.
| FRB | RAFRB | DecFRB | PA | ||||
|---|---|---|---|---|---|---|---|
| (J2000) | (J2000) | (′′) | (′′) | (′′) | (′′) | (deg) | |
| 121102 | 82.994589 | 0.004 | 0.00 | 0.002 | 0.00 | 90.0 | |
| 180916 | 29.503126 | 0.001 | 0.00 | 0.001 | 0.00 | 0.0 | |
| 180924 | 326.105229 | 0.07 | 0.09 | 0.06 | 0.07 | 0.0 | |
| 190102 | 322.415667 | 0.21 | 0.52 | 0.17 | 0.44 | 0.0 | |
| 190608 | 334.019875 | 0.19 | 0.19 | 0.18 | 0.18 | 90.0 | |
| 190611 | 320.745458 | 0.34 | 0.60 | 0.32 | 0.60 | 0.0 | |
| 190711 | 329.419500 | 0.12 | 0.38 | 0.07 | 0.32 | 90.0 | |
| 190714 | 183.979667 | 0.17 | 0.32 | 0.10 | 0.23 | 90.0 | |
| 191001 | 323.351554 | 0.13 | 0.11 | 0.08 | 0.10 | 90.0 | |
| 200430 | 229.706417 | 0.01 | 0.02 | 0.24 | 1.00 | 0.0 |
Note. — are the angular size of the semi-major axis describing the statistical and systematic uncertainties respectively. refers to the semi-minor axis. PA is the sky position angle of the error ellipse. Sources without reported systematic error have been incorporated in the statistical. Data from Day et al. (2020); Tendulkar et al. (2017); Marcote et al. (2020); Heintz et al. (2020).
All of the host galaxies in our HST sample have spectroscopically-confirmed redshifts. These are considered secure associations333See also Aggarwal et al. (2021) for a Bayesian analysis that reaches similar conclusions. with probabilities of chance coincidence of 0.05 (Heintz et al., 2020) with their most likely host galaxy. The HST data for FRB 121102 and FRB 180916 were previously published in Bassa et al. (2017) and Tendulkar et al. (2020), respectively, while the WFC3/UVIS image for FRB 190608 and its local environment was previously published and analyzed in Chittidi et al. (2020). All of the remaining HST observations are newly presented here. Three of the bursts are known “repeating” FRBs (FRBs 121102, 190711 and 180916; Spitler et al. 2016; Kumar et al. 2020) while the remaining bursts are apparent “non-repeaters”.
We supplement this sample with ground-based data from two other FRB hosts presented in Heintz et al. (2020) with secure host associations (FRB 190611 and FRB 200430) when computing cumulative distributions of offsets in Section 3.2. Both of these FRBs in the ground-based sample are apparent non-repeaters. Combined, our ground-based and HST sample comprises all FRBs with sub-arcsecond localizations discovered over 2012-2020. The exception is FRB 190614D which does not have a clear host galaxy association (Law et al., 2020), and is not included in the sample.
In current surveys (including this one), repeating bursts are over-represented within the sample of precisely localized FRBs. Because of their repetition, they are more likely to be localized and make up around half of these precisely localized bursts. Only 5% of FRBs are known to repeat ((citation)). differentiating between repeaters and non-repeaters will be important in future studies with larger sample sizes, as the non-repeaters will represent the majority of all FRBs.
2.2 Observations
For the WFC3/UVIS observations under programs 15878 and 16080, we use the ultra-wide F300X filter to sample the rest-frame near- and far-ultraviolet (NUV/FUV) wavelengths with the aim of capturing the distribution of star formation in the host galaxies. This filter provides increased throughput in the NUV compared to the standard wide filters (although it has a minor red tail out to 4000 Å), and is chosen to maximize the signal-to-noise (S/N) in a single orbit of HST imaging. To minimize the effects of charge transfer efficiency (CTE) degradation, we set up the observations to position the targets near the readout on amplifier C located on chip 2. We used a 4-point dither pattern to sub-sample the point spread function (PSF) and remove detector artifacts. We increase the line and point spacing by a factor of 5 over the standard box pattern to remove residual background patterns as described in Rafelski et al. (2015). The data from program 15878 include a 9 e- post-flash per exposure to reach 12 e- per pixel background. Recently there was a new recommendation to reach a background of 20e-, and therefore the data obtained in program 16080 included a 17 e- post-flash to reach this level (Anderson et al., 2012).
For the WFC3/IR observations under programs 15878 and 16080, we use the F160W filter, the reddest wide filter available with HST, to cover the rest-frame optical band to assess the distribution of the stellar mass as traced by older stellar populations. We use SPARS25 and NSAMP15 to ensure that the observations remain in the linear count regime, and obtain clean images by dithering over the known IR “blobs” with a seven-point dither pattern with a factor 3 increase in spacing of the 7 point wide dither pattern provided in Anderson (2016). Finally, the data for FRB 121102 under program 14890 employ a two-point and four-point dither pattern for the WFC3/UVIS and IR observations, while the data for 180916 employ a three point and four-point dither pattern, respectively (Bassa et al., 2017; Tendulkar et al., 2020). The details of these observations are listed in Table 1.
2.3 Image Processing
The data were retrieved from the Barbara A. Mikulski Archive for Space Telescopes (MAST), and the WFC3/UVIS data are custom calibrated. These data have degraded CTE, and therefore require pixel-based CTE corrections (Anderson et al., 2012). In addition, the degradation requires improved dark, hot pixel, and bias level corrections. First, we use a new correction for the CTE. Second, we apply concurrent superdarks to the data, reducing the blotchy pattern otherwise present (Rafelski et al., 2015). Third, we identify hot pixels in the darks such that the number of hot pixels is consistent as a function of the distance to the readout amplifiers based on the number of hot pixels identified close to the readout. This is accomplished by modifying the threshold for hot pixel detection as a function of distance to the readout (Prichard et al. in prep). Lastly, we normalize the amplifiers since the applied superbias is based on bias files with insufficient background levels for a pixel based CTE correction. We measure the background level in each amplifier after masking sources, and match the background level between the amplifiers.
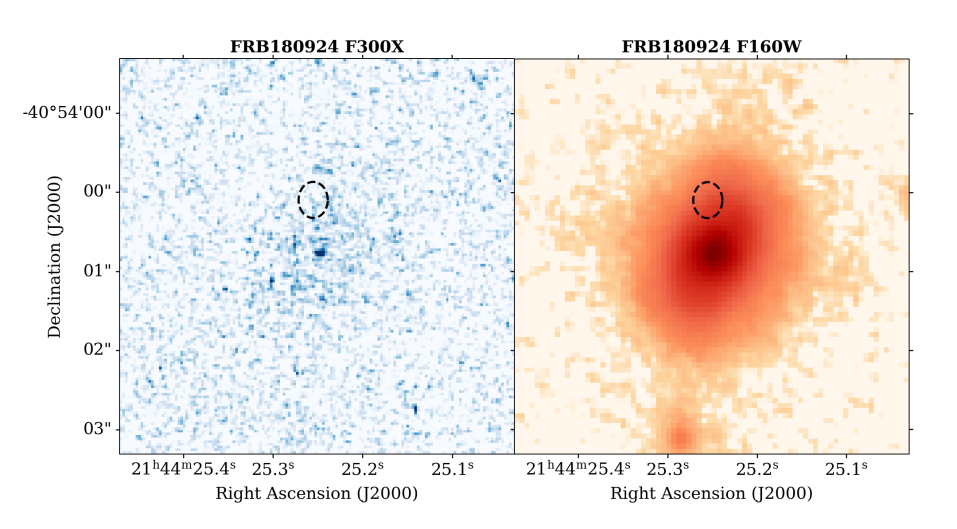
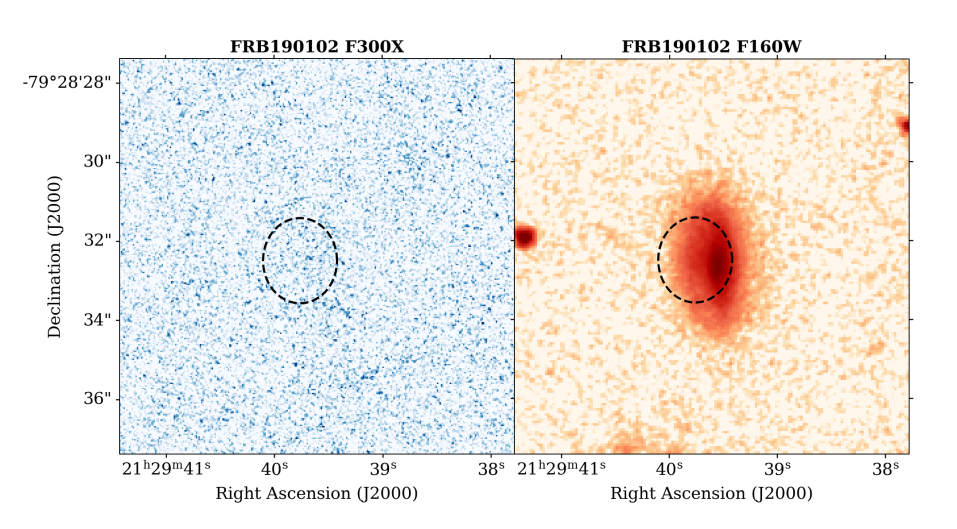
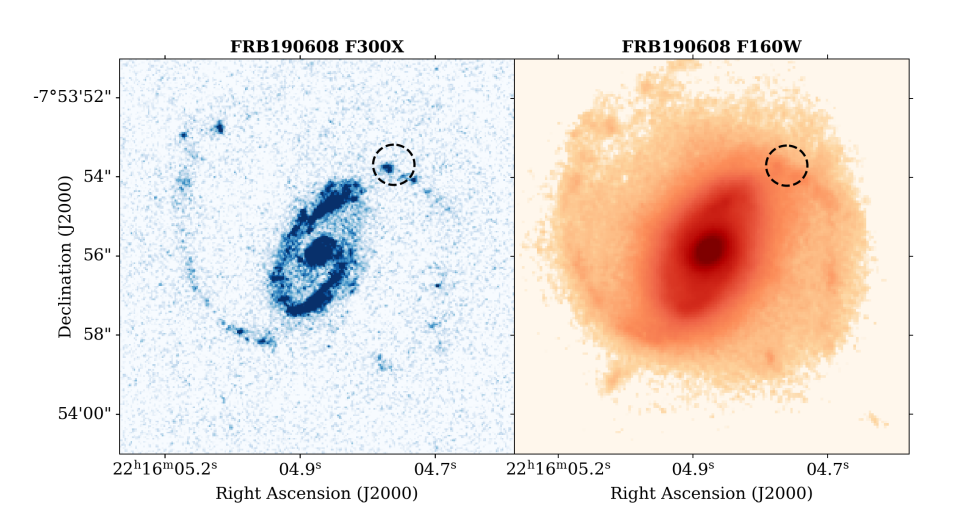
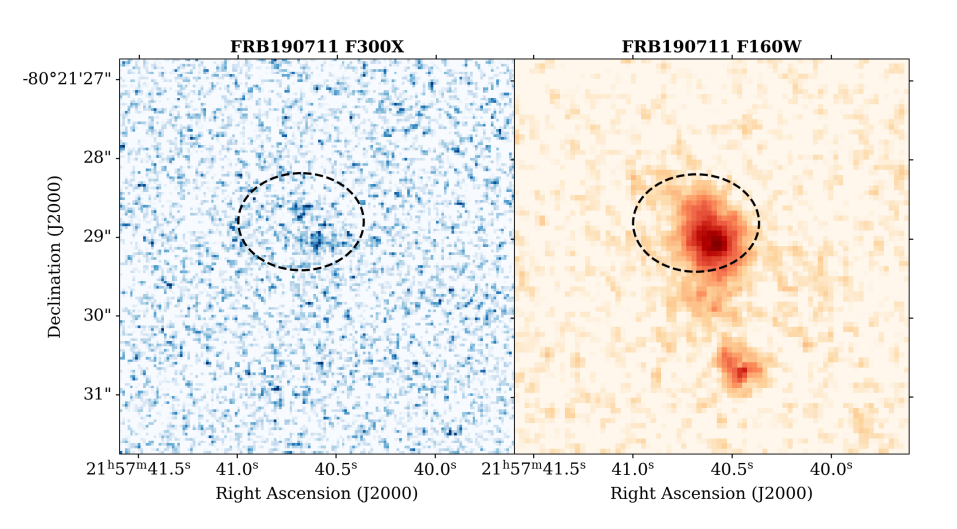
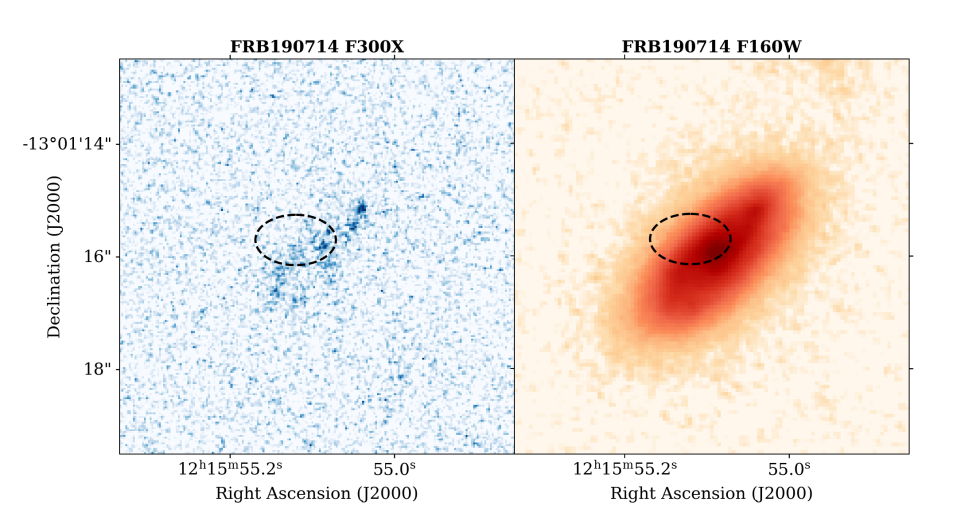
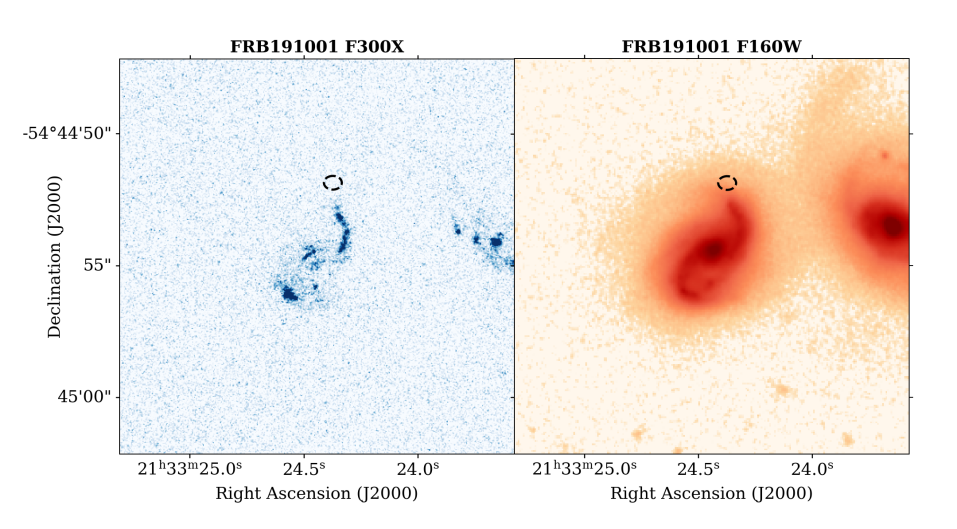
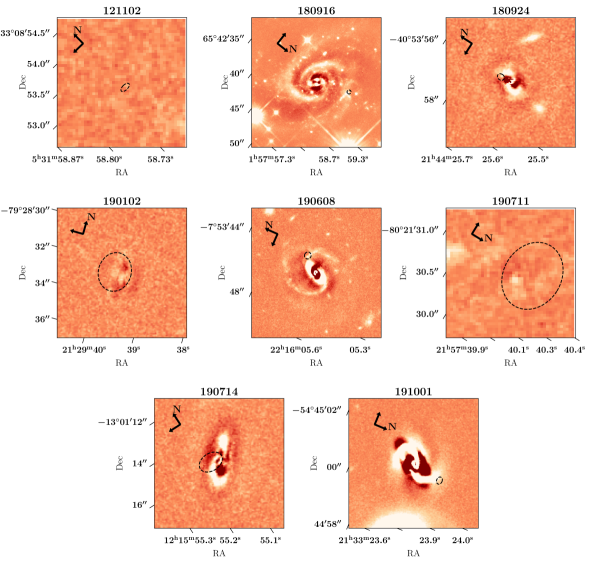
To combine the images for each FRB and in each filter, we used the AstroDrizzle routine as part of the DrizzlePac software package (Avila et al., 2015) employing a pixfrac, pixscale for UVIS images, and for IR images. As part of AstroDrizzle, we also perform cosmic ray removal and sky subtraction. The final drizzled images are shown in Figures 1-3.
3 FRB Locations & Offsets
In this section, we present the locations of the FRBs in our sample with respect to their host galaxy centers. We introduce their angular and physical offsets ( and , respectively), “host-normalized” offsets () which are normalized by the half-light radii of their host galaxies, the location with respect to their host galaxy light distribution (“fractional flux”; ), and the fraction of light enclosed within the radius of the FRB.
3.1 Astrometry & Uncertainties
We first perform absolute astrometry using sources in common between available deep, optical ground-based imaging and the Gaia DR2 catalog. The ground-based imaging is sourced from the Gemini-North Observatory (FRB 121102), Gemini-South Observatory (FRB 190711), Very Large Telescope (VLT; FRBs 190102, 190714, 191001), the Dark Energy Survey (DES; FRB 180924) and the Sloan Digital Sky Survey (SDSS; FRB 190608). We then perform relative astrometry to tie the ground-based images to the WFC3/IR images. This series of astrometric ties ensures that there are enough sources in common with the WFC3 imaging, which has a significantly narrower field-of-view than the ground-based imaging, to properly calculate the total astrometric uncertainty. For astrometry, we employ a six-order polynomial accounting for linear shifts, rotation, and skew, using IRAF/ccmap and ccsetwcs. We calculate a range of tie uncertainties in each coordinate, of and .
We also use the SourceExtractor tool (Bertin & Arnouts, 1996) to determine the FRB galaxy centroid positions and associated uncertainties (). These positions and values for are listed in Table 1. The final source of uncertainty is the positional uncertainty of the FRB (), which is derived from the statistical and systematic uncertainties from the FRB detections (Table 2).
| FRB | Filter | / | ||||
|---|---|---|---|---|---|---|
| (′′) | (kpc) | |||||
| 121102 | F160W | 0.23 0.02 | 0.75 0.05 | 0.37 0.02 | 0.70 0.07 | 0.24 0.12 |
| F763M | 0.67 0.10 | |||||
| 180916 | F110W | 7.760 0.023 | 5.386 0.016 | 0.897 0.003 | 0.32 0.07 | 0.90 0.09 |
| F673N | 0.32 0.25 | |||||
| 180924 | F160W | 0.71 0.12 | 3.37 0.56 | 1.20 0.20 | 0.24 0.11 | 0.66 0.07 |
| F300X | ||||||
| 190102 | F160W | 0.80 0.39 | 2.26 2.22 | 0.45 0.44 | 0.39 0.25 | 0.25 0.16 |
| F300X | 0.36 0.29 | |||||
| 190608 | F160W | 2.98 0.27 | 6.52 0.60 | 0.88 0.08 | 0.19 0.06 | 0.82 0.08 |
| F300X | 0.39 0.28 | |||||
| 190611 | GMOS-Sr | 2.24 0.66 | 11.36 3.59 | 5.29 1.67 | ||
| 190711 | F160W | 0.53 0.27 | 1.94 2.30 | 0.78 0.93 | 0.55 0.27 | 0.61 0.22 |
| F300X | ||||||
| 190714 | F160W | 0.61 0.29 | 1.97 1.18 | 0.51 0.31 | 0.34 0.23 | 0.23 0.10 |
| F300X | 0.38 0.31 | |||||
| 191001 | F160W | 2.74 0.15 | 10.49 0.59 | 2.87 0.16 | 0.09 0.03 | 0.91 0.09 |
| F300X | 0.29 0.25 | |||||
| 200430 | Pan-STARRSr | 1.30 0.79 | 2.97 2.36 | 1.81 1.44 | ||
| Median (IR) | 1.1 | 3.2 | 0.9 | 0.33 | 0.6 | |
| 16,84% Interval | [0.6,2.9] | [2.0,8.7] | [0.5,2.4] | [0.20,0.53] | [0.2,0.9] | |
| Median (UV) | 0.37 | |||||
| 16,84% Interval | [0.32,0.45] |
Note. — FRBs 190611 and 200430 are derived from ground-based imaging as reported in Heintz et al. (2020)
3.2 Physical & Host-normalized Offsets
Given that FRB localizations are typically non-circular (elliptical) in shape, and that their values span a range (), it is necessary to take their shape, size, and orientation into account when calculating the angular, physical, and host-normalized offsets. While the synthesized beam and hence localization ellipse of the FRB can in principle have any position angle, most FRB detections have been made with beams that are close to circular and report the positional uncertainties projected onto the right ascension and declination axes, and we construct our localization ellipses using these projected values. To determine the total uncertainty on offset measurements, we sum each of the RA and Dec components of the three sources of uncertainty, , , and in quadrature. We use the total uncertainties in RA and Dec to define an ellipsoidal region that represents the FRB location on the HST image.
The estimated angular offset is then the convolution of the offset from the galaxy centroid with the FRB localization:
| (1) |
with a 2-D Gaussian set by the ellipsoidal region described above. To evaluate this convolution, we divide each 5- region around the FRB into four million grid points by imposing a -point sub-grid. We measure the angular offset between each grid-point and the host galaxy center to obtain a distribution of angular offsets for each FRB. Finally, we apply a 2-D Gaussian probability distribution within the FRB localization ellipse, centered on the central RA and Dec of the FRB, and weight the angular offset distribution by the corresponding values. We estimated the variance in in a similar manner and report the RMS in Table 3.
For each FRB, we determine the median offset and standard deviation. We find a range of projected angular offsets of with a population median and 68% interval in the IR of and . The values for each FRB are listed in Table 3. We note that we only obtained offsets for observations in which the host galaxy center could be well determined, so this includes all hosts for which there are IR images, as well as the host galaxy of FRB 190608 in both the IR and UV.
We convert the angular offsets to projected physical offsets using the redshift of each FRB host galaxy and a Planck cosmology with km s-1 Mpc-1, , (Planck Collaboration et al., 2016). For the HST offsets, we find a range of kpc with the lower and upper bounds set by FRB 121102 and FRB 191001, respectively444We note that the ground-based determination for FRB 190611 is the largest physical offset, with kpc.. The median and 68% interval on the projected physical offset is 3.2 kpc and [2.0, 8.7] kpc. Finally, we use the host galaxy half-light radii (), as measured from HST imaging (see Section 4.1) to determine the host-normalized offsets, . The values for the projected angular, physical, and host-normalized offsets for the eight FRBs in our sample are listed in Table 3.
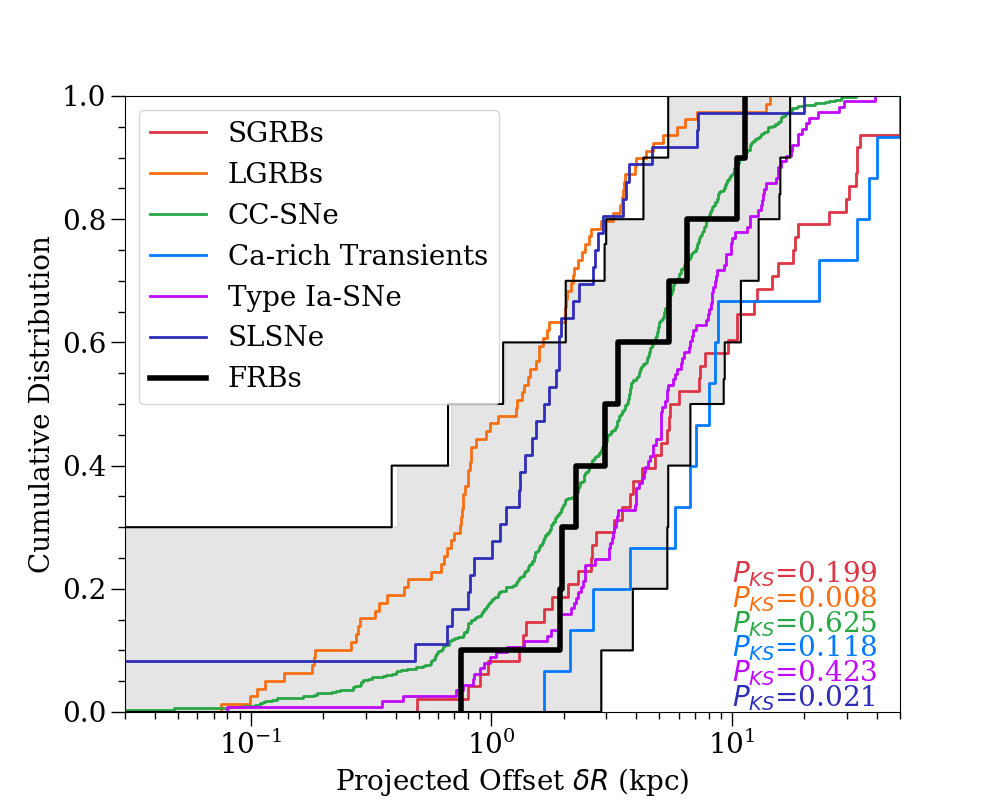
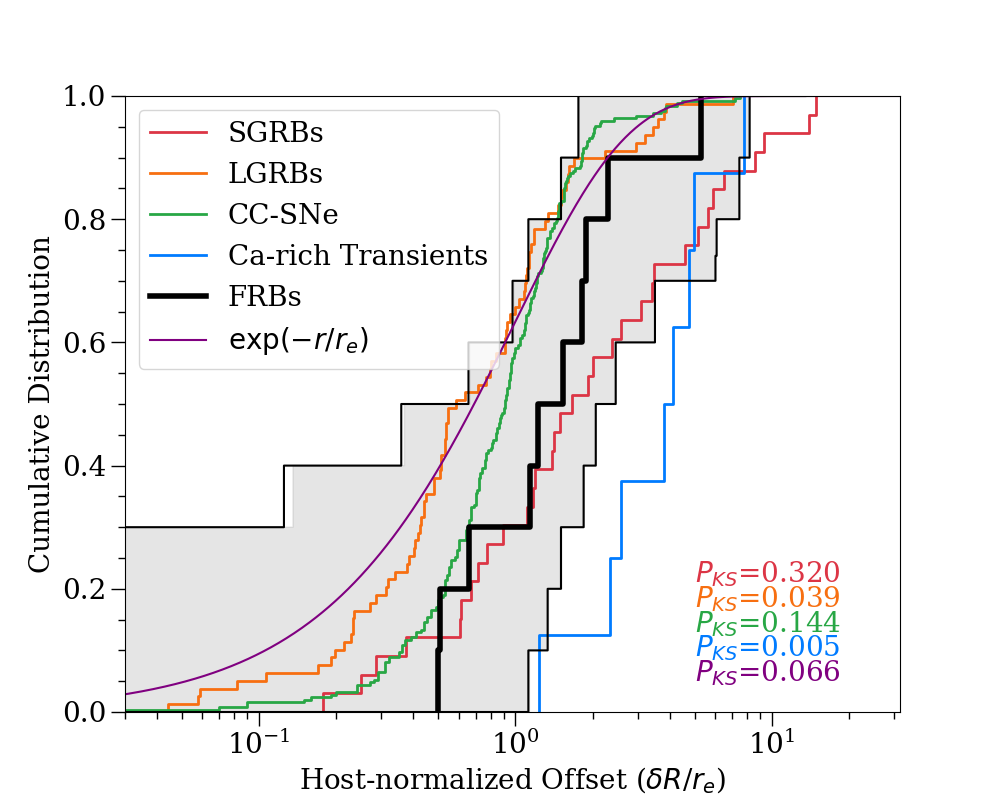
We supplement the FRB distributions with two FRB host galaxies in Heintz et al. (2020), FRBs 190611 and 200430, both of which have offsets determined from ground-based imaging with seeing of . To determine the uncertainty on the cumulative distribution, we follow the method by Palmerio et al. (2019) and create 10,000 realizations of asymmetric Gaussian PDFs using the errors on the offset measurements for each FRB, derived from the previously described weighted grid analysis. We then use a bootstrap method to sample from the PDF in each realization, allowing us to compute a CDF of the bootstrapped sample. Finally, we compute the median of all the resulting CDFs, as well as the upper and lower bounds for each bin. We perform this same analysis for the projected physical and host-normalized offset distributions. The resulting median cumulative distributions, and bootstrap estimate of the uncertainty (shown as the shaded gray region) are shown in Figure 4.
To compare the FRB distribution to the offset distributions of other transients, we draw relevant comparison samples from the literature. Included are long-duration gamma-ray bursts (LGRBs; Blanchard et al. 2016, short-duration gamma-ray bursts (SGRBs; Fong et al. 2010; Fong & Berger 2013), Ca-rich transients (Lunnan et al., 2017; De et al., 2020), Type Ia supernovae (Type Ia SNe; Uddin et al. 2020), core-collapse SNe (CCSNe; Schulze et al. 2020) and super-luminous SNe (SLSNe; Lunnan et al. 2015; Schulze et al. 2020). To align with the redshift distributions of the FRBs, we only include values for events with . We perform a two-sided KS-test between the median FRB distribution and each of the transient populations to test the null hypothesis that the (median) distribution of FRBs and each transient population is drawn from the same underlying distribution. Using this analysis for projected offsets, we find for both LGRBs and SLSNe, rejecting the null hypothesis that they are drawn from the same continuous distributions. We caution, however, that we only report KS-test results on the median FRB distribution.
However, for host-normalized offsets, we also find for Ca-rich transients and for LGRBs. The remaining -values are , and thus we cannot reject the null hypothesis for any other population tested. Finally, we compare the distribution to an exponential disk light profile (light purple curve in Figure 4). While the distribution overall appears to be at larger offsets, the value is not conclusive. In this analysis, we note that we are treating the FRB population as a single distribution with a dominant progenitor population. The sample size considered here prevents meaningful constraints on the presence of multiple, equally dominant progenitor populations, each of which have distinct offset distributions.
3.3 Fractional Flux
We now explore the location of the FRBs with respect to their host galaxy light distributions (“fractional flux”; ). The brightness of the burst site in relation to how its rest-frame UV and optical host light is distributed is a crucial tool for determining how star formation activity and stellar mass are tracked (Fruchter et al., 2006). Compared to offsets, which can depend on host size and morphology, the fractional flux method is independent of these physical characteristics. Specifically, the measurement determines the fraction of host light fainter than the flux at the burst position, where a value of unity corresponds to the brightest light level of the host (.
Foreground stars in the field of FRB 180916 preclude the direct application of this analysis to the field. Since PSF photometry and subtraction of many of these stars were difficult as they were saturated; in this case we decided to use an alternate, “brute-force” approach. We first performed an isophote fit to the galaxy using photutils (Bradley et al., 2020), clipping pixels which were over the level compared to the local mean. This left all the foreground stars and subtracted most of the galaxy light. Then we created a segmentation map from the residual image with a threshold level of over the sky background and minimum source area of 5 pixels (the default value). From the objects extracted, we selected those with a peak pixel value of 1 e- per sec or greater and created a masked image. This masked out all star light above the segmentation map threshold value. We then replaced the masked pixels with the isophote fit from earlier and used this stitched image for the fractional flux analysis.
We center a 2D cutout on each host galaxy, making sure that we include a sufficient amount of background. We then determine which pixels lie within the 3- FRB localization ellipse. We note that unlike how we determined the offsets (Section 3.2), we do not apply a sub-grid to the localization, as the main limitation is the pixel scale, and we cannot resolve the fractional flux below this scale. The fractional flux for each th pixel on N pixels within the localization is then calculated as
| (2) |
We then use a 2-D Gaussian distribution to develop a weighting scheme with each FRB localization ellipse in the same manner as that described in Section 3.2. From the distribution of values for each FRB, we determine the median and its standard deviation. The values for the fractional flux for each FRB can be found in Table 3.
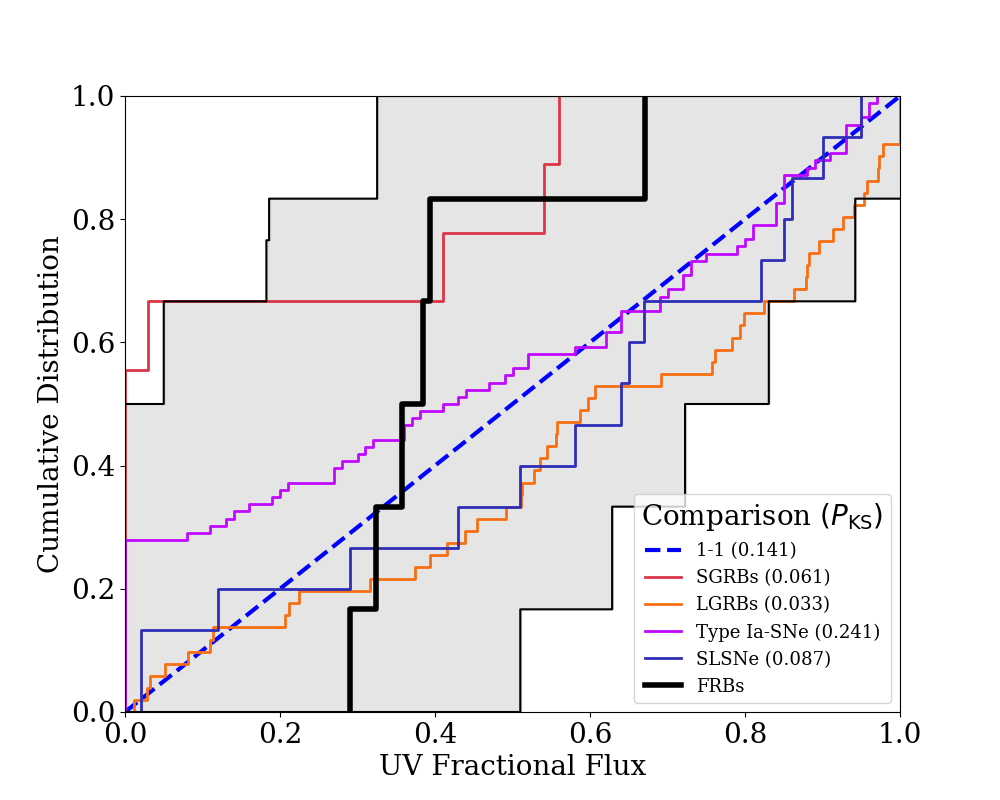
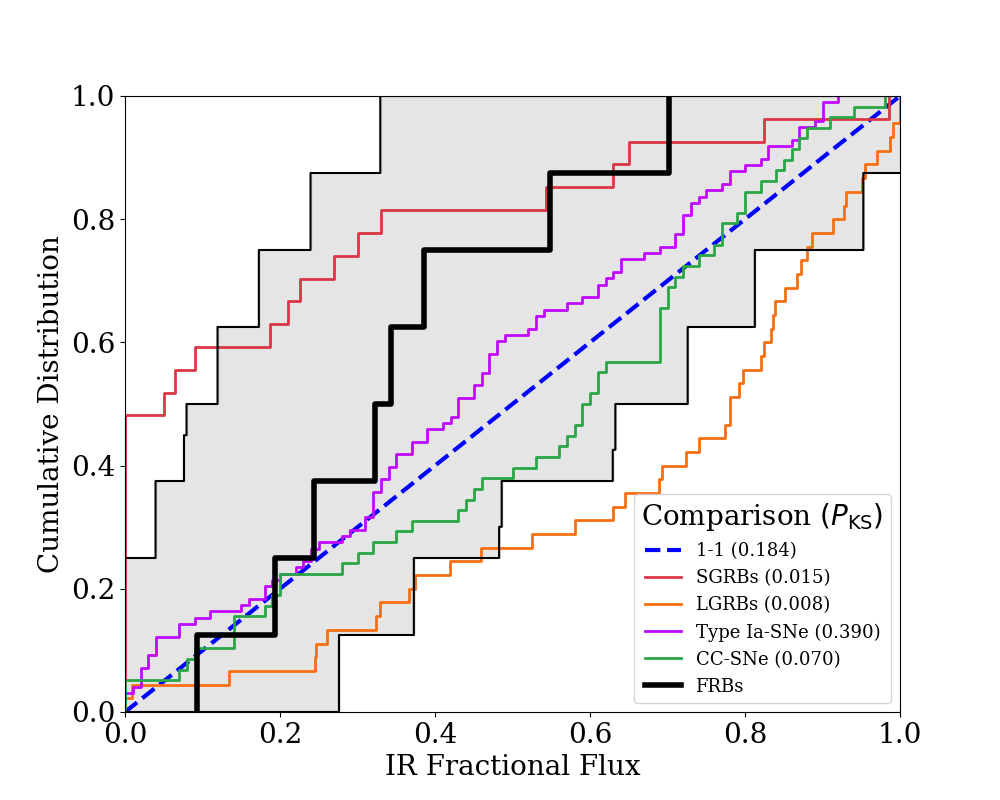
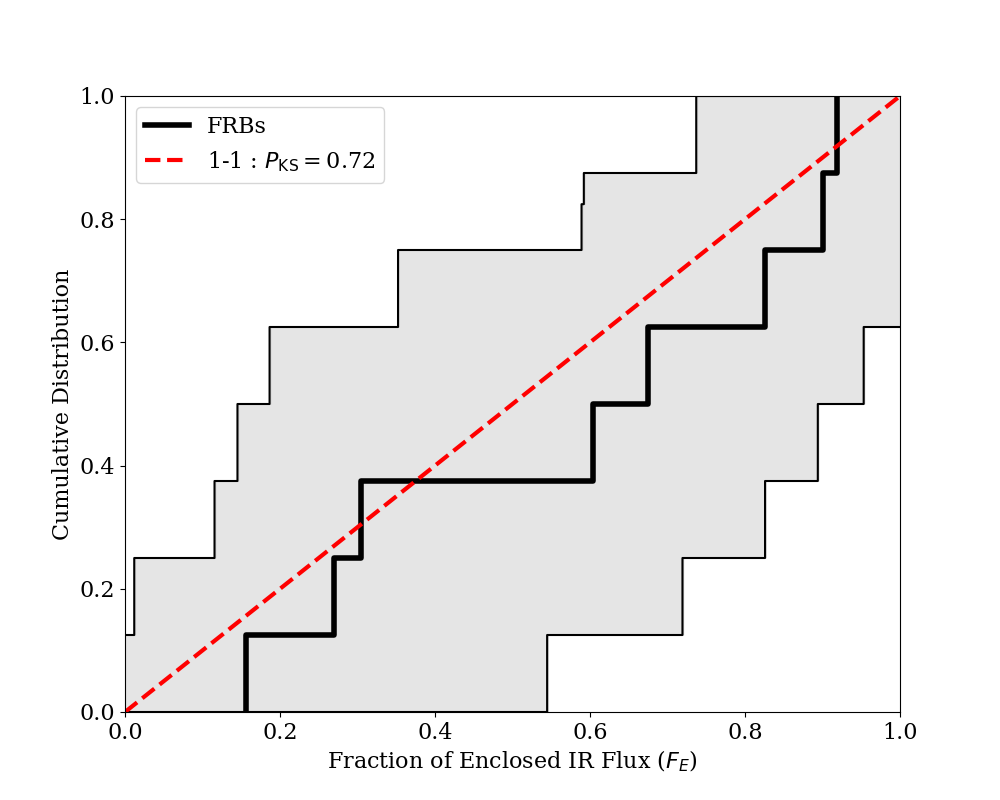
Figure 5 shows the CDF for the sample of eight HST hosts from the IR images (corresponding to rest-frame optical; right panel), and four hosts from the UV images (left panel). The gray region was generated in the same manner described in Section 3.2. We exclude the UV imaging of FRBs 180924 and 190711 from this analysis because they are effectively non-detections with very large error, while we include the imaging for FRB 180916 as a proxy for star formation (Tendulkar et al., 2020). Given that the UV and IR imaging can be used as proxies for star formation and stellar mass, respectively, we keep the two wavelength regimes separated. In this method, the 1:1 dashed line represents a population of events which traces the light of its host galaxy in that band. Adherence to the 1:1 line would indicate that FRBs may trace the distribution of star-forming regions and stellar mass of their galaxies, respectively.
For the IR (rest-frame optical) distribution which can be used as a proxy for stellar mass, the values span a wide range, , where the lower and upper bounds are set by FRB 190714 and FRB 121102, respectively (Table 3). The median of the distribution is 0.33 with a interval of [0.20, 0.53].
Figure 5 highlights that the median distribution of FRBs overall traces the fainter rest-frame optical regions of their host galaxies, with a location to the left/above of the 1:1 line. However, the relatively large positional uncertainties which extend to , coupled with the small sample size of eight events leads to a non-trivial uncertainty in the distribution, which is consistent with the 1:1 line. Thus, while FRBs appear to trace the fainter regions of their hosts in terms of stellar mass, at present it is not possible to make a strong statistical statement.
For comparison, we draw measurements from the literature for SGRBs (Fong et al., 2010; Fong & Berger, 2013), LGRBs (Blanchard et al., 2016), SLSNe (Lunnan et al., 2015), CCSNe (Svensson et al., 2010), and Type Ia SNe (Wang et al., 2013) and divide them into rest-frame UV and optical measurements for direct comparisons. Performing two-sided KS tests with respect to the median FRB distribution, we can rule out the null hypothesis that the LGRBs, SGRBs and FRBs are from the same underlying population as they all yield -values of . For CCSNe, Type Ia SNe, and the 1:1 distribution, we find and cannot rule out the null hypothesis.
For the UV distribution, which can be used as a proxy for the distribution of current star formation, there are six data points and their median values fall in a fairly narrow range of (for FRB 191001) to (for FRB 121102). Despite the small sample size, the KS test does reject the null hypothesis that both LGRBs and SLSNe and the median FRB distribution come from the same underlying population with . However, we caution that the very small sample size coupled with large localization uncertainties (which translate to large measurement uncertainties in ) effectively means that almost the entire parameter space of is included in the uncertainty region. We also note that the IR contains all three repeating FRBs, whereas the UV contains two.
3.4 Fraction of enclosed light
While the metric is designed to assess the local environment of the FRB in the galaxy independent of its morphology, we introduce an alternative metric to better assess its global position: the fractional flux enclosed
| (3) |
with the radius of pixel i and the distance of the FRB from the galaxy centroid. In practice, we estimate using the isophotal analysis of Section 4.1. Specifically, we find the isophote closest to the FRB localization and measure the flux enclosed within it (and all interior isophotes). Furthermore, we allow for the FRB localization error by performing a weighted average of individual evaluations across the FRB localization.
Figure 6 shows the results derived from the WFC3/IR images and a 1:1 line corresponding to the null hypothesis that FRBs are biased in tracking the host’s light. The close correspondence between the two lends credence to the null hypothesis and the resultant value offers statistical support. Similar to Safarzadeh et al. (2020), we infer that FRBs track the general distribution of light and, by inference, stellar mass in their host galaxies.
4 Morphological & FRB Site Properties
| FRB | Filter | Host Magnitude | |||
|---|---|---|---|---|---|
| (AB mag) | (mag) | (Jy arcsec-2) | ( | ||
| 180924 | F300X | 23.478 0.058 | 0.12 | 0.85 | 0.006 |
| 190102 | F300X | 27.200 | 1.40 | 2.58 | 0.016 |
| 190608 | F300X | 19.765 0.014 | 0.30 | 1.73 0.033 | 0.007 0.001 |
| 190711 | F300X | 25.008 0.121 | 0.88 | 1.61 | 0.016 |
| 190714 | F300X | 23.072 0.053 | 0.39 | 1.12 | 0.006 |
| 191001 | F300X | 21.228 0.020 | 0.18 | 0.88 | 0.005 |
Note. — Magnitudes are not corrected for Galactic extinction in the direction of the FRB (). Limits correspond to confidence.
| FRB | Filter | (Isophotal) | (GALFIT) | Host Magnitude | Limit | |||
|---|---|---|---|---|---|---|---|---|
| (kpc) | (kpc) | (AB mag) | (AB mag) | (mag) | (Jy arcsec-2) | ( | ||
| 121102 | F160W | 0.99 0.07 | 2.05 0.11 | 23.435 0.055 | 27.4 | 0.40 | 14.57 0.20 | 0.130 0.002 |
| 180916 | F110W | 2.52 0.15 | 6.00 0.01 | 16.178 0.005 | 25.4 | 0.88 | 31.00 0.10 | 0.115 0.000 |
| 180924 | F160W | 2.54 0.41 | 2.82 0.53 | 19.349 0.002 | 26.2 | 0.01 | 20.69 0.10 | 0.810 0.010 |
| 190102 | F160W | 4.87 0.34 | 5.00 0.15 | 20.550 0.006 | 27.1 | 0.11 | 11.10 0.11 | 0.093 0.002 |
| 190608 | F160W | 2.65 0.53 | 7.37 0.06 | 16.693 0.001 | 25.2 | 0.02 | 17.80 0.10 | 0.340 0.001 |
| 190711 | F160W | 2.88 0.32 | 2.48 0.13 | 22.899 0.014 | 27.6 | 0.07 | 6.17 0.11 | 0.045 0.004 |
| 190714 | F160W | 4.07 0.35 | 3.85 0.03 | 18.896 0.002 | 25.9 | 0.03 | 18.00 0.10 | 1.752 0.018 |
| 191001 | F160W | 6.05 0.66 | 6.23 0.04 | 17.135 0.001 | 24.8 | 0.01 | 7.99 0.10 | 0.322 0.007 |
Note. — Magnitudes are not corrected for Galactic extinction in the direction of the FRB (). Limits correspond to confidence.
4.1 Galaxy Light Profile Fitting
We fit the light profile for the eight FRB hosts with HST data to determine the half-light radii (), which are used to compute the host-normalized offsets. The half-light radii from HST imaging are valuable in comparison to previous ground-based imaging, where the measurements are based on seeing-limited images, allowing for more accurate estimates. The increased sensitivity of HST also presents the opportunity to search for alternate, fainter host galaxy candidates. Thus, in what follows, we also use light profile fitting to develop a galaxy model, and subtract it from the images to determine constraints on possible alternative, host galaxy candidates (e.g., low-luminosity galaxies or background galaxies) at the position of each FRB.
First, we use the elliptical isophotal model from photutils.isophote to map the light of the eight FRB hosts. We begin with an initial guess, providing values for the central position, ellipticity, semi-major axis, and position angle. The function then fits a series of isophotes which we then use to create a model and residual image. We determine the value of from our isophotal fits, taking this to be the semi-major axis in which half of the total light is enclosed. These values are listed in Tables 4-5, and are used in our calculation of the host-normalized offsets (see Section 3.2).
In addition to the isophotal fits, we also compute residuals from Sérsic profile fits using GALFIT v.3 (Peng et al., 2010) for the IR images. Our model has two Sérsic components for all galaxies except the hosts of FRBs 180924 and 190711. These two components roughly correspond to a central bulge and an outer disk. In the case of FRB 180924, we use a single Sérsic component because there is no obvious improvement in the residuals relative to performing a multi-component fit. In the case of the host galaxy of FRB 180924, the two components converged to the same effective radii, similar Sérsic indices and similar magnitudes, implying that GALFIT could not distinctly identify separate core and disk components. For FRB 190711, the relatively low signal-to-noise of the host galaxy image precludes the identification of two distinct components.
The residual images from the fits are shown in Figure 7. The GALFIT half-light radii () reported in Table 5 correspond to the larger component (i.e. the disk component) in the case of the two-component fits. While the residual images of FRBs 121102, 190711 and 190102 do not show clear, symmetric structures, there are such morphological structures in the residual images of the remaining hosts. In particular, spiral arm structure becomes very apparent for FRB 180924 and 190714, as well as the previously-known structure for FRBs 180916 (Tendulkar et al., 2020), 190608 (Chittidi et al., 2020) and 191001 (Bhandari et al., 2020b). Therefore we can see in Figure 7 that all of the FRBs which are localized to hosts with spiral structure land on or very near to a spiral arm; this point is discussed further in Section 5.
4.2 Star Formation Rate and Stellar Mass Constraints
In addition to relative photometric measures, these data enable precise photometric measurements at the burst positions. Furthermore, we may convert these light measurements into physical quantities – the star-formation rate (SFR) density and stellar mass surface density - to give additional insight into the local properties of FRB burst sites. It is also informative to compare the local values to the global mean surface densities of their host galaxies, to understand if the locations of FRBs are, for example, elevated or not in terms of these quantities.
To complete the photometric measurements, we create apertures with = 3 pixels at each pixel within the FRB localization. These aperture sums are then weighted by a 2-D Gaussian probability distribution centered on the measured FRB position, the same as that used for the offset and fractional flux determinations in Sections 3.2-3.3 – with the resolution of the grid being limited by the image pixel scale. We then take the weighted average and divide by the area of the aperture to get an aperture sum per arcsec2. We compute the magnitude using WFC3 tabulated zeropoints, the corresponding flux in both filters, and the luminosity for the UV band (Table 4).
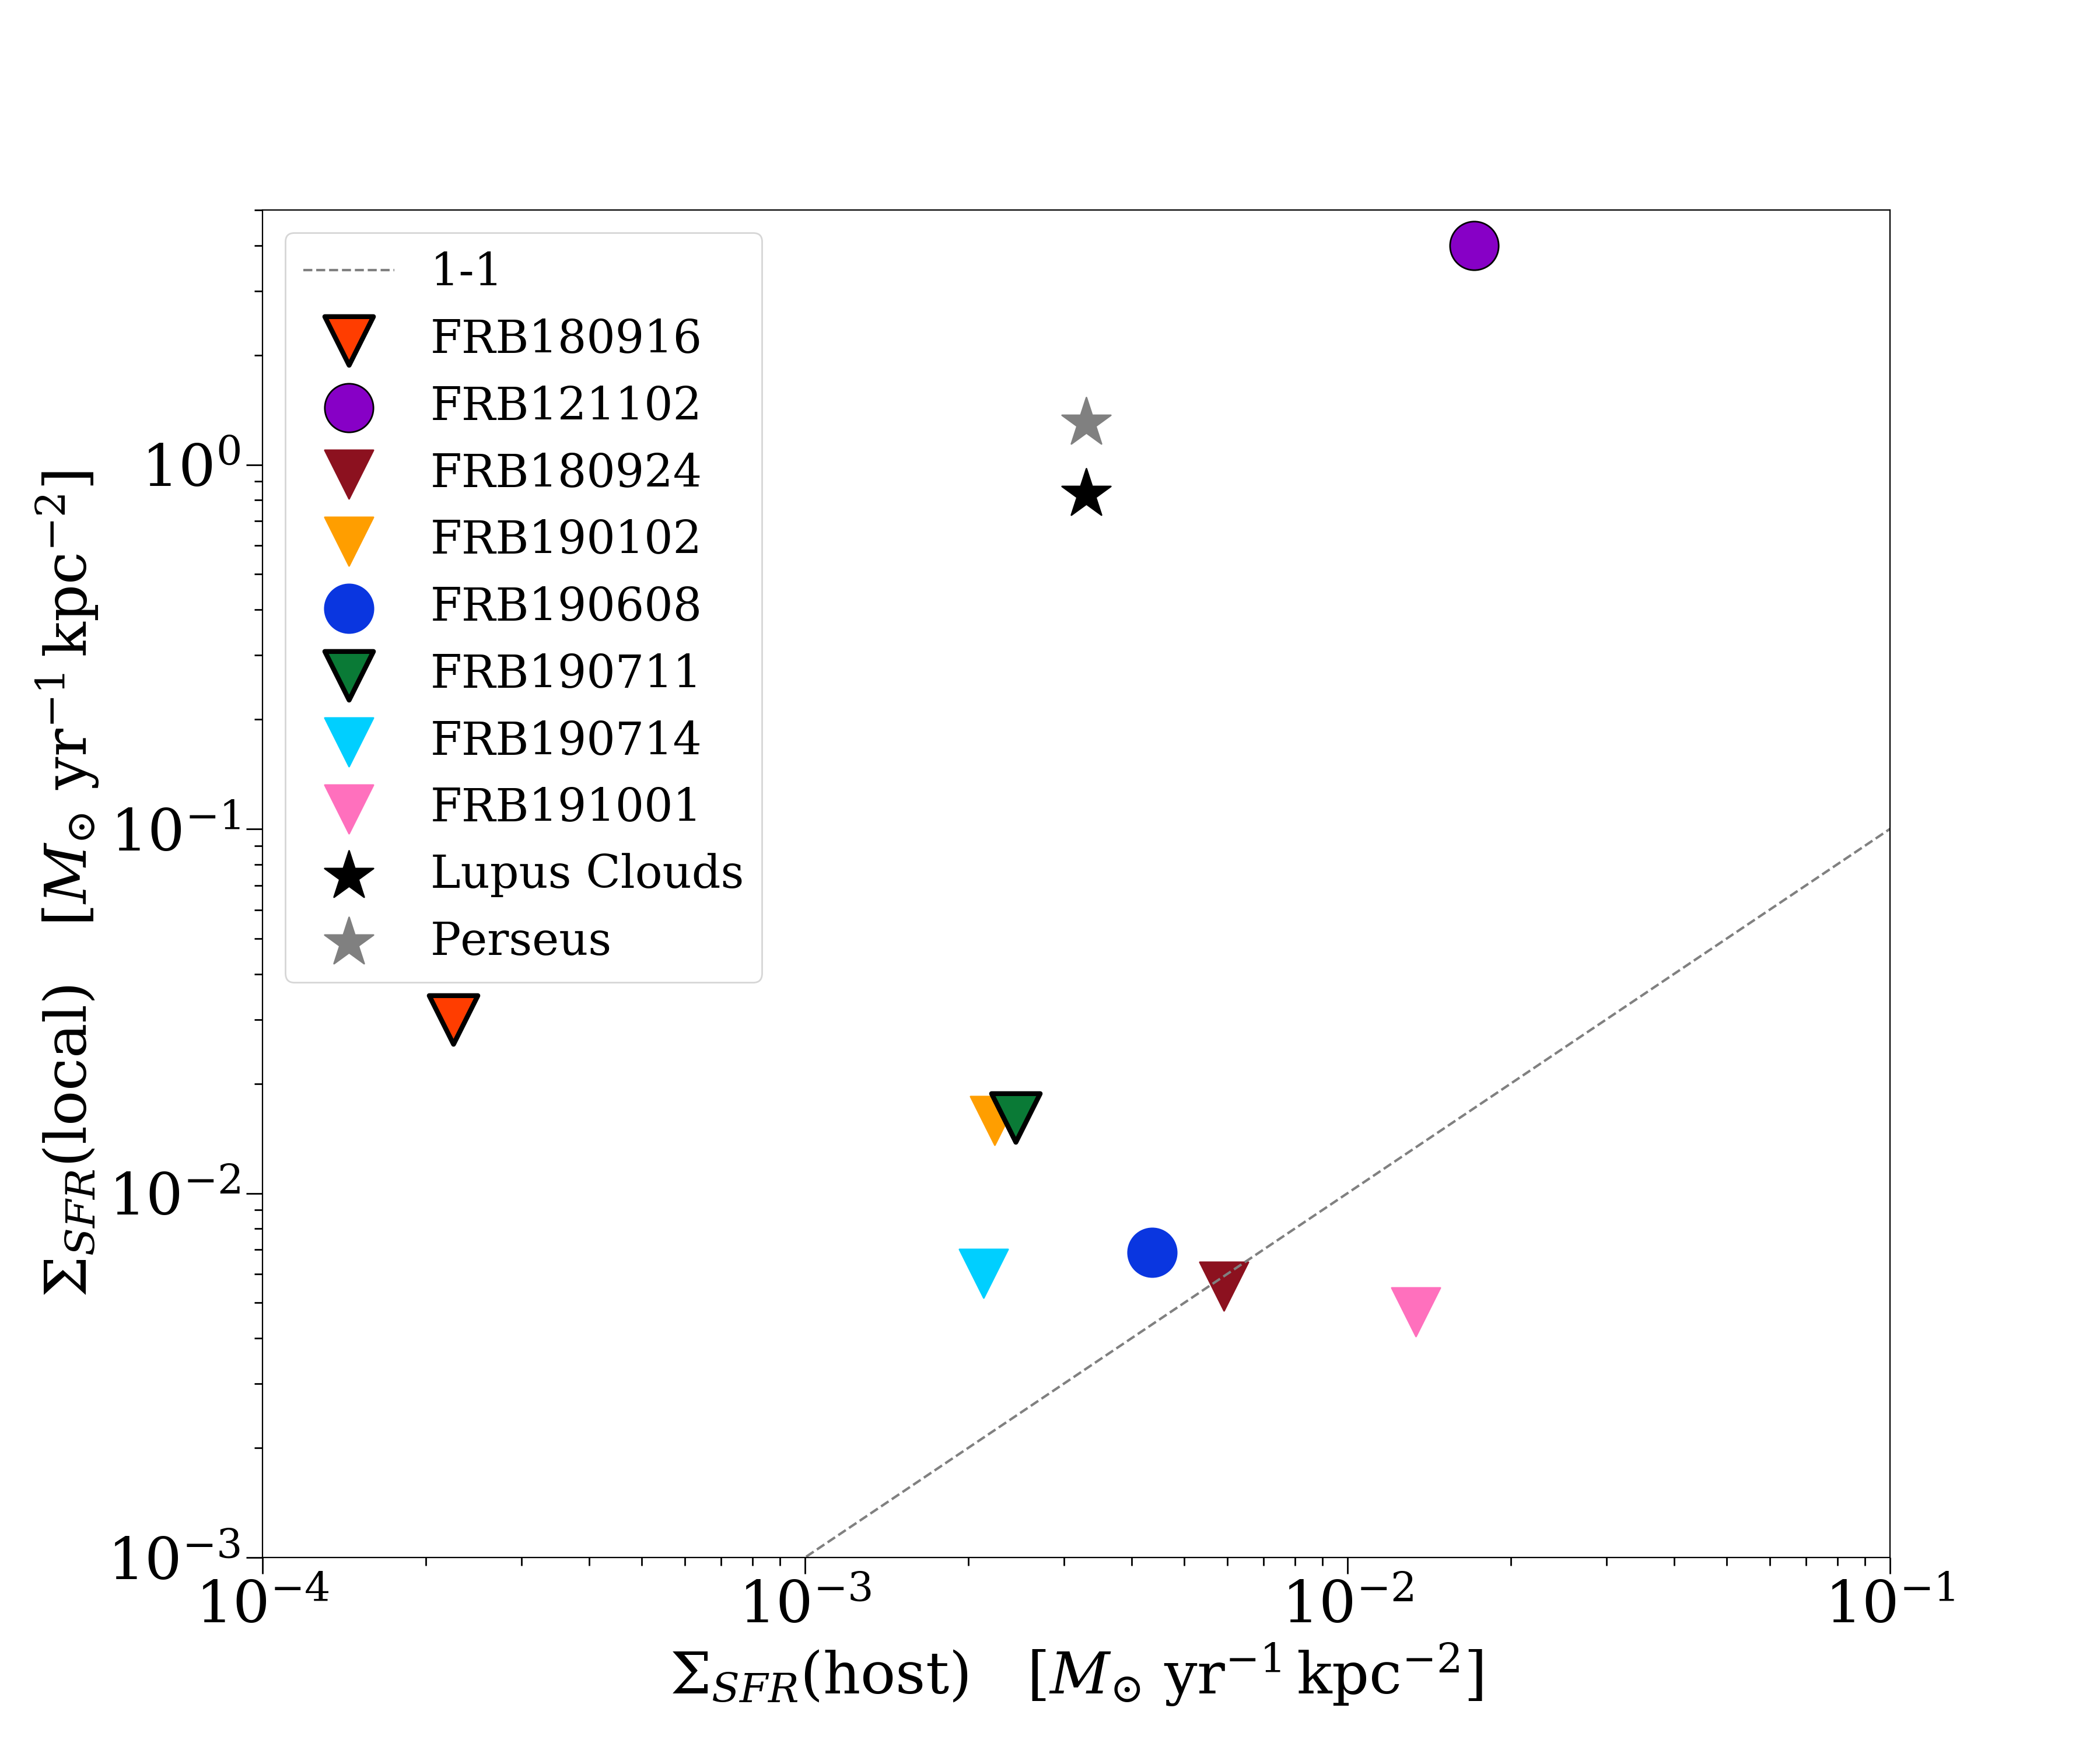
Next, we use the UV luminosity-SFR relation from Kennicutt (1998a) to convert UV measures into star formation rate and subsequently the star formation rate surface density per kpc2, at the burst site in 6 of the HST hosts. For FRB 121102, we use the H-alpha luminosity-SFR relation from Kennicutt (1998b), to obtain a value of 3.99 M⊙ yr-1 kpc-2. For the stellar mass surface density per kpc2, we compute the ratio of FRB flux to total host flux and adopt the total stellar mass estimates from Heintz et al. (2020) to estimate the local value. We derive upper limits on star formation rate densities in the same manner, relevant for hosts that are non-detections or have very low S/N at the FRB site.
In terms of Figure 8 shows that most FRBs do not obviously occur in elevated regions of star formation with respect to the global values of their host galaxies (albeit most of the UV values are upper limits). The two FRBs with measurements in our sample, FRBs 121102 and 190608 lie above the 1:1 line, in concert with previous conclusions (Bassa et al., 2017; Chittidi et al., 2020). We do however find that FRB 191001 lies below this 1:1 line. This burst also has the highest offset and, as is apparent in the UV image, is offset from the UV-bright regions of its host.
For context, Galactic star-forming clouds such as the Lupus and Perseus clouds (Evans et al., 2009) are shown to be well above the 1:1 line in comparison to the Milky Way average as reported in Kennicutt & Evans (2012). The FRB locations, except that of FRB 121102, do not reach these levels of elevated star-formation.
One caveat is that the Galactic star forming clouds and their measurements are derived from pc-scale measurements as opposed to the kpc scales for FRB localizations. Ideally, we would like resolve down to scales that are considered “local” in studies of star formation in the Milky Way. This will require additional mas-level localizations and larger aperture space or ground-based observations (e.g. JWST, ALMA).
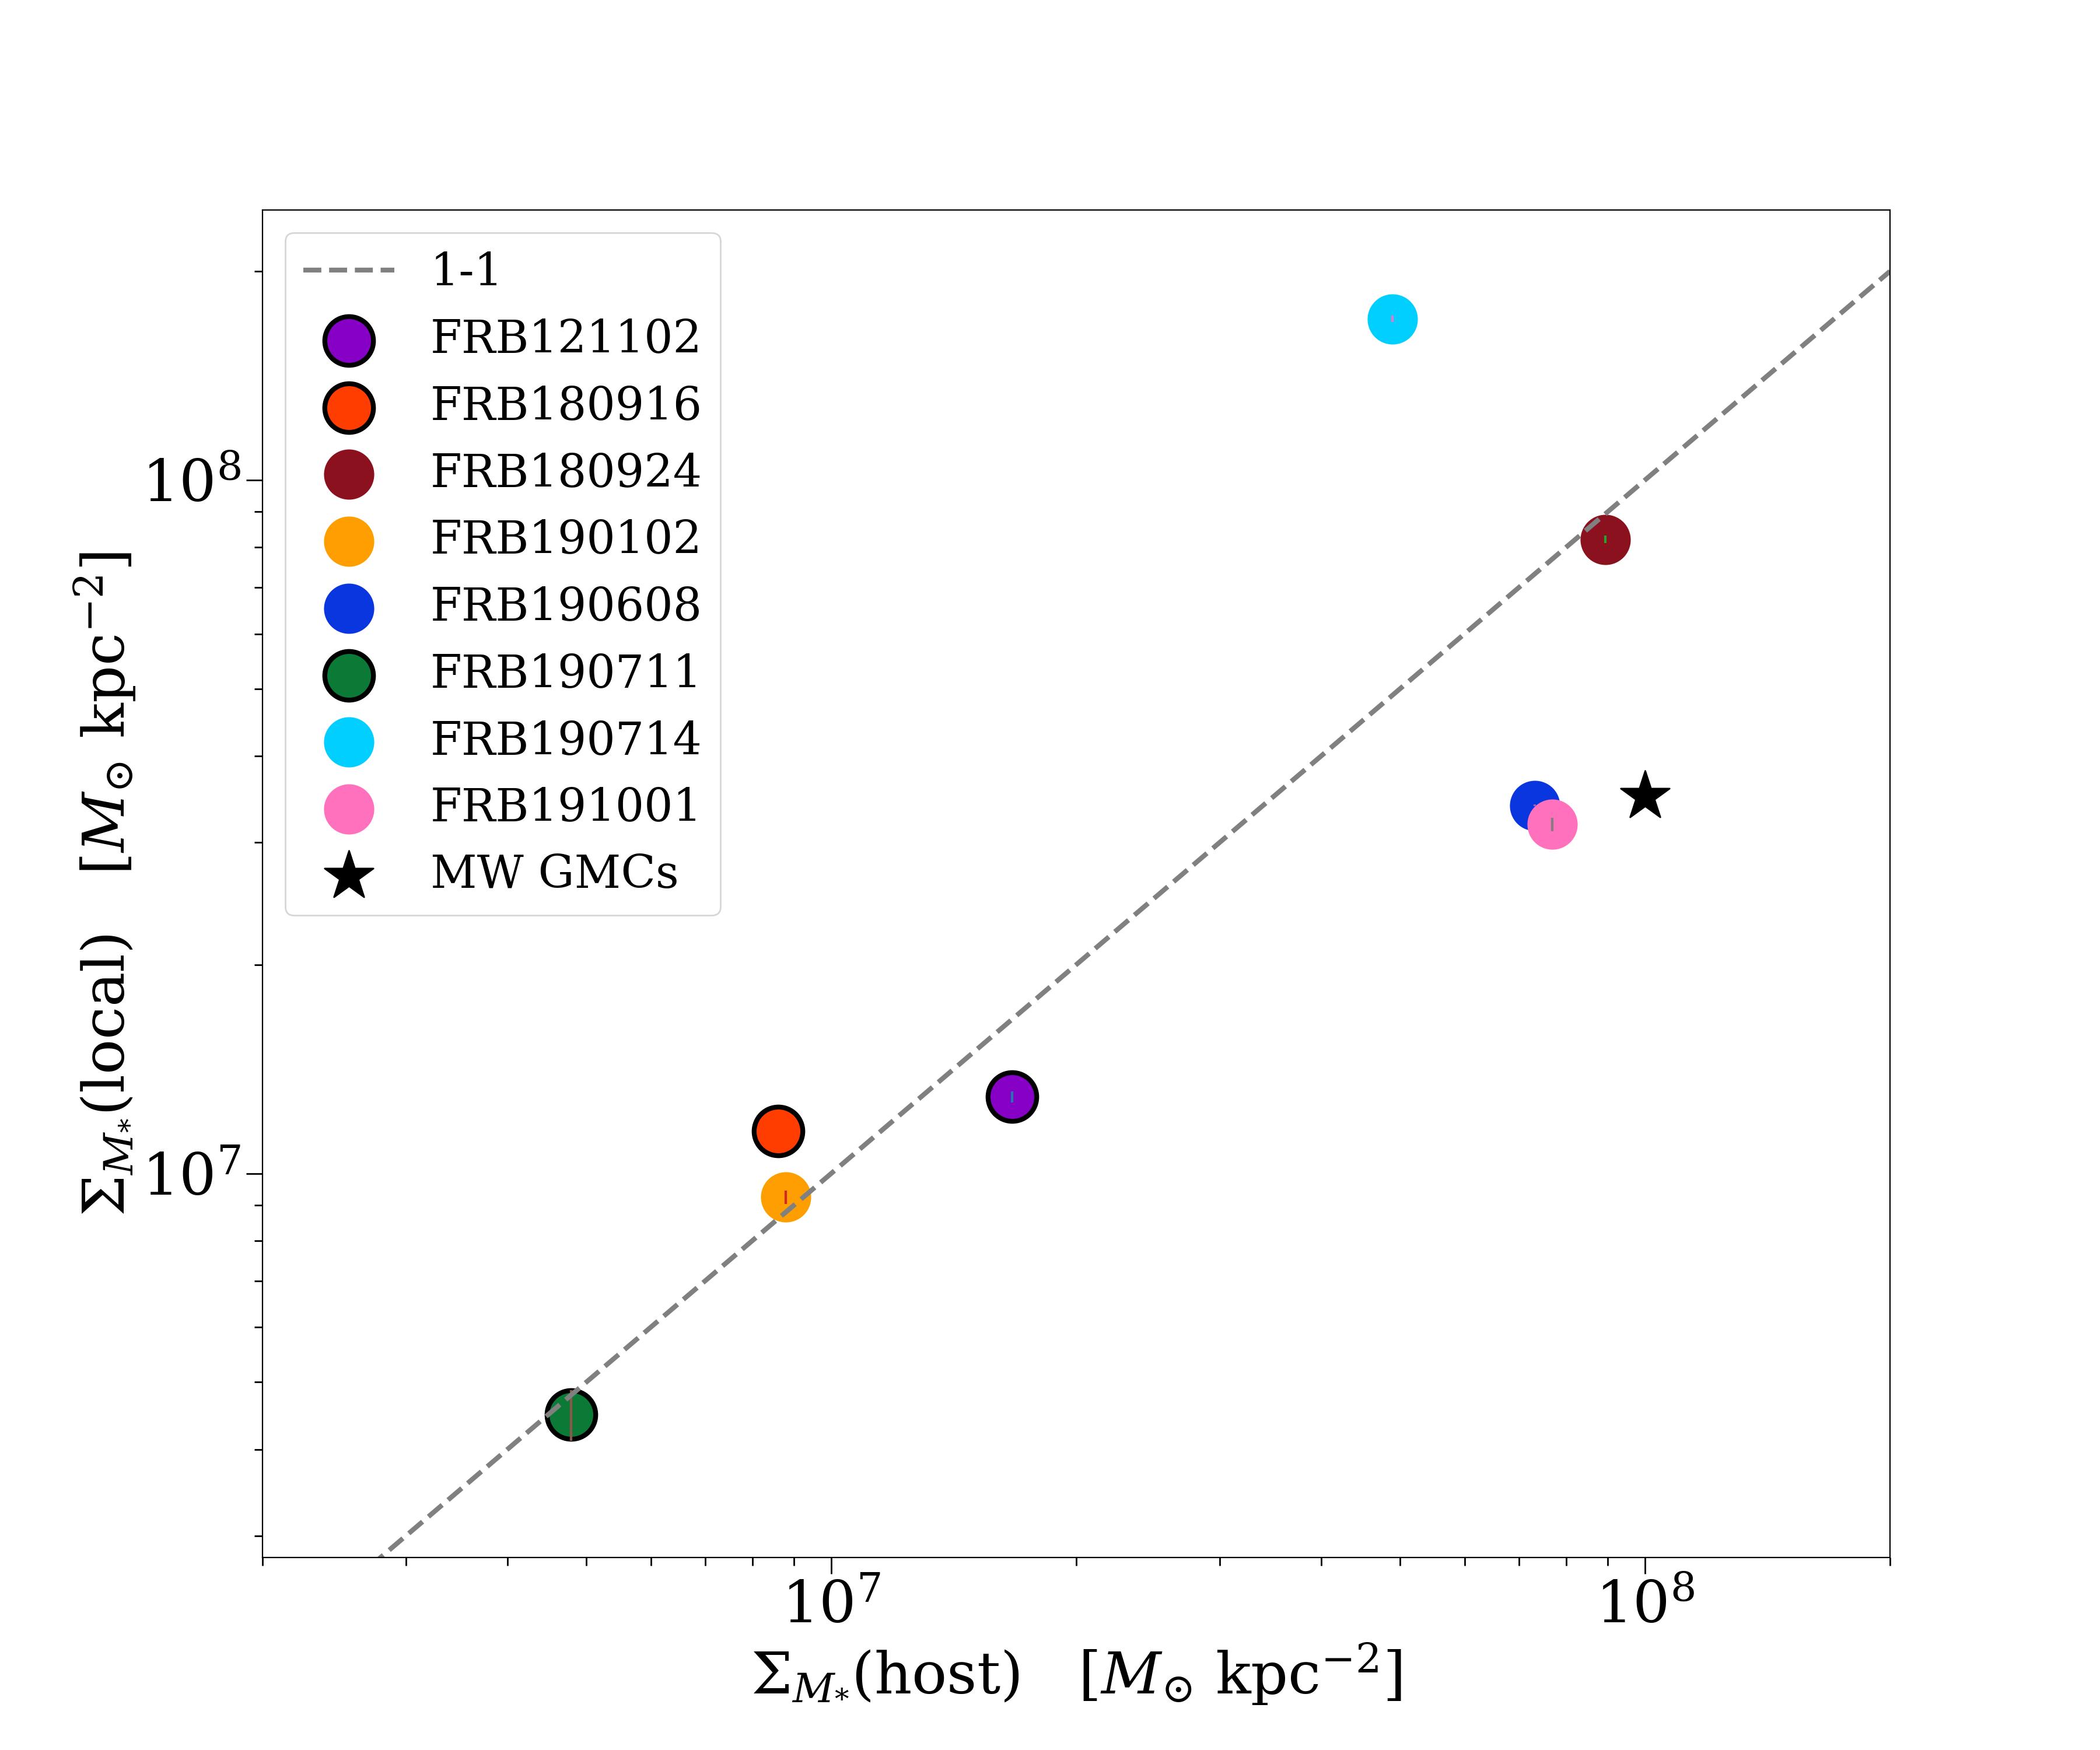
In terms of stellar mass surface density Figure 8 reinforces several of the conclusions from Heintz et al. (2020). For example, a continuum of characteristics between “repeaters” and “non-repeaters” arises when investigating the stellar mass of the host and the burst site. Like the SFR density, FRBs also do not clearly occur in regions of elevated stellar mass surface densities with respect to the global values of their hosts, and only a few FRBs deviate from the 1:1 relation. We use Milky Way Giant Molecular Clouds (GMCs; Lada & Dame 2020) as a point of comparison to put into context the characteristics of these burst sites with other sites of star-formation. The stellar mass surface density for these sites relative to their hosts is slightly above, but are not very disparate from that shown for the Galactic GMCs which are parsec-2 as concluded in Lada & Dame (2020).
4.3 Luminosity Constraints on Satellite or Background Galaxies
With the early association of FRB 121102 to a very faint host, the community was led to expect that other FRBs would be found in galaxies of similar type. The subsequent association of FRBs to brighter galaxies (e.g. Bannister et al., 2019) has therefore led some to question whether a fainter, true host galaxy lurks below. To place constraints on an alternate, apparently fainter host galaxy candidate at the FRB position, we use the GALFIT residual images (Figure 7), in which the elliptical components from the bright, putative host galaxy have been removed to derive point-source limiting magnitudes at the FRB position. We then compute the residual flux value using a circular aperture of diameter, corresponding to times the PSF FWHM. We compute the net standard deviation for all pixels within this aperture. We then take the larger of the flux measurement and five times the net standard deviation as the upper limit on any point source flux that can be detected from the residual images ( limit). We find limits of AB mag (see Table 5).
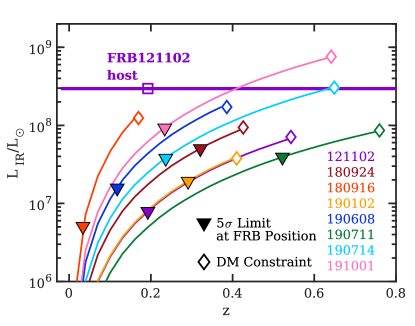
We convert each of the at-position limits to an IR luminosity as a function of redshift (Figure 9). First, we explore these limits in the context of a spatially coincident satellite galaxy at the same redshift as the putative (brighter) host galaxy (triangles in Figure 9). At these redshifts, the limits of , are significantly deeper than the luminosity of any known FRB host, including FRB 121102. This means that despite the presence of morphological features in the GALFIT residuals which preclude extremely deep limits, we can still rule out a galaxy with similar luminosity to the host of FRB 121102, which is now considered an outlier in terms of FRB host stellar mass and luminosity (Tendulkar et al., 2017; Li et al., 2019; Bhandari et al., 2020a; Heintz et al., 2020). Any underlying host would need to have an IR luminosity of times that of the host of FRB 121102 if it was at the same redshift of the brighter host galaxy (Figure 9). For reference, we measure IR luminosities for the putative hosts of (set by FRB 121102 and FRB 191001, respectively).
It is also worthwhile to explore whether or not a low-luminosity host galaxy of the same luminosity as the host of FRB 121102 may reside at a higher redshift than the apparently brighter galaxy. In this case, we find that the redshift of any background galaxy must be at (Figure 9). The exception is FRB 180916, which still has a meaningful constraint of . We also calculate the upper limit on the redshift inferred from the Macquart relation for each FRB following the methods of Macquart et al. (2020), and assuming a Milky Way DM = 50 pc cm-3 and a host DM = pc cm-3. This analysis results in limits of (95% confidence). These redshift limits provide an absolute upper bound on the allowed luminosity of an underlying host of . In all cases except for FRBs 190714 and 191001, we can thus rule out an underlying background galaxy of similar luminosity to the host of FRB 121102. We note that raising the required luminosity of the host galaxy would only push the required redshift to a higher range. We therefore find that the presence of background galaxies at higher redshifts are not likely for these FRBs given the HST limits and constraints from the measured DMs of the FRBs.
5 Discussion
Here we discuss the locations, luminosity limits, and morphological features revealed by HST imaging in the context of other transient populations with known progenitors, and implications for FRB progenitors.
5.1 The Locations of FRBs with Respect to their Host Galaxies
The high angular resolution of the HST imaging enables the determination of effective radii and the precise locations for FRB events with respect to their host galaxies using a variety of measures. In general, locations have been used in a variety of transient studies as a major diagnostic to uncovering their progenitors (Prieto et al., 2008; Fong et al., 2010; Fong & Berger, 2013; Blanchard et al., 2016; Lunnan et al., 2017; De et al., 2020; Audcent-Ross et al., 2020; Schulze et al., 2020), as well as the relation to the distribution of young stars (UV, H light) and stellar mass (IR light) in their host galaxies. As a means to deciphering the origins of FRBs, we consider comparison data sets from transients which span a wide range of progenitor systems, from those which originate from massive stars in which the populations follow the UV light and exponential disk profiles of their hosts (LGRBs, CCSNe, SLSNe; Fruchter et al. 2006; Lunnan et al. 2015); to those with older stellar progenitors associated with compact objects which are weakly correlated with the UV light of their hosts (SGRBs, Type Ia SNe; Fong & Berger 2013; Wang et al. 2013; Audcent-Ross et al. 2020); to those with unknown progenitors and larger offsets from their hosts (Ca-rich transients555These are also referred to as Ca-strong transients or CASTs; Shen et al. (2019)).
Comparative studies based on ground-based observations of FRBs have found that the spatial distribution of FRBs are inconsistent with the distribution of LGRBs and SLSNe, both of which originate from stripped-envelope massive stars (Fruchter et al., 2006; Lunnan et al., 2015), but are consistent with other transient types (Bhandari et al., 2020a; Heintz et al., 2020; Bochenek et al., 2020). Our results support these studies, where we find that the locations of FRBs as a population are clearly more extended than LGRBs and SLSNe in terms of physical offsets, with a median of 3.2 kpc (68% interval of [2.0, 8.7] kpc). However, the host galaxies of FRBs are on average larger in physical size (and also stellar mass; c.f., Bhandari et al. 2020a; Heintz et al. 2020) than the hosts of LGRBs and SLSNe (Blanchard et al., 2016; Lunnan et al., 2015), with a range of sizes, kpc. Due to the larger FRB host galaxy sizes among the transient populations, the differences in offsets becomes less significant when normalized by the size of their host galaxies: the host-normalized offsets of FRBs has a median of 1.4 (68% interval of [0.6, 2.1]), and are only statistically distinct from Ca-rich transients. Finally, FRBs appear to occur at slightly larger host-normalized offsets than expected given an exponential disk profile.
In terms of their host galaxy rest-frame optical and NIR light distributions, the FRBs are on moderately fainter regions of their host galaxies (median =0.33). These distributions serve as proxies for the distribution of stellar mass in their galaxies, and older, moderately massive to low-mass stars, respectively. As a population, FRBs are once again statistically distinct from LGRBs and SLSNe which on average occur on the brighter regions of their host galaxies (Fruchter et al., 2006; Blanchard et al., 2016). The locations of FRBs are also distinct from SGRBs which are very weakly correlated with stellar mass, a consequence of their compact object progenitors which experience kicks and moderate delay times (Fong et al., 2010; Fong & Berger, 2013). Notably, unlike SGRBs, no FRBs in our sample occur on the faintest regions of their host galaxies (tempered by the FRB localization errors and the small sample).
The locations of FRBs are consistent with the radial distribution of their host rest-frame optical light (fraction of enclosed light), and are indistinguishable from the locations of CCSNe in this regard (c.f., Audcent-Ross et al. 2020). Indeed, the fact that the locations of FRBs trace the 1:1 distribution of the radial distribution of their host light, coupled with the fact that their local stellar mass surface densities are representative of their global host galaxy values, is indicative that their locations are consistent with the stellar mass within their host galaxies. We further find that while two FRBs have elevated local star formation rate densities compared to their global host values, as a population we do not find any clear correlation between FRBs and regions of elevated local star formation rate densities.
In general, the host galaxies of known repeating FRBs tend to have bluer colors, lower stellar masses, and higher star forming rates than those of apparent non-repeating FRBs (Bhandari et al., 2020a; Heintz et al., 2020). This is most saliently highlighted in the star-forming low-mass host galaxy of the repeating FRB 121102 (Chatterjee et al., 2017), which is an outlier in most host galaxy properties. Here, we find that, in terms of the IR distributions, the three known repeaters in this sample (FRBs 121102, 180916 and 190711) span the full range of offsets (physical and host-normalized) populated by apparent non-repeaters, as well as fractional flux and enclosed flux. While there do not appear to be any obvious trends in these properties between known repeaters and apparent non-repeaters, we caution that the sample sizes considered here are small.
Overall, the locations of FRBs support the picture that if there is one dominant progenitor population, that they do not originate from massive stars which are stripped of H and/or He (the progenitors of engine-driven SNe such as LGRBs and H-poor SLSNe). We further find that their locations are inconsistent with compact object progenitors which experienced kicks or long delay times transients from significantly older stellar progenitors (SGRBs, Ca-rich transients). However, given the size of the current sample, it is still possible that a fraction of FRBs originate from one of these alternative progenitor channels. These conclusions overall support previous results based on host stellar population properties that LGRB/SLSNe progenitors are not significant contributors (Heintz et al., 2020; Li et al., 2019; Bhandari et al., 2020a; Bochenek et al., 2020). Furthermore, we cannot differentiate the population of FRBs from CCSNe or Type Ia SNe based on their locations, although FRBs do not clearly trace either of these populations in every measured quantity. Therefore, we find it less plausible that the main progenitor channel of FRBs are compact object progenitors such as neutron star mergers or neutron star-black hole mergers, although progenitors which invoke white dwarfs (e.g., accretion-induced collapse of a WD to a NS), which are expected to resemble the properties of Type Ia SNe (Margalit et al., 2019) could still play a role.
It should be noted, however, that there may be selection effects at play in the observed locations of FRBs. For example, FRBs in dense regions of galaxies such as near the center or inside a spiral arm may be more difficult to detect. As they interact with a denser medium like a star-forming region, the signal is dispersed by the local environment and the DM could exceed the limit of detection (James et al., 2021), i.e. high DM smears the signal leading to a lower S/N. The majority of FRBs presented here were derived from the CRAFT experiment on the ASKAP telescope. That survey has performed searches allowing for bursts with DM pc cm-3 and have detected several to date (Shannon et al., 2018). Furthermore, the smaller sample of well-localized events, including those presented here, follow the predicted Macquart relation (Macquart et al., 2020). These searches have not detected any bursts with DM greatly in excess of the Macquart relation, and models of the intrinsic host DM distribution indicate a median value of pc cm-3 (Macquart et al., 2020; James et al., 2021). Therefore, current expectation is that there is not a large sample bursts with high host-DM missing from the sample. However, this is an important effect to consider given the constraints locations provide for progenitor channels and, analysis of future samples will need to consider further the implications of DM smearing.
It also is possible that scattering will be induced by local material increasing the width of the burst so that it is too faint to be detected or cause it to be falsely rejected by search algorithms. However, the scattering measure is also known to vary considerably, and this variation does not seem to correlate with DM (Qiu et al., 2020). Therefore, we currently consider this a less important bias relative to DM smearing.
5.2 The Association of FRB Locations with Spiral Arm Structure
In addition to precise location information, the deep HST imaging presented here also enhances low surface brightness features and morphological structure. In particular, previous HST studies of two galaxies, those of FRBs 190608 and 180916, demonstrate that they both exhibit complex spiral arm structure (Chittidi et al., 2020; Tendulkar et al., 2020). Spiral structure was also apparent in ground-based imaging for the host galaxy of FRB 191001, and supported by extended, continuum radio emission indicative of star formation (Bhandari et al., 2020b). Here, we find an additional two FRB hosts with clear spiral arm structure; those of FRBs 180924 and 190714 (Figure 7), and further uncover a bar feature in the host galaxy of FRB 180924. With the exception of FRB 180916, all FRB spiral-arm hosts are associated with apparent non-repeaters. The two remaining known repeaters in the sample are FRBs 121102 and 190711; the former originates from a low-luminosity host, while the latter originates in a host at the high redshift end of our sample. Thus we do not consider the non-detection of spiral features from these hosts to be constraining or informative.
Overall the prevalence of clear spiral structure (5/8, or in our sample) is consistent with the observed galaxy population (Willett et al., 2013). Furthermore, despite the larger offsets of FRBs, we find that the locations of all well-localized FRBs with hosts that exhibit spiral structure are consistent with major spiral arm features. It is important to note that the IR light profile is dominated by red supergiants, AGB stars, and low-mass stars, as opposed to young, massive O- and B-stars seen in H and UV imaging. In particular, in accordance with the density wave theory of spiral structure, the IR spiral arms generally spatially lag the H light (Pour-Imani et al., 2016), although significant enhancement in star formation in the vicinity of the IR spiral arms is expected (Seigar & James, 2002). The signal-to-noise of the FRB UV images prevent such a constraint for FRB hosts.
The locations of transients with respect to spiral arm features, as well as offsets from regions of peak brightness within the spiral arms, can serve as a major clue for their progenitors. In particular, the offset from bright peaks serves as a proxy of the spatial drift from birth to explosion site, and can set a timescale for the lifetime of the progenitor. Indeed, SNe exhibit distributions of offsets from the peak of their spiral arms in accordance with their progenitor age, with stripped-envelope SNe (Type Ib/c) having smaller offsets from the peak than Type II or Type Ia SNe (Aramyan et al., 2016). If all FRBs originated from young magnetars, it is expected that their positions would generally correlate with the UV spiral arms of their hosts, and at small offsets from star-forming features (c.f., the distribution of Galactic magnetars; Olausen & Kaspi 2014). However, we find that while the FRB positions are consistent with spiral features, they are not on the brightest part of the spiral arms. Indeed, UV and H studies of the known repeating FRBs 121102 and 180916 found clear offsets from the closest star-forming features of pc (Bassa et al., 2017; Tendulkar et al., 2020). This is also in agreement with the results by Chittidi et al. (2020), who found from detailed analysis of the UV imaging of FRB 190608 that the FRB did not prefer the most active star-forming region in the galaxy.
Taken together, this supports a picture that FRBs do not originate from the youngest, most massive stars, in concert with previous, comparative results with other transients (Li et al., 2019; Heintz et al., 2020; Bhandari et al., 2020a). We also find that FRBs do not appear to reside in the inner bulges of their host galaxies, which are generally dominated by older, higher-metallicity stars in comparison to the spiral arms (Peletier & Balcells, 1996). It is further worth noting that the main selection effect at play in FRB discovery is the difficulty of detecting highly-scattered FRB signals, where the signal is temporally broadened by multipath propagation in a dense, turbulent medium. Since such sites are preferentially associated with star formation, one might naively expect there to be additional observational challenges in detecting FRBs in spiral arms where the chance of the FRB sightline intersecting an enhanced region of turbulence is higher. However, the precise effects of discovering FRBs with respect to morphological structure is not well-quantified.
5.3 Luminosity Limits on Alternative Host Candidates
Finally, we remark on the presence of fainter, alternative host galaxy candidates at the positions of the FRBs. This question is in part motivated by the low-luminosity host galaxy of FRB 121102 (Tendulkar et al., 2017), which, coupled with the remaining FRB hosts suggests a broad host galaxy luminosity function spanning the full range of galaxies (Heintz et al., 2020). Here we have explored the presence of both satellite galaxies at the same redshift as the putative host, and background galaxies at higher redshifts. The relatively low redshift range of the population examined here, , enables deep constraints even in the presence of strong morphological features. In both scenarios, we find it unlikely that the FRBs originated from an underlying galaxy. The exceptions are FRBs 190714 and 191001: in the former case, a galaxy of equal luminosity to FRB 121102 would approach the redshift limit, while in the latter case, the high DM allows a host with times the luminosity of FRB 121102, albeit still on the faint-end slope of the galaxy luminosity function ().
6 Summary & Conclusions
In this paper we used high-resolution HST imaging to perform a detailed study on the locations of 8 FRBs and their environments, 6 of which are newly presented here. We used these data to place constraints on the spatial distributions (physical and host-normalized), in support of previous works based on ground-based imaging. We find a median host-normalized offset of 1.4([0.6, 2.1]; 68% interval), and overall a distribution that lies between the more centrally concentrated LGRBs and SLSNe, and the extended SGRBs and Ca-rich transients. We also determine the distribution of FRBs with respect to their IR (rest-frame optical) host galaxy light (fractional flux, and radial distribution), showing that FRBs are consistent with tracing the stellar mass distribution of their host galaxies.
The sensitivity of HST additionally enables constraints on possible alternative host galaxy candidates; we find it improbable that there exists a satellite or background galaxy at the FRB locations, strengthening the associations with the brighter, putative hosts identified in ground-based imaging for this sample. We explore the FRB site properties in terms of star formation rate (near-UV) and stellar mass (IR) surface densities, finding that the locations are not particularly enhanced in either property compared to the global values of their hosts (although few measurements exist for the star formation rate densities). Finally, we find that 5/8 FRB host galaxies in the sample have spiral arm features, and that these FRBs are consistent with the locations of those spiral arms (albeit inconsistent with locations on the brightest peaks of these spiral arms). If there is a dominant progenitor population among this tested distribution, we thus do not find strong support for a connection to the most massive (stripped-envelope) stars, or events which require kicks and long delay times.
The promise of sub-arcsecond localized FRBs in solving the progenitor question is being realized, in part, with the first population studies of their local and host galaxy environments. Such precisely-localized FRBs are and will continue to be detected at growing rates. As the number of secure associations continues to increase, we will be able to make significant progress toward understanding their progenitors, as well as connecting the properties of FRBs to those of their host galaxies. The current sample of well-localized FRBs is admittedly small, much less those with high-resolution imaging. Moreover, the current sample with secure host galaxies is subject to various selection biases which have been mentioned throughout this paper.
Looking toward the future, upcoming FRB experiments and upgrades to existing ones will deliver larger, more uniform samples of sub-arcsecond localized FRBs, which importantly will push beyond the current DM or redshift horizons. Equipped with a large sample of FRBs with high-resolution imaging, we will be able to identify trends between the locations of FRBs in known repeaters and apparent non-repeaters, in host galaxies of different morphological types (e.g., prevalence of spiral sub-structure, star-forming vs. quiescent), and make more statistically significant statements about their similarities or differences to other transient populations. Matched to the increased sensitivities of discovery experiments, we will also explore evolution of the local properties of FRBs with redshift. All of these studies will provide important clues to their origins. Larger samples will also enable tighter constraints to be placed on local contributions to the dispersion measure in DM and IGM studies, optimizing the use of FRBs as a cosmological probe. Finally, HST and soon JWST will also aid in our understanding of whether FRBs originate from a single, dominant progenitor channel or multiple contributing channels, a central question in FRBs.
Acknowledgements
We acknowledge Nia Imara, Clancy W. James, and Ben Margalit for helpful discussions. A.G.M. acknowledges support by the National Science Foundation Graduate Research Fellowship under Grant No. 1842400. The Fast and Fortunate for FRB Follow-up team acknowledges support from NSF grants AST-1911140 and AST-1910471. W.F. acknowledges support by the National Science Foundation under grant Nos. AST-1814782 and AST-190935. N.T. acknowledges support by FONDECYT grant 11191217. C.K.D. acknowledges the support of the CSIRO Postgraduate Scholarship - Astronomy and Space (47417). A.T.D. is the recipient of an ARC Future Fellowship (FT150100415). This research is based on observations made with the NASA/ESA Hubble Space Telescope obtained from the Space Telescope Science Institute, which is operated by the Association of Universities for Research in Astronomy, Inc., under NASA contract NAS 5–26555. These observations are associated with programs #15878, 16080, 14890 and 16072. Support for Program numbers 15878 and 16080 were provided through a grant from the STScI under NASA contract NAS5- 26555.
References
- Aggarwal et al. (2021) Aggarwal, K., Budavari, T., Deller, A., et al. 2021, ApJ, submitted, xx
- Anderson (2016) Anderson, J. 2016, Supplemental Dither Patterns for WFC3/IR, Space Telescope WFC Instrument Science Report
- Anderson et al. (2012) Anderson, J., MacKenty, J., Baggett, S., & Noeske, K. 2012, The Efficacy of Post-Flashing for Mitigating CTE-Losses in WFC3/UVIS Images, Tech. rep., Baltimore, MD: STScI
- Aramyan et al. (2016) Aramyan, L. S., Hakobyan, A. A., Petrosian, A. R., et al. 2016, MNRAS, 459, 3130, doi: 10.1093/mnras/stw873
- Audcent-Ross et al. (2020) Audcent-Ross, F. M., Meurer, G. R., Audcent, J. R., et al. 2020, MNRAS, 492, 848, doi: 10.1093/mnras/stz3282
- Avila et al. (2015) Avila, R. J., Hack, W., Cara, M., et al. 2015, in Astronomical Society of the Pacific Conference Series, Vol. 495, Astronomical Data Analysis Software an Systems XXIV (ADASS XXIV), ed. A. R. Taylor & E. Rosolowsky, 281. https://arxiv.org/abs/1411.5605
- Bannister et al. (2019) Bannister, K. W., Deller, A. T., Phillips, C., et al. 2019, Science, 365, 565, doi: 10.1126/science.aaw5903
- Bassa et al. (2017) Bassa, C. G., Tendulkar, S. P., Adams, E. A. K., et al. 2017, ApJ, 843, L8, doi: 10.3847/2041-8213/aa7a0c
- Bertin & Arnouts (1996) Bertin, E., & Arnouts, S. 1996, A&AS, 117, 393
- Bhandari et al. (2020a) Bhandari, S., Sadler, E. M., Prochaska, J. X., et al. 2020a, ApJ, 895, L37, doi: 10.3847/2041-8213/ab672e
- Bhandari et al. (2020b) Bhandari, S., Bannister, K. W., Lenc, E., et al. 2020b, ApJ, 901, L20, doi: 10.3847/2041-8213/abb462
- Blanchard et al. (2016) Blanchard, P. K., Berger, E., & Fong, W.-f. 2016, ApJ, 817, 144, doi: 10.3847/0004-637X/817/2/144
- Bochenek et al. (2020) Bochenek, C. D., Ravi, V., Belov, K. V., et al. 2020, Nature, 587, 59, doi: 10.1038/s41586-020-2872-x
- Bradley et al. (2020) Bradley, L., Sipőcz, B., Robitaille, T., et al. 2020, astropy/photutils: 1.0.0, 1.0.0, Zenodo, doi: 10.5281/zenodo.4044744
- Chatterjee et al. (2017) Chatterjee, S., Law, C. J., Wharton, R. S., et al. 2017, Nature, 541, 58, doi: 10.1038/nature20797
- CHIME/FRB Collaboration et al. (2018) CHIME/FRB Collaboration, Amiri, M., Bandura, K., et al. 2018, ApJ, 863, 48, doi: 10.3847/1538-4357/aad188
- CHIME/FRB Collaboration et al. (2020) CHIME/FRB Collaboration, Andersen, B. C., Bandura, K. M., et al. 2020, Nature, 587, 54, doi: 10.1038/s41586-020-2863-y
- Chittidi et al. (2020) Chittidi, J. S., Simha, S., Mannings, A., et al. 2020, arXiv e-prints, arXiv:2005.13158. https://arxiv.org/abs/2005.13158
- Cordes & Chatterjee (2019) Cordes, J. M., & Chatterjee, S. 2019, ARA&A, 57, 417, doi: 10.1146/annurev-astro-091918-104501
- Day et al. (2020) Day, C. K., Deller, A. T., Shannon, R. M., et al. 2020, MNRAS, in prep.
- De et al. (2020) De, K., Kasliwal, M. M., Tzanidakis, A., et al. 2020, arXiv e-prints, arXiv:2004.09029. https://arxiv.org/abs/2004.09029
- Eftekhari & Berger (2017) Eftekhari, T., & Berger, E. 2017, ApJ, 849, 162, doi: 10.3847/1538-4357/aa90b9
- Eftekhari et al. (2020) Eftekhari, T., Berger, E., Margalit, B., Metzger, B. D., & Williams, P. K. G. 2020, ApJ, 895, 98, doi: 10.3847/1538-4357/ab9015
- Evans et al. (2009) Evans, Neal J., I., Dunham, M. M., Jørgensen, J. K., et al. 2009, ApJS, 181, 321, doi: 10.1088/0067-0049/181/2/321
- Fong & Berger (2013) Fong, W., & Berger, E. 2013, ApJ, 776, 18, doi: 10.1088/0004-637X/776/1/18
- Fong et al. (2010) Fong, W., Berger, E., & Fox, D. B. 2010, ApJ, 708, 9, doi: 10.1088/0004-637X/708/1/9
- Fruchter et al. (2006) Fruchter, A. S., Levan, A. J., Strolger, L., et al. 2006, Nature, 441, 463, doi: 10.1038/nature04787
- Heintz et al. (2020) Heintz, K. E., Prochaska, J. X., Simha, S., et al. 2020, arXiv e-prints, arXiv:2009.10747. https://arxiv.org/abs/2009.10747
- Hunter (2007) Hunter, J. D. 2007, Computing in Science & Engineering, 9, 90, doi: 10.1109/MCSE.2007.55
- James et al. (2021) James, C. W., Prochaska, J. X., Macquart, J. P., et al. 2021, arXiv e-prints, arXiv:2101.08005. https://arxiv.org/abs/2101.08005
- Kennicutt (1998a) Kennicutt, Robert C., J. 1998a, ARA&A, 36, 189, doi: 10.1146/annurev.astro.36.1.189
- Kennicutt (1998b) —. 1998b, ApJ, 498, 541, doi: 10.1086/305588
- Kennicutt & Evans (2012) Kennicutt, R. C., & Evans, N. J. 2012, ARA&A, 50, 531, doi: 10.1146/annurev-astro-081811-125610
- Kumar et al. (2020) Kumar, P., Shannon, R. M., Flynn, C., et al. 2020, arXiv e-prints, arXiv:2009.01214. https://arxiv.org/abs/2009.01214
- Lada & Dame (2020) Lada, C. J., & Dame, T. M. 2020, ApJ, 898, 3, doi: 10.3847/1538-4357/ab9bfb
- Law et al. (2020) Law, C. J., Butler, B. J., Prochaska, J. X., et al. 2020, ApJ, 899, 161, doi: 10.3847/1538-4357/aba4ac
- Li et al. (2019) Li, Y., Zhang, B., Nagamine, K., & Shi, J. 2019, ApJ, 884, L26, doi: 10.3847/2041-8213/ab3e41
- Lorimer et al. (2007) Lorimer, D. R., Bailes, M., McLaughlin, M. A., Narkevic, D. J., & Crawford, F. 2007, Science, 318, 777, doi: 10.1126/science.1147532
- Lunnan et al. (2015) Lunnan, R., Chornock, R., Berger, E., et al. 2015, ApJ, 804, 90, doi: 10.1088/0004-637X/804/2/90
- Lunnan et al. (2017) Lunnan, R., Kasliwal, M. M., Cao, Y., et al. 2017, ApJ, 836, 60, doi: 10.3847/1538-4357/836/1/60
- Macquart et al. (2010) Macquart, J.-P., Bailes, M., Bhat, N. D. R., et al. 2010, Publications of the Astronomical Society of Australia, 27, 272, doi: 10.1071/AS09082
- Macquart et al. (2020) Macquart, J. P., Prochaska, J. X., McQuinn, M., et al. 2020, Nature, 581, 391, doi: 10.1038/s41586-020-2300-2
- Marcote et al. (2017) Marcote, B., Paragi, Z., Hessels, J. W. T., et al. 2017, ApJ, 834, L8, doi: 10.3847/2041-8213/834/2/L8
- Marcote et al. (2020) Marcote, B., Nimmo, K., Hessels, J. W. T., et al. 2020, Nature, 577, 190, doi: 10.1038/s41586-019-1866-z
- Margalit et al. (2019) Margalit, B., Berger, E., & Metzger, B. D. 2019, ApJ, 886, 110, doi: 10.3847/1538-4357/ab4c31
- Margalit & Metzger (2018) Margalit, B., & Metzger, B. D. 2018, ApJ, 868, L4, doi: 10.3847/2041-8213/aaedad
- Nicholl et al. (2017) Nicholl, M., Williams, P. K. G., Berger, E., et al. 2017, ApJ, 843, 84, doi: 10.3847/1538-4357/aa794d
- Olausen & Kaspi (2014) Olausen, S. A., & Kaspi, V. M. 2014, ApJS, 212, 6, doi: 10.1088/0067-0049/212/1/6
- Oliphant (2006) Oliphant, T. E. 2006, A guide to NumPy, Vol. 1 (Trelgol Publishing USA)
- Palmerio et al. (2019) Palmerio, J. T., Vergani, S. D., Salvaterra, R., et al. 2019, A&A, 623, A26, doi: 10.1051/0004-6361/201834179
- Peletier & Balcells (1996) Peletier, R. F., & Balcells, M. 1996, AJ, 111, 2238, doi: 10.1086/117958
- Peng et al. (2002) Peng, C. Y., Ho, L. C., Impey, C. D., & Rix, H.-W. 2002, AJ, 124, 266, doi: 10.1086/340952
- Peng et al. (2010) —. 2010, AJ, 139, 2097, doi: 10.1088/0004-6256/139/6/2097
- Perley et al. (2016) Perley, D. A., Quimby, R. M., Yan, L., et al. 2016, ApJ, 830, 13, doi: 10.3847/0004-637X/830/1/13
- Petroff et al. (2019) Petroff, E., Hessels, J. W. T., & Lorimer, D. R. 2019, A&A Rev., 27, 4, doi: 10.1007/s00159-019-0116-6
- Planck Collaboration et al. (2016) Planck Collaboration, Ade, P. A. R., Aghanim, N., et al. 2016, A&A, 594, A13, doi: 10.1051/0004-6361/201525830
- Platts et al. (2019) Platts, E., Weltman, A., Walters, A., et al. 2019, Phys. Rep., 821, 1, doi: 10.1016/j.physrep.2019.06.003
- Pour-Imani et al. (2016) Pour-Imani, H., Kennefick, D., Kennefick, J., et al. 2016, ApJ, 827, L2, doi: 10.3847/2041-8205/827/1/L2
- Price-Whelan et al. (2018) Price-Whelan, A. M., Sipőcz, B. M., Günther, H. M., et al. 2018, AJ, 156, 123, doi: 10.3847/1538-3881/aabc4f
- Prieto et al. (2008) Prieto, J. L., Stanek, K. Z., & Beacom, J. F. 2008, ApJ, 673, 999, doi: 10.1086/524654
- Qiu et al. (2020) Qiu, H., Shannon, R. M., Farah, W., et al. 2020, MNRAS, 497, 1382, doi: 10.1093/mnras/staa1916
- Rafelski et al. (2015) Rafelski, M., Teplitz, H. I., Gardner, J. P., et al. 2015, AJ, 150, 31, doi: 10.1088/0004-6256/150/1/31
- Safarzadeh et al. (2020) Safarzadeh, M., Prochaska, J. X., Heintz, K. E., & Fong, W.-f. 2020, arXiv e-prints, arXiv:2009.11735. https://arxiv.org/abs/2009.11735
- Schulze et al. (2020) Schulze, S., Yaron, O., Sollerman, J., et al. 2020, arXiv e-prints, arXiv:2008.05988. https://arxiv.org/abs/2008.05988
- Seigar & James (2002) Seigar, M. S., & James, P. A. 2002, MNRAS, 337, 1113, doi: 10.1046/j.1365-8711.2002.06007.x
- Shannon et al. (2018) Shannon, R. M., Macquart, J. P., Bannister, K. W., et al. 2018, Nature, 562, 386, doi: 10.1038/s41586-018-0588-y
- Shen et al. (2019) Shen, K. J., Quataert, E., & Pakmor, R. 2019, ApJ, 887, 180, doi: 10.3847/1538-4357/ab5370
- Spitler et al. (2016) Spitler, L. G., Scholz, P., Hessels, J. W. T., et al. 2016, Nature, 531, 202, doi: 10.1038/nature17168
- Svensson et al. (2010) Svensson, K. M., Levan, A. J., Tanvir, N. R., Fruchter, A. S., & Strolger, L. G. 2010, MNRAS, 405, 57, doi: 10.1111/j.1365-2966.2010.16442.x
- Tendulkar et al. (2017) Tendulkar, S. P., Bassa, C. G., Cordes, J. M., et al. 2017, ApJ, 834, L7, doi: 10.3847/2041-8213/834/2/L7
- Tendulkar et al. (2020) Tendulkar, S. P., Gil de Paz, A., Kirichenko, A. Y., et al. 2020, arXiv e-prints, arXiv:2011.03257. https://arxiv.org/abs/2011.03257
- Thornton et al. (2013) Thornton, D., Stappers, B., Bailes, M., et al. 2013, Science, 341, 53, doi: 10.1126/science.1236789
- Tody (1986) Tody, D. 1986, in Society of Photo-Optical Instrumentation Engineers (SPIE) Conference Series, Vol. 627, Instrumentation in astronomy VI, ed. D. L. Crawford, 733, doi: 10.1117/12.968154
- Uddin et al. (2020) Uddin, S. A., Burns, C. R., Phillips, M. M., et al. 2020, The Astrophysical Journal, 901, 143, doi: 10.3847/1538-4357/abafb7
- Virtanen et al. (2020) Virtanen, P., Gommers, R., Oliphant, T. E., et al. 2020, Nature Methods, 17, 261, doi: https://doi.org/10.1038/s41592-019-0686-2
- Wang et al. (2013) Wang, X., Wang, L., Filippenko, A. V., Zhang, T., & Zhao, X. 2013, Science, 340, 170, doi: 10.1126/science.1231502
- Willett et al. (2013) Willett, K. W., Lintott, C. J., Bamford, S. P., et al. 2013, MNRAS, 435, 2835, doi: 10.1093/mnras/stt1458
- Woosley (1993) Woosley, S. E. 1993, ApJ, 405, 273, doi: 10.1086/172359