SISupI
Excitonic complexes in -doped WS2 monolayer
Abstract
We investigate the origin of emission lines apparent in the low-temperature photoluminescence spectra of -doped WS2 monolayer embedded in hexagonal BN layers using external magnetic fields and first-principles calculations. Apart from the neutral A exciton line, all observed emission lines are related to the negatively charged excitons. Consequently, we identify emissions due to both the bright (singlet and triplet) and dark (spin- and momentum-forbidden) negative trions as well as the phonon replicas of the latter optically-inactive complexes. The semi-dark trions and negative biexcitons are distinguished. Based on their experimentally extracted and theoretically calculated -factors, we identify three distinct families of emissions due to exciton complexes in WS2: bright, intravalley and intervalley dark. The -factors of the spin-split subbands in both the conduction and valence bands are also determined.
Monolayers (MLs) of semiconducting transition metal dichalcogenides (S-TMDs) MX2 where M=Mo or W and X=S, Se or Te, are direct band gap semiconductors with the minima of the conduction band (CB) and maxima of the valence band (VB) located at the inequivalent K± points of their hexagonal Brillouin zone (BZ).Koperski et al. (2017); Wang et al. (2018) The strong spin-orbit interaction and lack of inversion symmetry result in the splitting of the VB () and the CB () extrema. While the former splitting is of the order of a few hundreds of meV, the latter equals only few tens of meV and can be positive or negative.Kormányos et al. (2015) Consequently, two subgroups of MLs can be distinguished: (the excitonic ground state is optically active or bright) formed by MoSe2 and MoTe2,Molas et al. (2017a); Koperski et al. (2017); Robert et al. (2020a) and (the excitonic ground state is optically inactive or dark) composed of MoS2, WS2, and WSe2.Molas et al. (2017a); Zhang et al. (2017); Robert et al. (2020a)
Dark excitons in S-TMD ML can be divided into two subgroups because of the distinct origins of their optical inactivity, intravalley spin-forbidden and intervalley momentum-forbidden complexes, which can not recombine optically due to the spin and momentum conservation rule for excitons. Dark excitonic complexes can be also characterised by their net charge. Both neutral and charged dark excitons exist, which are bound electron-hole (-) pairs and the bound - pairs with an extra carrier (an electron or a hole), respectively.
In this work we investigate the low-temperature optical response of high-quality -doped WS2 ML encapsulated hexagonal BN (hBN) flakes using photoluminescence (PL) spectroscopy in external magnetic fields. All emission lines, observed in the PL spectrum, are due to both the bright (singlet and triplet) and dark (spin- and momentum-forbidden) negative trions as well as the phonon replicas of the latter optically-inactive complexes. Moreover, the semi-dark trions and negative biexcitons are distinguished. Magneto-PL measurements accompanied with first-principles calculations allow us to extract the -factors of all transitions as well as of the spin-split subbands in both the conduction and the valence bands.
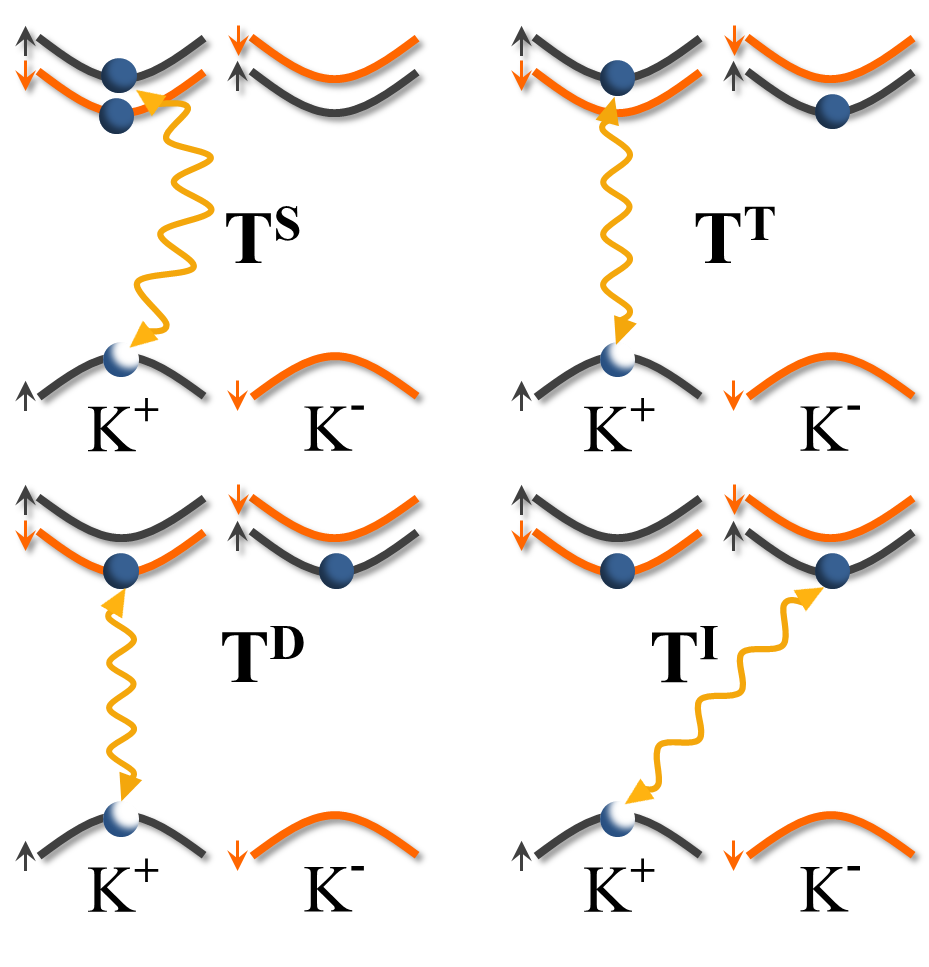
The negatively charged exciton or negative trion is a three-particle complex composed of an - pair and an excess electron. There are four negative trions in W-based darkish MLs (WS2 or WSe2), two bright and two dark states, see Fig. 1. These states can be formed in both the K+ and K- valleys (taking into account the location of a hole), which leads to two possible configurations of a given complex. Due to the spin conservation rule for S-TMD MLs, the bright (optically active) negative trion may be found in both the intravalley singlet (T) and intervalley triplet (T) states. They involve correspondingly two electrons from the same valley whereas the triplet trion comprises two electrons from different valleys. For the dark (optically inactive) negative trions, the corresponding electrons are located in different valleys and are characterized by the antiparallel alignment of their spins. This configuration leads to two complexes, depending on the electron involved in recombination process: intravalley spin- (T) and intervalley momentum-forbidden (T), which cannot recombine optically because of the spin and momentum conservation, respectively.
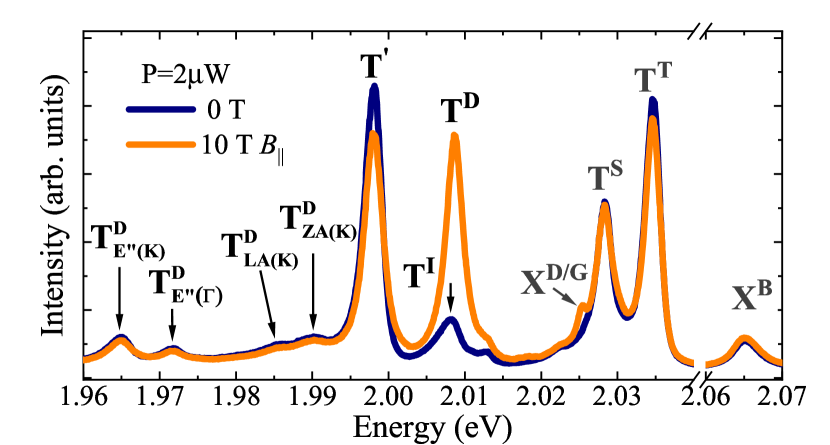
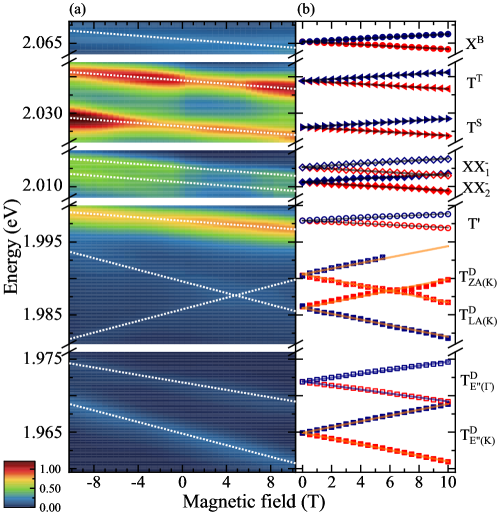
In order to investigate the negatively charged complexes in our WS2 ML, we measured its low temperature (=5 K) PL spectrum at zero magnetic field and in the in-plane magnetic field of 10 T, see Fig. 2. It is well established that the application of an in-plane magnetic field () results in the mixing of the bright and dark excitons, which becomes apparent in the optical activation of spin-forbidden dark complexes Slobodeniuk and Basko (2016); Molas et al. (2017a); Zhang et al. (2017); Molas et al. (2019a); Lu et al. (2019); Robert et al. (2020a); Zinkiewicz et al. (2020). The zero-field PL spectrum is composed of several emission lines. Based on the previous reports Molas et al. (2017a); Vaclavkova et al. (2018); Nagler et al. (2018); Jadczak et al. (2019); Paur et al. (2019), three peaks can be assigned unquestionably to the bright neutral exciton (X) and to two bright negatively charged excitons, singlet (T) and triplet (T), formed in the vicinity of the optical band gap (A exciton). Two additional lines, labelled X and T become apparent in =10 T (see Fig. 2). As it was recently reported Zinkiewicz et al. (2020), the X peak corresponds to the dark and grey states of the neutral exciton, while the T peak is related to the dark state of the negative trion. The PL spectra, shown in Fig. 2, comprise also several lines at lower energies, which are denoted as T, T’, T, T, T, and T. Increasing the excitation power leads to the appearance of an additional emission, labelled XX-. Those lines have not been reported so far in WS2 MLs and the following is dedicated to their identification.
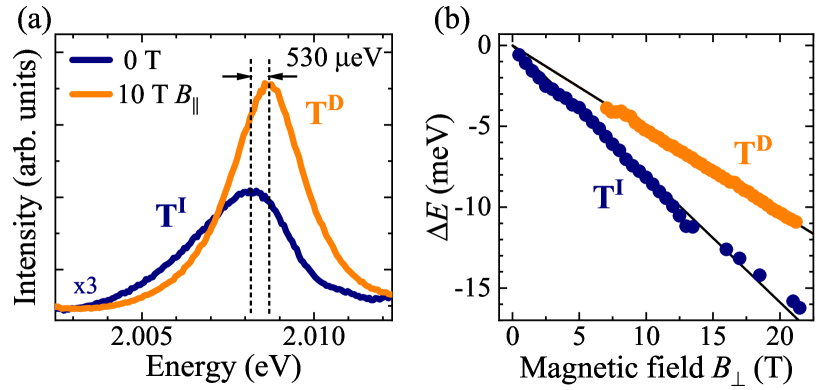
As can be appreciated in Fig. 1, both the intravalley spin-forbidden and intervalley momentum-forbidden negative trions share the same carrier configuration. The difference arises from their recombination pathway. While the T complex involves recombination of an - pair from the same K± point, for the T trion, an electron and a hole from neighbouring K± valleys recombine. The T can be identified with magnetic brightening experiments with a field, see Fig. 3(a). This effect was investigated in details in Ref. 10. The observation and assignment of the emission due to the intervalley momentum-forbidden negative trion is more striking. Recently, similar emission related to the momentum-forbidden dark neutral exciton was reported in the WSe2 ML He et al. (2020a); Liu et al. (2020). It was demonstrated that at zero magnetic field the intensity of the momentum-forbidden emission is much smaller as compared to the corresponding spin-forbidden one. In our case, the T line dominates at =0 T, while the T one can be only observed because of the brightening effect. As the energy difference between those complexes is only of about 530 eV, the optical emission of the T line through the Auger processes Danovich et al. (2016) or by emission of optical phonons can be excluded He et al. (2020a). Similar to the case of the indirect band gap in thin layers of WS2 Molas et al. (2017b), the optical recombination of intervalley dark trion can be allowed due to defect states, which may provide momentum conservation during recombination. The origin of the T-T energy splitting is not clear as both the intervalley and intravalley dark trions share the same carrier configuration (see Fig. 1). We believe that this splitting arises from higher-order processes, description of which is beyond the scope of our work. The similar energy separation between the intervalley and intravalley dark neutral excitons in WSe2 ML was reported to be on the order of 10 meV and is ascribed to a short-range electron-hole exchange interaction He et al. (2020a); Liu et al. (2020).
Upon application of an out-of-plane magnetic field (), excitonic transitions split into two circularly polarized components (). Their energy separation can be expressed as , where denotes the -factor of the considered excitonic complex and is the Bohr magneton. The magnetic field evolution of the with linear fits to experimental data for both the T and T excitons is shown in Fig. 3(b). Linear fits to the experimental data are also presented in the Figure. The resulting -factors of the T and T are equal to –8.9 and –13.7, respectively. The former value is consistent with our recent result reported in Ref. 10, while the latter one is very similar to the -factor reported for intervalley dark complexes in WSe2 MLs He et al. (2020a); Liu et al. (2020).
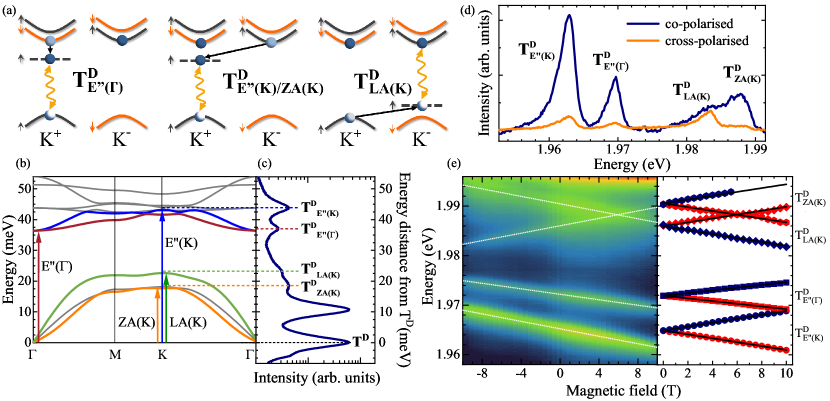
The identification of four lines apparent in the lowest energy range of the PL spectrum (see Fig. 2) will be addressed in the following. One of the possibilities to fulfil the spin and momentum conservation during optical recombination of the dark trions is phonon emission. Fig. 4(a) shows a schematic illustration of possible recombination pathways of dark negative trions involving phonon emission. The phonon-assisted processes give rise to so-called phonon replicas of dark excitons in WSe2 MLs Li et al. (2019a, b); Liu et al. (2019a); He et al. (2020a); Liu et al. (2020); Robert et al. (2020b). Due to the symmetry and the momentum of a given phonon, it may lead to the transfer of a carrier (an electron or a hole) to a virtual state with a spin-flip or a valley-flip.
The phonon replicas of the dark trion should be redshifted from it by the phonon energies, with the redshift corresponding to the phonon emission. The calculated phonon dispersion can be therefore compared to the low-temperature PL spectrum of the WS2 ML as presented in Figs 4(b) and (c). We found that the extracted relative energies of phonon replicas from the T line are in good agreement with the corresponding theoretical phonon energies. To confirm the assignment of phonons shown in Fig. 4(a), we analysed their symmetries following the group theory considerations and irreducible representations (IR) notation from Ref. He et al. (2020b), where WSe2 ML, of the same symmetry as WS2 ML, has been studied. The intravalley spin-flip process of an electron can only be assisted by a phonon, which transforms like the IR , E”(). Additionally, comparing the measured redshift (37 meV) and the calculated phonon energy (36.4 meV), the phonon replica observed at about 1.97 eV can be identified as T. The other replicas, which involve the momentum-flip processes (the spin of the electrons is conserved at the same time), must be induced by phonons from K point. It is possible to transfer an electron (hole) between K± valleys with emission of E”(K) (LA(K)) phonons, as they transform according to IR K3 (K1). Their calculated energies (43.0 meV and 22.6 meV) agree well with the measured redshifts (44 meV and 23 meV). Therefore, we label the replicas apparent at about 1.965 eV and 1.986 eV as T and T. The red shift of the replica at around 1.99 eV (18 meV) is close to calculated energies of TA(K) and ZA(K) phonons (18.2 and 17.7 meV). The former one should induce a spin flip, while the latter one preserves this symmetry and couples to a spin conserving transition. Due to the extracted -factor value for this replica (discussed in the next paragraph), we label it as T.
To confirm the assignment of the phonon replicas, we analyse their polarization properties under circular polarized excitation and their evolution when applying an out-of-plane magnetic field. Fig. 4(d) shows the helicity-resolved PL under circularly polarized excitation with the T energy. After formation of the T complex at the K± point using the polarization, an electron from the top subband of the CB at K± point relaxes to the bottom one at the opposite K∓ point, which leads to the formation of the dark trion (see Fig. 1). As a result of spin- and momentum-flip processes of electrons in the CB, three replicas (T, T, T) are characterized by large conservation of excitation helicity in emission. For the T line, the opposite behaviour should be present, as the emission occurs at the valley which is opposite to excitation one due to the momentum-flip of a hole in the VB. However, that replica demonstrates almost zero preservation of excitation helicity, which may be related to the scattering processes of carriers Singh et al. (2016). These polarization properties also affect the PL spectra measured in field. As can be seen in Fig. 4(e), the studied lines are characterized not only by different magnitudes of their field-induced shifts but also by the sign. To extract their -factors, we fitted our experimental results using formula , where is the emission energy at zero field. The obtained -factors of -13.6, -13.3, and +13.6 for T, T, and T, respectively, are consistent with the T one (-13.7). Note that the sign of the T -factor is opposite, which is an indication of the intervalley transfer of hole, whereas the -factor of T of -8.9 is identical to the value obtained for T.
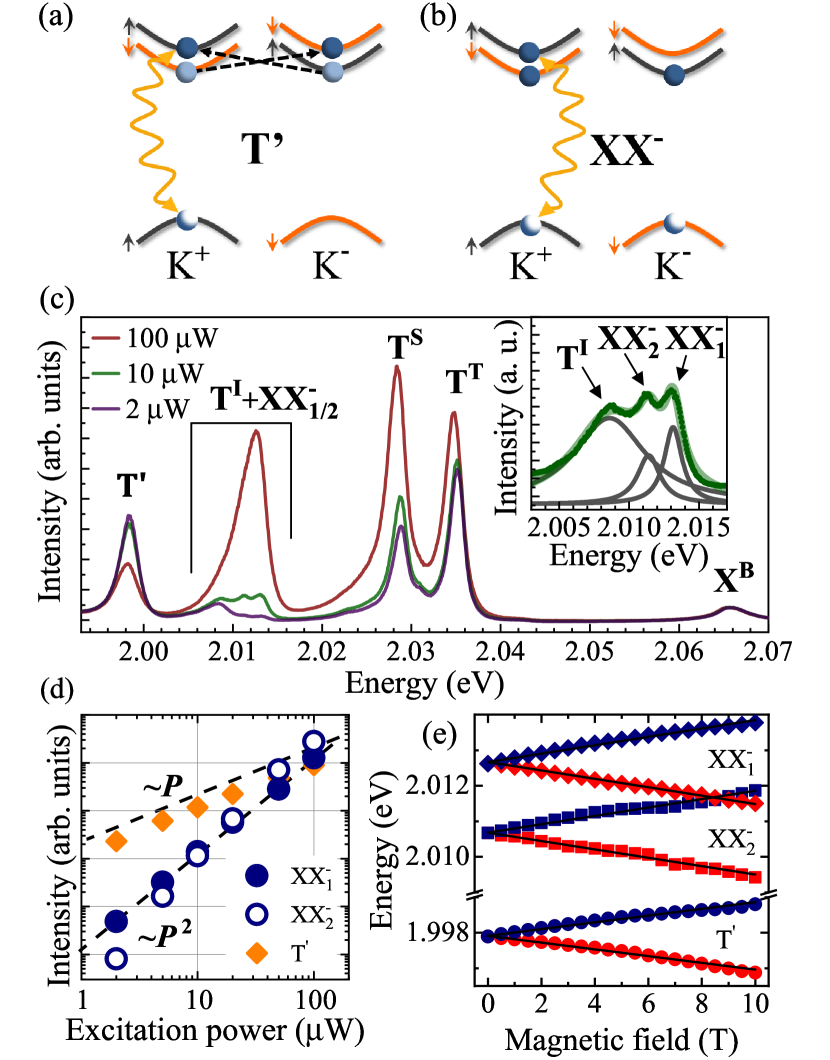
One of the most pronounced features observed in the PL spectrum is the T’ line, which intensity is comparable to the T and T ones, see Fig. 2. Although the emission line was previously observed many times in the low-temperature PL spectra of both the WSe2 and WS2 MLs Paur et al. (2019); Li et al. (2019c, b, a); Liu et al. (2019b, a); He et al. (2020a); Liu et al. (2020), its origin is not well defined. We ascribe the T’ line to the recombination of the dark trion made optically active due to the electron-electron (-) scattering Danovich et al. (2017), and name it a semi-dark trion. We note that the corresponding semi-dark trion has recently been reported in WSe2 ML Tu et al. (2019). The initial state of the T’ line is dark, the same as for both the T and T trions, compare Figs. 5(a) and 1. Because of the intervalley - scattering, an electron located at the lower CB subband in the K± point is transferred to the higher lying CB subband in the opposite K valley, which results in the optical recombination of an - pair.
The last studied excitonic complex is a negative biexciton, denoted as XX-. Its formation is possible due to the long lifetime of dark trions (see Fig. 5(b)), which was reported to be close to 0.5 ns Zinkiewicz et al. (2020). The emission related to negative biexcitons is only apparent at high excitation power and it is characterized by two lines, labelled XX and XX, see Fig. 5(c). The XX–XX energy separation being about 2 meV is very similar to the energy separation reported for two neutral biexcitons (2.5 meV) in WSe2 ML Barbone et al. (2018). Surprisingly, as two lines of the neutral biexcitons can be explained in terms of two possible carrier configurations, the appearance of the XX and XX lines is not clear (there is a single possible configuration, see Fig. 5(b)) which requires more sophisticated theoretical analysis.
| X | -3.5 | -3.56 | -1.78 | 0 | |
| T | -4.0 | ||||
| T | -3.9 | ||||
| T’ | -3.3 | ||||
| XX | -4.1 | ||||
| XX | -4.1 | ||||
| T | -8.9 | -8.73 | -2.37 | -2 | |
| T | -8.9 | ||||
| T | -13.7 | -12.20 | -6.10 | 0 | |
| T | -13.6 | ||||
| T | -13.3 | ||||
| T | +13.6 | +12.20 | -6.10 | 0 |
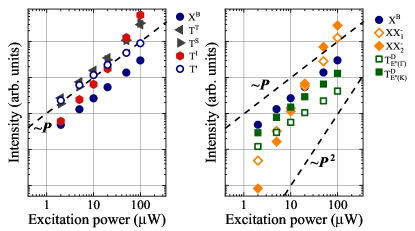
To confirm our assignment of the T’, XX, and XX lines, Fig. 5(d) presents their intensity evolution as a function of excitation power. We found that T’ emission follows a linear behaviour, while the XX and XX peaks are characterized by superlinear evolution. These types of power dependence are typical for excitonic complexes composed of a single - pair or by two - pairs Barbone et al. (2018); Chen et al. (2018); Li et al. (2018). Note that the excitation-power evolution of other excitons is presented in Supplementary Information (SI). Additionally, we analyse their evolution in the fields, see Fig. 5(e). Using the same approach as for phonon replicas, we extracted -factors of –3.3, –4.1, and –4.1 for T’, XX, and XX lines, respectively. These values are consistent with the -factors found for the bright complexes, such as X, T, T (see SI for details).
The -factors for the all studied excitonic complexes are summarized in Tab. 1. According to the extracted values of -factors, the excitonic complexes can be arranged into three groups: (i) -factors in the range –3.3 – –4.1 are characteristic for bright transitions (X, T, T, T’, XX, and XX); (ii) the spin-forbidden dark transitions are described by –8.9 values of -factors (T and T); and (iii) values of -factors of about –13.3 – –13.7 and +13.6 are obtained for momentum-forbidden dark transitions (T, T, T, and T). In order to establish the -factors of a single subbands in both the CB and VB, we adapted the method proposed in Ref. 22. It relies on the comparison of -factors related to the different excitonic complexes (see SI for details). The obtained values of the -factors for higher-energy () and lower-energy () subbands in CB (VB) at the K+ point are shown in Tab. 2. Note that the -factor of band was calculated using the reported -factor of B exciton (-4) in Ref. 32. The extracted values demonstrate that the simple model commonly employed for calculation of the excitonic -factors using additive contribution of the spin, valley, and orbital angular momenta Aivazian et al. (2015) cannot explain the single band -factors.
| n | Ln | |||
|---|---|---|---|---|
| v-1 | 2.81 | 2.79 | 3.79 | -1 |
| v | 6.10 | 5.23 | 4.23 | +1 |
| c | 0.86 | 0.87 | 1.87 | -1 |
| c+1 | 3.84 | 3.45 | 2.45 | +1 |
To verify our experimental results, we calculate theoretically -factors using a first principles based approach proposed in Ref. 34. In this case, first the -factors of single subbands () are calculated, which are then used to determine the -factor of a given transition (). Consequently, the theoretical -factor of the band () at point K+ is evaluated as , where and are the orbital and spin angular momenta of the bands hosting the bound - pair involved in the optical recombination process, while the excess carriers do not contribute. A scissor correction to the experimental free-particle gap was applied during the evaluation of Molas et al. (2019b). The -factors of studied excitons can then be expressed as , where denotes the difference of respective angular momenta between the and bands. The sign is determined by the polarization of the transition at K+ valley, which reflects the optical selection rules. We obtain three values of : -3.56, -8.73 and 12.20, which correspond to bright, spin-forbidden, and momentum-forbidden transitions groups, respectively. The magnitudes of -factors can be explained in terms of the orbital and spin contributions to the angular momenta of bands. The bright complexes involve the spin-conserving transitions, therefore their is determined only by the orbital contribution. For the spin-forbidden complexes, the change of spin part is equal to -2 and the orbital part is also enhanced, as band is involved in the transition. The momentum-forbidden complexes involve carriers from different K valleys, which gives rise to large orbital angular momentum difference and leads to a high value of . For T the -factor is positive because K- valley couples to light. As can be appreciated in Tab. 2, the experimental and theoretical values of -factors are in very good agreement. The spread of experimentally obtained -factors from -3.3 to -4.1 for bright group cannot be explained with the employed approach and requires further theoretical investigations.
We identified all emission lines apparent in the low-temperature PL spectra of -doped WS2 ML embedded in hexagonal BN layers using external magnetic fields. We found that the extracted -factors of all transitions may be arranged in three groups revealing a nature of electron-hole recombination: bright, intravalley, and intervalley dark. We explained their signs and magnitudes with the aid of first-principles calculations. This division can open an opportunity to identify the origin of the reported so-called localized excitons in the emission spectra of the WSe2 and WS2 MLs exfoliated on Si/SiO2 substrates. The obtained -factors of the spin-split subbands in both the CB and VB are important for better understanding of the interlayer transitions in van der Waals heterostructures.
acknowledgement
We thank A. O. Slobodeniuk, M. Bieniek, and P. E. Faria Junior for fruitful discussions. The work has been supported by the the National Science Centre, Poland (grants no. 2017/27/B/ST3/00205, 2017/27/N/ST3/01612 and 2018/31/B/ST3/02111), EU Graphene Flagship project (no. 785219), the ATOMOPTO project (TEAM programme of the Foundation for Polish Science, co-financed by the EU within the ERD-Fund), the Nano fab facility of the Institut Néel, CNRS UGA, and the LNCMI-CNRS, a member of the European Magnetic Field Laboratory (EMFL). The Polish participation in EMFL is supported by the DIR/WK/2018/07 grant from Polish Ministry of Science and Higher Education. T.W. acknowledges financial support by the Polish Ministry of Science and Higher Education via the ”Diamond Grant” no. D\2015 002645. P. K. kindly acknowledges the National Science Centre, Poland (grant no. 2016/23/G/ST3/04114) for financial support for his PhD. M. B. acknowledges the financial support from the ERC under the European Union’s Horizon 2020 research and innovation programme (GA no. 714850) and of the Ministry of Education, Youth and Sports of the Czech Republic under the project CEITEC 2020 (Grant No. LQ1601). K.W. and T.T. acknowledge support from the Elemental Strategy Initiative conducted by the MEXT, Japan, (grant no. JPMXP0112101001), JSPS KAKENHI (grant no. JP20H00354), and the CREST (JPMJCR15F3), JST. The calculations were carried out with the support of the Interdisciplinary Centre for Mathematical and Computational Modelling (ICM), University of Warsaw, under grant no GB69-17.
References
- Koperski et al. (2017) M. Koperski, M. R. Molas, A. Arora, K. Nogajewski, A. O. Slobodeniuk, C. Faugeras, and P. M., Nanophotonics 6, 1289 (2017).
- Wang et al. (2018) G. Wang, A. Chernikov, M. M. Glazov, T. F. Heinz, X. Marie, T. Amand, and B. Urbaszek, Rev. Mod. Phys. 90, 021001 (2018).
- Kormányos et al. (2015) A. Kormányos, G. Burkard, M. Gmitra, J. Fabian, V. Zólyomi, N. D. Drummond, and V. Fal’ko, 2D Materials 2, 022001 (2015).
- Molas et al. (2017a) M. R. Molas, C. Faugeras, A. O. Slobodeniuk, K. Nogajewski, M. Bartos, D. M. Basko, and M. Potemski, 2D Materials 4, 021003 (2017a).
- Robert et al. (2020a) C. Robert, B. Han, P. Kapuscinski, A. Delhomme, C. Faugeras, T. Amand, M. R. Molas, M. Bartos, K. Watanabe, T. Taniguchi, B. Urbaszek, M. Potemski, and X. Marie, Nature Communications 11, 4037 (2020a).
- Zhang et al. (2017) X.-X. Zhang, T. Cao, Z. Lu, Y.-C. Lin, F. Zhang, Y. Wang, Z. Li, J. C. Hone, J. A. Robinson, D. Smirnov, S. G. Louie, and T. F. Heinz, Nature Nanotechnology 12, 883 (2017).
- Slobodeniuk and Basko (2016) A. O. Slobodeniuk and D. M. Basko, 2D Materials 3, 035009 (2016).
- Molas et al. (2019a) M. R. Molas, A. O. Slobodeniuk, T. Kazimierczuk, K. Nogajewski, M. Bartos, P. Kapuściński, K. Oreszczuk, K. Watanabe, T. Taniguchi, C. Faugeras, P. Kossacki, D. M. Basko, and M. Potemski, Phys. Rev. Lett. 123, 096803 (2019a).
- Lu et al. (2019) Z. Lu, D. Rhodes, Z. Li, D. V. Tuan, Y. Jiang, J. Ludwig, Z. Jiang, Z. Lian, S.-F. Shi, J. Hone, H. Dery, and D. Smirnov, 2D Materials 7, 015017 (2019).
- Zinkiewicz et al. (2020) M. Zinkiewicz, A. O. Slobodeniuk, T. Kazimierczuk, P. Kapuściński, K. Oreszczuk, M. Grzeszczyk, M. Bartos, K. Nogajewski, K. Watanabe, T. Taniguchi, C. Faugeras, P. Kossacki, M. Potemski, A. Babiński, and M. R. Molas, Nanoscale 12, 18153 (2020).
- Vaclavkova et al. (2018) D. Vaclavkova, J. Wyzula, K. Nogajewski, M. Bartos, A. O. Slobodeniuk, C. Faugeras, M. Potemski, and M. R. Molas, Nanotechnology 29, 325705 (2018).
- Nagler et al. (2018) P. Nagler, M. V. Ballottin, A. A. Mitioglu, M. V. Durnev, T. Taniguchi, K. Watanabe, A. Chernikov, C. Schüller, M. M. Glazov, P. C. M. Christianen, and T. Korn, Phys. Rev. Lett. 121, 057402 (2018).
- Jadczak et al. (2019) J. Jadczak, L. Bryja, J. Kutrowska-Girzycka, P. Kapuscinski, M. Bieniek, Y.-S. Huang, and P. Hawrylak, Nature Communications 10, 107 (2019).
- Paur et al. (2019) M. Paur, A. J. Molina-Mendoza, R. Bratschitsch, K. Watanabe, T. Taniguchi, and T. Mueller, Nature Communications 10, 1709 (2019).
- He et al. (2020a) M. He, P. Rivera, D. Van Tuan, N. P. Wilson, M. Yang, T. Taniguchi, K. Watanabe, J. Yan, D. G. Mandrus, H. Yu, H. Dery, W. Yao, and X. Xu, Nature Communications 11, 618 (2020a).
- Liu et al. (2020) E. Liu, J. van Baren, C.-T. Liang, T. Taniguchi, K. Watanabe, N. M. Gabor, Y.-C. Chang, and C. H. Lui, Physical Review Letters 124, 196802 (2020).
- Danovich et al. (2016) M. Danovich, V. Zólyomi, V. I. Fal’ko, and I. L. Aleiner, 2D Materials 3, 035011 (2016).
- Molas et al. (2017b) M. R. Molas, K. Nogajewski, A. O. Slobodeniuk, J. Binder, M. Bartos, and M. Potemski, Nanoscale 9, 13128 (2017b).
- Li et al. (2019a) Z. Li, T. Wang, C. Jin, Z. Lu, Z. Lian, Y. Meng, M. Blei, M. Gao, T. Taniguchi, K. Watanabe, T. Ren, T. Cao, S. Tongay, D. Smirnov, L. Zhang, and S.-F. Shi, ACS Nano 13, 14107 (2019a).
- Li et al. (2019b) Z. Li, T. Wang, C. Jin, Z. Lu, Z. Lian, Y. Meng, M. Blei, S. Gao, T. Taniguchi, K. Watanabe, T. Ren, S. Tongay, L. Yang, D. Smirnov, T. Cao, and S.-F. Shi, Nature Communications 10, 2469 (2019b).
- Liu et al. (2019a) E. Liu, J. van Baren, T. Taniguchi, K. Watanabe, Y.-C. Chang, and C. H. Lui, Phys. Rev. Research 1, 032007 (2019a).
- Robert et al. (2020b) C. Robert, H. Dery, L. Ren, D. van Tuan, E. Courtade, M. Yang, B. Urbaszek, D. Lagarde, K. Watanabe, T. Taniguchi, T. Amand, and X. Marie, “Measurement of conduction and valence bands g-factors in a transition metal dichalcogenide monolayer,” (2020b), arXiv:2008.07464 [cond-mat.mtrl-sci] .
- He et al. (2020b) M. He, P. Rivera, D. Van Tuan, N. P. Wilson, M. Yang, T. Taniguchi, K. Watanabe, J. Yan, D. G. Mandrus, H. Yu, H. Dery, W. Yao, and X. Xu, Nature Communications 11, 1 (2020b).
- Singh et al. (2016) A. Singh, K. Tran, M. Kolarczik, J. Seifert, Y. Wang, K. Hao, D. Pleskot, N. M. Gabor, S. Helmrich, N. Owschimikow, U. Woggon, and X. Li, Phys. Rev. Lett. 117, 257402 (2016).
- Li et al. (2019c) Z. Li, T. Wang, Z. Lu, M. Khatoniar, Z. Lian, Y. Meng, M. Blei, T. Taniguchi, K. Watanabe, S. A. McGill, S. Tongay, V. M. Menon, D. Smirnov, and S.-F. Shi, Nano Letters 19, 6886 (2019c).
- Liu et al. (2019b) E. Liu, J. van Baren, Z. Lu, M. M. Altaiary, T. Taniguchi, K. Watanabe, D. Smirnov, and C. H. Lui, Phys. Rev. Lett. 123, 027401 (2019b).
- Danovich et al. (2017) M. Danovich, V. Zólyomi, and V. I. Fal’ko, Scientific Reports 7, 45998 (2017).
- Tu et al. (2019) J.-S. Tu, S. Borghardt, D. Grützmacher, and B. E. Kardynał, Journal of Physics: Condensed Matter 31, 415701 (2019).
- Barbone et al. (2018) M. Barbone, A. R. P. Montblanch, D. M. Kara, C. Palacios-Berraquero, A. R. Cadore, D. De Fazio, B. Pingault, E. Mostaani, H. Li, B. Chen, K. Watanabe, T. Taniguchi, S. Tongay, G. Wang, A. C. Ferrari, and M. Atatüre, Nature Communications 9, 3721 (2018).
- Chen et al. (2018) S.-Y. Chen, T. Goldstein, T. Taniguchi, K. Watanabe, and J. Yan, Nature Communications 9, 3717 (2018).
- Li et al. (2018) Z. Li, T. Wang, Z. Lu, C. Jin, Y. Chen, Y. Meng, Z. Lian, T. Taniguchi, K. Watanabe, S. Zhang, D. Smirnov, and S.-F. Shi, Nature Communications 9, 3719 (2018).
- Stier et al. (2016) A. V. Stier, K. M. McCreary, B. T. Jonker, J. Kono, and S. A. Crooker, Nature Communications 7, 10643 (2016).
- Aivazian et al. (2015) G. Aivazian, Z. Gong, A. M. Jones, R.-L. Chu, J. Yan, D. G. Mandrus, C. Zhang, D. Cobden, W. Yao, and X. Xu, Nature Physics 11, 148 (2015).
- Woźniak et al. (2020) T. Woźniak, P. E. Faria Junior, G. Seifert, A. Chaves, and J. Kunstmann, Phys. Rev. B 101, 235408 (2020).
- Molas et al. (2019b) M. R. Molas, A. O. Slobodeniuk, K. Nogajewski, M. Bartos, L. Bala, A. Babiński, K. Watanabe, T. Taniguchi, C. Faugeras, and M. Potemski, Phys. Rev. Lett. 123, 136801 (2019b).
Supporting Information:
Excitonic complexes in -doped WS2 monolayer
M. Zinkiewicz,1 T. Woźniak,2 T. Kazimierczuk,1 P. Kapuściński,3,4 K. Oreszczuk,1 M. Grzeszczyk,1 M. Bartos,3,5 K. Nogajewski,1 K. Watanabe,6 T. Taniguchi,7 C. Faugeras,3 P. Kossacki,1 M. Potemski,1,3 A. Babiński,1 and M. R. Molas1 1Institute of Experimental Physics, Faculty of Physics, University of Warsaw, ul. Pasteura 5, 02-093 Warsaw, Poland
2Department of Semiconductor Materials Engineering, Wrocław University of Science and Technology, Wybrzeże Wyspiańskiego 27, 50-370 Wrocław, Poland
3Laboratoire National des Champs Magnétiques Intenses, CNRS-UGA-UPS-INSA-EMFL, 25, avenue des Martyrs, 38042 Grenoble, France
4Department of Experimental Physics, Wrocław University of Science and Technology, ul. Wybrzeże Wyspiańskiego 27, 50-370 Wrocław, Poland
5Central European Institute of Technology, Brno University of Technology, Purkyňova 656/123, 612 00 Brno, Czech Republic
6Research Center for Functional Materials, National Institute for Materials Science, 1-1 Namiki, Tsukuba 305-0044, Japan
7International Center for Materials Nanoarchitectonics, National Institute for Materials Science, 1-1 Namiki, Tsukuba 305-0044, Japan
S1 Sample
The studied sample is composed of WS2 ML encapsulated in hBN flakes and supported by a bare Si substrate. The structure was obtained by two-stage polydimethylsiloxane (PDMS)-based GomezSI mechanical exfoliation of WS2 and hBN bulk crystals. A bottom layer of hBN in the hBN/WS2/hBN heterostructure was created in the course of a non-deterministic exfoliation. The assembly of the hBN/WS2/hBN heterostructure was realized via succesive dry transfers of WS2 ML and capping hBN flake from PDMS stamps onto the bottom hBN layer.
S2 Experimental setups
Low-temperature micro-magneto-PL experiments are performed in the Voigt, Faraday and tilted geometries, magnetic field oriented parallel, perpendicular, and 45∘ with respect to ML’s plane. Measurements (spatial resolution 2 m) were carried out with the aid of two systems: a split-coil superconducting magnet and a resistive solenoid producing fields up to 10 T and 30 T using a free-beam-optics arrangement and an optical-fiber-based insert, respectively. The sample was placed on top of a -- piezo-stage kept at =10 K or =4.2 K and was excited using a laser diode with 532 nm or 515 nm wavelength (2.33 eV or 2.41 eV photon energy). The emitted light was dispersed with a 0.5 m long monochromator and detected with a charge coupled device (CCD) camera. For measurements up to 10 T, the circular polarizations of the emissions were analyzed using a set of polarizers and a /4 waveplate placed directly in front of the spectrometer. In tilted-field configurations in high magnetic fields, the combination of a quarter wave plate and a linear polarizer placed in the insert were used to analyse the circular polarization of signals (the measurements were performed with a fixed circular polarization, whereas reversing the direction of magnetic field yields the information corresponding to the other polarization component due to time-reversal symmetry). Note that the excitation power for experiments performed in magnetic fields up to 30 T was adjusted based on the comparison of the measured PL spectrum and the one obtained under excitation of laser with 532 nm.
S3 Theoretical calculations
First principles calculations were performed with the use of Vienna Ab Initio Simulation Package (VASP) VASPSI and the Projector Augmented Wave method PAWSI . After testing several exchange-correlation functionals, van der Waals corrections and functionals, the parametrization of Perdew-Burke-Ernzerhof revised for solids (PBEsol) PBEsolSI was used for geometry optimization, as yielding the best agreement with experimental lattice constant and layer thickness SchutteSI . Atomic positions and lattice constants were optimized with eV/Å and 0.1 kbar precision. Energy cutoff of 400 eV, a k-mesh and 15 Å of vacuum in the vertical direction of unit cell were chosen after careful convergence tests. Phonon band structure calculations were performed using Phonopy package PhonopySI , which implements the finite displacement method to obtain the interatomic force constants ParlinskiSI . A supercell was found sufficient to yield converged phonon energies at and K points. The orbital angular momenta of bands were obtained from the wave function derivatives that are calculated within density functional perturbation theory DFPTSI .
S4 Excitation power evolutions of excitonic emissions
In order to verify the assignment of different investigated excitonic complexes, we measured excitation power dependency of the PL spectra. Fig. S1 demonstrates the integrated intensity of excitons as a function of excitation powers. As can be appreciated, most of the complexes, X, T, T, T, T’, T, and T, are characterized by nearly linear dependence, while the intensity growth of both the XX and XX lines are described by superlinear evolution. These types of power dependence are typical for excitonic complexes composed of a single electron-hole (-) pair or by two - pairs BarboneSI ; ChenSI ; LiSI .
S5 -factors of excitonic complexes
Fig. S2(a) illustrates the false-color map of the magneto-photoluminescence spectra measured in magnetic fields up to 10 T oriented perpendicular to ML’s plane under power excitation of 20 W, which allows us to investigate the g-factors of negatively charged biexcitons (XX and XX). Upon application of an out-of-plane magnetic field, the excitonic emissions split into two circularly polarized components due to the excitonic Zeeman effect KoperskiSI . Their energies evolutions () in external out-of-plane magnetic fields () can be described as:
| (1) |
where is the energy of the transition at zero field, denotes the -factor of the considered excitonic complex and is the Bohr magneton. The fitting results of Eq. 1 to the experimental results are presented in Fig. S2(b). As can be seen, for all the excitonic complexes, the observed evolutions can be described by the aforementioned formula. We found that the obtained values of -factors can be organized in three groups: 4 (black fitted lines), 9 (navy fitted lines), and 13 (orange fitted lines). The -factors value for each excitonic complex as well as the origin of thee groups are presented in the main article.
S6 Conduction and valence bands -factors
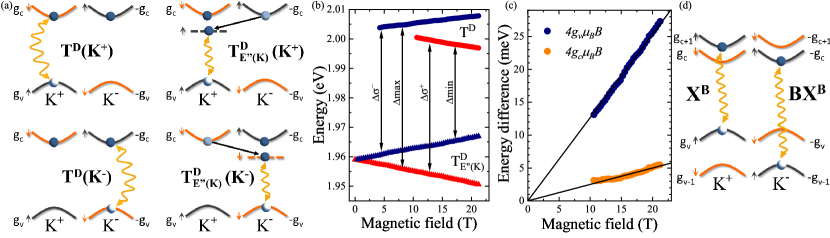
Recently, a method for determination of single subbands -factors in the WSe2 monolayers was proposed in Ref. 13. As low temperature PL spectra of both the WSe2 and WS2 monolayers comprise of several emission lines including so-called phonon replicas, we have adapted this method to obtain -factors of single conduction and valence subbands in WS2 ML. Within this approach, we compare energy evolution of spin-forbidden dark trion (T) and its phonon replica (T) in out-of-plane magnetic fields (). Particularly, the energy difference between their circularly-polarized components () corresponding to emissions from different valleys (K+ or K-) is analysed, see Fig. S3(a). Fig. S3(b) shows the magnetic field evolution of the components of the T and T lines. Note that the field dependence of T emission was measured in the tilted configuration of the sample by 45o with respect to the applied magnetic field direction, which gives both in-plane and out-of-plane components of magnetic fields, see Ref. 14 for details. There are four energy distances marked in Fig. S3(b) by black vertical lines: , , and . With help of schematic illustration shown in Fig. S3(a), it follows that they depend only on single subband -factors and phonon energy and are equal to:
| (2) |
where and represent the magnetic field evolutions of components of spin forbidden dark trion () and its E” phonon replica (). E”(K) is energy of E” phonon at K point. and are the -factors of the lowest conduction band and the highest valence band , while and are related to the Bohr’s magneton and the applied out-of-plane magnetic field.
Further transformations of the aforementioned equations lead to establishing equations which allow determination of and values:
| (3) |
Fig. S3(c) demonstrates experimentally obtained evolutions with linear fits marked with solid black lines. Obtained values are equal to 1.1 and 5.5 for and , respectively. That is in a good agreement with theoretical calculations, which are discussed widely in the main article.
Knowing values of and , we are able to determine the -factor of top conduction band subband () from previously obtained -factor of the bright A exciton, X line, with the aid of formula: . We extracted that value is equal to 3.7.
Finally, taking -factor of the bright B exciton ( from Ref. 15, it is possible to determine the -factor of the bottom valence subband () using formula: . We found that value is equal to 2.9.
References
- (1) A. Castellanos-Gomez, M. Buscema, R. Molenaar, V. Singh, L. Janssen, H. S. J. van der Zant, and G. A. Steele, 2D Materials 1, 011002 (2014).
- (2) G. Kresse and J. Furthmüller, Phys. Rev. B 54, 11169 (1996).
- (3) G. Kresse and D. Joubert, Phys. Rev. B 59, 1758 (1999).
- (4) J. P. Perdew, A. Ruzsinszky, G. I. Csonka, O. A. Vydrov, G. E. Scuseria, L. A. Constantin, X. Zhou, and K. Burke, Phys. Rev. Lett. 100, 136406 (2008).
- (5) W. Schutte, J. De Boer, and F. Jellinek, Journal of Solid State Chemistry 70, 207 (1987).
- (6) A. Togo and I. Tanaka, Scr. Mater. 108, 1 (2015).
- (7) K. Parlinski, Z. Q. Li, and Y. Kawazoe, Phys. Rev. Lett. 78, 4063 (1997).
- (8) M. Gajdoš, K. Hummer, G. Kresse, J. Furthmüller, and F. Bechstedt, Phys. Rev. B 73, 045112 (2006).
- (9) M. Barbone, A. R. P. Montblanch, D. M. Kara, C. Palacios-Berraquero, A. R. Cadore, D. De Fazio, B. Pingault, E. Mostaani, H. Li, B. Chen, K. Watanabe, T. Taniguchi, S. Tongay, G. Wang, A. C. Ferrari, and M. Atatüre, Nature Communications 9, 3721 (2018).
- (10) S.-Y. Chen, T. Goldstein, T. Taniguchi, K. Watanabe, and J. Yan, Nature Communications 9, 3717 (2018).
- (11) Z. Li, T. Wang, Z. Lu, C. Jin, Y. Chen, Y. Meng, Z. Lian, T. Taniguchi, K. Watanabe, S. Zhang, D. Smirnov, and S.-F. Shi, Nature Communications 9, 3719 (2018).
- (12) M. Koperski, M. R. Molas, A. Arora, K. Nogajewski, M. Bartos, J. Wyzula, D. Vaclavkova, P. Kossacki, and M. Potemski, 2D Materials 6, 015001 (2019).
- (13) C. Robert, H. Dery, L. Ren, D. van Tuan, E. Courtade, M. Yang, B. Urbaszek, D. Lagarde, K. Watanabe, T. Taniguchi, T. Amand, and X. Marie, arXiv:2008.07464 [cond-mat.mtrl-sci] (2020).
- (14) M. Zinkiewicz, A. O. Slobodeniuk, T. Kazimierczuk, P. Kapuściński, K. Oreszczuk, M. Grzeszczyk, M. Bartos, K. Nogajewski, K. Watanabe, T. Taniguchi, C. Faugeras, P. Kossacki, M. Potemski, A. Babiński, and M. R. Molas, Nanoscale 12, 18153 (2020).
- (15) A. V. Stier, K. M. McCreary, B. T. Jonker, J. Kono, and S. A. Crooker, Nature Communications 7, 10643 (2016).