Reference wavelengths of Si ii, C ii, Fe i, and Ni ii for quasar absorption spectroscopy
Abstract
Wavelengths of absorption lines in the spectra of galaxies along the line-of-sight to distant quasars can be used to probe the variablility of the fine structure constant, , at high redshifts, provided that the laboratory wavelengths are known to better than 6 parts in 108, corresponding to a radial velocity of 20 ms-1. For several lines of Si ii, C ii, Fe i, and Ni ii, previously published wavelengths are inadequate for this purpose. Improved wavelengths for these lines were derived by re-analyzing archival Fourier transform (FT) spectra of iron hollow cathode lamps (HCL) and a silicon carbide Penning discharge lamp, and with new spectra of nickel HCLs. By re-optimizing the energy levels of Fe i, the absolute uncertainty of 13 resonance lines has been reduced by over a factor of 2. A similar analysis for Si ii gives improved values for 45 lines with wavelength uncertainties over an order of magnitude smaller than previous measurements. Improved wavelengths for 8 lines of Ni ii were measured and Ritz wavelengths from optimized energy levels determined for an additional 3 lines at shorter wavelengths. Three lines of C ii near 135 nm were observed using FT spectroscopy and the wavelengths confirm previous measurements.
keywords:
atomic data – methods: laboratory: atomic – ultraviolet: general1 Introduction
The study of absorption lines in the spectra of galaxies along the line-of-sight to distant quasars (quasi-stellar objects, QSO) can give important information about the abundances, ionization and kinematics of atoms within these galaxies. All of these studies require accurate wavelengths and oscillator strengths of atomic lines, but the most demanding requirements for accurate wavelengths come from the use of QSO absorption lines to study the variability of the fine structure constant, , at high redshifts. In these investigations, the wavelength separation of atomic lines in QSO absorption spectra at different redshifts are compared to laboratory values (Dzuba et al., 1999). Any dependence of these separations on the redshift could suggest that had a different value in the early Universe. While some studies have found a potential variation of with redshift (Murphy et al., 2003), others have found no change (Chand et al., 2006). The possible reported changes in are less than 1:105 and require the laboratory wavelengths to be known to a precision of better than 6 parts in 108 for a wide variety atomic species and wavelengths.
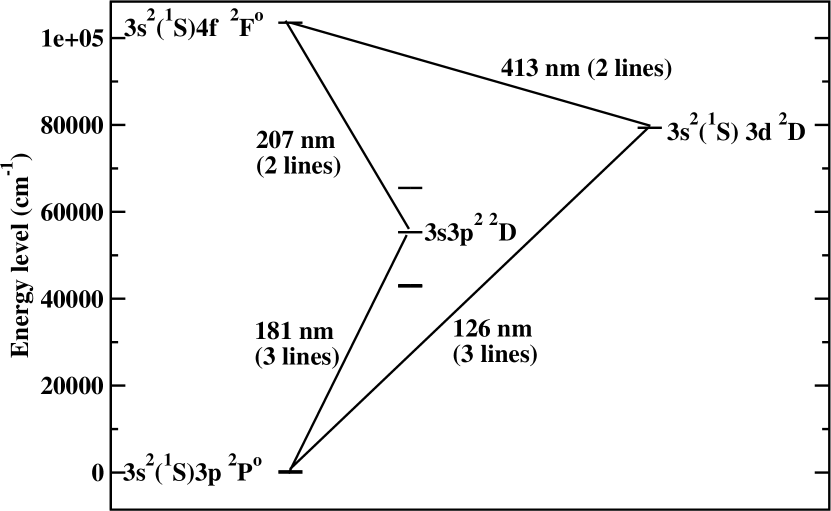
Papers by Murphy & Berengut (2014) and Berengut et al. (2009) include tables of spectral lines for which the laboratory wavelength uncertainties are inadequate for the study of QSO absorption lines, including resonance lines of Si ii, C ii, Fe i, and Ni ii. The wavelengths of some of these lines are below 130 nm and are too short for direct measurement using Fourier transform (FT) spectrometry. Improved wavelengths for both these lines and weaker lines at longer wavelengths can be obtained by using Ritz wavelengths (i.e. wavelengths derived from energy level differences) derived from energy levels optimized using FT spectrometry. For example, Fig. 1 shows how Ritz wavelengths can be used to derive the wavelength of the line of Si ii at 126 nm, using lines at 181 nm, 207 nm and 413 nm.
This paper presents improved wavelengths for resonance lines in Si ii, C ii, Fe i, and Ni ii derived from archival FT spectra and new measurements of nickel hollow cathode lamps (HCLs). The spectra were used in previous studies of Fe i and Fe ii (Nave et al., 1994; Nave & Johansson, 2013), silicon and carbon ions (Griesmann & Kling, 2000), and a large scale analysis of Ni ii that is currently in progress (Clear, 2018). The improved wavelengths were derived by assessing the calibration of the archival spectra and optimizing the atomic energy levels to derive Ritz wavelengths. Values for 45 lines of Si ii, 13 lines of Fe i, 11 lines of Ni ii, and three lines of C ii are presented with uncertainties up to an order of magnitude lower than previous values.
2 Experimental data and analysis
2.1 Si ii
The last comprehensive analysis of the spectrum of Si ii was by Shenstone (1961). Kaufman & Ward (1966) measured wavelengths of 5 vacuum ultraviolet (VUV) lines with an uncertainty of 7x10⁻⁵ nm in order to determine the ground state splitting and the value of the level. Their wavelength calibration was subsequently revised by Kaufman & Edlén (1974) (KE74) in their list of reference wavelengths of atomic spectra. They combined the Kaufman & Ward (1966) measurements with additional lines of Shenstone (1961) to obtain Ritz wavelengths of 16 lines in the VUV.
Griesmann & Kling (2000) published wavelengths of two lines of Si ii measured using FT spectroscopy of a Penning discharge source. Their spectra contain another 30 lines of Si ii that can be used to optimize the energy levels of Si ii and obtain Ritz wavelengths for lines that are too short to measure directly using FT spectroscopy. Five of these spectra were analyzed (see Table 1). All of the spectra were measured using the National Institute of Standards and Technology (NIST) FT700 FT spectrometer (Griesmann et al., 1999). The sources were either a HCL (Spectra 1,2, and 3 in Table 1) or a Penning discharge lamp (Spectra 4 and 5) with SiC cathodes run in either neon or argon. Three of the spectra (1, 2, and 3 in Table 1) covered the wavelength range 165 nm to 670 nm. These spectra contained the most important lines of Si ii and the Ar II reference wavenumbers of Whaling et al. (1995) between 434 nm and 515 nm.
Spectra recorded using FT spectroscopy are linear in wavenumber to better than 1 part in 107 and hence only one reference line is needed to put all of the wavenumbers on an absolute scale. In practice, many lines are usually used, preferably distributed throughout the spectrum in order to detect any small non-linearities in the wavenumber scale. A multiplicative correction factor, , is derived from these reference wavenumbers, , and the observed wavenumbers, , using:
| (1) |
This is then applied to the observed wavenumbers to obtain the corrected wavenumbers:
| (2) |
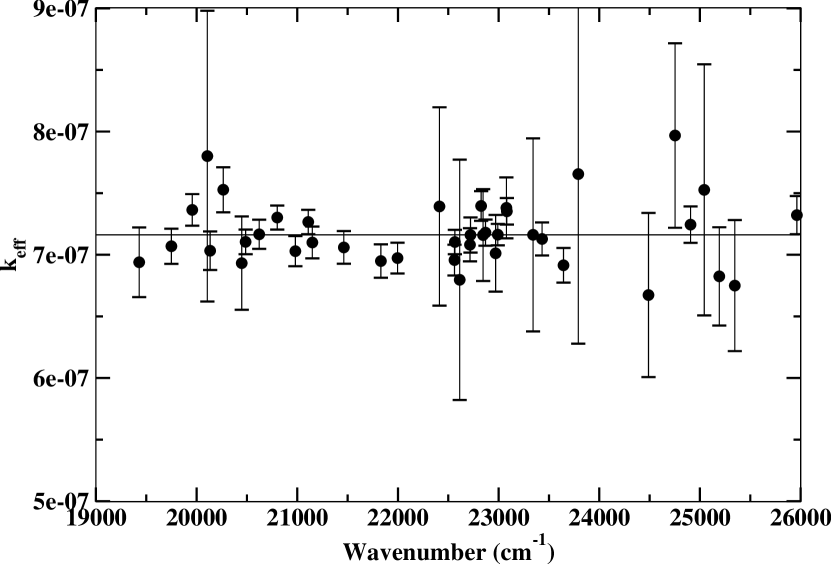
The wavenumbers in spectra 1, 2, and 3 in Table 1 were calibrated directly from the Ar II reference wavenumbers of Whaling et al. (1995) and an example calibration is shown in Fig. 2. Since all of the calibration lines are at wavenumbers below 26500 cm-1 (wavelengths above 377 nm), the calibration was confirmed with Si II lines at larger wavenumbers (Griesmann & Kling, 2000) to place an upper limit on any potential small slope in the calibration. The Si II lines agreed within 4 parts in 108 and this value was adopted as a minimum calibration uncertainty for all the spectra in Table 1.
| Ref. | Spectrum name | Spectral range | Gas | Pressure | Current | Detector | Filter | |
|---|---|---|---|---|---|---|---|---|
| No. | (cm-1) | (Pa) | (A) | |||||
| 1 | sic-290999.001 | 15 000 - 60 000 | Ar,Ne | 130 | 0.6 | (8.650.03)x10-7 | R106UH | none |
| 2 | sic-290999.002 | 15 000 - 60 000 | Ar,Ne | 140 | 0.7 | (7.230.03)x10-7 | R106UH | none |
| 3 | sic-290999.003 | 15 000 - 60 000 | Ar,Ne | 140 | 0.7 | (7.160.03)x10-7 | R106UH | none |
| 4 | sic-030999.012 | 52 000 - 77 000 | Ne | 1.2 | 2.0 | (18.50.05)x10-7 | R1259 | 160 nm |
| 5 | sic-030999.014 | 52 000 - 77 000 | Ne | 0.2 | 1.5 | (19.00.05)x10-7 | R1259 | 160 nm |
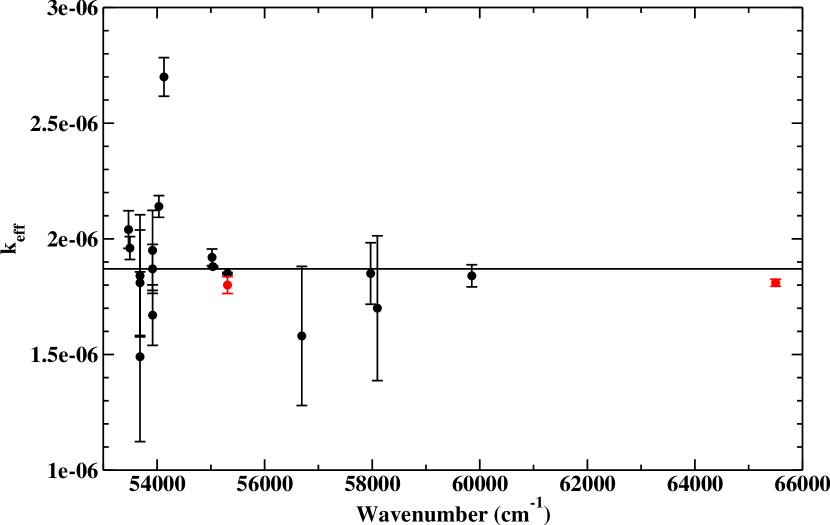
Spectra 4 & 5 in Table 1 cover the wavelength region 130 nm to 192 nm. The wavenumbers in these spectra were calibrated using lines measured in the other three spectra and Ritz wavenumbers of Si ii determined from lines measured in spectra 1, 2, and 3 in Table 1. An example calibration plot for spectrum 4 is shown in Fig. 3.
Optimized energy levels and Ritz wavelengths in Si ii were derived using the lopt computer program of Kramida (2011). Weights were assigned as the squared reciprocal of the uncertainty. This uncertainty was estimated by combining in quadrature the statistical measurement of the line’s position with the calibration uncertainty. The statistical uncertainty was estimated from the full width at half maximum, , the resolution, , and the signal-to-noise ratio, , using:
| (3) |
This was derived from equation 9.2 of Davis et al. (2001) with the geometrical factor, , and the number of independent points, . The weighted average and uncertainty of all measurements was taken, as described in Liggins et al. (2021).
The level optimization was carried out in two steps. First, the values of 22 energy levels were derived using 32 observed lines in the SiC Penning discharge. Ritz wavelengths were obtained for these lines and an additional 7 lines to the two levels of the ground term, . The FT spectra in Table 1 do not include any lines that can be used to derive the values of the or levels as all the strong lines from these levels lie below the wavelength limit for FT spectroscopy. However, improved values for these levels can be derived by including the grating wavelengths of KE74. By comparing the Ritz wavelengths from lopt with those of KE74, it was determined that their wavelengths should be reduced by nm in order to put them on the same wavelength scale as the FT spectra. Wavelengths for 4 lines near 119 nm and two lines near 130 nm were thus taken from KE74, reduced by nm, and included with the 32 lines from the FT spectra in a second level optimization. This determined the values of 25 levels in Si ii and Ritz wavelengths for 45 lines. The Ritz wavelengths are given in Table 2, with the corresponding energy levels in Table 3.
| Ritz air | Ritz vacuum | Ritz | Observed | Lower | Upper | Previous | Ref.c |
|---|---|---|---|---|---|---|---|
| wavelength | wavelengtha | wavenumbera | wavenumbera,b | level | level | wavelength | |
| (nm) | (nm) | (cm-1) | (cm-1) | (nm) | |||
| - | 98.987283 (3) | 101023.078 (3) | - | 98.98730 (10) | (1) | ||
| - | 99.2682467 (20) | 100737.1474 (21) | - | 99.26826 (10) | (1) | ||
| - | 102.069850 (10) | 97972.124 (9) | - | 102.06990 (10) | (2) | ||
| - | 102.369975 (10) | 97684.893 (9) | - | 102.37003 (10) | (2) | ||
| - | 119.041555 (14) | 84004.279 (10) | 84004.283d (14) | 119.04160 (10) | (2) | ||
| - | 119.328941 (14) | 83801.967 (10) | 83801.975d (14) | 119.32898 (10) | (2) | ||
| - | 119.449984 (14) | 83717.048 (10) | 83717.043d (14) | 119.45004 (10) | (2) | ||
| - | 119.739348 (14) | 83514.736 (10) | 83514.727d (14) | 119.73941 (10) | (2) | ||
| - | 126.042174 (7) | 79338.524 (4) | - | 126.04223 (10) | (2) | ||
| - | 126.473770 (5) | 79067.778 (3) | - | 126.47379 (10) | (2) | ||
| - | 126.500145 (6) | 79051.293 (4) | - | 126.50022 (10) | (2) | ||
| - | 130.437070 (15) | 76665.322 (9) | 76665.328d (12) | 130.43711 (10) | (2) | ||
| - | 130.927598 (15) | 76378.091 (9) | 76378.084d (12) | 130.92766 (10) | (2) | ||
| - | 152.670698 (6) | 65500.454 (3) | 65500.456e (5) | 152.670698 (2)f | (3) | ||
| - | 153.343135 (5) | 65213.2228 (22) | 65213.226e (5) | 153.34318 (10) | (2) | ||
| - | 171.083389 (22) | 58451.028 (8) | 58451.027 (9) | 171.0826 | (4) | ||
| - | 171.130279 (15) | 58435.013 (5) | 58435.012 (6) | 171.1296 | (4) | ||
| - | 180.801278 (7) | 55309.3437 (23) | 55309.342 (3) | 180.801288 (1)f | (3) | ||
| - | 181.692840 (6) | 55037.9422 (19) | 55037.942 (3) | 181.69290 (10) | (2) | ||
| - | 181.745112 (6) | 55022.1126 (19) | 55022.112 (3) | 181.74517 (10) | (2) | ||
| 205.86445 | 205.93032 (3) | 48560.116 (6) | 48560.119 (9) | 205.8646 | (4) | ||
| 205.90117 | 205.96704 (5) | 48551.457 (11) | 48551.476 (18) | 205.9014 | (4) | ||
| 207.201374 | 207.267492 (15) | 48246.833 (3) | 48246.832 (4) | 207.2016 | (4) | ||
| 207.269758 | 207.335890 (12) | 48230.917 (3) | 48230.917 (3) | 207.2701 | (4) | ||
| 233.44080 | 233.51239 (9) | 42824.280 (16) | 42824.272 (22) | 233.4404 | (4) | ||
| 233.46084 | 233.53244 (10) | 42820.604 (18) | 42820.604 (18) | 233.4606 | (4) | ||
| 234.42046 | 234.49227 (23) | 42645.33 (4) | 42645.33 (4) | 234.4203 | (4) | ||
| 235.01724 | 235.08918 (9) | 42537.049 (16) | 42537.060 (25) | 235.0174 | (4) | ||
| 290.42808 | 290.51316 (7) | 34421.848 (8) | 34421.852 (13) | 290.4283 | (4) | ||
| 290.56881 | 290.65393 (5) | 34405.177 (5) | 34405.180 (9) | 290.5692 | (4) | ||
| 333.31364 | 333.40951 (14) | 29993.146 (13) | 29993.151 (23) | 333.3139 | (4) | ||
| 333.98154 | 334.07758 (14) | 29933.167 (13) | 29933.165 (15) | 333.9819 | (4) | ||
| 385.366036 | 385.475318 (19) | 25941.9982 (13) | 25941.9980 (16) | 385.3664 | (4) | ||
| 385.601333 | 385.710675 (16) | 25926.1686 (11) | 25926.1686 (11) | 385.6017 | (4) | ||
| 386.259098 | 386.368612 (16) | 25882.0196 (10) | 25882.0194 (11) | 386.2595 | (4) | ||
| 407.54437 | 407.65943 (10) | 24530.280 (6) | 24530.277 (7) | 407.5451 | (4) | ||
| 407.67737 | 407.79247 (18) | 24522.277 (11) | 24522.266 (13) | 407.6781 | (4) | ||
| 412.805492 | 412.921940 (19) | 24217.6524 (11) | 24217.6524 (11) | 412.8067 | (4) | ||
| 413.088166 | 413.204688 (19) | 24201.0807 (11) | 24201.0807 (11) | 413.0893 | (4) | ||
| 504.102259 | 504.242828 (24) | 19831.7149 (10) | 19831.7147 (10) | 504.1026 | (4) | ||
| 505.598248 | 505.739215 (23) | 19773.0366 (9) | 19773.0366 (9) | 505.5981 | (4) | ||
| 505.63150 | 505.77247 (4) | 19771.7363 (17) | 19771.738 (3) | 505.6314 | (4) | ||
| 595.7555 | 595.9205 (3) | 16780.761 (9) | 16780.765 (14) | 595.7561 | (4) | ||
| 597.8925 | 598.0581 (3) | 16720.782 (9) | 16720.780 (12) | 597.8929 | (4) | ||
| 634.70935 | 634.88484 (6) | 15750.8880 (14) | 15750.8886 (15) | 634.7103 | (4) |
a One standard uncertainty in the last digits given in parenthesis. b Observed wavenumber is weighted average from spectra 1,2 & 3 in Table 1 unless marked. c (1)Kaufman & Ward (1966); (2) Kaufman & Edlén (1974) (KE74); (3) Griesmann & Kling (2000); (4) Shenstone (1961). d Observed wavenumber derived from the wavelength from KE74, reduced by 510-5 nm. e Observed wavenumber taken from spectrum 4 in Table 1. f See section 2.1.1 for discussion of this uncertainty.
| Configuration | Term | Level value | Unca | Number of |
|---|---|---|---|---|
| transitions | ||||
| (cm-1) | (cm-1) | |||
| 0.0000 | 3 | |||
| 287.231 | 0.003 | 6 | ||
| 42824.280 | 0.016 | 2 | ||
| 42932.56 | 0.04 | 1 | ||
| 43107.835 | 0.018 | 1 | ||
| 55309.3437 | 0.0023 | 7 | ||
| 55325.173 | 0.003 | 5 | ||
| 65500.454 | 0.003 | 3 | ||
| 76665.322 | 0.009 | 2b | ||
| 79338.524 | 0.004 | 3 | ||
| 79355.009 | 0.004 | 3 | ||
| 81191.3633 | 0.0025 | 4 | ||
| 81251.3419 | 0.0025 | 7 | ||
| 83801.967 | 0.010 | 2b | ||
| 84004.279 | 0.010 | 2b | ||
| 97972.124 | 0.009 | 2 | ||
| 101023.078 | 0.003 | 2 | ||
| 101024.379 | 0.003 | 1 | ||
| 103556.090 | 0.004 | 2 | ||
| 103556.176 | 0.004 | 2 | ||
| 103860.801 | 0.011 | 2 | ||
| 103885.289 | 0.007 | 2 | ||
| 111184.509 | 0.013 | 2 | ||
| 113760.186 | 0.006 | 2 | ||
| 113760.372 | 0.008 | 2 |
a One standard uncertainty of level value with respect to the ground level. b Level determined by lines taken from KE74
2.1.1 Comparison of Si ii wavelengths with previous results
Two of the lines in Table 2 are also reported by Griesmann & Kling (2000), who used some of the same spectra as this work. The wavelength of the line at 152.67 nm is the same as their value, but the observed wavelength of the line at 180.80 nm differs by nm, or 6 parts in 108. This discrepancy is 1.3 times the joint uncertainties of the values in Table 2 and is likely due to the use of a different set of spectra. Although the wavelengths reported by Griesmann & Kling (2000) have uncertainties as small as 5 parts in 109, this uncertainty is smaller than that of the Ar II wavenumber standards that they used to calibrate their wavenumber scale. Their uncertainties are thus likely to be underestimated. Their calibration uncertainty also does not account for any possible error in the transfer of the wavenumber calibration from the region of the Ar II lines near 450 nm down to the VUV. We regard the uncertainties of both the observed and Ritz wavelengths in Table 2 to be a more realistic estimate.
Ten of the 16 Si ii wavelengths in KE74 have new Ritz values derived from our FT spectra in Table 2, including the two lines near 152.67 nm and 180.80 nm reported by Griesmann & Kling (2000). Reader (2002) compared the wavelengths of Griesmann & Kling (2000) with those of KE74 for these two lines, finding that the two wavelength scales agree to nm, well within the quoted uncertainty of nm of KE74. Comparison of all ten Si ii lines shows that the wavelengths of KE74 are nm larger than the Ritz wavelengths derived from our FT spectra. This value was thus used to adjust the scale of the remaining six lines of KE74, and these lines were then incorporated into the final level optimization. The wavelength of the Si ii forbidden line at 34.8152 m was measured by Feuchtgruber et al. (1997) in planetary nebulae with the Short Wavelength Spectrometer on the Infrared Space Observatory. Their value corresponds to a fine structure interval in the ground term of 287.2310.005 cm-1, the same as the value in Table 3, but with a slightly larger uncertainty.
2.2 C ii
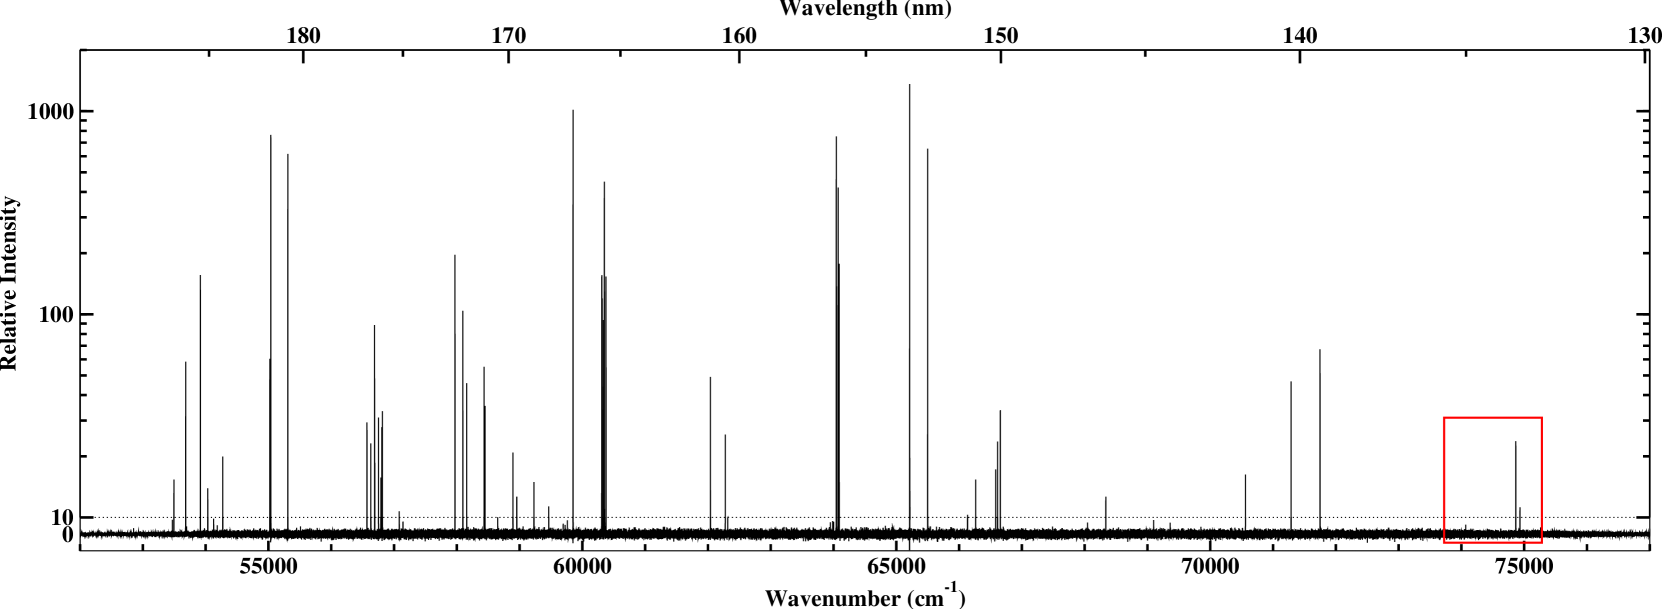
One of the spectra of the SiC Penning discharge included three strong lines near 133 nm due to C ii that had not been reported by Griesmann & Kling (2000) (see Fig. 4). This wavelength is shorter than previously reported using a transmissive beamsplitter in a FT spectrometer (Thorne, 1996) and approaches the 125 nm cut-off wavelength of the calcium fluoride beamsplitter in our instrument. These lines are probably enhanced in this spectrum by two factors. First, the spectrum of the SiC Penning discharge is relatively sparse, with less than 100 lines in the region from 130 nm to 187 nm. The spectral filling factor in equation 2 of Thorne (1996) is thus small compared to typical iron-group spectra containing several hundred lines in this range. Second, the noise from spectral lines outside the region of interest was eliminated by using a photomultiplier with a quantum efficiency of over 20 % at 135 nm and almost no response above 180 nm. The region was narrowed further by using a metal-dielectric reflection filter centered at 160 nm. The wavelengths and wavenumbers of the C ii lines are given in Table 4. The uncertainties are dominated by the statistical uncertainty of the measurement of the position of the line. This uncertainty is about 3 parts in 106 for the transition. An improved wavelength for this line can be determined by adding the wavenumber of the transition to the fine structure splitting of the ground term in C ii from Cooksy et al. (1986). The values agree with the measurements of Herzberg (1958) within the joint uncertainties.
| Observed | Observed | Lower | Upper | Previous a,b |
|---|---|---|---|---|
| wavenumbera | wavelengtha | level | level | wavelength |
| (cm-1) | (nm) | (nm) | ||
| 74866.651 (20) | 133.57082 (4) | 133.57077 (7) | ||
| 74869.20c(4) | 133.56626c(8) | 133.56625 (7) | ||
| 74932.60 (4) | 133.45326 (8) | 133.45323 (7) |
a One standard uncertainty in the last digits given in parenthesis.
b Previous wavelengths are from Herzberg (1958).
c Wavenumber and wavelength derived from line at 133.45 nm and the
ground term splitting of
63.3951 cm-1 from Cooksy
et al. (1986). The observed wavenumber is
74869.31 (23) cm-1, corresponding to a wavelength of 133.5661 (4) nm.
2.3 Fe i
The wavenumber calibration of the Fe i lines reported by Nave et al. (1994) has been revised by Nave & Sansonetti (2011), who recommended an increase in the wavenumbers in these papers of 10.6 parts in 108 in the ultraviolet and 6.7 parts in 108 in the visible and infrared. The measured wavenumbers in Nave et al. (1994) are given to 3 decimal places, with a conservative estimated uncertainty of 0.005 cm-1 for the strong lines. More accurate Ritz wavenumbers for the resonance lines in Fe i can be obtained from the original data by adjusting the wavenumber scale and re-optimizing the energy levels with improved techniques using the lopt computer code (Kramida, 2011).
New values for 829 levels in Fe i were derived from the wavenumbers of 9349 lines using the LOPT computer code of Kramida (2011). The weights and uncertainties used in the optimization were estimated in a similar way to the Si ii levels and full details are given in Nave & Sansonetti (2011). For the levels giving the strongest resonance lines observed in QSO absorption spectra, the uncertainty of the levels is dominated by the calibration uncertainty of 4:108. Table 5 presents the Ritz wavenumbers and uncertainties of 13 lines of most interest for QSO absorption line spectra (Murphy & Berengut, 2014). The wavenumbers are 1.06 parts in 107 larger than those from Nave et al. (1991) and Nave et al. (1994), as noted in Nave & Sansonetti (2011), and are the same as given in the NIST Atomic Spectra Database (Kramida et al., 2017), but with reduced uncertainties.
| Ritz Air a | Ritz vacuum a | Ritza | Observeda | Upper level | Previous a,c | Ref.d |
|---|---|---|---|---|---|---|
| wavelength | wavelength | wavenumber | wavenumber | wavenumber | ||
| (nm) | (nm) | cm-1 | cm-1 | (cm-1) | ||
| 385.991112 | 386.100556 (16) | 25899.9886 (10) | b | 25899.990 (5) | (2) | |
| 371.993443 | 372.099252 (15) | 26874.5501 (11) | b | 26874.551 (5) | (2) | |
| 344.060549 | 344.159159 (14) | 29056.3238 (12) | b | 29056.3240 (20) | (1) | |
| 302.063869 | 302.151846 (12) | 33095.9420 (13) | b | 33095.943 (5) | (2) | |
| 298.356948 | 298.444002 (12) | 33507.1234 (13) | b | 33507.125 (5) | (2) | |
| 296.689807 | 296.776446 (12) | 33695.3964 (14) | 33695.3957 (15) | 33695.399 (5) | (2) | |
| 271.902709 | 271.983269 (11) | 36766.9674 (15) | 36766.9670 (16) | 36766.9678 (20) | (1) | |
| 252.284917 | 252.360810 (10) | 39625.8040 (16) | 39625.8026 (17) | 39625.804 (5) | (2) | |
| 250.113178 | 250.188564 (10) | 39969.8524 (16) | 39969.8533 (17) | 39969.8522 (20) | (1) | |
| 248.327097 | 248.402069 (10) | 40257.3136 (16) | 40257.3113 (21) | 40257.320 (10) | (2) | |
| 246.264702 | 246.339197 (10) | 40594.4328 (16) | 40594.4331 (17) | 40594.4319 (20) | (1) | |
| 229.816879 | 229.887669 (9) | 43499.5057 (17) | 43499.5059 (18) | 43499.5065 (20) | (1) | |
| 216.677316 | 216.745313 (9) | 46137.0991 (19) | 46137.1008 (19) | 46137.1012 (20) | (1) |
2.4 Ni ii
Eleven Ni ii resonance lines have been previously identified as important for studies of the time-variation of the fine structure constant by Murphy & Berengut (2014). Seven lines, measured by Shenstone (1970) using grating spectroscopy, are of insufficient accuracy for fine structure studies. Pickering et al. (2000) reported four lines, measured using high-resolution FT spectroscopy of a nickel-neon HCL. The number and accuracy of all eleven resonance lines can now be improved using measurements from the comprehensive analysis recently completed by Clear (2018).
The new wavenumbers were measured in the spectrum of a nickel-helium HCL, recorded using the Imperial College VUV-FT spectrometer (Thorne et al., 1987). Observed and calculated Ritz wavenumbers for Ni ii from this term analysis are given in Table 6. Lines without observed wavelengths lie beyond the lower wavelength limit of the magnesium fluoride beam splitter used in the Imperial instrument (140 nm). Wavenumbers were calibrated against selected Ar II standards (Learner & Thorne, 1988), measured in the visible by Whaling et al. (1995), and the calibration propagated to the VUV by Ni lines in overlapping spectral regions. The wavenumber uncertainty of the observed lines is the addition in quadrature of the statistical uncertainty of the line position and the calibration uncertainty of its spectrum. Ritz wavelengths were calculated from energy levels optimised using the lopt code of Kramida (2011). A global calibration uncertainty, based on the uncertainty of the Ar II standard lines, was estimated to be 4 parts in and was set as the minimum uncertainty for all Ritz wavenumbers. Full details of the Ni ii spectra, calibration and term analysis are given in Clear (2018).
Our new wavenumbers and wavelengths for these lines are presented in Table 7. The uncertainties are at least an order of magnitude smaller than those previously measured using grating spectroscopy. The uncertainty of lines previously measured in FT spectra have decreased by roughly a factor of 2, due largely to the increase in signal-to-noise ratio of Ni ii lines measured in a HCL with helium as the carrier gas as opposed to neon used by Pickering et al. (2000).
| Ritz vacuum a | Ritza | Observeda | Upper level | Previous a | Ref.c |
|---|---|---|---|---|---|
| wavelength | wavenumber | wavenumber | wavenumber | ||
| (nm) | (cm-1) | (cm-1) | (cm-1) | ||
| 175.191553(7) | 57080.3778(23) | 57080.3777(21) | 57080.377(4)b | (1) | |
| 174.155319(7) | 57420.0091(23) | 57420.0100(21) | 57420.017(4)b | (1) | |
| 170.960430(7) | 58493.0678(23) | 58493.0671(21) | 58493.075(4)b | (1) | |
| 170.341227(7) | 58705.6944(23) | 58705.695(5) | 58705.711(15)b | (1) | |
| 150.215259(6) | 66571.133(3) | 66571.133(14) | 66571.25(5) | (2) | |
| 146.776033(6) | 68131.014(3) | 68131.010(14) | 68130.94(5) | (2) | |
| 146.726335(6) | 68154.091(3) | 68154.07(3) | 68154.01(5) | (2) | |
| 145.484653(6) | 68735.773(3) | 68735.78(1) | 68735.51(5) | (2) | |
| 139.332727(6) | 71770.648(3) | - | 71770.51(5) | (2) | |
| 137.013652(5) | 72985.428(3) | - | 72985.46(5) | (2) | |
| 131.722053(5) | 75917.432(3) | - | 75917.46(5) | (2) |
3 Conclusions
We have measured improved wavelengths for lines of Si ii, C ii, Fe i, and Ni ii of importance for detecting possible changes in the fine structure constant, , in the early Universe. The majority of the Ritz wavelengths have been derived from energy levels optimized using FT spectroscopy. The uncertainty of the Ritz wavelengths ranges from nm to nm, depending on the wavelength region. Comparison of the wavelength scales of the Si ii lines with KE74 shows that while their wavelengths agree within the joint uncertainties, better agreement is achieved by reducing their wavelengths by 510-5 nm. This was used to derive Ritz wavelengths and wavenumbers for an additional six lines of Si ii using their wavelengths. Wavelengths of three C ii lines near 135 nm have been measured in one FT spectrum that confirm the previous measurements of Herzberg (1958). The uncertainties of our new Ritz wavelengths for Fe i and Ni ii are over a factor of 2 lower than previous wavelengths measured using FT spectroscopy, and over a factor of 10 lower than those measured using grating spectroscopy.
Acknowledgements
This work was partly supported by NASA under interagency agreements NNH14AY78I and NNH17AE081, and the STFC of the UK.
Data Availability
The data underlying this article will be shared on reasonable request to the corresponding author.
References
- Berengut et al. (2009) Berengut J. C., Dzuba V. A., Flambaum V. V., King J. A., Kozlov M. G., Murphy M. T., Webb J. K., 2009, Mem. Soc. Astron. Ital., 80, 795
- Chand et al. (2006) Chand H., Srianand R., Petitjean P., Aracil B., Quast R., Reimers D., 2006, A&A, 451, 45
- Clear (2018) Clear C., 2018, PhD thesis, Imperial College London
- Cooksy et al. (1986) Cooksy A. L., Blake G. A., Saykally R. J., 1986, ApJ, 305, L89
- Davis et al. (2001) Davis S. P., Abrams M. C., Brault J. W., 2001, Fourier transform spectrometry. Academic Press
- Dzuba et al. (1999) Dzuba V. A., Flambaum V. V., Webb J. K., 1999, Phys. Rev. Lett., 82, 888
- Feuchtgruber et al. (1997) Feuchtgruber H., et al., 1997, ApJ, 487, 962
- Griesmann & Kling (2000) Griesmann U., Kling R., 2000, ApJ, 536, L113
- Griesmann et al. (1999) Griesmann U., Kling R., Burnett J. H., Bratasz Ł., 1999, in Carruthers G. R., Dymond K. F., eds, Ultraviolet Atmospheric and Space Remote Sensing: Methods and Instrumentation II Vol. 3818, Ultraviolet Atmospheric and Space Remote Sensing: Methods and Instrumentation II. SPIE, pp 180 – 188
- Herzberg (1958) Herzberg G., 1958, Proc. R. Soc. London, Ser. A, 248, 309
- Kaufman & Edlén (1974) Kaufman V., Edlén B., 1974, J. Phys. Chem. Ref. Data, 3, 825
- Kaufman & Ward (1966) Kaufman V., Ward J. F., 1966, J. Opt. Soc. Am., 56, 1591
- Kramida (2011) Kramida A. E., 2011, Comput. Phys. Commun., 182, 419
- Kramida et al. (2017) Kramida A., Ralchenko Y., Reader J., NIST ASD Team 2017, NIST Atomic Spectra Database (version 5.4), http://physics.nist.gov/asd
- Learner & Thorne (1988) Learner R. C. M., Thorne A. P., 1988, J. Opt. Soc. Am. B, 5, 2045
- Liggins et al. (2021) Liggins F., Pickering J., Nave G., Ward J., Tchang-Brillet W.-Ü L., 2021, ApJS
- Murphy & Berengut (2014) Murphy M. T., Berengut J. C., 2014, MNRAS, 438, 388
- Murphy et al. (2003) Murphy M. T., Webb J. K., Flambaum V. V., 2003, MNRAS, 345, 609
- Nave & Johansson (2013) Nave G., Johansson S., 2013, ApJS, 204, 1
- Nave & Sansonetti (2011) Nave G., Sansonetti C. J., 2011, J. Opt. Soc. Am. B, 28, 737
- Nave et al. (1991) Nave G., Learner R. C. M., Thorne A. P., Harris C. J., 1991, J. Opt. Soc. Am. B, 8, 2028
- Nave et al. (1994) Nave G., Johansson S., Learner R. C. M., Thorne A. P., Brault J. W., 1994, ApJS, 94, 221
- Pickering et al. (2000) Pickering J. C., Thorne A. P., Murray J. E., Litzén U., Johansson S., Zilio V., Webb J. K., 2000, MNRAS, 319, 163
- Reader (2002) Reader J., 2002, Metrologia, 39, 391
- Shenstone (1961) Shenstone A. G., 1961, Proc. R. Soc. London, Ser. A, 261, 153
- Shenstone (1970) Shenstone A., 1970, J. Res. Natl. Bur. Stand. (U.S.), Sect. A, 74A, 801
- Thorne (1996) Thorne A., 1996, Phys. Scr., T65, 31
- Thorne et al. (1987) Thorne A. P., Harris C. J., Wynne-Jones I., Learner R. C. M., Cox G., 1987, Journal of Physics E: Scientific Instruments, 20, 54
- Whaling et al. (1995) Whaling W., Anderson W. H. C., Carle M. T., Brault J. W., Zarem H. A., 1995, J. Quant. Spectrosc. Radiat. Transfer, 53, 1