Tidally Excited Modes and Scuti Pulsations in the Eclipsing Triple Star IM Persei
Abstract
IM Per is a triple star system whose eclipsing pair masses and radii are accurate to within 1 %. The TESS light curve of the program target exhibits partial eclipses and multiple oscillations with mmag-level amplitudes. It is found that the oscillations affect eclipse timing measurements. Binary modeling of the high-quality TESS data indicates that the eclipsing components of the triple system are twin dwarfs with parameters of / = 0.995, / = 0.901, and (–) = 12 K in an eccentric ( = 0.049), detached configuration. The third light of = 0.054 may mostly come from a G-type tertiary companion. Our predicted parallax of 1.52 0.09 mas is concurrent with the Gaia measurement of 1.52 0.05 mas. Multifrequency analysis of the outside-eclipse residuals reveals 22 significant pulsation signals: four in the gravity-mode region (0.032.22 day-1) and 18 in the pressure-mode region (9.1925.12 day-1). Of the low frequencies, and are orbital harmonics that can be identified as tidally excited modes. The pulsation periods and constants for the high frequencies, and the position in the Cepheid instability strip demonstrate that the pulsating component of IM Per is a Sct variable.
1 INTRODUCTION
To understand stellar physics in detail, it is essential to robustly determine fundamental stellar parameters. Today we know there are at least twice as many binary and multiple stars as there are single stars (Duchêne & Kraus 2013; Murphy et al. 2018), and investigations of their features and behavior continue. In eclipsing binaries (EBs), the masses and radii of each component can be measured using high-precision light curves and double-lined radial velocities (RVs) to within an uncertainty of less than 1 %, without any assumptions (Torres et al. 2010; Southworth 2015). Such precise measurements allow us to calibrate stellar evolution models. At the same time, stellar pulsations can help reveal the interior structure of stars, from their core to surface layers. As a result, because EBs with pulsating components provide reciprocal information on both stellar structures and fundamental properties, they are excellent targets for asteroseismic modeling. The pulsations in EBs may be influenced by tidal interaction and mass accretion between the binary components (Hambleton et al. 2013; Mkrtichian et al. 2018; Bowman et al. 2019).
Data from space photometry such as Kepler (Koch et al. 2010) and TESS (Ricker et al. 2015) is ten to hundred times more precise than ground-based photometry. For example, time-series data from space missions exhibit multifrequency oscillations with amplitudes down to the micromagnitude (mag) level, which were undetectable from the ground (e.g., Lee et al. 2020; Southworth et al. 2020). This is the second paper looking for and characterizing pulsation signals in double-lined detached EBs using high-quality TESS photometry (Lee & Hong 2020). Here, we report that IM Per (TIC 117175528; Gaia DR2 445958725070708864; TYC 3323-1123-1; = 11.36, = 0.78) has a benchmark EB displaying both tidally excited modes and Sct pulsations. For the star system, Lacy et al. (2015) obtained -band light curves and double-lined RVs from echelle spectra. These observations and eclipse timings were combined to determine the apsidal motion elements and absolute dimensions of the eclipsing pair for the first time. The fundamental properties were best-fitted to a 1.2-Gyr isochrone with [Fe/H] = 0.22. They reported that the program target was composed of a close EB with a period of 2.254 days and a faint third companion barely detected in the spectra.
This study is organized as follows. The TESS photometry and times of eclipse are reported in Section 2. Sections 3 and 4 detail the binary modeling and multifrequency analysis, respectively. The summary and discussion of our results are given in Section 5.
2 OBSERVATIONS AND ECLIPSE TIMINGS
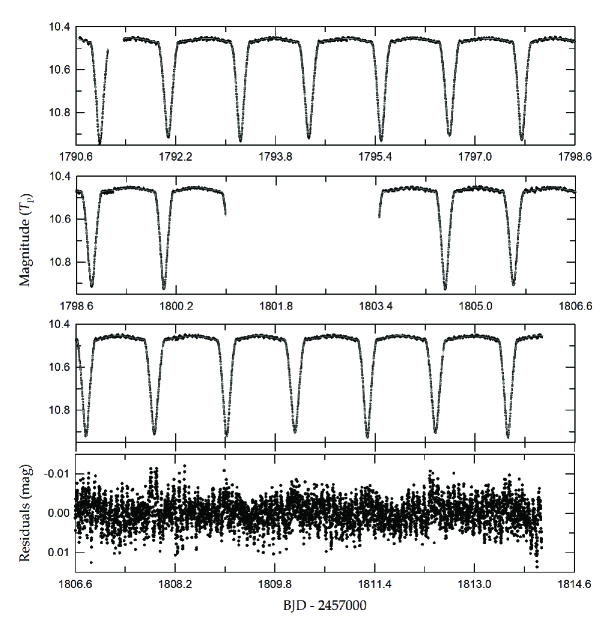
The high-precision photometry of IM Per was taken in a 2-min cadence mode during Sector 18 of the TESS mission (Ricker et al. 2015). The time-series data were collected by camera 2 from 2019 November 3 to 27 (BJD 2,458,790.66 2,458,814.08). We obtained the flux measurements labelled SAP-FLUX (simple aperture photometry) and PDCSAP-FLUX (pre-search data conditioning) from the MAST Portal111https://mast.stsci.edu/portal/Mashup/Clients/Mast/Portal.html. Trends in the raw observations were removed by applying a least-squares spline fit to each outside-eclipse light curve of two segments separated by a data gap in the midpoint. The normalized fluxes were transformed to magnitudes by utilizing a TESS magnitude of = 10.462 (Stassun et al. 2019). The resultant SAP data is presented in Figure 1 as magnitude versus BJD, where short-period oscillations are clearly visible in the outside eclipses. Both the SAP and PDC light curves were examined during our data modeling process, and the results were consistent with each other within their error bars. In this article, we present the results from the SAP data because of systematic effects somewhat smaller than the PDC data.
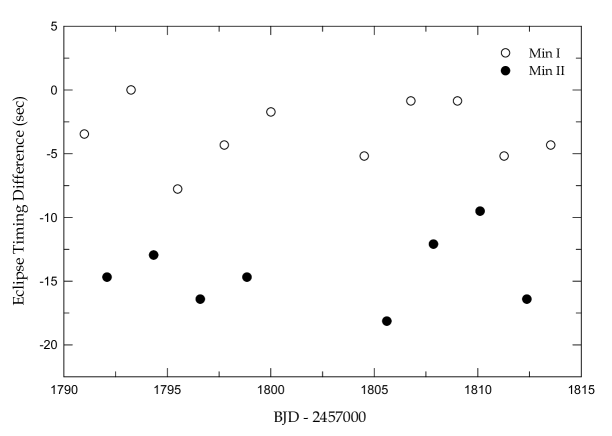
The times of the IM Per eclipses and their errors were derived from individual measurements of the SAP data using the method of Kwee & van Woerden (1956). The TESS timings are given in Table 1, where Min I and Min II denote the primary and secondary minimum epochs, respectively. As displayed in Figure 1 and presented in the next sections, our target star is an oscillating EB showing multiperiodic pulsations. The pulsation features may cause changes in the eclipse curves, so the mid-eclipse timings could be shifted from the real conjunctions. To check this possibility, we recomputed the timings of minimum light from each eclipse after subtracting all pulsation modes extracted in Section 4 from the observed data. These are listed in columns (4)(5) of Table 1. As shown in the last column of this table, the differences between the minimum times measured from both datasets are all negative except for one (BJD 2,458,793.24138). Further, we can see in Figure 2 that these differences are about 11 sec larger on average in the secondary eclipses (Min II) than in the primary eclipses (Min I). These results indicate that the eclipse timings calculated from the pulsation-subtracted data are later than those from the observed data, and that the timing differences could mainly be caused by multiperiodic oscillations in the eclipsing pair of IM Per.
We obtained the linear ephemeris of the EB system using ten new primary minima in a least-squares solution, as follows:
| (1) |
where the 1-error values follow each coefficient. The ephemeris is used to calculate the orbital phases of the TESS observations. The eclipsing period corresponds to a frequency of = 0.443610 0.000002 day-1.
3 BINARY MODELING
The TESS time-series data in Figure 1 displays the partial eclipses of both minima, and the short-term oscillations in 13 hours in the out-of-eclipse parts. The secondary minima are displaced to an orbital phase of around 0.486. The high-quality light curve of IM Per was fitted using the Wilson-Devinney (W-D) model (Wilson & Devinney 1971; van Hamme & Wilson 2007) in the same scheme as that for the pulsating EB CW Cep (Lee & Hong 2020). For this synthesis, the mass ratio of the EB and the surface temperature of the primary star eclipsed at Min I were set to be = 0.9948 0.0033 and = 7,580 150 K, respectively, from the spectroscopic measurements of Lacy et al. (2015). We adopted a logarithmic limb-darkening (LD) law for the binary components. The LD coefficients of , , , and were initialized from the values of van Hamme (1993). The albedos and gravity-darkening exponents were given as = = 1.0 (Rucinski 1969) and = = 1.0 (von Zeipel 1924) according to the temperature of each component. The synchronous rotations of = = 1.0 were used throughout our analysis process.
The free parameters in our modeling were the reference time () and the eclipsing period (), the inclination angle (), the orbital eccentricity () and the argument of periastron (), the secondary’s temperature (), the dimensionless potentials (, ), the passband luminosity () and third light (), and the linear LD coefficients (, ). The initial values for , , , , and were adopted from Lacy et al. (2015). The light curve modeling was carried out for both datasets: the observed and pulsation-subtracted data. The modeling results are shown in Table 2 and the synthetic light curves calculated from the observed data appear as gray lines in Figure 1. The residuals between the observations and the eclipse model are displayed in the bottom panel of the figure. The uncertainties of the fitted parameters were estimated according to the method used by Southworth et al. (2020) for the TESS data. We first calculated various alternative models with different approaches and treatments for the W-D parameters (, , , , , , , ), and then obtained the parameter errors from the differences between these models and our solutions in Table 2 (Lee & Hong 2020).
The absolute dimensions of IM Per were computed from our Model 2 parameters for the pulsation-subtracted data and the velocity semi-amplitudes ( = 123.17 0.30 km s-1 and = 123.80 0.28 km s-1) of Lacy et al. (2015). In this calculation, we adopted the bolometric magnitudes of ⊙ = +4.73 and the effective temperature of ⊙ = 5780 K for Sun. The bolometric corrections (BCs) were used from the BC relation of Torres (2010). The fundamental parameters of each component star are listed in Table 3, along with the measurements of Lacy et al. (2015) for comparison. There is a good agreement between these two.
The distance () to our program target can be determined using the distance modulus of , where is the apparent magnitude and 3.1 is the interstellar extinction. Following the procedure done by Lee & Hong (2020), we obtained the Johnson = +11.29 0.10 and () = +0.66 0.14 from the Tycho-2 magnitudes (Høg et al. 2000), and the intrinsic ()0 = +0.23 0.03 from the colortemperature relation (Flower 1996). Then, () = +0.43 0.14. Because is the visual magnitude of the triple system including the tertiary component, we derived = +11.33 for the eclipsing pair of IM Per considering the third light ( = 0.033) of Lacy et al. (2015) in the band, instead of using ours ( = 0.054) from the TESS band. The distance of 660 40 pc was finally determined. This is 94 61 pc farther than the distance reported by Lacy et al. (2015), but is well matched with 659 22 pc taken by the Gaia parallax of 1.517 0.050 mas (Gaia Collaboration et al. 2018).
4 PULSATIONAL CHARACTERISTICS
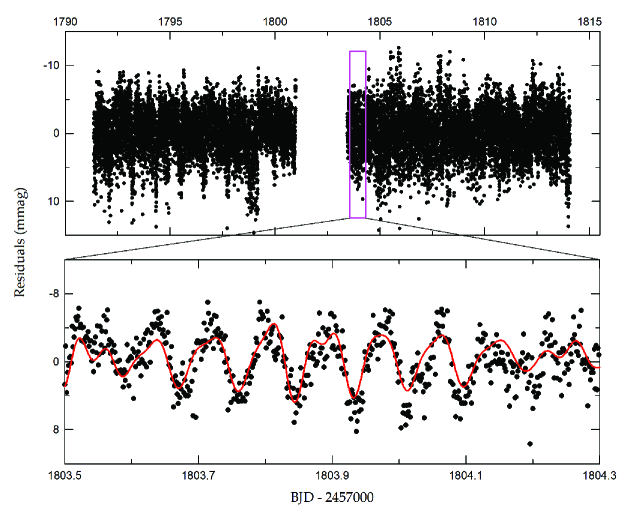
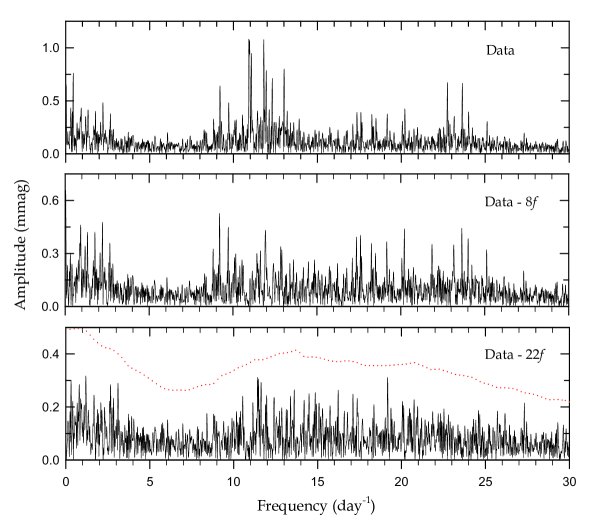
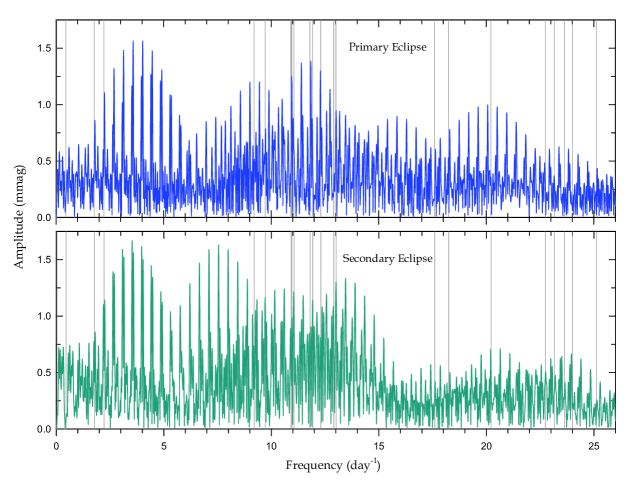
The eclipsing components of IM Per are located inside the Sct region of the Cepheid instability strip on the HR diagram (cf. Lee et al. 2016). Figure 3 shows the residual light curve after removing the binary effects of Model 1 in Table 2 from the observed data, which indicates the presence of periodic oscillations with millimagnitude (mmag) level amplitudes. To search for the multiperiodic frequencies in our target star, the PERIOD04 software of Lenz & Breger (2005) was used for the out-of-eclipse part (phases 0.0660.414 and 0.5580.934) of the light residuals in the frequency range of 0360 day-1. We extracted 22 significant frequencies based on the iterative prewhitening method (Lee et al. 2014) and the classical criterion of S/N4.0 (Breger et al. 1993). The results are listed in Table 4, where S/N is the signal to noise amplitude ratio for individual frequencies. The uncertainties for frequency, amplitude, and phase were obtained according to Kallinger et al. (2008). The Fourier fit on the outside-eclipse data was presented as a red curve in Figure 3. The amplitude spectra for IM Per from PERIOD04 are illustrated in Figure 4. There were no frequency signals satisfying our criterion at frequencies higher than 30 day-1.
The Rayleigh frequency resolution for the TESS observations used is = 1/ = 0.043 day-1, where the time span of the data is = 22.7 days. We used the frequency separation of to find possible multiples and combinations with the extracted frequencies. The results of this process are presented in the last column of Table 4. Frequencies , , and are the orbital frequency () and its multiples, where = 0.0018 day-1 and = 0.0061 day-1 are significantly smaller than the Rayleigh criterion . The former frequency can be caused by imperfect light curve modeling and the other two may be the pulsations excited by tidal forces in eccentric binary systems (Welsh et al. 2011; Thompson et al. 2012; Hambleton et al. 2013). The lowest frequency appear to be a combination term between and . From the remaining 18 frequencies and the absolute parameters of the primary component, we got the pulsation constants () shown in the sixth column of Table 6. The values are in a range of 0.0140.037 days and correspond to the pressure-mode oscillations of Sct stars with pulsation constants below 0.04 days (Breger 2000).
5 SUMMARY AND DISCUSSION
In this article, we aimed to find and characterize the pulsating features present in a best-studied system, using TESS photometric observations of IM Per. The following interesting results were obtained.
-
1.
The time-series data of the program target, observed during Sector 18, exhibit partial eclipses and multiperiodic oscillations with mmag-level amplitudes. We applied our binary modeling separately to the observed and pulsation-subtracted data. Agreement between them (Model 1 and Model 2) is very good, which means that the light curve parameters are not significantly dependent on these pulsations. IM Per is a triple star system with an eccentric detached EB, whose primary and secondary components fill 67.8 % and 62.5 % of their inner critical Roche lobes, respectively. The chief source of = 0.0540.008 may be a G-type tertiary component, as directly observed in the echelle spectra of Lacy et al. (2015).
-
2.
The absolute parameters of the inner close pair were obtained by combining our photometric solutions and the spectroscopic orbits (, ) of Lacy et al. (2015). As a result, the masses and radii of each star were measured with 1.0 % or better precision. The eclipsing components of IM Per are twin dwarf stars with spectral types of about A7 (Pecaut & Mamajek 2013) and located in the Sct instability region (Lee et al. 2016). The EB-based parallax of 1.515 0.092 mas calculated from our distance (660 40 pc) is in excellent agreement with the Gaia measurements of 1.517 0.050 mas (Gaia Collaboration et al. 2018).
-
3.
A multifrequency analysis was applied to the out-of-eclipse part of the residual light curve removing the binary effects. We detected 22 frequency signals using the iterative prewhitening procedure and the S/N threshold. Among them, and may come from incomplete binary modeling and a difference of , respectively. and are thought to be tidal excited pulsations. The other frequencies, their pulsation constants, and the position of the EB components on the HR diagram demonstrate that the oscillating component of IM Per is a Sct-type pulsator.
To find out which component the observed pulsations of IM Per originated from, we examined the residual light curves during the times of the primary and secondary eclipses, respectively. Figure 5 show the amplitude spectra for the two cases from the PERIOD04 program. In the figure, there are strong alias frequencies, caused by using only in-eclipse data, and spaced by approximately . The frequencies and amplitudes from the in-eclipses may be affected by the partial eclipse and its relatively short duration in the system. We found no conspicuous difference between the amplitude spectra of both eclipses in the pulsation frequencies extracted from the outside-eclipse data. At present, it is hard to ascertain which star is pulsating because the binary components of IM Per have the same physical properties. Future high-resolution spectra are required to reveal the main source of the multiperiodic pulsations from the changes in RVs and line profiles.
References
- Bowman et al (2019) Bowman, D. M., Johnston, C., Tkachenko, A., et al. 2019, ApJL, 883, L26
- Breger (2000) Breger, M. 2000, in ASP Conf. Ser. 210, Delta Scuti and Related Stars, ed. M. Breger, & M. H. Montgomery (San Francisco, CA: ASP), 3
- Breger et al (1993) Breger, M., Stich, J., Garrido, R., et al. 1993, A&A, 271, 482
- Duchene & Kraus (2013) Duchêne, G., & Kraus, A. 2013, ARA&A, 51, 269
- Flower (1996) Flower, P. J. 1996, ApJ, 469, 355
- GAIA (2016) Gaia Collaboration, Brown, A. G. A., Vallenari, A., et al. 2018, A&A, 616, A1
- Hambleton et al (2013) Hambleton, K. M., Kurtz, D. W., Prša, A., et al. 2013, MNRAS, 434, 925
- Høg (2000) Høg, E., Fabricius, C., Makarov, V. V., et al. 2000, A&A, 355, 27
- Kallinger et al (2008) Kallinger, T., Reegen, P., & Weiss, W. W. 2008, A&A, 481, 571
- Koch et al (2010) Koch, D. G., Borucki, W. J., Basri, G., et al. 2010, ApJL, 713, L79
- Kwee & van Woerden (1956) Kwee, K. K., & van Woerden, H. 1956, BAN, 12, 327
- Lacy et al (2015) Lacy, C. H. S., Torres, G., Fekel, F. C., Muterspaugh, M. W., & Southworth, J. 2015, AJ, 149, 34
- Lee & Hong (2020) Lee, J. W., & Hong, K. 2020, AJ, in press (arXiv:2010.03711)
- Lee et al (2016) Lee, J. W., Hong, K., Kim, S.-L., & Koo, J.-R. 2016, MNRAS, 460, 4220
- Lee et al (2020) Lee, J. W., Hong, K., Koo, J.-R., & Park, J.-H. 2020, AJ, 159, 24
- Lee et al (2014) Lee, J. W., Kim, S.-L., Hong, K., Lee, C.-U., & Koo, J.-R. 2014, AJ, 148, 37
- Lenz & Breger (2005) Lenz, P., & Breger, M. 2005, Comm. Asteroseismology, 146, 53
- Mkrtichian et al (2018) Mkrtichian, D. E., Lehmann, H., Rodríguez, E., et al. 2018, MNRAS, 475, 4745
- Murphyz et al (2018) Murphy, S. J., Moe, M., Kurtz, D. W., et al. 2018, MNRAS, 474, 4322
- Pecaut & Mamajek (2013) Pecaut, M. J., & Mamajek, E. E. 2013, ApJS, 208, 9
- Ricker et al (2015) Ricker, G. R., Winn, J. N., Vanderspek, R., et al. 2015, JATIS, 1, 014003
- Rucinski (1969) Rucinski, S. M. 1969, Acta. Astron., 19, 125
- Southworth (2015) Southworth, J. 2015, in ASP Conf. Ser. 496, Living Together: Planets, Host Stars and Binaries, ed. S. M. Rucinski, G. Torres, & M. Zejda (San Francisco, CA: ASP), 164
- Southworth et al (2020) Southworth, J., Bowman, D. M., Tkachenko, A., & Pavlovski, K. 2020, MNRAS, 497, L19
- Stassun et al (2019) Stassun, K. G., Oelkers, R. J., Paegert, M., et al. 2019, AJ, 158, 138
- Thompson et al (2012) Thompson, S. E., Everett, M., Mullally, F., et al. 2012, ApJ, 753, 86
- Torres (2010) Torres, G. 2010, AJ, 140, 1158
- Torres et al (2010) Torres, G., Andersen, J., & Giménez, A. 2010, A&AR, 18, 67
- Van Hamme (1993) Van Hamme, W. 1993, AJ, 106, 209
- Van Hamme & Wilson (2007) Van Hamme, W., & Wilson, R. E. 2007, ApJ, 661, 1129
- Von Zeipel (1924) Von Zeipel, H. 1924, MNRAS, 84, 665
- Welsh et al (2011) Welsh, W. F., Orosz, J. A., Aerts, C., et al. 2011, ApJS, 197, 4
- Wilson & Devinney (1971) Wilson, R. E., & Devinney, E. J. 1971, ApJ, 166, 605
| Observed Data | Pulsation-subtracted Data | Differencea | |||
|---|---|---|---|---|---|
| BJD | Error | Min | BJD | Error | |
| 2,458,790.98754 | 0.00012 | I | 2,458,790.98758 | 0.00013 | 0.00004 |
| 2,458,792.08208 | 0.00007 | II | 2,458,792.08225 | 0.00007 | 0.00017 |
| 2,458,793.24138 | 0.00011 | I | 2,458,793.24138 | 0.00009 | 0.00000 |
| 2,458,794.33614 | 0.00006 | II | 2,458,794.33629 | 0.00006 | 0.00015 |
| 2,458,795.49569 | 0.00008 | I | 2,458,795.49578 | 0.00010 | 0.00009 |
| 2,458,796.59026 | 0.00006 | II | 2,458,796.59045 | 0.00006 | 0.00019 |
| 2,458,797.74978 | 0.00008 | I | 2,458,797.74983 | 0.00006 | 0.00005 |
| 2,458,798.84475 | 0.00012 | II | 2,458,798.84492 | 0.00011 | 0.00017 |
| 2,458,800.00414 | 0.00007 | I | 2,458,800.00416 | 0.00006 | 0.00002 |
| 2,458,804.51250 | 0.00007 | I | 2,458,804.51256 | 0.00008 | 0.00006 |
| 2,458,805.60703 | 0.00011 | II | 2,458,805.60724 | 0.00008 | 0.00021 |
| 2,458,806.76675 | 0.00007 | I | 2,458,806.76676 | 0.00008 | 0.00001 |
| 2,458,807.86143 | 0.00009 | II | 2,458,807.86157 | 0.00011 | 0.00014 |
| 2,458,809.02114 | 0.00006 | I | 2,458,809.02115 | 0.00006 | 0.00001 |
| 2,458,810.11554 | 0.00006 | II | 2,458,810.11565 | 0.00007 | 0.00011 |
| 2,458,811.27524 | 0.00007 | I | 2,458,811.27530 | 0.00007 | 0.00006 |
| 2,458,812.36994 | 0.00011 | II | 2,458,812.37013 | 0.00009 | 0.00019 |
| 2,458,813.52961 | 0.00008 | I | 2,458,813.52966 | 0.00008 | 0.00005 |
| Parameter | Model 1a | Model 2b | |||
|---|---|---|---|---|---|
| Primary | Secondary | Primary | Secondary | ||
| (BJD) | 2,458,799.988284(89) | 2,458,799.988413(78) | |||
| (day) | 2.254226(26) | 2.254231(23) | |||
| 0.9949(33) | 0.9949(33) | ||||
| 0.0489(13) | 0.0491(10) | ||||
| (deg) | 117.40(85) | 117.13(52) | |||
| (deg) | 83.94(12) | 83.927(68) | |||
| (K) | 7580(150) | 7572(150) | 7580(150) | 7568(150) | |
| 5.521(26) | 5.987(53) | 5.521(23) | 5.987(46) | ||
| c | 3.742 | 3.742 | |||
| 1.0 | 1.0 | 1.0 | 1.0 | ||
| 1.0 | 1.0 | 1.0 | 1.0 | ||
| , | 0.671, 0.195 | 0.671, 0.195 | 0.671, 0.195 | 0.671, 0.195 | |
| , | 0.491(48), 0.210 | 0.457(51), 0.210 | 0.493(28), 0.210 | 0.451(35), 0.210 | |
| /(++) | 0.520(14) | 0.426 | 0.5194(97) | 0.4268 | |
| d | 0.054(12) | 0.0538(75) | |||
| (pole) | 0.2221(14) | 0.2007(28) | 0.2221(12) | 0.2008(21) | |
| (point) | 0.2304(16) | 0.2061(32) | 0.2304(14) | 0.2061(23) | |
| (side) | 0.2246(15) | 0.2024(29) | 0.2246(13) | 0.2024(21) | |
| (back) | 0.2286(16) | 0.2051(31) | 0.2286(14) | 0.2051(23) | |
| (volume)e | 0.2252(15) | 0.2028(30) | 0.2252(13) | 0.2028(23) | |
| Parameter | Lacy et al. (2015) | This Paper | |||
|---|---|---|---|---|---|
| Primary | Secondary | Primary | Secondary | ||
| () | 1.78310.0094 | 1.77410.0097 | 1.78730.0090 | 1.77820.0091 | |
| () | 2.4090.018 | 2.3660.017 | 2.4860.015 | 2.2390.025 | |
| (cgs) | 3.92580.0067 | 3.93940.0068 | 3.89900.0057 | 3.98780.0098 | |
| () | 0.11650.0022 | 0.15870.0055 | |||
| (K) | 7580150 | 7570160 | 7580150 | 7568150 | |
| () | 1.2350.035 | 1.2170.036 | 1.2620.035 | 1.1680.036 | |
| (mag) | 1.6630.088 | 1.7080.091 | 1.5750.087 | 1.8090.089 | |
| BC (mag) | 0.0330.003 | 0.0330.003 | |||
| (mag) | 1.5570.086 | 1.6020.090 | 1.5420.087 | 1.7760.089 | |
| Distance (pc) | 56646 | 66040 | |||
| Frequency | Amplitude | Phase | S/Nb | Remark | ||
|---|---|---|---|---|---|---|
| (day-1) | (mmag) | (rad) | (days) | |||
| 10.91420.0019 | 0.730.16 | 4.750.62 | 8.10 | 0.031 | ||
| 10.95600.0013 | 1.060.16 | 6.210.43 | 11.65 | 0.031 | ||
| 13.01290.0018 | 0.820.17 | 5.670.61 | 8.21 | 0.026 | ||
| 0.45150.0030 | 0.620.21 | 0.091.00 | 5.04 | |||
| 12.30820.0020 | 0.740.17 | 5.330.66 | 7.59 | 0.028 | ||
| 11.05730.0021 | 0.660.16 | 1.300.70 | 7.16 | 0.031 | ||
| 11.80170.0019 | 0.740.16 | 6.270.64 | 7.84 | 0.029 | ||
| 22.74670.0024 | 0.520.14 | 4.930.80 | 6.25 | 0.015 | ||
| 0.03080.0035 | 0.520.21 | 3.791.17 | 4.28 | |||
| 9.19870.0022 | 0.550.14 | 3.710.72 | 6.97 | 0.037 | ||
| 2.21980.0033 | 0.480.18 | 1.891.10 | 4.55 | |||
| 9.71620.0027 | 0.470.14 | 6.020.88 | 5.67 | 0.035 | ||
| 23.63640.0024 | 0.490.13 | 2.200.81 | 6.18 | 0.014 | ||
| 1.76840.0037 | 0.460.19 | 2.851.23 | 4.08 | |||
| 20.21190.0030 | 0.450.15 | 2.061.01 | 4.95 | 0.017 | ||
| 11.92940.0030 | 0.470.16 | 2.871.02 | 4.93 | 0.029 | ||
| 17.59790.0033 | 0.410.15 | 1.441.09 | 4.61 | 0.019 | ||
| 18.24760.0035 | 0.390.15 | 1.591.15 | 4.35 | 0.019 | ||
| 24.01080.0032 | 0.370.14 | 4.071.08 | 4.64 | 0.014 | ||
| 12.90720.0044 | 0.340.17 | 3.741.47 | 3.40 | 0.026 | ||
| 23.15850.0035 | 0.340.14 | 0.691.17 | 4.29 | 0.015 | ||
| 25.11410.0033 | 0.330.12 | 2.661.09 | 4.61 | 0.014 |