22email: anton@urfu.ru 33institutetext: Visiting Leading Researcher, Ventspils International Radio Astronomy Centre, Inženieru 101, LV-3601, Ventspils, Latvia 44institutetext: Max-Planck-Institut für extraterrestrische Physik, Giessenbachstrasse 1, 85748, Garching, Germany 55institutetext: Centro de Astrobiología, Instituto Nacional de Técnica Aeroespacial Ctra de Torrejón a Ajalvir, km 4 28850 Torrejón de Ardoz, Madrid, Spain 66institutetext: Universidad Nacional, Autonóma de México Km 107 Carretera Tijuana-Ensenada 22870 Ensenada, BC, Mexico 77institutetext: Universität Wien, Department of Astrophysics Türkenschanzstraße 17 (Sternwarte), 1180 Wien, Austria
Water and Methanol Ice in L 1544 ††thanks: Based on data collected by SpeX at the Infrared Telescope Facility, which is operated by the University of Hawaii under contract NNH14CK55B with the National Aeronautics and Space Administration.
Abstract
Context. Methanol and complex organic molecules have been found in cold starless cores, where a standard warm-up scenario would not work because of the absence of heat sources. A recent chemical model attributed the presence of methanol and large organics to the efficient chemical desorption and a class of neutral-neutral reactions that proceed fast at low temperatures in the gas phase.
Aims. The model calls for a high abundance of methanol ice at the edge of the CO freeze-out zone in cold cloud cores.
Methods. We performed medium resolution spectroscopy toward 3 field stars behind the starless core L 1544 at 3 m to constrain the methanol ice abundance and compare it with the model predictions.
Results. One of the field stars shows a methanol-ice abundance of 11 % with respect to water ice. This is higher than the typical methanol abundance previously found in cold cloud cores (4 %), but is 4.5 times smaller than predicted. The reason for the disagreement between the observations and the model calculations is not yet understood.
Key Words.:
Astrochemistry — (ISM:) dust, extinction — ISM: clouds — (ISM:) evolution — ISM: molecules — ISM: individual (L 1544) — infrared: ISM1 Introduction
Methanol is the most abundant alcohol in the universe. It is commonly accepted that the molecule is the end product of successive hydrogenation of CO on dust grains (Tielens & Whittet, 1997; Watanabe et al., 2004). In the vicinity of young protostars, icy mantles of the grains are warmed up, and release the molecules back into the gas phase (e.g. Garrod & Herbst, 2006). Methanol is excited in the warm envelopes and outflows around protostars (Flower et al., 2010), and creates a dense forest of emission lines that almost covers the whole continuum emission at sub-mm/mm wavelengths (e.g. Bergin et al., 2010).
The challenge to the current understanding of the interstellar chemistry is the presence of methanol and other complex organic molecules in cold clouds and starless cores found in sub-mm/mm observations (Cernicharo et al., 2012; Bacmann et al., 2012; Jiménez-Serra et al., 2016; Taquet et al., 2017; Punanova et al., 2018). A starless core is a compact, dense region of a molecular cloud, with a typical radius of about 0.1 pc (see Bergin & Tafalla, 2007, for review). Visual extinctions at the central regions range from 20 mag for less developed cores to 100 mag for the densest ones. With no heating sources near by or embedded within them, the gas and dust in these cores are cold, with typical temperatures 10 K or lower (Crapsi et al., 2007; Harju et al., 2008; Hocuk et al., 2017). As a result, CO and other heavy molecules containing oxygen and carbon are frozen onto dust grains toward the center of these cores, possibly leaving only molecular hydrogen and nitrogen-bearing volatile species such as NH3, N2H+, and HCN in the gas phase (Walmsley et al., 2004).
Methanol and other large organics have been found in starless cores near the edges of the CO depletion zones (Tafalla et al., 2006; Bizzocchi et al., 2014; Vastel et al., 2014; Jiménez-Serra et al., 2016; Chacón-Tanarro et al., 2018). This is inexplicable for two reasons. First, as no energetic sources are in cold starless cores, it is hard to eject methanol and other molecules formed on the grain surface to the gas phase. Second, radical-radical reactions on the grain surface are supposed to play a key role in the formation of complex organic molecules in the interstellar medium (Garrod & Herbst, 2006; Garrod et al., 2008). For the surface reactions between radicals, the dust temperatures should be 30-40 K (e.g. Tielens & Hagen, 1982), so that the grains are not too hot to evaporate the molecules, but also not too cold as to hinder the surface diffusion and to allow surface atomic hydrogen to saturate radicals. Although methanol itself can form since atomic hydrogen remains mobile at low temperatures, most of the precursors of complex organic molecules would be fixed on their binding sites at temperatures near 10 K.
| # | WISE ID | (J2000) | (Her) | (SED) | (CE) | Int. | CH3OHice | |||||
|---|---|---|---|---|---|---|---|---|---|---|---|---|
| R.A. | Dec. | [mag] | [mag] | [mag] | [mag] | [min.] | [1018 cm-2] | [1017 cm-2] | [%] | |||
| 1 | J050415.91+251157.3 | 05:04:15.91 | +25:11:57.3 | 11.75 | 27.3 | 33.9 | 36.4 | 146 | 1.99 | 3.33 | 4.0 | 12.1 |
| 3 | J050421.72+251208.6 | 05:04:21.72 | +25:12:08.6 | 9.38 | 19.2 | 21.4 | 26.9 | 52 | 1.21 | 2.03 | 2.2 | 10.6 0.7 |
| 5 | J050422.09+250937.8 | 05:04:22.09 | +25:09:37.8 | 11.60 | 12.4 | 8.9 | 15.9 | 58 | 0.67 | 1.12 | 6.6 | 59.0 |
: Photometry from AllWISE catalog at the wavelength =3.4 m.
(Her): Visual extinction measured based on the extinction map calculated from Herschel/SPIRE images.
(SED): Visual extinction measured based on the comparison of the infrared SEDs of the objects with stellar photospheric model.
(CE): Visual extinction measured based on the color-dependent extinction of the background stars in the infrared.
Int. : On-source integration time in minutes.
: Peak optical depth of water ice at 3.0 m. The uncertainties are for 1 .
: Column density of water ice.
CH3OHice : Fraction of methanol ice with respect to water ice. The upper limits are for 3 .
: Column density of methanol ice.
Vasyunin et al. (2017) further develops the scenario proposed in Vasyunin & Herbst (2013), and explains the presence of methanol and of large organics in starless cores with two new mechanisms: efficient chemical (=reactive) desorption from CO-rich ice surface (Minissale et al., 2016) as opposed to water-ice surface, and a class of OH radical reactions that proceed fast at low temperatures in the gas phase (Shannon et al., 2013; Balucani et al., 2015; Antiñolo et al., 2016). The formation of methanol and complex organic molecules proceeds as follows: (i) CO starts to freeze out catastrophically at distances of thousands AU from the cloud center (e.g. Caselli et al., 1999). The grain surfaces are covered by CO-rich ice, where CO molecules are efficiently transformed into CH3OH via hydrogenation reactions. (ii) A fraction of the CH3OH molecules formed on CO-rich ice desorbs from the surface using the extra energy made available upon formation (e.g. Garrod et al., 2006; Minissale et al., 2016). (iii) Once in the gas phase, methanol and other radicals such as CH3O and HCO initiate a series of reactions in the gas phase that lead to oxygen-bearing organic molecules. Neutral-neutral reactions involving OH are particularly important, because they proceed fast at low temperatures, as the lifetime of the hydrogen-bonded intermediate complexes become longer, and the quantum tunneling allows reactions to proceed. The new model not only explains how methanol and complex organic molecules could be present in cold starless cores, but also why they are found near the edges of the CO depletion zones (Tafalla et al., 2006; Bizzocchi et al., 2014). Note that models invoking non-diffuse grain surface chemical processes have recently been proposed (Jin & Garrod, 2020). However, the abundances of complex organics predicted by these models fall short by at least one order of magnitude with respect to those measured toward the L1544 starless core.
The chemical model of Vasyunin et al. (2017) is based on the radial profiles of density, temperatures and computed for the starless core L 1544 by Keto & Caselli (2010). CO is heavily depleted in L 1544, showing a cavity of C17O emission with a radius of 6500 AU (Caselli et al., 1999). Bizzocchi et al. (2014) found that methanol emission peaks about 4000 AU away from the dust emission peak, close to the rim of the CO freeze-out zone (see also Punanova et al., 2018). Other organics such as dimethyl ether and methyl formate were also found near the methanol peak (Jiménez-Serra et al., 2016). Vasyunin et al. (2017) predicted that the local fractional abundance of methanol ice to water ice could be as high as 50 % at the edge of the CO depletion zone. The goal of the present study is to measure the abundances of methanol and water ice toward L 1544 via 3 m spectroscopy, and compare them to the model predictions by Vasyunin et al. (2017). The paper is organised as follows. The observations are described in section 2, the results are presented in section 3, and the comparison between the observations and the model is discussed in section 4.
2 Observations
2.1 Target Selection
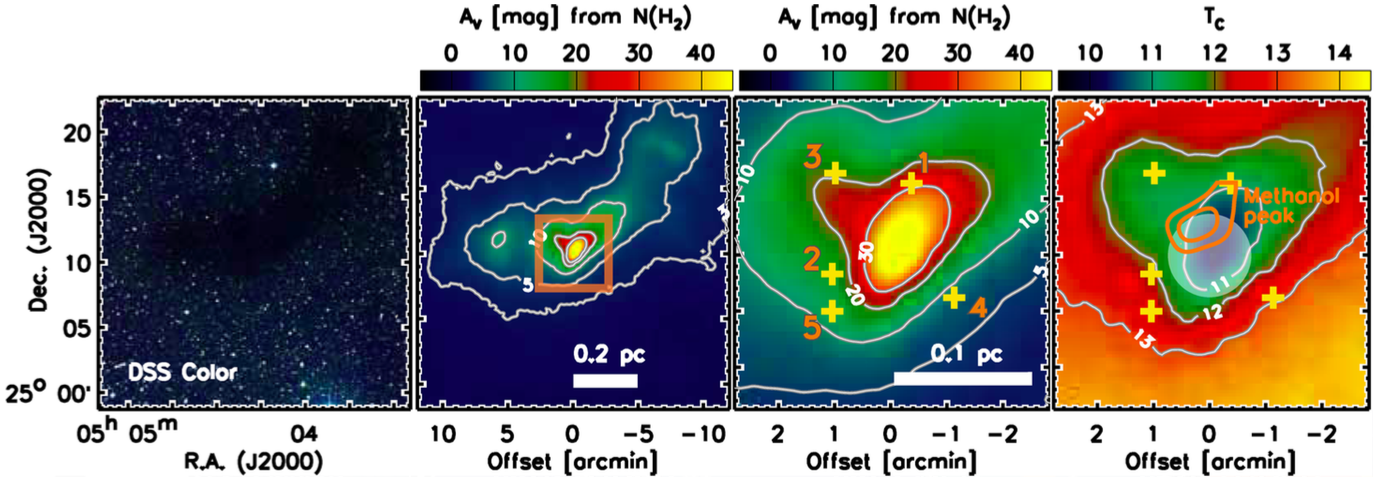
The gas phase methanol peak in L1544 is located about half an arcminute northeast of the sub-mm/mm dust emission peak (R.A.=05:04:17.21, Dec.=25:10:42.8; J2000 Ward-Thompson et al., 1994, 1999). In order to perform the spectroscopy through the cloud, we need suitable background stars. We selected all stars within 5′ of the continuum peak from the WISE222The Wide-field Infrared Survey Explore. Wright et al. (2010). and 2MASS333The Two Micron All Sky Survey. Skrutskie et al. (2006). catalogues. The archival images by Herschel/SPIRE are used to construct the extinction map on L 1544 to compare with the locations of the potential targets. Five sources are visible in the 7 near-mid infrared bands from 1.2 to 22 m (Figure 1). To avoid the sources on the foreground, the infrared photometry of the sources are compared to the stellar photospheric models of Bressan et al. (2012) after applying the interstellar extinction law derived by Boogert et al. (2011). All five sources are consistent with being to -type stars on the background. The three brightest sources in WISE band (3.4 m), 3, 5, and 1 in Figure 1, are observed in the present study. The summary of the targets is shown in Table 1.
2.2 Spex at IRTF
The spectroscopic observations were carried out with the SpeX spectrograph (Rayner et al., 2003) at the IRTF on Maunakea on the nights of 20 and 21 November 2018 UT. The instrument was remotely operated from Munich in Germany. The sky was clear on both nights with the seeing 05–06 at band. The secondary mirror of the IRTF was fresh from recoating which helped to suppress the telescope emissivity during the observation.
The instrument optics was set to LXD short configuration with 05 15″ slit to deliver the spectral resolution =1200. The full coverage of the wavelength in LXD short is 1.67 to 4.22 m. The targets were continuously guided in the slit during the integration on the guiding camera of SpeX at band. The position angle of the slit was set roughly along the parallactic angle at the time of the observation to minimize the flux loss by the atmospheric refraction. The telescope was nodded along the slit every other exposures to remove the background emission of the sky. The total on-source integration times are summarised in Table 1. The spectroscopic standard star HR 1791 (B7 III, =1.66 mag) was observed each night at a similar airmass with the science targets. The spectrograms of the flat-field illumination and the arc lamp were obtained after the science and the standard star observations without changing the telescope pointing to prevent the wavelength mapping moving on the detector by the instrument flexure. In addition to the calibrations at each pointing positions, extra flat field frames were obtained in the daytime after the observations with the telescope in the stow position.
2.3 Data Reduction
The raw data were reduced by the software suite xSpextool coded by Cushing et al. (2004). xSpextool444http://irtfweb.ifa.hawaii.edu/s̃pex/observer/ produces flat-field images to normalise the pixel-by-pixel fluctuation of the detector response, and sets up the wavelength mapping on the detector array referring to the arc-lamp images. After calibrating the flux and the wavelength, xSpextool removes the sky and telescope emissions by pair subtraction, combines the spectrograms obtained for one target, and extracts one-dimensional spectra from the fully-calibrated spectrogram images.
The spectra of the science targets are divided by that of the standard star to remove the telluric lines. The blackbody radiation spectrum of the temperature equal to the effective temperature of the standard star is multiplied to restore the continuum shape of the science targets. The spectral strips of the different diffraction orders are stitched together so that the overlapping intervals appear smooth. All these extra tasks after the aperture extraction are handled by the programs that come with xSpextool suite.
The prominent H I lines of the photosphere of the standard stars (e.g. Br , Pf ) are removed by subtracting Lorentzian profiles that fit the line shape. The H I lines that are blended with the telluric lines (e.g. Pf ) are removed from the science spectrum after the telluric lines are corrected by the standard star spectrum.
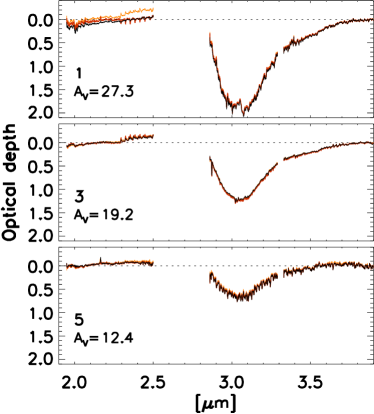
The sources we observed are background field stars of late spectral types. In order to measure the ice optical depth, the intrinsic photospheric features have to be removed. The water vapour absorption at 2.5–2.7 m is particularly troublesome, as it lies on top of the water ice absorption at 3.0 m. The photospheric lines are removed by comparing the science spectra to the template spectra of the IRTF Spectral Library (Rayner et al., 2009) after the templates are reddened by the interstellar extinction law. Best matching templates are manually sought for by inspecting how good they reproduce the overall continuum shape and the CO overtone band at 2.3 m. The optical depths of the ice are calculated with the template spectrum as a reference of the null absorption. The details of the data reduction can be found in Goto et al. (2018). The reduced optical depth spectra are reported in Figure 2. The spectra look flat for the wavelength range between 2 and 2.5 m as well as towards the end of the long-wavelength wing of the water absorption feature centered at 3 m, which is an indication of the goodness of the continuum fit in the observed spectra.
3 Result
3.1 Methanol ice at 3.54 m
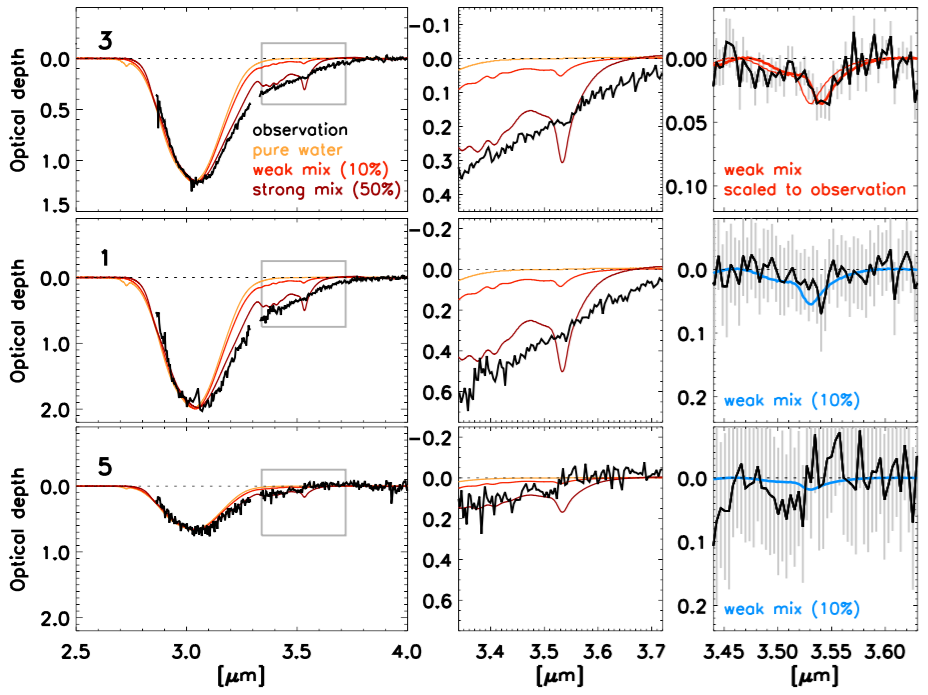
The prime goal of the observation is to detect the stretching band of methanol ice at 3.53–3.54 m. Among 3 stars observed, only source #3 shows significant absorption at 3.54 m over the noise level (top row in Figure 3). To measure the methanol to water ice ratio quantitatively, the laboratory transmission spectra of water ice with different degrees of methanol inclusions (Hudgins et al., 1993) are compared to source #3 spectrum. The interstellar weak mix of Hudgins et al. (1993) is a blend of ice with the mixing ratio H2O:CH3OH:CO:NH3=100:10:1:1. The interstellar strong mix only differs in containing more methanol ice following the ratio H2O:CH3OH:CO:NH3=100:50:1:1 (see the left panels in Figure 3). The pure water ice does not contain methanol or other molecules. The laboratory data are taken for low temperature measurements at 10 K.
The use of a H2O:CH3OH:CO:NH3 chemical mixture is justified by the chemical models of the L1544 starless core (Vasyunin et al., 2017). In these models, the formation of CH3OH from CO ice hydrogenation takes place while O and N atoms (still present in the gas phase) also adsorb onto the grain surface. This leads to the production of H2O and NH3 ice on the surface at the same time as CH3OH in such a way that the presence of H2O and NH3 ice on CO-rich mantles is expected (see Müller et al., 2020, submitted). In addition, note that the red wing of the water absorption feature at 3 m, can be contaminated by NH3 hydrates (Dartois & d’Hendecourt, 2001).
We employ the laboratory data from Hudgins et al. (1993) because they are easily available from the most common databases and because they present the advantage of allowing a straightforward comparison with ice mixtures with two significant H2O:CH3OH ratios (100:10 and 100:50). In particular, the data from Hudgins et al. (1993) are the only ones available for a H2O:CH3OH ratio of 100:10, required to explain our observations (see below).
The transmission spectra are converted into optical depths, and then scaled so that the peak optical depth of water ice matches what is observed toward source #3 at 3.0 m (left panel in the top row of Figure 3; middle panel is a close-up view at 3.54 m). Polynomial functions are fitted to the local continua near 3.54 m, and subtracted from the lab and the astronomical data (right panel). An excess absorption is found at 3.54 m on the source #3 spectrum, with a corresponding optical depth of . This is taken as a positive detection of methanol ice. If we linearly scale the laboratory spectrum of interstellar weak mix to the astronomical spectrum, the methanol over water ice ratio is 10.60.7 %. This ratio is consistent with those measured toward other starless cores such as L 429 and L 694 (of 12-14%; see Boogert et al., 2011; Chu et al., 2020), also using the 3.54 m methanol absorption feature.
There is a small offset (0.01 m) in the peak absorption wavelengths towards longer wavelength between the laboratory and the astronomical spectra (right panel in the top row of Figure 3). The nature of the offset is not clear. The size of the shift is too large to be accounted for as an uncertainty of the wavelength calibration in the SpeX spectra.The water ice absorptions at 3.0 m have a similar shift between the laboratory and the astronomical spectra. This shift could be produced by scattering effects due to different grain shapes and sizes (see e.g. Pontoppidan, K. M. et al., 2003; Thi, W.-F. et al., 2006; Noble et al., 2013). However, given the low signal-to-noise ratio of the methanol absorption feature, these effects are probably not noticeable. The observed shift is more likely associated with variations in the chemical composition of the ices (W.-F. Thi, private communication). This will be explored in a separate paper (Müller et al., 2020, submitted).
We point out that a comparison with spectra from the Sackler Laboratory Ice Database (Fraser & van Dishoeck, 2004) has also been attempted for CH3OH:CO 1:1 ice mixtures and layers. The laboratory methanol feature at 3.54 m, however, does not show a significant shift when co-deposited with CO as compared to the layered deposition, at least for the ratio probed in these experiments. In any case, the comparison with the data from Hudgins et al. (1993) provides a better match to the CH3OH ice absorption spectra observed toward star #3 in the L1544 starless core.
The same analysis used for star #3 is applied to sources #1 and #5, and shown in Figure 3. Source #1 is the closest to the methanol peak, and is expected to show the highest methanol-ice abundance among the 3 sources observed. However, the source is faint, and we could only set the upper limit on the methanol-ice abundance at 12.0 % for 3 significance. The upper limit of the methanol ice abundance on source #5 is 59 %.
3.2 Water ice at 3.0 m
The water ice is positively detected in all three sources in L 1544. The peak optical depths are measured by fitting a Gaussian profile to the spectra and shown in Table 1. To measure the column density of the water ice quantitatively, first the optical-depth spectrum of pure water ice from the laboratory (Hudgins et al., 1993) is scaled so that the maximum optical depth is unity. The normalized optical depth spectrum is integrated over the whole band to the equivalent width. The column density of the water ice in the laboratory is then calculated from the equivalent width by multiplying the integrated band strength of Gerakines et al. (1996). This way, we know that the unit peak optical depth at 3.0 m amounts to a column density of cm-2. The column density of the water ice is calculated by multiplying this factor to the observed of each source.
We note that the laboratory pure water ice spectrum does not reproduce the red wing observed for the water absorption features measured at 3 m toward the three stars. This is caused by a possible mixture with NH3 ice and scattering by larger grains (see Section 3.1 and Dartois & d’Hendecourt, 2001; Pontoppidan, K. M. et al., 2003; Thi, W.-F. et al., 2006; Noble et al., 2013). The Gaussian profile, however, nicely fits the water feature between 2.9 and 3.15 m, which is sufficient to accurately determine the peak optical depths (see, for instance, Chu et al., 2020).
4 Discussion
4.1 Assessment of
We discuss first how the visual extinction was measured on the
three sources observed. In the present study, was
estimated in four different ways.
(i) We used the thermal emission of dust grains in the far
infrared observed by SPIRE on Herschel at 250, 350 and
500 m. The mass absorption coefficient used was
, where , and is
normalized to cm2 g-1 at
250 m (Hildebrand, 1983).
(ii) We calculated with the color extinction method
developed by Lombardi (2009) (NICEST
algorithm) extended for six near-infrared bands [, , ,
IRAC 1 (3.55 m), IRAC 2 (4.49 m), IRAC 3
(5.73 m) and IRAC 4 (7.87 m)]. The , and
images were obtained with the OMEGA 2000 camera at the
3.5 m telescope in Calar Alto Observatory. The IRAC/Spitzer
data is from the Taurus Legacy Project555https://irsa.ipac.caltech.edu/data/SPITZER/Taurus/
docs/delivery_doc2.pdf.
The extinction map was constructed using the extinction law of
Roman-Zuniga et al. (2007).
(iii) We compared the infrared SEDs of the science targets taken
from 2MASS and WISE catalogues (1.2–22 m)
to the stellar photospheric model of
Bressan et al. (2012) to assess the spectral types
of the stars and the extinction on the line of sights
simultaneously. The empirical extinction curve of
Boogert et al. (2011) was used.
(iv) We used the IRTF spectral library
(Rayner et al., 2009) as the null absorption
reference to measure the ice optical depth. was measured
simultaneously in the same way with (iii). The empirical
extinction curve of Boogert et al. (2011) was
used.
The visual extinctions on the three sources measured by the techniques above are listed in Table 1. They should all match together on each source ideally, which is not the case apparently. Instead of trying to reconcile the s, we would like to underscore the following points. (1) on a single line of sight measured different ways may have a range nearly 100 %, i.e., if is 10 mag, the full interval of the scatter could be 5 mag. (2) When testing solid-phase chemistry in the interstellar medium, may not be a reliable reference of the mass in front of a target. It is preferred to have more than one species of molecules in ice observed in a single line of sight so that may serve as a reference of the solid matter, for instance. The complications in using as a reference of mass in the line of sight in the context of ice study has been discussed in Chiar et al. (2011); Boogert et al. (2013); Whittet et al. (2013).
Here we present a non-exhaustive list of the problems in measuring , and introduce one issue special to the present case. A cloud may have a particular geometry, such as local minima and maxima, or an extra extinction on foreground and background. All are potential sources of unexpected tweak in on a particular line of sight. The theoretical models of stellar photospheres used in technique (iii) requires numbers of inputs that are not well known for an individual target, such as the age, the metallicity, or the presence of circumstellar dust. The uncertainty in the photospheric reference propagates to the uncertainty in . The color-dependent extinction technique (ii) requires the intrinsic color of stars as the null reference of the extinction. The intrinsic color is often sampled in a nearby control field. The fidelity of the intrinsic color systematically affects the final extinction measured. The interstellar extinction law is not universal, but depends on the optical property of the dust grains on the line of sight, such as grain size and chemical composition. Dust optical properties also affect the wavelength dependency of the mass absorption coefficient , and therefore the total mass of the dust grains deduced from the far-infrared dust emission.
Another issue is the astrometric accuracy. The techniques (i) and (ii) do not use the photometry or the spectroscopy of the science targets directly, but read from the extinction map at the position of the targets. The accuracy of the extinction relies on how accurate the astrometry of the extinction map matches with the coordinate system of the targets. The angular resolutions of the extinction map produced by the techniques (i) and (ii) are 10″ to 1′ in most cases, while a typical starless core (0.1 pc) spans 2′ at 140 pc away. Astrometric mismatch may result in serious offsets in when a cloud has a small-scale structure and a target is located close to it.
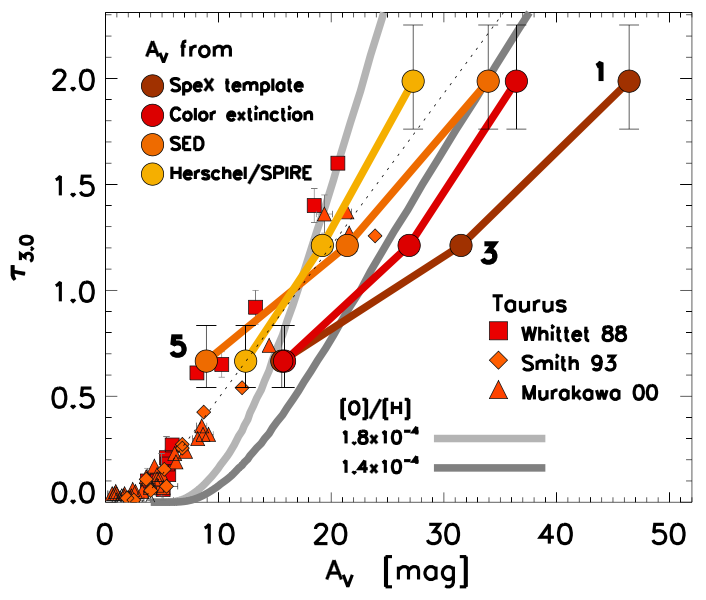
The wide range of possible toward our science targets makes it difficult to compare the water-ice optical depth to the existing observations in the Taurus Molecular Cloud (Figure 4; Whittet et al., 1988; Smith et al., 1993; Murakawa et al., 2000). The peak optical depths of water ice in L 1544 are either consistent with Taurus when compared with the measured by SPIRE/Herschel and SED analysis, or smaller, when compared with the measured using IRTF templates and the color-dependent extinction technique.
4.2 Comparison with the model
We will now compare the measured methanol abundance to the chemical model calculated by Vasyunin et al. (2017). There are two modifications from the published model of L 1544. First, the gas density profile is updated. Vasyunin et al. (2017) used the radial profile of gas density calculated by Keto & Caselli (2010). This density profile turns out to be marginally inconsistent with the far-infrared/mm emission of dust grains (Chacón-Tanarro et al., 2019). The chemical model is recalculated using the density profile proposed by Chacón-Tanarro et al. (2019). The radial profiles of the abundances of molecules in gas and ice are affected little.
Second, the oxygen abundance is reduced. Figure 4 shows the comparison of - correlations between the observations and the model. The curve computed with the standard low-metal oxygen abundance (; the initial gas-phase abundance at the start of the cloud collapse) predicts a slope that is too steep (light gray) to match the observations. We had to reduce the oxygen abundance by 23 % (). This is a known problem called oxygen crisis (Ayres, 2008). The crisis here implies not the shortage of oxygen but that the solar abundance of oxygen is significantly more than the total sum of the element observationally identified in the interstellar medium (Whittet, 2010; Jenkins, 2009, 2019). It is also interesting to note that Hincelin et al. (2011) found that a similar elemental abundance of oxygen was needed in their models to reproduce the observed concentration of molecular oxygen in molecular dark clouds. Oxygen is present in the interstellar medium in atomic and molecular form. It is also incorporated in larger molecules, silicates and oxides in dust grains, including ice mantles. In a dense cloud, observable oxygen in ice, dust and gas accounts only 65 % (Whittet et al., 2007) of the solar abundance of oxygen [O]/[H] = (Asplund et al., 2009). The reduced [O]/[H] abundance decreases with respect to , so that the model results match better the canonical slope observed in the Taurus Molecular Cloud (dark gray trace). The deficit of at the low could stem from the chemical youth of L 1544 compared to other star-forming clouds in Taurus. The abundances of methanol and other large organics in the gas phase observed by (Jiménez-Serra et al., 2016) are still reproduced within an order of magnitude by the model with the reduced oxygen abundance, and with the peak in the abundance radial distribution matching properly the radial distance of the observed methanol peak Bizzocchi et al. (2014). The local fractional abundance of methanol ice with respect to is affected little.
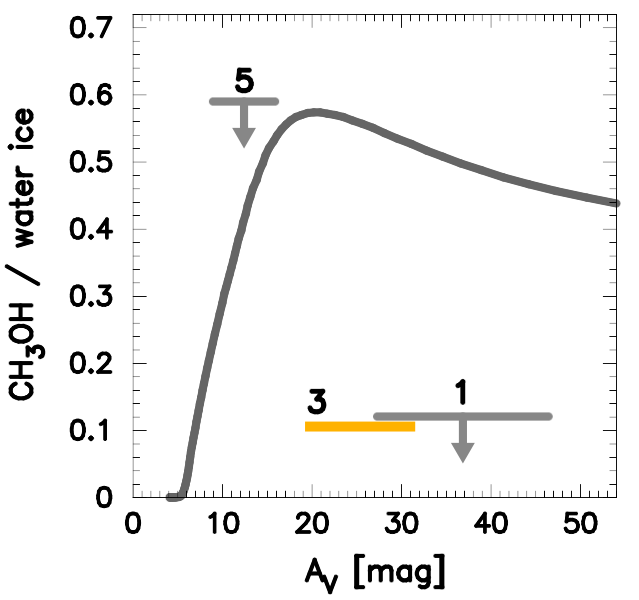
The local fractional abundances of ice are converted into column densities through the cloud in the same way as in Jiménez-Serra et al. (2016). The model abundance of methanol ice with respect to water ice is shown in Figure 5 as a function of (gray trace). The predicted abundance of methanol ice reaches 50 % at 18 mag, and becomes flat toward =40-50 mag with 30-40 %. Neither of the observed methanol ice fraction toward source #3, nor the upper limit on source #1 come close to the high abundances predicted, regardless of the large uncertainty in the visual extinction on the different lines of sight.
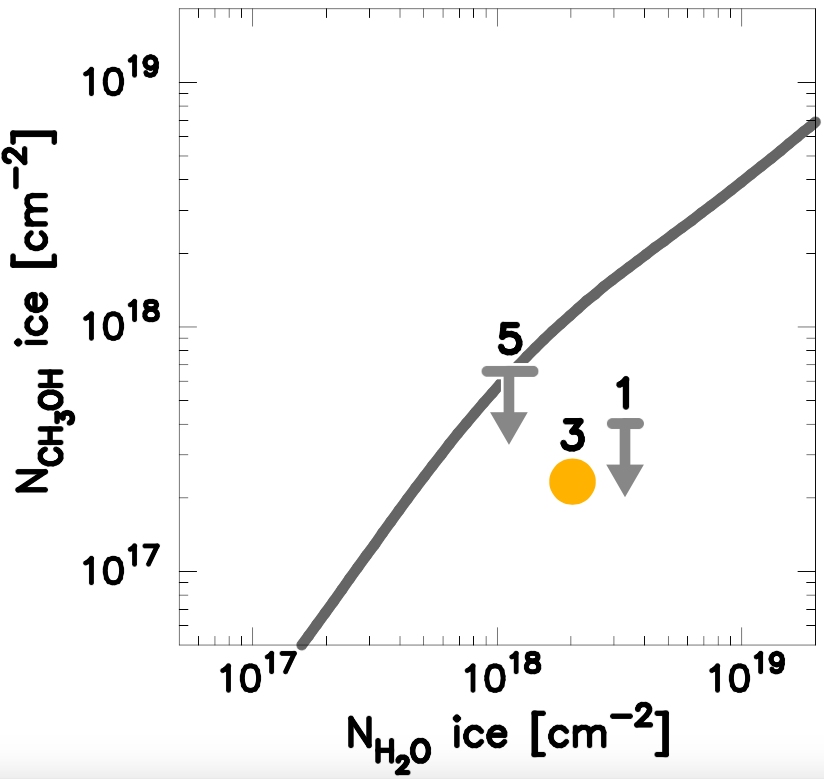
Figure 6 compares the observed ice column densities, and , to the model. The column density of the water ice on source #3 is cm-2. The column density of the methanol ice predicted by the model is then cm-2, which is 5 times larger than what is actually observed (2.21017 cm-2; Table 1). The column density of methanol in the gas phase towards L1544 is few 1013 cm-2 (see e.g. Bizzocchi et al., 2014). Thus, the absolute majority of CH3OH in L1544 is in the solid phase. In the model by Vasyunin et al. (2017), methanol exhibits a similar behaviour.
It is not clear why the observed and the predicted methanol ice abundances differ that much. One technical issue is that it is not straightforward to convert the abundances of ice given in a model to the optical-depth spectra which is the observable. An ice mantle is a three-dimensional structure on the surface of a grain that works as a substrate. The optical constants of a single grain, in principle, should be calculated with a realistic geometry of the mantle on the grain with the vertical profile of the molecular abundances given in the model. The visibility of the molecules may change depending on the depth in the ice mantle. On the other hand, an observation assumes that every molecule in the ice mantle contributes equally to the ice opacity, regardless of the depths of their presence or the size of the grains that they cover.
Vasyunin et al. (2017) indeed distinguishes the surface and the bulk molecules in the ice mantle, in the sense that molecules in the bulk, under a few layers of the ice mantle, do not participate in the surface chemistry, but only contribute to the chemistry by slow diffusions through the ice matrix. As a consequence, the chemical compositions of ice are substantially different in bulk and surface. In the present study, the bulk composition is used to compare with the observations, because it is a conservative choice, as the methanol to water ice ratio is even higher on the surface at the in question. Invisible population of methanol underneath the thick ice mantle therefore would not account for the deficit of the methanol ice in the present case.
We should keep in mind, however, that a chemical model is built on numerous parameters that we have not yet understood well. Rate coefficients of gas-phase reactions (Wakelam et al., 2005; Vasyunin et al., 2004; Wakelam et al., 2006a; Vasyunin et al., 2008), binding energies of molecules to grain surface (Wakelam et al., 2017), or diffusion efficiencies on the surface (Iqbal et al., 2018) are known poorly, let alone the physical conditions of the cloud in question (Wakelam et al., 2006a, b, 2010). As a result, the uncertainties in the output chemical abundances may exceed an order of magnitude. Finally, although it is commonly accepted that methanol in dense molecular clouds is formed efficiently only via the surface hydrogenation of CO molecules (Watanabe & Kouchi, 2002; Fuchs et al., 2009), the processes that may influence the methanol production rate are not fully understood yet (see e.g. Minissale et al., 2016).
5 Conclusions
We performed 3 m medium resolution spectroscopy toward 3 field stars behind the starless core L 1544 to constrain the methanol ice abundance with respect to the water ice. One of them shows a methanol-ice abundance 11 % with respect to water. This is consistent with the value measured toward other starless cores such as L 429 and L 694 (of 12-14%; Boogert et al., 2011; Chu et al., 2020); however, it is still way too low compared to the chemical model computed by Vasyunin et al. (2017). The comparison of the observations with the model reveals that the initial abundance of atomic oxygen at the start of the chemical evolution of the dense cloud in the model, has to be reduced by 23% to match the optical depth of water ice as a function of visual extinction toward L1544.
Acknowledgements.
M.G. thanks all the staff and crew of the IRTF, in particular, Mike Connelley, Brian Cabreira, Dave Griep, Miranda Hawarden-Ogata and Bobby Bus who kindly helped conducting the observation from Munich. We would like to thank the hospitality of the Hawaiian community that made the research presented here possible. My sincere appreciation goes to Jorma Harju and Viktor Zivkov who gave me thorough instructions how to construct dust emission / color temperature maps, and a color extinction map, respectively. We thank Wing-Fai Thi for the fruitful discussion about the influence of dust grain size on the shape of methanol ice absorption feature. This publication makes use of data products from the Wide-field Infrared Survey Explorer, which is a joint project of the University of California, Los Angeles, and the Jet Propulsion Laboratory/California Institute of Technology, funded by the National Aeronautics and Space Administration. This publication makes use of data products from the Two Micron All Sky Survey, which is a joint project of the University of Massachusetts and the Infrared Processing and Analysis Center/California Institute of Technology, funded by the National Aeronautics and Space Administration and the National Science Foundation. The optical spectra of the ice was taken from Sackler Laboratory Ice Database. This research has made use of NASA’s Astrophysics Data System. This research has made use of the SIMBAD database, operated at CDS, Strasbourg, France. M.G. is supported by the German Research Foundation (DFG) grant GO 1927/6-1. The work of A.I.V. is supported by the Russian Ministry of Science and Higher Education via the State Assignment project FEUZ-2020-0038. A.I.V. is a head of the Max Planck Partner Group at the Ural Federal University. I.J.-S. has received partial support from the Spanish FEDER (ESP2017-86582-C4-1-R) and the State Research Agency (AEI; PID2019-105552RB-C41). C.R.-Z. acknowledges support from program UNAM-DGAPA IN112620, Mexico. The authors thank the anonymous referee for the valuable suggestions that have significantly improved the manuscript.References
- Antiñolo et al. (2016) Antiñolo, M., Agúndez, M., Jiménez, E., et al. 2016, The Astrophysical Journal, 823, 25
- Asplund et al. (2009) Asplund, M., Grevesse, N., Sauval, A. J., & Scott, P. 2009, ARA&A, 47, 481
- Ayres (2008) Ayres, T. R. 2008, ApJ, 686, 731
- Bacmann et al. (2012) Bacmann, A., Taquet, V., Faure, A., Kahane, C., & Ceccarelli, C. 2012, Astronomy and Astrophysics, 541, L12
- Balucani et al. (2015) Balucani, N., Ceccarelli, C., & Taquet, V. 2015, Monthly Notices of the Royal Astronomical Society: Letters, 449, L16
- Bergin et al. (2010) Bergin, E. A., Phillips, T. G., Comito, C., et al. 2010, Astronomy and Astrophysics, 521, L20
- Bergin & Tafalla (2007) Bergin, E. A. & Tafalla, M. 2007, Annual Review of Astronomy and Astrophysics, 45, 339
- Bizzocchi et al. (2014) Bizzocchi, L., Caselli, P., Spezzano, S., & Leonardo, E. 2014, Astronomy and Astrophysics, 569, A27
- Boogert et al. (2013) Boogert, A. C. A., Chiar, J. E., Knez, C., et al. 2013, The Astrophysical Journal, 777, 73
- Boogert et al. (2011) Boogert, A. C. A., Huard, T. L., Cook, A. M., et al. 2011, The Astrophysical Journal, 729, 92
- Bressan et al. (2012) Bressan, A., Marigo, P., Girardi, L., et al. 2012, Monthly Notices of the Royal Astronomical Society, 427, 127
- Caselli et al. (1999) Caselli, P., Walmsley, C. M., Tafalla, M., Dore, L., & Myers, P. C. 1999, The Astrophysical Journal, 523, L165
- Cernicharo et al. (2012) Cernicharo, J., Marcelino, N., Roueff, E., et al. 2012, The Astrophysical Journal Letters, 759, L43
- Chacón-Tanarro et al. (2018) Chacón-Tanarro, A., Caselli, P., Bizzocchi, L., et al. 2018, arXiv.org, arXiv:1808.09871
- Chacón-Tanarro et al. (2019) Chacón-Tanarro, A., Pineda, J. E., Caselli, P., et al. 2019, A&A, 623, A118
- Chiar et al. (2011) Chiar, J. E., Pendleton, Y. J., Allamandola, L. J., et al. 2011, ApJ, 731, 9
- Chu et al. (2020) Chu, L. E. U., Hodapp, K. W., & Boogert, A. C. A. 2020, arXiv e-prints, arXiv:2010.05917
- Crapsi et al. (2007) Crapsi, A., Caselli, P., Walmsley, M. C., & Tafalla, M. 2007, Astronomy and Astrophysics, 470, 221
- Cushing et al. (2004) Cushing, M. C., Vacca, W. D., & Rayner, J. T. 2004, The Publications of the Astronomical Society of the Pacific, 116, 362
- Dartois & d’Hendecourt (2001) Dartois, E. & d’Hendecourt, L. 2001, A&A, 365, 144
- Flower et al. (2010) Flower, D. R., Pineau Des Forets, G., & Rabli, D. 2010, Monthly Notices of the Royal Astronomical Society, 409, 29
- Fraser & van Dishoeck (2004) Fraser, H. & van Dishoeck, E. 2004, Advances in Space Research, 33, 14 , space Life Sciences: Steps Toward Origin(s) of Life
- Fuchs et al. (2009) Fuchs, G. W., Cuppen, H. M., Ioppolo, S., et al. 2009, A&A, 505, 629
- Garrod et al. (2006) Garrod, R., Park, I. H., Caselli, P., & Herbst, E. 2006, Chemical Evolution of the Universe, 133, 51
- Garrod & Herbst (2006) Garrod, R. T. & Herbst, E. 2006, Astronomy and Astrophysics, 457, 927
- Garrod et al. (2008) Garrod, R. T., Widicus Weaver, S. L., & Herbst, E. 2008, ApJ, 682, 283
- Gerakines et al. (1996) Gerakines, P. A., Schutte, W. A., & Ehrenfreund, P. 1996, Astronomy and Astrophysics, 312, 289
- Goto et al. (2018) Goto, M., Bailey, J. D., Hocuk, S., et al. 2018, Astronomy and Astrophysics, 610, A9
- Harju et al. (2008) Harju, J., Juvela, M., Schlemmer, S., et al. 2008, A&A, 482, 535
- Hildebrand (1983) Hildebrand, R. H. 1983, QJRAS, 24, 267
- Hincelin et al. (2011) Hincelin, U., Wakelam, V., Hersant, F., et al. 2011, A&A, 530, A61
- Hocuk et al. (2017) Hocuk, S., Szucs, L., Caselli, P., et al. 2017, Astronomy and Astrophysics, 604, A58
- Hudgins et al. (1993) Hudgins, D. M., Sandford, S. A., Allamandola, L. J., & Tielens, A. G. G. M. 1993, Astrophysical Journal Supplement Series (ISSN 0067-0049), 86, 713
- Iqbal et al. (2018) Iqbal, W., Wakelam, V., & Gratier, P. 2018, A&A, 620, A109
- Jenkins (2009) Jenkins, E. B. 2009, ApJ, 700, 1299
- Jenkins (2019) Jenkins, E. B. 2019, ApJ, 872, 55
- Jiménez-Serra et al. (2016) Jiménez-Serra, I., Vasyunin, A. I., Caselli, P., et al. 2016, The Astrophysical Journal Letters, 830, L6
- Jin & Garrod (2020) Jin, M. & Garrod, R. T. 2020, The Astrophysical Journal Supplement Series, 249, 26
- Keto & Caselli (2010) Keto, E. & Caselli, P. 2010, Monthly Notices of the Royal Astronomical Society, 402, 1625
- Lombardi (2009) Lombardi, M. 2009, A&A, 493, 735
- Minissale et al. (2016) Minissale, M., Congiu, E., & Dulieu, F. 2016, Astronomy and Astrophysics, 585, A146
- Minissale et al. (2016) Minissale, M., Moudens, A., Baouche, S., Chaabouni, H., & Dulieu, F. 2016, MNRAS, 458, 2953
- Müller et al. (2020) Müller, B., Giuliano, B. M., Goto, M., & Caselli, P. 2020, A&A, submitted
- Murakawa et al. (2000) Murakawa, K., Tamura, M., & Nagata, T. 2000, The Astrophysical Journal Supplement Series, 128, 603
- Noble et al. (2013) Noble, J. A., Fraser, H. J., Aikawa, Y., Pontoppidan, K. M., & Sakon, I. 2013, The Astrophysical Journal, 775, 85
- Pontoppidan, K. M. et al. (2003) Pontoppidan, K. M., Dartois, E., van Dishoeck, E. F., Thi, W.-F., & d’Hendecourt, L. 2003, A&A, 404, L17
- Punanova et al. (2018) Punanova, A., Caselli, P., Feng, S., et al. 2018, The Astrophysical Journal, 855, 0
- Rayner et al. (2009) Rayner, J. T., Cushing, M. C., & Vacca, W. D. 2009, The Astrophysical Journal Supplement, 185, 289
- Rayner et al. (2003) Rayner, J. T., Toomey, D. W., Onaka, P. M., et al. 2003, The Publications of the Astronomical Society of the Pacific, 115, 362
- Roman-Zuniga et al. (2007) Roman-Zuniga, C. G., Lada, C. J., Muench, A., & Alves, J. F. 2007, The Astrophysical Journal, 664, 357
- Shannon et al. (2013) Shannon, R. J., Blitz, M. A., Goddard, A., & Heard, D. E. 2013, Nature Chemistry, 5, 745
- Skrutskie et al. (2006) Skrutskie, M. F., Cutri, R. M., Stiening, R., et al. 2006, AJ, 131, 1163
- Smith et al. (1993) Smith, R. G., Sellgren, K., & Brooke, T. Y. 1993, Monthly Notices of the Royal Astronomical Society, 263, 749
- Tafalla et al. (2006) Tafalla, M., Santiago-García, J., Myers, P. C., et al. 2006, Astronomy and Astrophysics, 455, 577
- Taquet et al. (2017) Taquet, V., Wirström, E. S., Charnley, S. B., et al. 2017, Astronomy and Astrophysics, 607, A20
- Thi, W.-F. et al. (2006) Thi, W.-F., van Dishoeck, E. F., Dartois, E., et al. 2006, A&A, 449, 251
- Tielens & Hagen (1982) Tielens, A. G. G. M. & Hagen, W. 1982, Astronomy and Astrophysics, 114, 245
- Tielens & Whittet (1997) Tielens, A. G. G. M. & Whittet, D. C. B. 1997, Molecules in astrophysics: probes & processes: abstract book, 178, 45
- Vastel et al. (2014) Vastel, C., Ceccarelli, C., Lefloch, B., & Bachiller, R. 2014, The Astrophysical Journal Letters, 795, L2
- Vasyunin et al. (2017) Vasyunin, A. I., Caselli, P., Dulieu, F., & Jiménez-Serra, I. 2017, The Astrophysical Journal, 842, 33
- Vasyunin & Herbst (2013) Vasyunin, A. I. & Herbst, E. 2013, ApJ, 769, 34
- Vasyunin et al. (2008) Vasyunin, A. I., Semenov, D., Henning, T., et al. 2008, The Astrophysical Journal, 672, 629
- Vasyunin et al. (2004) Vasyunin, A. I., Sobolev, A. M., Wiebe, D. S., & Semenov, D. A. 2004, Astronomy Letters, 30, 566
- Wakelam et al. (2010) Wakelam, V., Herbst, E., Le Bourlot, J., et al. 2010, A&A, 517, A21
- Wakelam et al. (2006a) Wakelam, V., Herbst, E., & Selsis, F. 2006a, A&A, 451, 551
- Wakelam et al. (2006b) Wakelam, V., Herbst, E., Selsis, F., & Massacrier, G. 2006b, A&A, 459, 813
- Wakelam et al. (2017) Wakelam, V., Loison, J. C., Mereau, R., & Ruaud, M. 2017, Molecular Astrophysics, 6, 22
- Wakelam et al. (2005) Wakelam, V., Selsis, F., Herbst, E., & Caselli, P. 2005, A&A, 444, 883
- Walmsley et al. (2004) Walmsley, C. M., Flower, D. R., & Pineau des Forêts, G. 2004, Astronomy and Astrophysics, 418, 1035
- Ward-Thompson et al. (1999) Ward-Thompson, D., Motte, F., & Andre, P. 1999, Monthly Notices of the Royal Astronomical Society, 305, 143
- Ward-Thompson et al. (1994) Ward-Thompson, D., Scott, P. F., Hills, R. E., & Andre, P. 1994, Monthly Notices of the Royal Astronomical Society, 268, 276
- Watanabe & Kouchi (2002) Watanabe, N. & Kouchi, A. 2002, ApJ, 571, L173
- Watanabe et al. (2004) Watanabe, N., Nagaoka, A., Shiraki, T., & Kouchi, A. 2004, The Astrophysical Journal, 616, 638
- Whittet (2010) Whittet, D. C. B. 2010, ApJ, 710, 1009
- Whittet et al. (1988) Whittet, D. C. B., Bode, M. F., Longmore, A. J., et al. 1988, Monthly Notices of the Royal Astronomical Society (ISSN 0035-8711), 233, 321
- Whittet et al. (2001) Whittet, D. C. B., Gerakines, P. A., Hough, J. H., & Shenoy, S. S. 2001, The Astrophysical Journal, 547, 872
- Whittet et al. (2013) Whittet, D. C. B., Poteet, C. A., Chiar, J. E., et al. 2013, The Astrophysical Journal, 774, 102
- Whittet et al. (2007) Whittet, D. C. B., Shenoy, S. S., Bergin, E. A., et al. 2007, The Astrophysical Journal, 655, 332
- Wright et al. (2010) Wright, E. L., Eisenhardt, P. R. M., Mainzer, A. K., et al. 2010, AJ, 140, 1868
References
- Antiñolo et al. (2016) Antiñolo, M., Agúndez, M., Jiménez, E., et al. 2016, The Astrophysical Journal, 823, 25
- Asplund et al. (2009) Asplund, M., Grevesse, N., Sauval, A. J., & Scott, P. 2009, ARA&A, 47, 481
- Ayres (2008) Ayres, T. R. 2008, ApJ, 686, 731
- Bacmann et al. (2012) Bacmann, A., Taquet, V., Faure, A., Kahane, C., & Ceccarelli, C. 2012, Astronomy and Astrophysics, 541, L12
- Balucani et al. (2015) Balucani, N., Ceccarelli, C., & Taquet, V. 2015, Monthly Notices of the Royal Astronomical Society: Letters, 449, L16
- Bergin et al. (2010) Bergin, E. A., Phillips, T. G., Comito, C., et al. 2010, Astronomy and Astrophysics, 521, L20
- Bergin & Tafalla (2007) Bergin, E. A. & Tafalla, M. 2007, Annual Review of Astronomy and Astrophysics, 45, 339
- Bizzocchi et al. (2014) Bizzocchi, L., Caselli, P., Spezzano, S., & Leonardo, E. 2014, Astronomy and Astrophysics, 569, A27
- Boogert et al. (2013) Boogert, A. C. A., Chiar, J. E., Knez, C., et al. 2013, The Astrophysical Journal, 777, 73
- Boogert et al. (2011) Boogert, A. C. A., Huard, T. L., Cook, A. M., et al. 2011, The Astrophysical Journal, 729, 92
- Bressan et al. (2012) Bressan, A., Marigo, P., Girardi, L., et al. 2012, Monthly Notices of the Royal Astronomical Society, 427, 127
- Caselli et al. (1999) Caselli, P., Walmsley, C. M., Tafalla, M., Dore, L., & Myers, P. C. 1999, The Astrophysical Journal, 523, L165
- Cernicharo et al. (2012) Cernicharo, J., Marcelino, N., Roueff, E., et al. 2012, The Astrophysical Journal Letters, 759, L43
- Chacón-Tanarro et al. (2018) Chacón-Tanarro, A., Caselli, P., Bizzocchi, L., et al. 2018, arXiv.org, arXiv:1808.09871
- Chacón-Tanarro et al. (2019) Chacón-Tanarro, A., Pineda, J. E., Caselli, P., et al. 2019, A&A, 623, A118
- Chiar et al. (2011) Chiar, J. E., Pendleton, Y. J., Allamandola, L. J., et al. 2011, ApJ, 731, 9
- Chu et al. (2020) Chu, L. E. U., Hodapp, K. W., & Boogert, A. C. A. 2020, arXiv e-prints, arXiv:2010.05917
- Crapsi et al. (2007) Crapsi, A., Caselli, P., Walmsley, M. C., & Tafalla, M. 2007, Astronomy and Astrophysics, 470, 221
- Cushing et al. (2004) Cushing, M. C., Vacca, W. D., & Rayner, J. T. 2004, The Publications of the Astronomical Society of the Pacific, 116, 362
- Dartois & d’Hendecourt (2001) Dartois, E. & d’Hendecourt, L. 2001, A&A, 365, 144
- Flower et al. (2010) Flower, D. R., Pineau Des Forets, G., & Rabli, D. 2010, Monthly Notices of the Royal Astronomical Society, 409, 29
- Fraser & van Dishoeck (2004) Fraser, H. & van Dishoeck, E. 2004, Advances in Space Research, 33, 14 , space Life Sciences: Steps Toward Origin(s) of Life
- Fuchs et al. (2009) Fuchs, G. W., Cuppen, H. M., Ioppolo, S., et al. 2009, A&A, 505, 629
- Garrod et al. (2006) Garrod, R., Park, I. H., Caselli, P., & Herbst, E. 2006, Chemical Evolution of the Universe, 133, 51
- Garrod & Herbst (2006) Garrod, R. T. & Herbst, E. 2006, Astronomy and Astrophysics, 457, 927
- Garrod et al. (2008) Garrod, R. T., Widicus Weaver, S. L., & Herbst, E. 2008, ApJ, 682, 283
- Gerakines et al. (1996) Gerakines, P. A., Schutte, W. A., & Ehrenfreund, P. 1996, Astronomy and Astrophysics, 312, 289
- Goto et al. (2018) Goto, M., Bailey, J. D., Hocuk, S., et al. 2018, Astronomy and Astrophysics, 610, A9
- Harju et al. (2008) Harju, J., Juvela, M., Schlemmer, S., et al. 2008, A&A, 482, 535
- Hildebrand (1983) Hildebrand, R. H. 1983, QJRAS, 24, 267
- Hincelin et al. (2011) Hincelin, U., Wakelam, V., Hersant, F., et al. 2011, A&A, 530, A61
- Hocuk et al. (2017) Hocuk, S., Szucs, L., Caselli, P., et al. 2017, Astronomy and Astrophysics, 604, A58
- Hudgins et al. (1993) Hudgins, D. M., Sandford, S. A., Allamandola, L. J., & Tielens, A. G. G. M. 1993, Astrophysical Journal Supplement Series (ISSN 0067-0049), 86, 713
- Iqbal et al. (2018) Iqbal, W., Wakelam, V., & Gratier, P. 2018, A&A, 620, A109
- Jenkins (2009) Jenkins, E. B. 2009, ApJ, 700, 1299
- Jenkins (2019) Jenkins, E. B. 2019, ApJ, 872, 55
- Jiménez-Serra et al. (2016) Jiménez-Serra, I., Vasyunin, A. I., Caselli, P., et al. 2016, The Astrophysical Journal Letters, 830, L6
- Jin & Garrod (2020) Jin, M. & Garrod, R. T. 2020, The Astrophysical Journal Supplement Series, 249, 26
- Keto & Caselli (2010) Keto, E. & Caselli, P. 2010, Monthly Notices of the Royal Astronomical Society, 402, 1625
- Lombardi (2009) Lombardi, M. 2009, A&A, 493, 735
- Minissale et al. (2016) Minissale, M., Congiu, E., & Dulieu, F. 2016, Astronomy and Astrophysics, 585, A146
- Minissale et al. (2016) Minissale, M., Moudens, A., Baouche, S., Chaabouni, H., & Dulieu, F. 2016, MNRAS, 458, 2953
- Müller et al. (2020) Müller, B., Giuliano, B. M., Goto, M., & Caselli, P. 2020, A&A, submitted
- Murakawa et al. (2000) Murakawa, K., Tamura, M., & Nagata, T. 2000, The Astrophysical Journal Supplement Series, 128, 603
- Noble et al. (2013) Noble, J. A., Fraser, H. J., Aikawa, Y., Pontoppidan, K. M., & Sakon, I. 2013, The Astrophysical Journal, 775, 85
- Pontoppidan, K. M. et al. (2003) Pontoppidan, K. M., Dartois, E., van Dishoeck, E. F., Thi, W.-F., & d’Hendecourt, L. 2003, A&A, 404, L17
- Punanova et al. (2018) Punanova, A., Caselli, P., Feng, S., et al. 2018, The Astrophysical Journal, 855, 0
- Rayner et al. (2009) Rayner, J. T., Cushing, M. C., & Vacca, W. D. 2009, The Astrophysical Journal Supplement, 185, 289
- Rayner et al. (2003) Rayner, J. T., Toomey, D. W., Onaka, P. M., et al. 2003, The Publications of the Astronomical Society of the Pacific, 115, 362
- Roman-Zuniga et al. (2007) Roman-Zuniga, C. G., Lada, C. J., Muench, A., & Alves, J. F. 2007, The Astrophysical Journal, 664, 357
- Shannon et al. (2013) Shannon, R. J., Blitz, M. A., Goddard, A., & Heard, D. E. 2013, Nature Chemistry, 5, 745
- Skrutskie et al. (2006) Skrutskie, M. F., Cutri, R. M., Stiening, R., et al. 2006, AJ, 131, 1163
- Smith et al. (1993) Smith, R. G., Sellgren, K., & Brooke, T. Y. 1993, Monthly Notices of the Royal Astronomical Society, 263, 749
- Tafalla et al. (2006) Tafalla, M., Santiago-García, J., Myers, P. C., et al. 2006, Astronomy and Astrophysics, 455, 577
- Taquet et al. (2017) Taquet, V., Wirström, E. S., Charnley, S. B., et al. 2017, Astronomy and Astrophysics, 607, A20
- Thi, W.-F. et al. (2006) Thi, W.-F., van Dishoeck, E. F., Dartois, E., et al. 2006, A&A, 449, 251
- Tielens & Hagen (1982) Tielens, A. G. G. M. & Hagen, W. 1982, Astronomy and Astrophysics, 114, 245
- Tielens & Whittet (1997) Tielens, A. G. G. M. & Whittet, D. C. B. 1997, Molecules in astrophysics: probes & processes: abstract book, 178, 45
- Vastel et al. (2014) Vastel, C., Ceccarelli, C., Lefloch, B., & Bachiller, R. 2014, The Astrophysical Journal Letters, 795, L2
- Vasyunin et al. (2017) Vasyunin, A. I., Caselli, P., Dulieu, F., & Jiménez-Serra, I. 2017, The Astrophysical Journal, 842, 33
- Vasyunin & Herbst (2013) Vasyunin, A. I. & Herbst, E. 2013, ApJ, 769, 34
- Vasyunin et al. (2008) Vasyunin, A. I., Semenov, D., Henning, T., et al. 2008, The Astrophysical Journal, 672, 629
- Vasyunin et al. (2004) Vasyunin, A. I., Sobolev, A. M., Wiebe, D. S., & Semenov, D. A. 2004, Astronomy Letters, 30, 566
- Wakelam et al. (2010) Wakelam, V., Herbst, E., Le Bourlot, J., et al. 2010, A&A, 517, A21
- Wakelam et al. (2006a) Wakelam, V., Herbst, E., & Selsis, F. 2006a, A&A, 451, 551
- Wakelam et al. (2006b) Wakelam, V., Herbst, E., Selsis, F., & Massacrier, G. 2006b, A&A, 459, 813
- Wakelam et al. (2017) Wakelam, V., Loison, J. C., Mereau, R., & Ruaud, M. 2017, Molecular Astrophysics, 6, 22
- Wakelam et al. (2005) Wakelam, V., Selsis, F., Herbst, E., & Caselli, P. 2005, A&A, 444, 883
- Walmsley et al. (2004) Walmsley, C. M., Flower, D. R., & Pineau des Forêts, G. 2004, Astronomy and Astrophysics, 418, 1035
- Ward-Thompson et al. (1999) Ward-Thompson, D., Motte, F., & Andre, P. 1999, Monthly Notices of the Royal Astronomical Society, 305, 143
- Ward-Thompson et al. (1994) Ward-Thompson, D., Scott, P. F., Hills, R. E., & Andre, P. 1994, Monthly Notices of the Royal Astronomical Society, 268, 276
- Watanabe & Kouchi (2002) Watanabe, N. & Kouchi, A. 2002, ApJ, 571, L173
- Watanabe et al. (2004) Watanabe, N., Nagaoka, A., Shiraki, T., & Kouchi, A. 2004, The Astrophysical Journal, 616, 638
- Whittet (2010) Whittet, D. C. B. 2010, ApJ, 710, 1009
- Whittet et al. (1988) Whittet, D. C. B., Bode, M. F., Longmore, A. J., et al. 1988, Monthly Notices of the Royal Astronomical Society (ISSN 0035-8711), 233, 321
- Whittet et al. (2001) Whittet, D. C. B., Gerakines, P. A., Hough, J. H., & Shenoy, S. S. 2001, The Astrophysical Journal, 547, 872
- Whittet et al. (2013) Whittet, D. C. B., Poteet, C. A., Chiar, J. E., et al. 2013, The Astrophysical Journal, 774, 102
- Whittet et al. (2007) Whittet, D. C. B., Shenoy, S. S., Bergin, E. A., et al. 2007, The Astrophysical Journal, 655, 332
- Wright et al. (2010) Wright, E. L., Eisenhardt, P. R. M., Mainzer, A. K., et al. 2010, AJ, 140, 1868