AGN jets and a fanciful trio of black holes in the Abell 85 Brightest Cluster Galaxy
Abstract
A new radio map of the Abell 85 Brightest Cluster Galaxy (BCG) was obtained with the Karl G. Jansky Very Large Array (VLA). With a resolution of 0.02, this radio image shows two kiloparsec-scale bipolar jets emanating from the active galactic nucleus of the Abell 85 BCG. The galaxy core appears as a single entity on the new radio map. It has been assumed that the Abell 85 BCG contained a binary black hole in its core. However, Chandra X-ray data and the new high-resolution radio map show no evidence that the Abell 85 BCG harbors a binary black hole. The assumption that this galaxy contains a binary black hole was based on the analysis of its optical surface brightness profile obtained under poor seeing conditions. We demonstrate how the well-known blurring effects of atmospheric seeing can mimic the effects of a binary supermassive black hole (SMBH). Likewise, SDSS J004150.75-091824.3 was postulated to be “a third” SMBH associated with the BCG. In the optical and X-rays, SDSS J004150.75-091824.3 (catalog ) is a point-like source located away from the nucleus of the Abell 85 BCG. A new spectrum of SDSS J004150.75-091824.3, obtained with the 10.4-m Gran Telescopio Canarias, reveals that this source is a background quasar at a redshift of and not associated in any way with the Abell 85 cluster.
1 Introduction
1.1 The Abell 85 Galaxy Cluster
Abell 85 is a galaxy cluster that is in the process of merging with two subclusters (Ichinohe et al., 2015). As a bright X-ray cluster with a complex structure, Abell 85 has been intensively studied with all modern X-ray observatories: Chandra, XMM-Newton and Suzaku (e.g. Kempner et al., 2002; Durret et al., 2003; Schenck et al., 2014).
The galaxy population of Abell 85 was recently analyzed at optical wavelengths by Agulli et al. (2016) who determined the spectroscopic luminosity function with 460 confirmed cluster members.
Owen et al. (1997) and Schenck et al. (2014) made clear detections of radio emission emanating from the Abell 85 cluster and its BCG. Radio relics located 320 kpc from the core of Abell 85 were discovered by Slee et al. (2001) – see also Schenck et al. (2014) and Bagchi et al. (1998). These relics are likely the result from shocks of past cluster mergers.
1.2 A fanciful trio of black holes
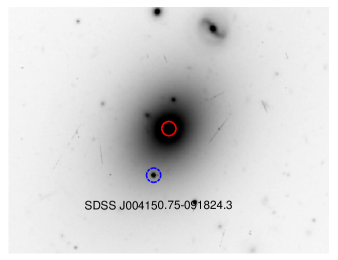
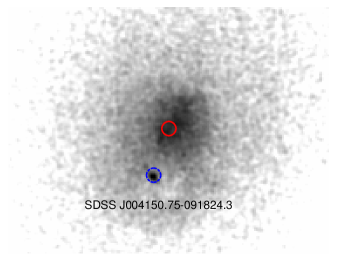
In the optical and X-rays, SDSS J004150.75-091824.3 is a bright (=14.03 mag), point-like source located away from the nucleus of the Abell 85 BCG – see Fig. 1. SDSS J004150.75-091824.3 is also the closest X-ray point source to the nucleus of the BCG. The core of the BCG shows a diffuse X-ray emission while SDSS J004150.75-091824.3 is bright and point-like.
 |
 |
SDSS J004150.75-091824.3 was included in the photometric selection of quasars from the SDSS by Richards et al. (2004, 2009). SDSS J004150.75-091824.3 was found to have a photometric redshift of = 0.925 in Richards et al. (2004). This value was later revised to =0.675 in Richards et al. (2009).
SDSS J004150.75-091824.3 was identified as a possible AGN in the detailed X-ray study carried out by Durret et al. (2005). These authors identify SDSS J004150.75-091824.3 as an X-ray point source on their Chandra data and also identify an optical counterpart on a SDSS image (see their Fig. 2). SDSS J004150.75-091824.3 is located within an X-ray cavity (Durret et al., 2005; Ichinohe et al., 2015).
Given the projected proximity of SDSS J004150.75-091824.3 to the center of the Abell 85 BCG, López-Cruz et al. (2014) surmised that stellar light could have biased the redshift and classification given by Richards et al. (2009). López-Cruz et al. (2014) speculated that SDSS J004150.75-091824.3 could be “a third” supermassive black hole associated with the Abell 85 brightest cluster galaxy. The other two black holes of Abell 85 would have been a hypothetical binary pair in the core of the BCG. López-Cruz et al. (2014) claimed the presence of a substantial light deficit on the nuclear region of the Abell 85 BCG. López-Cruz et al. (2014) interpreted this light deficit as evidence for the presence of an “ultramassive” SMBH.
When galaxies merge, their central black holes are thought to consolidate into one entity. During the process of black hole coalescence, supermassive black hole binaries are thus created (Begelman et al., 1980). Stars that come in close proximity to a binary supermassive black hole (SMBH) can be slingshot away through gravitational interactions (Begelman et al., 1980; Ebisuzaki et al., 1991; Milosavljević & Merritt, 2001). Over time, as this process repeats itself, a SMBH creates a deficit of stars in its vicinity.
The presence of a binary SMBH can then be inferred by the detection of stellar light deficits on the optical surface brightness profiles of, for instance, elliptical galaxies (e.g. Graham, 2004; Dullo, 2019). When light deficits are present in surface brightness profiles, the steep slope of the profile in the outer parts of the galaxy becomes flatter, sometimes even close to constant, with decreasing radii (e.g. Graham, 2004).
Given the small spatial scales involved, the accurate characterization of the properties of stellar cores and, among them, their light deficits, require Hubble Space Telescope data (Ferrarese et al., 2006). Light deficits associated with SMBH occur in spatial scales of a few hundred parsecs in galaxies located megaparsecs away. For instance, cores in galaxies belonging to the Virgo cluster have spatial scales of 1 to 4 arcseconds (Ferrarese et al., 1994).
With few exceptions (e.g., 3C 75; Owen, 1985), unequivocal detections of close pairs of binary AGN remain rare. Binary black holes are elusive, even when dedicated observing campaigns are carried out (Tingay & Wayth, 2011).
In the following sections a new radio map of the Abell 85 BCG with the highest resolution ever achieved is introduced. This radio map is used to search for the presence of a binary AGN. A new optical spectrum of SDSS J004150.75-091824.3 is also presented. This spectrum is used to make a precise determination of the redshift for this source. A new Gemini spectrum of the Abell 85 BCG is also shown. High-resolution imaging obtained with Gemini and Chandra are used as ancillary data to place the new observations in a wider context. Finally, by presenting optical data obtained under different atmospheric conditions we illustrate the effect of seeing on optical surface brightness profiles.
At the distance of Abell 85 ( Mpc) 1 corresponds to 1.075 kpc.
2 Observations and data reduction
2.1 X-ray Imaging
The Chandra data shown in Fig. 1 was analyzed and presented by Ichinohe et al. (2015). Details of the observations and data reduction for this dataset are given in that reference.
Ichinohe et al. (2015) created a Chandra image that is a factor of 5 deeper than the initial Chandra image of 37 ks analyzed by Kempner et al. (2002). Ichinohe et al. (2015) also included XMM–-Newton and Suzaku data out to the virial radius of the cluster. Ichinohe et al. (2015) found evidence that the Abell 85 cluster is undergoing two mergers and has gas sloshing out to a radius of kpc from its center.
2.2 Optical Imaging
Figure 1 also shows a Gemini image of the Abell 85 BCG. The Gemini -band image was obtained with the Gemini Multi-Object Spectrograph (GMOS). This dataset was presented and discussed in depth in Madrid & Donzelli (2016). A new Gemini image obtained under poor seeing conditions is also presented in section 4 (Gemini program GS-2016B-Q-87). The data reduction for this new image is identical to the one described in Madrid & Donzelli (2016).
2.3 Optical Spectroscopy
The Gemini spectrum of the Abell 85 BCG was obtained with GMOS-South on spectroscopic mode. Five exposures of 900 seconds were obtained on 2016 September 14. The grating used was R400 which has its blaze wavelength at 764 nanometers. The slit width was 1.5.
The first task of the data reduction process is to apply gprepare to the raw science data
obtained through the Gemini archive. gprepare applies a flatfield and performs overscan
subtraction. The spectrum is extracted from the fits file by using the task gsextract.
This tasks extracts the intensity values along the spectral dimension of the CCD chip.
Calibration is carried out with the task gswavelength. The details of the reduction procedure
used here were described in Madrid & Donzelli (2013).
The spectroscopic data for SDSS J004150.75-091824.3 was obtained with the Optical System for Imaging and low Intermediate Resolution Integrated Spectroscopy (OSIRIS) on the Gran Telescopio Canarias. OSIRIS is an optical imager and spectrograph. A binning was used for the CCD resulting in a spatial scale of 0.26 per pixel. Likewise, the resulting spectral resolution is 2.12 Å/pixel. The slit had a width of 1 and the grating in use was R1000B.
The spectrum of SDSS J004150.75-091824.3 presented here was obtained on 2017 August 17. Raw science data, bias, flats and arcs were retrieved from the Grantecan public archive.
Both science data extraction and sky subtraction were done using the pyraf task apall. In the same way, arcs, bias and flats are processed with apall. The science spectra had the bias removed and were normalized by the flat. The HgAr and Ne calibration arcs were used for wavelength calibration. The emission lines given on the reference arcs provided by the observatory were used as part of the wavelength calibration. The spectra were extracted using a spatial width of 7 pixels, or 1.8. The spectrophotometric standard star Feige 110 is used to flux calibrate the spectra using the tasks standard, sensfunction and calibrate.
2.4 Radio Data
Karl G. Jansky Very Large Array (VLA) data was obtained from the National Radio Astronomy Observatory public archive. Abell 85 was observed with the VLA in its A configuration on 2018 March 25. The total observation time was 4 hours, resulting in 2.8 hours on-source after overheads. The observations used the X-band receiver with 4 GHz of correlated bandwidth centered at 10 GHz.
The VLA data were processed with a series of tasks found within the Common Astronomy Software Applications (CASA). Standard interferometric data reduction procedures were followed to calibrate the delay, bandpass, phase, amplitude and flux. One round of phase-only self-calibration was also included. During imaging, a Briggs robust weighting of was used to suppress Point Spread Function (PSF) sidelobes and achieve a resolution of at a position angle of 32 degrees. The final image had a measured sensitivity of 3 Jy/beam.
3 The Abell 85 AGN
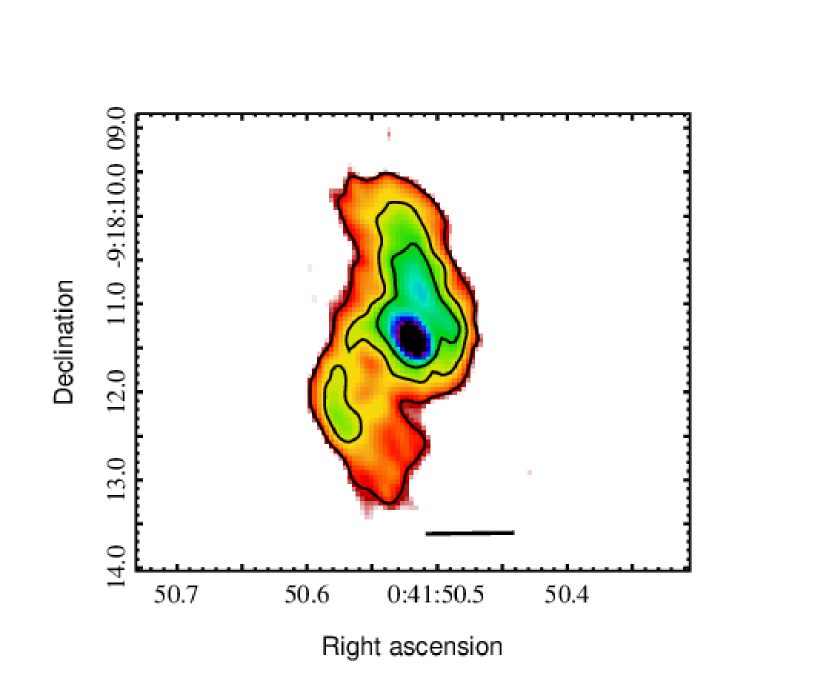
The high-resolution and sensitivity of the radio data allows the detection of the central AGN and bipolar diffuse emission. Compact radio sources are ubiquitous in the core of early type elliptical galaxies (Ekers & Ekers, 1973), and the Abell 85 BCG is no exception. The VLA image also shows two bipolar jets emanating from the compact core. Both jets are less than 2 kpc in length (projected). The image shown in Fig. 2 is the first radio image to clearly identify the jets emanating from the Abell 85 BCG.
Interestingly, the southern jet is well aligned with the location of the X-ray cavity described by Durret et al. (2005) and Ichinohe et al. (2015); see Fig. 1. This X-ray cavity is, however, at about 20 kpc south of the core whereas the southern radio jet does not show radio emission beyond 2 kpc from the center of the BCG.
The VLA image of the Abell 85 BCG shows a single core and no evidence of double nuclei. Similarly, the X-ray image only shows diffuse X-ray emission in the core of the galaxy. Binary black holes, when present, appear as two distinct point sources in X-ray images (Komossa et al., 2003; Fabbiano et al., 2011).
The null detection of binary black holes in the X-ray and very high resolution radio data
implies that the central massive object in the Abell 85 BCG is likely a single
entity. Should a binary AGN exist in the Abell 85 BCG, its detection would require very
long baseline interferometry (VLBI) given that the pair would be separated by less than
400 pc. Using data obtained with the Very Long Baseline Array (VLBA), Rodriguez et al. (2006)
discovered a supermassive binary black hole in the radio galaxy IVS 0402379
(B1950)111IVS stands for International VLBI Service. The VLBA Calibrator Survey
gives the (J2000.0) name for this source: J0405+3803 (Beasley et al., 2002).,
the projected separation between the two black holes is only 7.3 pc.
4 SDSS J004150.75-091824.3 is a distant quasar
Three star-like sources are present in the optical image within 14 (or 15.05 kpc) of the nucleus of the BCG. One of these sources is SDSS J004150.75-091824.3, see Fig. 1. On the other hand, in the X-ray image, SDSS J004150.75-091824.3 is the only point-like source within one arcminute of the center of Abell 85. With the Gemini image we can derive an accurate position for SDSS J004150.75-091824.3 at R.A.=0:41:50.764 and dec=9:18:24.4.
The core of Abell 85 has a diffuse and extended X-ray emission that envelops SDSS J004150.75-091824.3. The presence of this extended X-ray emission was misinterpreted by López-Cruz et al. (2014) as an indication that SDSS J004150.75-091824.3 was a low redshift AGN.
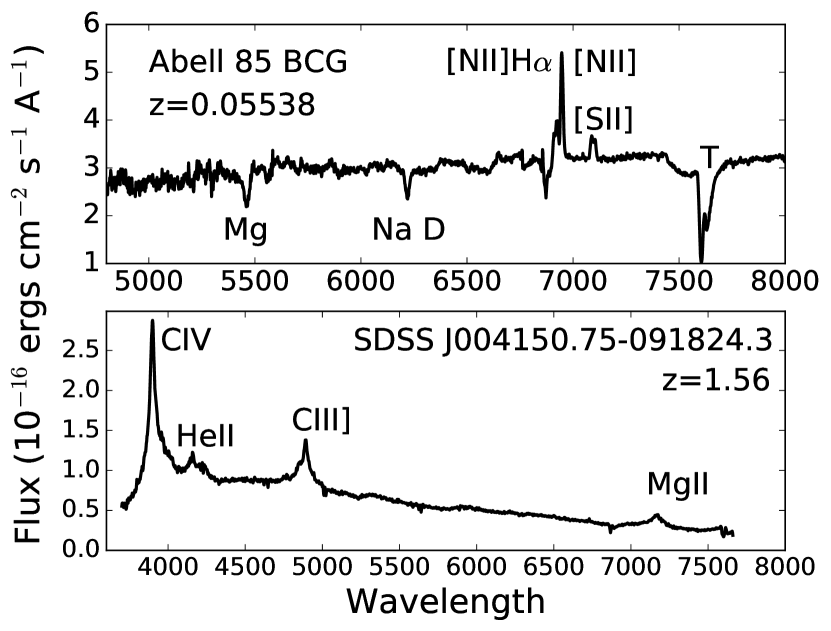
In Fig. 3, the spectrum of SDSS J004150.75-091824.3 show four prominent emission lines: C iv, He ii, C iii], and Mg ii. These emission lines are characteristic of quasar spectra, e.g.,Wilkes (1986); Vanden Berk et al. (2001). With the Grantecan spectrum the redshift of SDSS J004150.75-091824.3 is determined to be .
The spectrum of the Abell 85 BCG, also shown in Fig. 3, has a prominent H [N ii] 6584 emission line. The H line has a [N ii] emission line on either side. The forbidden [S ii] 6717/6730 doublet is also clearly visible. The Franhofer absorption lines for magnesium and sodium are easily seen. The above emission and absorption lines are used to confirm the redshift of the BCG to be . This value is in agreement with several earlier determinations of the redshift of the Abell 85 BCG (Nesci & Altamore, 1990, among others).
It should be noted that the spectrum of the BCG is similar to the archival spectrum of this galaxy available through the SDSS archive. The spectrum of the Abell 85 BCG is presented here as a comparison with the spectrum of SDSS J004150.75-091824.3 but also as a baseline spectrum for studies of this galaxy, e.g., Edwards et al. (2016).
5 Mirage Supermassive Black Holes
5.1 The Effect of Seeing on Optical Surface Brightness Profiles
The presence of a binary black hole in the Abell 85 BCG was postulated based on the analysis of its surface brightness profile (López-Cruz et al., 2014). However, the obvious effect of poor seeing has been ignored in recent studies that attempt to use ground-based data without sufficient resolution to study the surface brightness profile of the Abell 85 BCG. This section highlights the risks of inferring the presence of a light deficit, or any other nuclear property of a distant galaxy, using ground-based data.
The BCG of Abell 85 has been reported during recent years as having both a light deficit and a light excess in its core (López-Cruz et al., 2014; Bonfini et al., 2015; Madrid & Donzelli, 2016; Mehrgan et al., 2019). These apparently contradicting results are a clear example of the effects of data quality on optical surface brightness profiles.
 |
 |
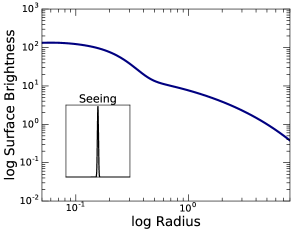
The effect of seeing on surface brightness profiles can be easily modeled, as we do in this section. Atmospheric turbulence blurs and smears images obtained with ground based telescopes. Poor seeing degrades and erases the innermost structure of surface brightness profiles. This effect is not only intuitive but was well defined over four decades ago by Schweizer (1979), among others. More recently, Côté et al. (2006) showed that data with poor seeing miss the presence of structures in galactic nuclei.
Let’s consider a galaxy whose light profile can be described by two main components: a nuclear point spread function and an outer spheroid. The nuclear component can be accurately modeled as a Gaussian and the main component can be represented by a Sérsic function (Sérsic, 1968).
The surface brightness profile of the above galaxy observed with a ground based telescope can be evaluated by convolving its profile with the seeing. Here, seeing is considered as the distorting effects of both atmospheric turbulence and telescope optics.
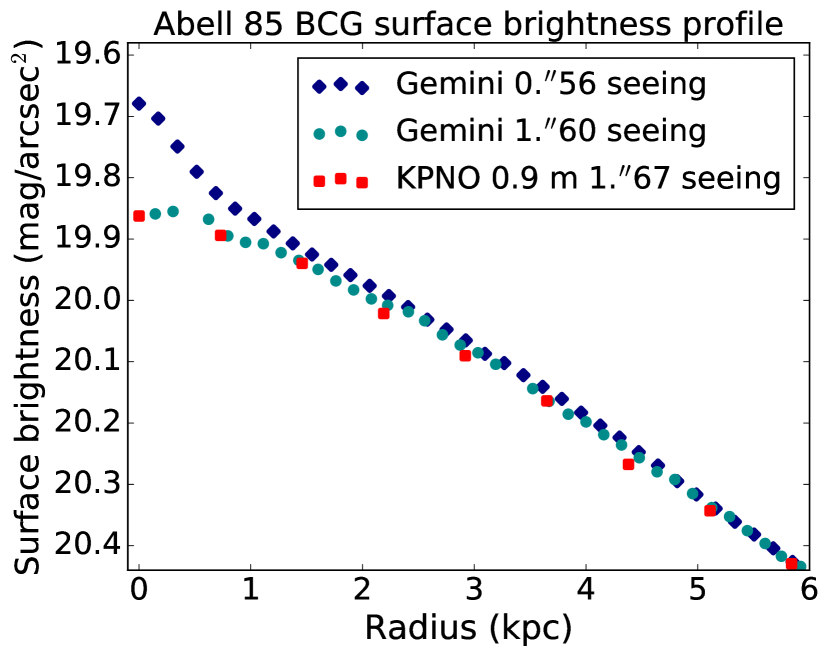
Fig. 4 shows the effect of seeing on the innermost regions of a surface brightness profile. Observing a galaxy light profile with excellent seeing recovers the actual profile with no distortions, as shown in the top panel of Fig. 4. Both the nuclear and spheroidal components are detected when the light profile is obtained under ideal seeing conditions.
On the other hand, when the same light profile is observed with poor seeing, its central part is entirely misrepresented, as shown in the bottom panel of Fig. 4. The central nuclear component is fully blurred by seeing effects. Under bad seeing conditions, instead of detecting a central Gaussian component the slope of the profile becomes flat toward the nucleus of the galaxy.
A surface brightness profile observed with bad seeing could give the illusion of a light deficit. Poor seeing also alters the light profile creating a break on its slope. The above can mislead observers to believe on the detection of a depleted core and its associated SMBH when galaxies are observed with poor seeing conditions.
5.2 Optical observations of Abell 85
López-Cruz et al. (2014) used data obtained with the Kitt Peak National Observatory (KPNO) 0.9-meter telescope to analyze the central surface brightness profile of the Abell 85 BCG. The seeing for the KPNO 0.9-m data is reported to be 1.67. Bonfini et al. (2015) published a detailed analysis of the surface brightness profile of Abell 85 using data obtained with the Canada-France-Hawaii telescope (CFHT). The CFHT data analyzed by Bonfini et al. (2015) has subarcsecond resolution: 0.74. Bonfini et al. (2015) found that the light deficit claimed by López-Cruz et al. (2014) did not exist. Moreover, contrary to a light deficit, Bonfini et al. (2015) find a modest light excess in the core of the Abell 85 BCG.
Madrid & Donzelli (2016) obtained Gemini data of the Abell 85 BCG with a seeing of 0.56. Madrid & Donzelli (2016) confirmed the presence of a light excess in the core of this galaxy initially found by Bonfini et al. (2015). The superior seeing of the Gemini data allow Madrid & Donzelli (2016) to detect an additional nuclear component within the inner 2 kpc of the center of the Abell 85 BCG. This nuclear component is well resolved, with a FWHM of 0.85. At the distance of Abell 85 this nuclear component has a size of 0.9 kpc (Madrid & Donzelli, 2016).
The empirical effect of seeing on the central surface brightness profile of the Abell 85 BCG is shown in Fig. 5. This figure shows the light profile derived with Gemini data obtained during two different epochs with different seeing conditions. Fig. 5 also shows the KPNO 0.9-m data used by López-Cruz et al. (2014). Note that the true inner structure is lost to both Gemini and KPNO 0.9-m under poor seeing conditions.
The Gemini data presented in Fig. 5 allow us to quantify the impact of seeing. The surface brightness profile with excellent seeing and the Gemini profile with poor seeing have a small, but measurable, difference of 0.01 mag/arcsec at kpc. This difference increases to 0.02 mag/arcsec at kpc, and to 0.04 mag/arcsec at kpc. As shown in Fig. 5, the two Gemini profiles begin to diverge at about 1.5 kpc from the nucleus of the galaxy.
The fact that the profile obtained with bad seeing fails to accurately record the true profile of the galaxy at such large radii is crucial. López-Cruz et al. (2014) claims that the Abell 85 BCG has a cusp radius of kpc. This value is within the range where the surface brightness profile is affected by seeing effects. It is precisely this cusp radius that is used to infer the presence of a supermassive black hole.
6 Final remarks
A new VLA map shows bipolar AGN jets aligned along the north-south direction in the Abell 85 BCG. X-ray and radio images show no evidence of a binary black hole in the core of this galaxy. The optical spectra shown here demonstrate that the Abell 85 BCG and SDSS J004150.75-091824.3 are two entirely different objects with no relation whatsoever, other than their close projected proximity in the sky.
Studies searching for light deficits associated with SMBHs in the inner regions of surface brightness profiles must use high resolution data. Poor seeing distorts the central region of any surface brightness profile creating the mirage hallmarks of a SMBH. When possible, the ideal surface brightness profile should be created by combining HST data in the core and ground based data on the outskirts of any given galaxy.
References
- Agulli et al. (2016) Agulli, I., Aguerri, J. A. L., Sánchez-Janssen, et al. 2016, MNRAS, 458, 1590
- Astropy et al. (2013) The Astropy Collaboration, Robitaille, T. P., Tollerud, E. J., et al. 2013, A&A, 558, A33
- Bagchi et al. (1998) Bagchi, J., Pislar, V., & Lima Neto, G. B. 1998, MNRAS, 296, L23
- Beasley et al. (2002) Beasley, A. J., Gordon, D., Peck, A. B. et al. 2002, ApJS, 141, 13
- Begelman et al. (1980) Begelman, M. C., Blandford, R. D., & Rees, M. J. 1980, Nature, 287, 307
- Bonfini et al. (2015) Bonfini, P., Dullo, B. T., & Graham, A. W. 2015, ApJ, 807, 136
- Côté et al. (2006) Côté, P., Piatek, S., Ferrarese, L., et al. 2006, ApJS, 165, 57
- Dullo (2019) Dullo, B. T. 2019, ApJ, 886, 80
- Durret et al. (2003) Durret F., Churazov E., Lima Neto G. B., & Forman W. 2003, A&A, 403, L29
- Durret et al. (2005) Durret F., Lima Neto G. B., & Forman W. 2005, A&A, 432, 809
- Ebisuzaki et al. (1991) Ebisuzaki, T., Makino, J., & Okumura, S. K. 1991, Nature, 354, 212
- Edwards et al. (2016) Edwards, L. O. V., Alpert, H. S., Trierweiler, I. L. 2016, MNRAS, 461, 230
- Ekers & Ekers (1973) Ekers, R. D. & Ekers, J. A. 1973, A&A, 24, 247
- Fabbiano et al. (2011) Fabbiano, G., Wang, J., Elvis, M., & Risaliti, G. 2011, Nature, 477, 431
- Ferrarese et al. (1994) Ferrarese, L., van den Bosch, F. C., Ford, H. C. et al. 1994, AJ, 108, 1598
- Ferrarese et al. (2006) Ferrarese, L., Côté, P., Jordán, A., et al. 2006, ApJS, 164, 334
- Graham (2004) Graham, A. W. 2004, ApJ, 613, L33
- Hunter (2007) Hunter, J. D. 2007, Computing in Science & Engineering, 9, 90
- Ichinohe et al. (2015) Ichinohe, Y., Werner, N., Simionescu, A., et al. 2015, MNRAS, 448, 2971
- Kempner et al. (2002) Kempner J. C., Sarazin C. L., Ricker P. M. 2002, ApJ, 579, 236
- Komossa et al. (2003) Komossa, S., Burwitz, V., Hasinger, G., et al. 2003, ApJL, 582, L15
- López-Cruz et al. (2014) López-Cruz, O., Añorve, C., Birkinshaw, M. et al. 2014, ApJ, 795, L31
- Madrid & Donzelli (2013) Madrid, J. P. & Donzelli, C. J. 2013, ApJ, 710, 158
- Madrid & Donzelli (2016) Madrid, J. P. & Donzelli, C. J. 2016, ApJ, 819, 50
- McMullin et al. (2007) McMullin, J. P., Waters, B., Schiebel, D., et al. 2007, Astronomical Data Analysis Software and Systems XVI (ASP Conf. Ser. 376), ed. R. A. Shaw, F. Hill, & D. J. Bell (San Francisco, CA: ASP), 127
- Mehrgan et al. (2019) Mehrgan, K., Thomas, J., Saglia, R., et al. 2019, ApJ, 887, 195
- Milosavljević & Merritt (2001) Milosavljević, M., & Merritt, D. 2001, ApJ, 563, 34
- Nesci & Altamore (1990) Nesci, R. & Altamore, A. 1990, A&A, 234, 60
- Owen (1985) Owen, F. N., O’Dea, C. P., Inoue, M., & Eilek, J. A. 1985, ApJ, 294, L85
- Owen et al. (1997) Owen, F. N. & Ledlow, M. J. 1997, ApJSS, 108, 41
- Richards et al. (2004) Richards, G. T., Nichol, R. C., Gray, A. G., et al. 2004, ApJS, 155, 257
- Richards et al. (2009) Richards, G. T., Myers, A. D., Gray, A. G., et al. 2009, ApJS, 180, 67
- Rodriguez et al. (2006) Rodriguez, C., Taylor, G. B., Zavala, R. T., et al. 2006, ApJ, 546, 49
- Schenck et al. (2014) Schenck, D. E., Datta, A., Burns, J. O., & Skillman, S. 2014, AJ, 148, 23
- Schweizer (1979) Schweizer, F. 1979, ApJ, 233, 23
- Sérsic (1968) Sérsic J. L. 1968, Atlas de Galaxias Australes, Córdoba: Observatorio Astronómico
- Slee et al. (2001) Slee, O. B., Roy, A. L., Murgia, M., et al. 2001, AJ, 122, 1172
- Tingay & Wayth (2011) Tingay, S. J. & Wayth, R. B. 2011, AJ, 141, 174
- Vanden Berk et al. (2001) Vanden Berk, D. E., Richards, G. T., Bauer, A., et al. 2001, AJ, 122, 549
- Van Der Walt et al. (2011) Van Der Walt, S., Colbert, S. C., & Varoquaux, G. 2011, Computing in Science & Engineering, 13, 22
- Wilkes (1986) Wilkes, B. 1986, MNRAS, 218, 331