Autonomously Probing Viscoelasticity in Disordered Suspensions
Abstract
Recent experiments show a strong rotational-diffusion enhancement for self-propelled microrheological probes in colloidal glasses. Here, we provide microscopic understanding using simulations with a frictional probe-medium coupling that converts active translation into rotation. Diffusive enhancement emerges from the medium’s disordered structure and peaks at a second-order transition in the number of contacts. Our results reproduce the salient features of the colloidal glass experiment and support an effective description that is applicable to a broader class of viscoelastic suspensions.
In active microrheology waigh2005microrheology ; squires2005simple ; furst2017microrheology ; gazuz2009active , single particles are externally driven to probe the properties of the host medium. Inspired by this, self-driven colloidal (m-sized) particles have recently been similarly employed bechinger2016active ; gomez2016dynamics ; lozano2019active . The autonomous nature of such active probes (APs) bechinger2016active gives rise to a truly novel microrheology, wherein the disordered environment not only induces a response dependent on local properties, but also guides the AP’s exploration lozano2019active .
Experiments with APs in viscoelastic polymer suspensions gomez2016dynamics and quasi-2D glassy systems of bidisperse colloids lozano2019active reported orders-of-magnitude enhancement of the AP’s rotational diffusion. This is remarkable considering the apparent difference in host medium. These observations are related to the underlying viscoelastic properties of the medium and can be heuristically understood in terms of a time-delayed mechanical response of the viscoelastic surrounding, i.e., a memory effect gomez2016dynamics ; lozano2018run ; narinder2018memory ; lozano2019active . Lozano et al. lozano2019active indeed showed that rotational-diffusion enhancement (RDE) peaked around the glass transition, where the relaxation time of the suspension is maximum. Key to these experiments is that the probe does not significantly perturb the environment, which sets these apart from other scenarios involving active particles and the glass transition berthier2013non ; ni2013pushing ; berthier2014nonequilibrium ; nandi2018random . Recent simulations qi2020enhanced gave insight into the role of polymer-AP interactions on the enhancement observed by Gomez-Solano et al. gomez2016dynamics . However, there is presently no microscopic understanding of what underlies the RDE in the glassy system.
In this Letter, we present a simple simulation model, wherein active translation is converted to rotation through a frictional contact coupling between the AP and its surrounding. Our description has no intrinsic memory effect, commonplace in other frictional models, i.e., our model is Markovian on the single-particle level. Nonetheless, a time-delayed mechanical response emerges from the AP’s interaction with the viscoelastic environment, which is stronger for softer potentials. Together with the local disorder of the colloidal suspension, this is sufficient to reproduce the spiked and asymmetric RDE of Ref. lozano2019active .
We closely matched the experiment of Ref. lozano2019active in our Brownian dynamics simulations with regular Gaussian noise, i.e., without memory. We prepared quasi-2D systems of bidisperse passive particles with 1:1 stoichiometric ratio with respective diameters and ; size ratio 1.4. These repelled each other via a Weeks-Chandler-Andersen (WCA) interaction with strength . We examined the effect of WCA softness by considering , , and with the Boltzmann constant and the temperature. Our units of length, time, and energy were , , and , respectively, with the bulk translational (and the 2D rotational) diffusion of the largest species. We simulated between 274 and 3014 particles in a periodic square simulation box with edge length , corresponding to area fractions . Here, with the effective hard-core diameter of the soft particles, obtained from the radial distribution function, see Fig. S2 supplement . Standard self-intermediate scattering function (SISF) analysis, see Fig. S1 supplement , revealed that the systems underwent a glass transition at independent of , in line with the hard-core normalization of . The particle displacements also showed a strong non-Gaussianity at , see Fig. S9 supplement . Full details of the preparation procedure are provided in Section S2 supplement .
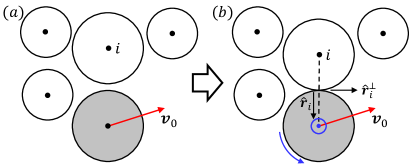
After equilibration, we randomly selected a single large passive particle and turned this into an AP, sampling for times up to . Our AP was modeled as an active Brownian particle with a self-propulsion velocity given by , see Section S5 supplement . Here, the speed with the Péclet number; we maintained throughout to best approach the conditions of the experiment lozano2019active . We imposed that the AP interacted with its passive neighbors through a pair-wise frictional coupling, which transformed self-propulsion into reorientation:
| (1) |
with the angular-velocity contribution due to contact with the -th neighbor, the coupling coefficient, and and the normal and tangent contact unit vectors, respectively, as defined in Fig. 1. We maintained throughout for convenience. Angular velocity was generated when the distance between the AP and a Brownian neighbor was less than the WCA cut-off range, i.e., times the mean diameter of the pair, see Fig. 1.
In formulating the model, we took inspiration from recent work on the effects of friction in jammed systems wyart2014discontinuous ; seto2013discontinuous ; mari2014shear ; guy2015towards ; hsu2018roughness ; guy2020testing ; singh2020shear . However, unlike the standard granular friction model cundall1979discrete ; luding2005anisotropy , we did not incorporate memory effects into the generation of , i.e., our single-particle dynamics is Markovian. Our neighbor criterion encodes that reorientation occurs against a sufficiently rigid (solid) background, when the separation is small. The data provided in the main text assumes two additional contacts per passive particle for coupling to occur — we took inspiration from the frictional isostaticity criterion in granular systems — but the modeling is qualitatively robust to such a change, see Section S5 supplement .
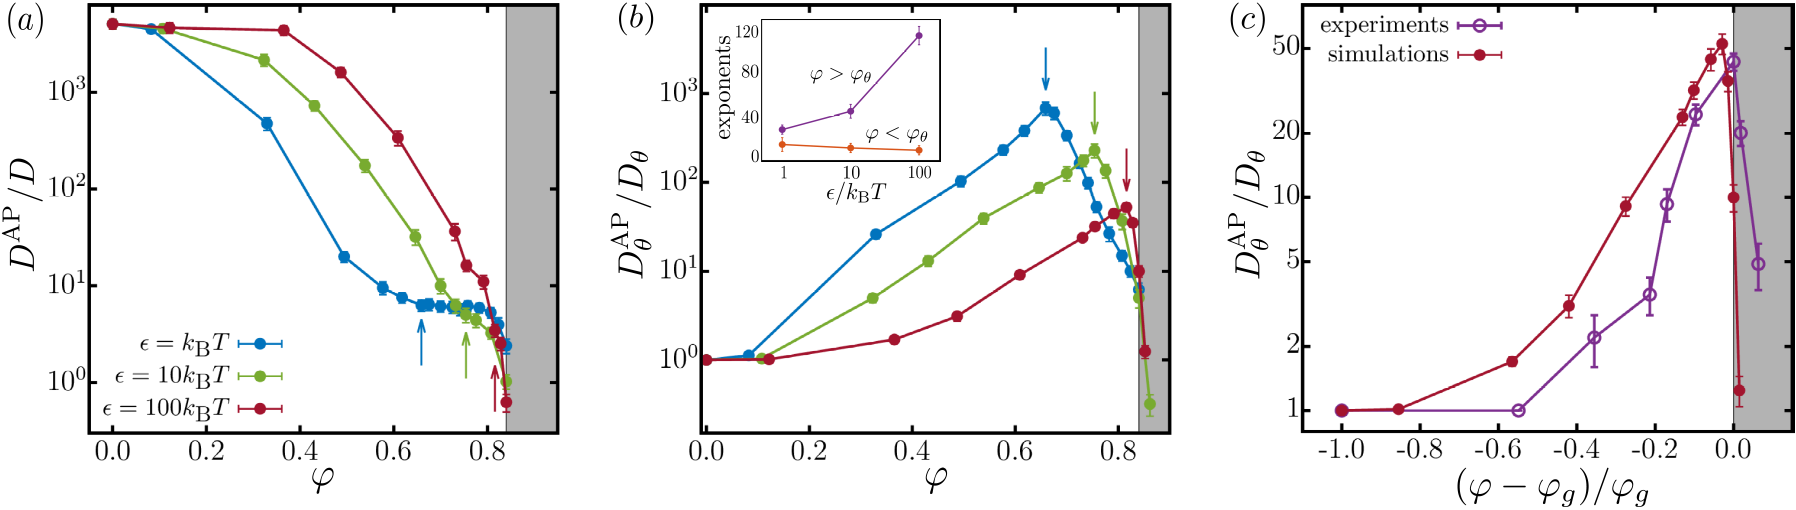
We obtained the AP’s translational, , and rotational, , diffusion coefficients from the respective long-time mean-squared displacements and , see Figs. S4 and S5 supplement . Figure 2a shows that decreased upon approaching the glass transition, due to caging effects in the passive medium, i.e., the active particle weakly perturbs the passive surrounding and cannot effectively push neighbors out of the way. Our neighbor criterion led to a strong correlation between translation and rotation of the AP at sufficiently high , see Fig. S11 supplement , similar to the experiment lozano2019active . For , the coupling caused to plateau below the area fraction, , for which the maximal RDE was found (vertical arrows). That is, active forward motion is almost entirely converted into rotation. A similar plateau was observed in experiments lozano2019active ; in the simulations the plateau shrunk with increasing .
We observed a peak as a function of , see Fig. 2b. The RDE proved to be systematically larger for softer potentials, with the peak moving to lower . The greater enhancement was the result of a larger viscoelastic response in the low- systems, see Fig. S10 supplement . The shift in the peak is correlated with a systematic increase in the number of neighbor contacts with decreasing , as will be discussed shortly. We also found an asymmetry of the exponential decay of the RDE away from , see the inset to Fig. 2b, reminiscent of the experimental trend lozano2019active ; the fit procedure by which the exponents were obtained is detailed in Section S7 supplement . For all , the exponent by which the RDE increased for , was the same within the error (standard error of the mean always). This makes sense, the coupling mechanisms is the same for all and the AP is in a regime where it can readily push passive particles out of the way and sample neighborhoods, as we will return to in the discussion. The coefficient of RDE decay (), however, increased non-linearly with . This is because RDE reduction is due to the AP staying longer in the same neighborhood, as the system becomes increasingly dense and stiff. Lastly, our simple choice for the coupling (1) led to a linear velocity dependence of the maximal RDE. The quadratic experimental dependence of the RDE on the AP velocity may be reproduced through a speed-dependent coupling: , which is representative of a load-based coupling followup .
We tested our model’s ability to capture the experimental RDE by comparing to Ref. lozano2019active , see Fig. 2c. Here, we chose as this data closest matched the experiment. We accounted for the difference in the location of the glass transition between experiment () and simulation () through a normalized area fraction . The agreement is excellent in view of limited parameter tuning. We have kept our modeling minimal with an outlook on a general viscoelastic fluids, possible refinements are listed in the discussion.
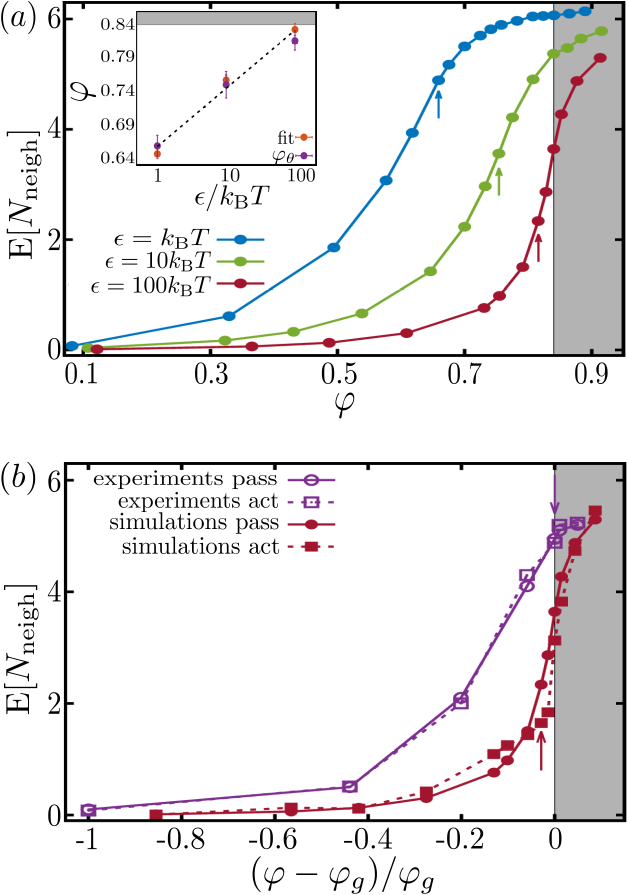
In the experiment, care was taken to probe the linear-response regime, i.e., the AP only weakly perturbed the local structure; a condition that we approached in our simulations. We therefore anticipated that a structural transition in the passive system determines . We tested this hypothesis by computing the probability density function (PDF) of the number of neighbors (soft contacts), , surrounding passive particles of size (same as the AP), see Figs. S6-S8 supplement . The inset to Fig. 3a shows that for the 3-contact criterion the location of the inflection point of the associated expectation value (orange) coincided with (purple) for all ; a clear structural signal for and is robust to our contact criterion, see Section S5 supplement . The inflection-point fit procedure is outlined in Section S7 supplement . Figure 3b compares the local structure around active and passive particles between experiment and simulation. The main difference is the steepness of the curves, yet, within the error, the experimental RDE peak also lay at the inflection point. The importance of an inflection point prompts us to suggest that the associated structural transition is second order.
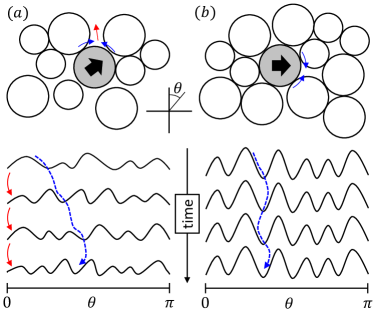
We are now in a position to understand how RDE occurs when there is a frictional coupling; this concept is illustrated in Fig. 4. In a dilute environment (), the AP intermittently encounters passive neighbors and these are predominantly pushed out of the way. That is, there is no or very limited active reorientation, a feature captured in our model via our neighbor criterion. When the local environment becomes more crowded and stiffer, the AP pushes itself off against its neighbors and can actively reorient. This can be pictured as angular motion in an effective ‘orientational potential’. This potential can be modified by the AP as it probes the local environment for weak points, by which it can escape, or through thermal fluctuations that rearrange the neighbors.
For deformable neighborhoods (), the AP can easily overcome the barriers and hop to another neighborhood reorienting in each new orientational potential, see Fig. 4a. This process repeats itself and leads to continuous reorientation that averages out on sufficiently long time scales to enhanced rotational diffusion. The AP does not couple sufficiently to the environment to induce a truly long-time persistence, as has been found in other experimental systems narinder2018memory . However, for larger APs than considered here at sufficiently high velocities, we expect our model to recover such persistent rotation.
Orientational memory emerges by the way the AP moves in the orientational potential, i.e., toward a local weak spot. This expresses itself as a decaying reorientational persistence with clear signs of correlation, see Fig. S12 supplement . Conversely, in a very dense environment (), the AP is trapped by surrounding neighbors, see Fig. S7 that shows a homogeneous caging. In this case, the AP will orient toward a local weak spot and become stuck, see Fig. 4b. This can be understood as an orientational potential with high barriers. The limited per-cage active reorientation is smeared out over the large times between hops, leading to an insignificant RDE.
The RDE peak () is located where the amount of reorientation per environment and hopping rate complement each other. Figure S11 shows a maximal correlation between (active) displacement and reorientation at supplement . This is related to the value of for which the average angular distribution of AP-neighbor contacts rapidly becomes homogeneous, see Fig. S7, which is commensurate with the rapid rise in . That is, the more homogeneous the environment, the weaker the enhancement, as pair-wise contributions cancel each other out and the gaps between particles become increasingly stable points of the orientational potential. This also leads to a change in trend for the emergent viscoelasticity as a function of , see Fig. S10 supplement .
Our simple model captures the salient features of the experiment and provides microscopic insights into the origin of the RDE. However, the differences also prove informative. Starting with the passive system, we observe that the experimental glass transition was found at and displayed a sharp change of the SISF from fluid-like to arrested lozano2019active . Our otherwise matched simulations revealed and a broader change in the SISF. Increasing would sharpen the transition, but not affect the location of . It would also eliminate the RDE, extrapolating the trend in our data, which is the crucial experimental feature. That is, the RDE requires viscoelasticity of the environment, which systematically decreases with increasing at , see Fig. S10 supplement .
Another important difference between simulation and experiment is that the RDE peak was found before the glass transition in the former. This is because particles come into contact at the edge of the soft potential, leading to early enhancement. However, RDE-reducing stiffness and homogeneity of the environment set in well before the dynamics becomes fully arrested, see Figs. S10 and S7, respectively, from the SI supplement .
We suspect that the apparent dichotomy may be resolved by introducing contact friction between the passive colloids near the glass transition, i.e., a more complete friction-based modeling than pursued here. Sliding friction between passive particles would lead to an earlier onset of arrest and the transition in neighbor contacts could force the glass transition to coincide with it. The reduced for full dynamic arrest, would also give the experimental (almost) hard-sphere particles sufficient wiggle room to move and exhibit RDE lozano2019active , as at the simulated glass transition there is virtually no probe displacement, see Fig. 2a. Local contacts in the dense fluid and potential sliding-friction that these induce, could also explain the broadening of and the presence of the plateau in with respect to the simulation, see Figs. 3b and 2a, respectively.
The above should be considered in the light of recent experiments showing the relevance of contacts to the aging of colloidal glasses bonacci2020contact and the known effect of friction on the location of the athermal shear thickening and jamming transition vaagberg2014dissipation ; comtet2017pairwise . Hydrodynamic interactions have also been considered in this context and might lead to similar effects ladd1995temporal ; wang2020hydrodynamic . However, the experiment lozano2019active did not reveal a significant change in the passive orientational diffusion even at , which suggests that lubrication-based dampening played a limited role. If friction is indeed present in experimental colloidal glass formers lozano2019active ; li2020anatomy ; bonacci2020contact , this would limit their fundamental connection to idealized hard-sphere systems, but also offers new richness. This will be the subject of future study.
Lastly, we consider the experiments on APs that exhibited RDE in a viscoelastic polymer suspension gomez2016dynamics . Based on our modeling, we expect that for very soft particles (polymer blobs) RDE can be observed at low dilution, i.e., our simple description is capable of capturing RDE in such a viscoelastic fluid. A recent multi-particle collision dynamics study using a self-propelled particle (hydrodynamic squirmer) and model polymers qi2020enhanced indicated three key ingredients: (i) activity induced polymer desorption, (ii) asymmetric encounters with polymers, and (iii) heterogeneity of the polymer suspension. In our model, (iii) is covered by the bidisperse particle size, though we expect that disorder is generally sufficient; (i) and (ii) lead to a net reorientation. The strength of our approach lies in its simplicity, consequent computational efficiency, and generality.
In conclusion, we have provided a general microscopic understanding of the experimentally observed rotational-diffusion enhancement of active probes gomez2016dynamics ; lozano2019active . In our model, activity-based, frictional coupling of linear and angular motion conjoins with the underlying structural characteristic of the disordered colloidal fluid that exhibits a viscoelastic response, to bring about the effect. Maximal enhancement occurs when there is a second-order transition in average ‘soft’ neighbor contacts. This insight should prove critical for future experiments involving autonomous microrheological probes in complex environments, such as active (biological) fluids.
JdG gratefully recognizes the Dutch Research Council (NWO) for funding this research through Start-Up Grant 740.018.013. CB acknowledges financial support by the ERC Advanced Grant ASCIR (Grant No.693683) and by the German Research Foundation (DFG) through the priority programme SPP 1726. We thank F. Smallenburg, M. Hermes, and L. Filion for useful discussions.
Author Contributions: Conceptualization, JdG; Methodology, CAV, CL, CB, and JdG; Software, CAV; Validation, CAV (lead) and CL and JdG (supporting); Investigation, CAV (lead) and CL (supporting); Original Draft, CAV and JdG; Review & Editing, JdG, CB, CAV, and CL; Funding Acquisition, Resources, and Supervision, JdG and CB. The numerical code and analysis scripts used to obtain the data presented in this publication are available in Ref. data , along with a representative subset of the data.
References
- (1) T. Waigh, Rep. Prog. Phys. 68, 685 (2005).
- (2) T. Squires and J. Brady, Phys. Fluids 17, 073101 (2005).
- (3) E. Furst and T. Squires, Microrheology, Oxford University Press (Oxford), 2017.
- (4) I. Gazuz, A. Puertas, T. Voigtmann, and M. Fuchs, Phys. Rev. Lett. 102, 248302 (2009).
- (5) C. Bechinger et al., Rev. Mod. Phys. 88, 045006 (2016).
- (6) J. Gomez-Solano, A. Blokhuis, and C. Bechinger, Phys. Rev. Lett. 116, 138301 (2016).
- (7) C. Lozano, J. Gomez-Solano, and C. Bechinger, Nat. Mater. 18, 1118 (2019).
- (8) C. Lozano, J. Gomez-Solano, and C. Bechinger, New J. Phys. 20, 015008 (2018).
- (9) N. Narinder, C. Bechinger, and J. Gomez-Solano, Phys. Rev. Lett. 121, 078003 (2018).
- (10) L. Berthier and J. Kurchan, Nat. Phys. 9, 310 (2013).
- (11) R. Ni, M. Stuart, and M. Dijkstra, Nat. Commun. 4, 1 (2013).
- (12) L. Berthier, Phys. Rev. Lett. 112, 220602 (2014).
- (13) S. Nandi et al., Proc. Nat. Ac. Sci. 115, 7688 (2018).
- (14) K. Qi, E. Westphal, G. Gompper, and R. Winkler, Phys. Rev. Lett. 124, 068001 (2020).
- (15) See Supplemental Material at http://link.aps.org/supplemental/10.1103/PhysRevLett.125.258002 for a short description of the experiment, details on preparation of the active and passive systems, and analysis of the (viscoelastic) properties, which includes Refs. hertlein2008direct ; gomez2017tuning ; shen2012contact ; mason2000estimating ; hauge1973fluctuating .
- (16) M. Wyart and M. Cates, Phys. Rev. Lett. 112, 098302 (2014).
- (17) R. Seto, R. Mari, J. Morris, and M. Denn, Phys. Rev. Lett. 111, 218301 (2013).
- (18) R. Mari, R. Seto, J. Morris, and M. Denn, J. Rheol. 58, 1693 (2014).
- (19) B. Guy, M. Hermes, and W. Poon, Phys. Rev. Lett. 115, 088304 (2015).
- (20) C.-P. Hsu, S. Ramakrishna, M. Zanini, N. Spencer, and L. Isa, Proc. Nat. Acad. Sci. 115, 5117 (2018).
- (21) B. Guy et al., Soft Matter 16, 229 (2020).
- (22) A. Singh, C. Ness, R. Seto, J. de Pablo, and H. Jaeger, Phys. Rev. Lett. 124, 248005 (2020).
- (23) P. Cundall and O. Strack, Geotech. 29, 47 (1979).
- (24) S. Luding, J. Phys.: Cond. Mat. 17, S2623 (2005).
- (25) C. Abaurrea-Velasco and J. de Graaf, Follow-up paper on the method details, in preparation, 2020.
- (26) F. Bonacci et al., Nat. Mat. 19, 775 (2020).
- (27) D. Vågberg, P. Olsson, and S. Teitel, Phys. Rev. Lett. 112, 208303 (2014).
- (28) J. Comtet et al., Nat. Commun. 8, 1 (2017).
- (29) A. Ladd, H. Gang, J. Zhu, and D. Weitz, Phys. Rev. E 52, 6550 (1995).
- (30) M. Wang, S. Jamali, and J. Brady, J. Rheol. 64, 379 (2020).
- (31) B. Li, K. Lou, W. Kob, and S. Granick, Nature 587, 225 (2020).
- (32) Open data package containing the means to reproduce the results of the simulations: https://doi.org/10.24416/UU01-NXITLI.
- (33) C. Hertlein, L. Helden, A. Gambassi, S. Dietrich, and C. Bechinger, Nature 451, 172 (2008).
- (34) J. Gomez-Solano et al., Sci. Rep. 7, 1 (2017).
- (35) T. Shen, C. O’Hern, and M. Shattuck, Phys. Rev. E 85, 011308 (2012).
- (36) T. Mason, Rheol. Acta 39, 371 (2000).
- (37) E. Hauge and A. Martin-Löf, J. Stat. Phys. 7, 259 (1973).