∎
e1e-mail: victor.gonzalez@cern.ch \thankstexte2e-mail: sumit.basu@cern.ch \thankstexte3e-mail: a.marin@gsi.de \thankstexte4e-mail: claude.pruneau@wayne.edu
Extraction of the specific shear viscosity of quark-gluon plasma from two-particle transverse momentum correlations
Abstract
The specific shear viscosity, , of the quark-gluon plasma formed in ultrarelativistic heavy-ion collisions at RHIC and LHC is estimated based on the progressive longitudinal broadening of transverse momentum two-particle correlators, , reported as a function of collision centrality by the STAR and ALICE experiments. Estimates are computed as a function of collision centrality using the Gavin ansatz which relates the longitudinal broadening to the specific shear viscosity. Freeze out times required for the use of the ansatz are computed using a linear fit of freeze out times reported as a function of the cubic root of the charged particle pseudorapidity density (/d. Estimates of based on ALICE data exhibit little to no dependence on collision centrality at LHC energy, while estimates obtained from STAR data hint that might be a function of collision centrality at top RHIC energy.
1 Introduction
A key focus of the ultrarelativistic heavy-ion collision programs conducted at the Large Hadron Collider (LHC) and the Relativistic Heavy-Ion Collider (RHIC) involves precision measurements of the properties of the quark-gluon plasma (QGP) formed in high-energy nucleus-nucleus collisions. Of particular interest are the magnitude and temperature dependence of the specific shear viscosity of the QGP, expressed as the ratio of the shear viscosity to the entropy density of the matter produced in the collisions. Shear viscosity characterizes the ability of a medium to transport momentum and carry deformations. Transverse particle anisotropy patterns, quantified in terms of anisotropic flow coefficients, measured in mid central heavy-ion collisions at RHIC and LHC are rather large and were, from the onset, relatively well reproduced by viscosity free hydrodynamical calculations thereby suggesting the QGP might be a perfect fluid, i.e., a fluid with vanishing or negligible shear viscosity Shuryak:2003xe ; Romatschke:2007mq ; Luzum:2008cw ; Bozek:2009dw ; Song:2010mg ; Shen:2011eg . The possibility that the high temperature, high density systems formed in the midst of heavy-ion collisions might be a perfect fluid thus generated ‘quite’ a bit of excitement bnl:20050418 . Considerable experimental and theoretical efforts were consequently expanded to determine the specific shear viscosity of the matter produced at RHIC and more recently at the LHC Gale:2013da ; Heinz:2013th based on measurements of anisotropic flow in the collision transverse plane. Although theoretical efforts have been quite successful in reducing the range of compatible with state of the art measurements of flow anisotropies, there still remains a certain degree of ambiguities owing to several technical difficulties. One of these technical difficulties involves the lack of knowledge on the initial conditions of the systems produced in A–A collisions at RHIC and LHC Song:2010mg ; Qiu:2011hf ; Song:2012tv . For instance, CGC inspired initial conditions yield larger initial spatial anisotropy than MC Glauber type initial conditions and thus require a somewhat larger level of shear viscosity to match the observed flow coefficients when used as input to viscous hydrodynamics simulations. While efforts to reduce the initial conditions ambiguity based on measurements of symmetric cumulants ALICE:2016kpq ; Niemi:2015qia , in particular, have had some success, it remains of interest to identify techniques that might enable measurements of specific shear viscosity that are less susceptible to uncertainties associated with initial conditions. Such a technique exists. Proposed by Gavin et al. already more than a decade ago Gavin:2006xd , it involves measurements of the longitudinal broadening of a transverse momentum two particle correlator, now dubbed , with increasing collision centrality. The correlator , defined in Ref. Gavin:2006xd ; Sharma:2008qr , is designed to be proportional to the covariance of momentum currents and is as such sensitive to dissipative viscous forces at play during the transverse and longitudinal expansion of the matter formed in A–A collisions. Gavin et al. showed these forces lead to a longitudinal broadening of measured as a function of the pseudorapidity difference of measured charged particles. As the matter expands, neighboring fluid cells drag one another. Fast fluid cells tend to slow down whereas slow fluid cells accelerate. This has the effect of dampening the expansion and produces a progressive broadening of the correlator with time. The longer the system lives, the longer viscous effects play a role, and the broader the correlator becomes. Gavin et al. showed the broadening, characterized in terms of the difference of the variance of the correlator observed in most central and most peripheral collisions, should be proportional to and given by the following formula herein called the Gavin ansatz
| (1) |
where is the longitudinal width of the correlator measured in most central collisions whereas is the longitudinal width of the correlator at formation time . and are respectively the critical temperature and the freeze-out time in most central collisions.
We first briefly review, in sec. 2, prior efforts to determine based on the longitudinal broadening of the correlator in A–A collisions. The method and results of this work are presented in sec. 3 and discussed in sec. 4. Our conclusions are presented in sec. 5.
2 Prior estimates of based on transverse momentum correlations
A first estimate of the QGP viscosity based on the Gavin ansatz was reported several years ago by the STAR collaboration using a measurement of the charge independent correlator in Au–Au collisions at . STAR observed the longitudinal width of the correlator grows considerably from most peripheral to most central Au – Au collisions. Given the observed broadening might arise in part from other dynamical effects, STAR used the Gavin ansatz to estimate an upper limit and reported to be in the range 0.06 - 0.21 Agakishiev:2011fs . More recently, the ALICE collaboration reported precise measurements of the evolution of the longitudinal and azimuthal widths of charge independent and charge dependent two-particle transverse momentum correlators, and , respectively, as a function of the centrality of Pb – Pb collisions at TeV Acharya:2019oxz . Examining specifically the overall change of the correlator longitudinal width from most peripheral to most central collisions, the collaboration concluded that their observations favour small values of , that is, values close to the KSS bound of Kovtun:2004de .
The estimates reported by the ALICE and STAR collaborations focused on the overall change of the longitudinal width from peripheral to central collisions but did not utilize correlator widths observed in mid-central collisions. This omission resulted in large part from the lack of precise estimates of the system’s life time in mid-central collisions. Effectively, STAR and ALICE did not consider the possibility that the viscosity might evolve with collision centrality and thus did not apply the Gavin ansatz to intermediate ranges of collision centralities. We note, however, that the viscosity might in fact become a function of the collision centrality if, in particular, the temperature or density of the produced system or other conditions affecting the viscosity evolve with centrality. It is also conceivable that other aspects of the collision dynamics, not related to viscous effects, could impact the broadening of the vs. centrality. It is thus of interest to consider what the evolution of the correlator observed by STAR and ALICE implies. Two specific questions arise. The first is concerned purely with the experimental technique used to estimate while the second concerns a possible evolution of the effective shear viscosity of the system with collision centrality.
Let us first consider the experimental technique on its own merits. Is the technique sound? Are there experimental artifacts that can bias or skew the evaluation of based on the Gavin ansatz? Indeed, the ansatz requires estimates of a critical temperature , as well as initial (formation) and freeze-out times and , respectively. These quantities are not evaluated in the context of the measurement and thus require external inputs. They may thus be subjected to systematic bias of their own and independent of the STAR and ALICE measurements of the correlator. Additionally, estimation of the broadening of the correlator might perhaps be biased by the finite acceptance or other artifacts of the measurement process. One might wonder, in particular, whether the width observed in most central collisions could be underestimated because of the finite rapidity width of the acceptance of the measurements. In this context, it becomes of interest to study what progressive changes of the width might imply about the strength of the specific shear viscosity, and whether, in particular, the evolution of the widths with centrality is self-consistent, that is, whether changes of the width from one fractional cross section to the next are consistent with the overall change from most peripheral to most central collisions.
The second set of concerns is of greater interest, from a physical standpoint, but perhaps more difficult to elucidate. Are viscous effects strictly proportional to the system lifetime? Can the correlator be affected by other physical effects, such as, possibly, the radial and anisotropic expansion of the collision system? Is the characteristic temperature used in the ansatz truly a constant independent of the collision centrality? And perhaps, most interestingly, could the effective shear viscosity extracted from the measurement be a function of collision centrality? Theoretical considerations suggest is likely a function of the QGP temperature Denicol:2015nhu ; Okamoto:2017rup ; Niemi:2011ix ; Niemi:2015qia ; Molnar:2014zha ; Haas_2014 ; Christiansen_2015 ; Bernhard:2019bmu . Is it then possible that collisions at different impact parameter yield systems at different temperatures with slightly different time evolution of the shear viscosity, thereby resulting in effective or time-averaged shear viscosity that might depend on the collision centrality? Conceivably, answers to these questions may require more and better data than those available, but it is nonetheless of interest to consider what the available data can say about a possible evolution of with collision centrality and system temperature. It is thus the primary objective of this work to explore how values obtained with the Gavin ansatz evolve with collision centrality.
3 Evolution of with system size
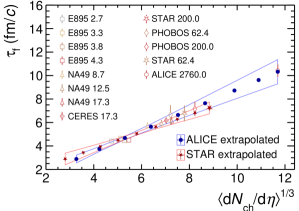
We proceed with the evaluation of as a function of the cubic root of the pseudorapidity density /d, based on the longitudinal widths already reported by the STAR and ALICE collaborations Agakishiev:2011fs ; Acharya:2019oxz in Au–Au collisions at , and in Pb–Pb at , respectively, as a function of the collision centrality using Eq. (1). However, we also need estimates of the lifetimes of the system with collision centrality. Estimates of freeze-out times reported as a function of measured charged particle densities, d/d, in Aamodt:2011mr , are used. Values of are obtained from two-pion Bose-Einstein measurements from AGS to LHC energies Aamodt:2011mr . Freeze-out times relevant for each of the centrality ranges considered in this work are obtained by fitting a first degree polynomial to estimated values according to
| (2) |
Freeze-out times and associated uncertainties are listed in Tab. 1 and plotted in Fig. 1. Statistical and systematic errors reported by the E895, CERES, NA49, PHOBOS, STAR and ALICE collaborations Aamodt:2011mr ; Adams:2004yc ; Adamova:2002wi ; Lisa:2000hw ; Alt:2007uj ; Afanasiev:2002mx ; Abelev:2009tp ; Back:2004ug ; Back:2005hs ; Back:2002wb ; Abelev:2008ab are used in the least square fit procedure. Note, however, that we could not obtain a fit with Eq. (2) that satisfactorily match all available data. We thus proceeded to use linear polynomial fits () and opted to give larger emphasis and weights to estimates obtained at 0.2 and 2.76 TeV given our goal is to determine based on data acquired at these two energies. Several distinct fits were carried out to obtain parameterizations of the dependence on the charged particle density used in our determination of . Fit conditions were varied: our primary fit included all data points but we also considered fits based on data in selected energy ranges, and with or without constraining the fits to pass through the origin. All fits considered yield chi-square per degrees of freedom of the order of . For the STAR energy, 0.2 TeV, the fit that better reproduces the published results does not pass through the origin and yields while for the ALICE energy, 2.76 TeV, the best fit yields a straight line that passes through the origin and a value . Fig. 1 shows the extrapolated decoupling times corresponding to the charged particle density used in the measurements of the correlator. Error bands show the systematic uncertainties introduced by the fit procedure. Additionally, we also carried out estimates of based on values obtained from pion interferometry and blast wave fits to particle spectra Adams:2004yc ; Adams:2003xp ; Adam:2015vna ; Abelev:2013vea and found that estimates obtained with these alternative values of were in agreement, within uncertainties, with the results obtained with values obtained with the fit procedure described above.
Computation of the Gavin ansatz is accomplished using the canonical values and for the critical temperature and formation time, respectively Becattini:2014rea . The value of is estimated by extrapolating the width of the correlator to . Values of (d/d for a given centrality class are taken from Aamodt:2010cz ; Abelev:2008ab . The STAR and ALICE collaborations estimated shear viscosities, using Eq. 1, based exclusively on most central and most peripheral collisions. In this letter, the collision centrality dependencies of the longitudinal widths reported by both experiments are used to investigate whether exhibits a dependence on (/d. The longitudinal broadening of the correlator, defined below, is expected to be insensitive to initial state density fluctuations in the transverse plane. As such, it powerfully complements studies of based on measurements of anisotropic flow that suffer in part from such a dependence Bernhard:2019bmu . Measurements of correlators additionally have a different sensitivity to non-flow effects which make them an invaluable tool in the understanding of the dynamics of A–A collisions, and as such, provide additional testing grounds of hydrodynamical and other types of theoretical models.
The ALICE measurements were reported in terms of a dimensionless variant of the correlator Gavin:2006xd ; Sharma:2008qr defined as
| (3) | ||||
with
| (4) |
where and are the number of charged particle tracks detected, in each event, within bins centered at and , respectively. Sums are carried over particle transverse momenta , , and , , respectively. The bracket notation is used to represent event ensemble averages computed within the bins , . Thus and represent average number of particles and average transverse momenta in bin , respectively. The reported ALICE measurement was limited to charged particles with transverse momenta in the range GeV/ and pseudorapidities within .
Within the context of the ALICE analysis, the correlator dependence on and was parametrized with a two-component model defined as
| (5) | ||||
where and describe the long-range mean correlation strength and azimuthal anisotropy, respectively, while the bidimensional generalized Gaussian, whose shape is determined by the parameters , , , and , is used to model the correlation signal of interest. The ALICE collaboration reported longitudinal widths computed as the standard deviation of the generalized Gaussian
| (6) |
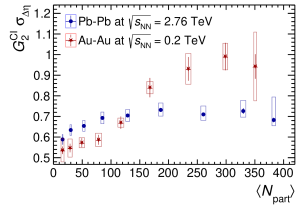
along Acharya:2019oxz . These values are plotted as a function of the number of collision participants estimated from Glauber models Abelev:2013qoq in Fig. 2.
Instead of using a fitting procedure, the STAR collaboration estimated the longitudinal width of measured correlators by computing the rms of one-dimensional projections of correlators onto the axis Agakishiev:2011fs . These rms width values are plotted vs. the number of collision participants in Fig. 2.
All parameters (d/d, widths and ) used in the computation of as well as the extracted values of at RHIC and LHC energies are listed in Tab. 1 as a function of collision centrality expressed in terms of the fractional cross section: the range 0–5% corresponds to most central collisions while ranges 5–10%, 10–20%, etc, represent collisions with increasingly larger impact parameters. Our analysis, based on STAR and ALICE is limited to quasi-peripheral collisions up to the range 70–80%, beyond which the applicability of Gavin’s model might be put into question. Estimates of computed with Eq. 1 based on the above widths and freeze-out times are listed, for both RHIC and LHC energies, in the two right-most columns of Tab. 1 . The values of vs are plotted in Fig. 3. Statistical and systematic uncertainties, the last ones incorporating the uncertainties from the fit procedure for freeze-out times extraction, are displayed with vertical bars and rectangular boxes, respectively.
| Centrality | (fm/) | |||
| LHC | ||||
| 0– 5% | 1601.00 60.00 | 0.68 0.01sta 0.11sys 0.03sys | ||
| 5–10% | 1294.00 49.00 | 0.73 0.01sta 0.05sys 0.03sys | ||
| 10–20% | 966.00 37.00 | 0.71 0.01sta 0.04sys 0.03sys | ||
| 20–30% | 649.00 23.00 | 0.73 0.01sta 0.03sys 0.03sys | ||
| 30–40% | 426.00 15.00 | 0.70 0.01sta 0.03sys 0.03sys | ||
| 40–50% | 261.00 9.00 | 0.69 0.01sta 0.03sys 0.03sys | ||
| 50–60% | 149.00 6.00 | 0.65 0.01sta 0.03sys 0.03sys | ||
| 60–70% | 76.00 4.00 | 0.63 0.01sta 0.03sys 0.03sys | ||
| 70–80% | 35.00 2.00 | 0.59 0.01sta 0.02sys 0.02sys | ||
| RHIC | ||||
| 0– 5% | 691.00 49.00 | 0.94 0.06sta 0.17sys | ||
| 5–10% | 558.00 40.00 | 0.99 0.07sta 0.06sys | ||
| 10–20% | 421.00 30.00 | 0.93 0.06sta 0.07sys | ||
| 20–30% | 287.00 20.00 | 0.84 0.05sta 0.03sys | ||
| 30–40% | 195.00 14.00 | 0.67 0.03sta 0.02sys | ||
| 40–50% | 126.00 9.00 | 0.59 0.02sta 0.03sys | ||
| 50–60% | 78.00 6.00 | 0.57 0.02sta 0.02sys | ||
| 60–70% | 45.00 3.00 | 0.55 0.02sta 0.04sys | ||
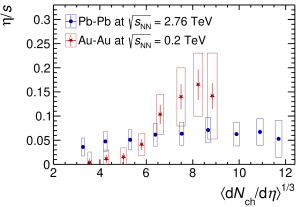
Computed values of range from to and from a value compatible with 0 to for LHC energies and RHIC energies, respectively. One observes that values extracted from Pb–Pb collisions at the LHC exhibit a weak dependence on , while those from Au–Au collisions, measured at RHIC, show a rising trend with increasing d/d, albeit with large uncertainties. Values of obtained from Pb–Pb collisions are close but somewhat lower than the KSS bound of 1/4 , while those obtained from Au–Au collisions are compatible with vanishing viscosities in the range d/d but exceed the KSS bound above d/d. However, values derived from STAR and ALICE data are compatible with one another at the one level at all values of d/d.
4 Discussion
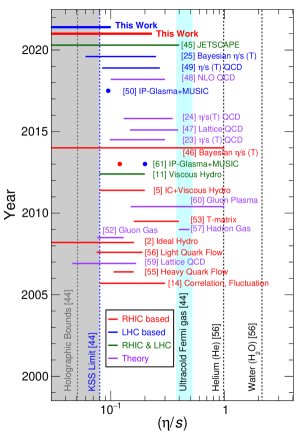
A compilation of values obtained in this work as well as those reported in theoretical and phenomenological calculations is presented in Fig. 4. Shear viscosity values for ultracold Fermi gas Adams:2012th , Helium Lacey:2006bc and water Lacey:2006bc , evaluated at their respective critical temperatures, as well as the holographic bounds Everett:2020xug and the KSS limit Kovtun:2004de , have also been incorporated as baselines and references.
The results reported in this work are displayed in Fig. 4 with two horizontal lines (one for the LHC and one for RHIC). The ranges of the horizontal lines span the smallest to highest values obtained at each energy, including systematic uncertainties. Somewhat older compilations have also been reported Shen:2015msa . A comparative analysis of the results presented in this compilation is complicated in part by the fact that viscous effects are likely to accumulate throughout a system’s evolution. However, the shear and bulk viscosities may depend on the temperature, matter density, the presence of magnetic fields, and possibly other system conditions, that evolve as the QGP expands and goes through a transition into a hadron phase. The model used in this work and several of the calculations listed in the compilation neglect such a time/temperature dependence and represent the viscosity as a single effective value, while others attempt to account for time and temperature dependencies using various prescriptions. The horizontal span of the lines displayed in Fig. 4 is thus meant to represent either the range of effective values constrained by comparisons with experimental data or the ranges of values considered in the models and yielding a good representation of the measured data. Although in both cases the reported uncertainties have been also incorporated into to the line length, the apparent relationship should not be considered as a statement of the precision achieved in the studies included in this compilation.
Comparative studies of hydrodynamics and measured data arguably culminated with studies based on a Bayesian estimation of the properties of the QGP Bernhard:2019bmu ; Adams:2012th ; Everett:2020xug ; Novak:2013bqa yielding most probable values in rather good agreement with the results of this work. Estimates of obtained in this work are also in quantitative agreement with QCD inspired calculations including, for instance, estimates based on nonperturbative gluon spectral functions at finite temperature in quenched QCD with the maximum entropy method Haas_2014 and calculations based on the Kubo formula in Yang-Mills theory Christiansen_2015 . Results of this work are also in qualitative agreement with estimates based on lattice QCD (LQCD) calculations of the QGP transport coefficients Mages:2015rea and perturbative QCD calculations at almost NLO Ghiglieri:2018dib , as well as recent calculation based on the MUSIC framework that used a temperature dependent computed with a QCD based approach Dubla:2018czx . In all cases in which the temperature evolution of have been estimated the range reported in Fig. 4 goes up to which in most of the cases matches the published range. It is interesting to address the results reported in this work from an additional perspective. Although as was mentioned before the Gavin ansatz does not consider any temperature dependence for the temperature reached by the medium produced in A–A collisions, presumably, will not be the same for the different centrality ranges. The values of quoted in this work for each centrality range at both energies (i.e., RHIC and the LHC) thus correspond to an effective viscosity which condensates the whole system evolution for that centrality range. If as suggested above, the produced system reach different temperatures in each centrality range, there could be an implicit link between the results presented in this work and the evolution of with system temperature.
Taking the estimates of shown in Fig. 3 at face value, it is interesting to consider whether they might have any implications concerning the nature and properties of hot QCD matter produced in heavy-ion collisions at RHIC and LHC. First consider that estimates of the initial temperature reached in central Pb–Pb collisions at LHC suggest it is of the order of 300 MeV, i.e., 30% larger compared to that achieved at RHIC in central Au–Au collisions Busza:2018rrf ; Karsch:2001cy ; Muller:2012zq ; Martinez:2013xka . Also consider that the fireball formed in Pb–Pb collisions at the LHC have been estimated to live approximately 40% longer that those produced in Au–Au collisions at RHIC Aamodt:2011mr . This implies that shear viscous forces have more time to operate in central Pb–Pb collisions at LHC than in Au–Au at RHIC. For systems of equal and temperature, one would expect to observe a larger longitudinal broadening of the correlator in Pb–Pb but the observed broadening is in fact smaller than that seen in central Au–Au collisions. Taken at face value, this suggests that the effective shear viscosity per unit of entropy is smaller in Pb–Pb at 2.76 TeV. We should stress, however, that the extracted values of reflect the complete evolution of systems formed in A–A collisions. It is consequently incorrect to associate and use a particular system temperature to evaluate the shear viscosity. Indeed, estimates should account for possible evolution of with temperature explicitly or be based on an appropriate effective, time averaged, system temperature. The interpretation of the data is further complicated by the likely presence of kinematic narrowing associated to radial flow. The average transverse momentum, , is found to be approximately 10% larger at LHC energies compared to RHIC. This increase may in part result from faster radial flow at the TeV energy scale. It is well established that strong radial flow produces a sizable narrowing of two particle correlators, such as balance functions Adams:2003kg ; Aggarwal:2010ya ; Abelev:2013csa ; Adam:2015gda , as well as generic number and transverse momentum correlators and Acharya:2018ddg , respectively. A similar narrowing is thus expected also for and has in fact been found to occur in Pb–Pb collisions: the correlator, in particular, exhibits a significant narrowing from peripheral to central Pb–Pb collisions reported by the ALICE collaboration Acharya:2019oxz . While this narrowing is most easily and explicitly observed for unlike-charge particle pairs, it should also be occurring for like-sign pairs contributing to the correlator. Narrowing effects associated with kinematic focusing might then partially counterbalance the broadening due to viscous forces, and thus effectively reduce values of extracted from both the ALICE and STAR data. But given the radial flow is likely somewhat stronger at LHC, that could imply the difference seen between central Au–Au and Pb–Pb collisions is in part due to the presence of extra focusing at LHC energy.
Additional theoretical calculations Karpenko:2015xea suggest that should increase with decreasing collision energy within the RHIC energy domain in part as a result of an explicit dependence on the matter baryochemical potential Auvinen:2017fjw . Studies of relative yields of produced hadrons indicate that the baryochemical potential is nearly vanishing at central rapidities in Pb–Pb collisions, with values of order 0.7 reported by global thermal fits Andronic:2016nof ; Andronic:2017pug , while significantly larger values, 20, were extracted based on Au–Au collisions at RHIC top energy Andronic:2005yp . Differences of observed by STAR and ALICE collaborations might thus also result in part from this change of the baryochemical potential. While we note that the precision of the data is clearly insufficient to establish any firm conclusion on such a dependence, we stress that precise measurements of the correlator in the context of the second RHIC beam energy scan (BES-II) might in fact provide better grounds to seek evidence of this dependence. Studies of the correlator with RHIC beam energy scan data are thus indeed of high interest.
Other considerations are also of interest. Collisions of large nuclei at ultra-high energy, both at RHIC and LHC, are expected to produce very large magnetic fields and have been predicted to induce large vorticity and global polarization effects as well as finite out of plane charge separation associated with the chiral magnetic effect (CME). While the existence of the CME remains to be established, both STAR and ALICE collaborations have reported observations of global polarization of -baryons Acharya:2019ryw ; STAR:2017ckg ; Adam:2018ivw believed to result from the presence of large vorticity in Au–Au and Pb–Pb collisions. It has been suggested that the presence of large magnetic fields might also have an impact on viscous effects MCINNES2018455 as they might strongly suppress momentum diffusion in the reaction plane or impart a “paramagnetic squeezing” effect capable of altering pressure gradients. Variations of the magnetic field strength and its time evolution as function of centrality and collision energy, may also influence the effective diffusivity and the viscosity of the QCD matter produced in these collisions. The magnitude of the effect is as of yet unknown but nonetheless worthy of additional investigations given the current uncertainties in values do not allow to conclude about a possible difference at the two energies.
Additionally, in order to make progress on a full characterization of as a function of temperature, collision energy, baryochemical potential, etc., additional and more precise measurements of at different collision energies are necessary; for example, as already mentioned, from the BES-II at RHIC. Furthermore, supporting theoretical studies in the framework of relativistic hydrodynamics will also be greatly beneficial. One needs, in particular, to establish the influence of the temperature and viscosity of the different stages of the collision (QGP, phase transition region, hadronic phase) on the longitudinal broadening of . The role of resonance decays and charge conservation must also be clarified in association with quantitative studies of the radial flow velocities imparted to the matter produced in A–A collisions. Ideally, these studies should be conducted for several system sizes and collision energies. In light of observations of -baryon global polarization already mentioned, it shall also be of interest to examine whether the strong magnetic fields present at the onset of A–A collisions can persist long enough to have a quantitatively measurable impact on the shear viscosity in general, and on the longitudinal broadening of transverse momentum correlators in particular.
5 Conclusion
We presented an evaluation of the collision centrality dependence of the shear viscosity per unit of entropy, of the Quark Gluon Plasma produced in A–A collisions at RHIC and LHC based on measurements of the correlator by the STAR and ALICE collaborations using the Gavin ansatz embodied in Eq. 1. Freeze-out times required to carry out the calculations were determined as a function of the cubic root of the charged particle multiplicity (or collision centrality) from two-pion Bose-Einstein measurements. Values of obtained in Pb–Pb collisions, based on ALICE data, indicate the shear viscosity per unit of entropy is of the order of the KSS bound and essentially independent of collision centrality at LHC energy. By contrast, the STAR data are consistent with vanishing values in peripheral collisions and values exceeding the KSS bound in more central collisions. However, given the large systematic uncertainties of these data, one cannot exclude might be invariant with collision centrality. Likewise, one cannot readily exclude that values of might also be invariant with beam energy.
The precision of our estimates of the dependence of , particularly at RHIC, are limited by the accuracy of the STAR measurement of . Uncertainties are also largely determined by the various caveats associated with the Gavin ansatz discussed above, most particularly the choice of characteristic temperature used in the calculation. Clearly, a more detailed calculation along the lines of Ref. Gavin:2016jfw are needed to improve on this work.
Finally, we stress that although measurements of are challenging, owing in particular to their sensitivity to dependent efficiency corrections, they are nonetheless possible as demonstrated by the recent ALICE measurement. Precise studies of the evolution of the correlator with collision centrality thus stand to become a discriminating gauge of not only the average magnitude of the shear viscosity per unit of entropy, , but its temperature dependence also. As such, they might provide new and valuable inputs to multi-system Bayesian constraints methods. Ideally, this will require measurements of be completed based, for instance, on the beam energy scan at RHIC as well as for smaller collision systems at the LHC and RHIC.
Acknowledgements
SB acknowledge the support of the Swedish Research Council (VR). This work was also supported in part by the United States Department of Energy, Office of Nuclear Physics (DOE NP), United States of America, under grant No. DE-FG02-92ER40713.
References
- (1) E. Shuryak, Prog. Part. Nucl. Phys. 53, 273 (2004). DOI 10.1016/j.ppnp.2004.02.025
- (2) P. Romatschke, U. Romatschke, Phys. Rev. Lett. 99, 172301 (2007). DOI 10.1103/PhysRevLett.99.172301
- (3) M. Luzum, P. Romatschke, Phys. Rev. C78, 034915 (2008). DOI 10.1103/PhysRevC.78.034915,10.1103/PhysRevC.79.039903. [Erratum: Phys. Rev.C79,039903(2009)]
- (4) P. Bozek, Phys. Rev. C 81, 034909 (2010). DOI 10.1103/PhysRevC.81.034909
- (5) H. Song, S.A. Bass, U. Heinz, T. Hirano, C. Shen, Phys. Rev. Lett. 106, 192301 (2011). DOI 10.1103/PhysRevLett.106.192301,10.1103/PhysRevLett.109.139904. [Erratum: Phys. Rev. Lett. 109, 139904 (2012)]
- (6) C. Shen, U. Heinz, P. Huovinen, H. Song, Phys. Rev. C 84, 044903 (2011). DOI 10.1103/PhysRevC.84.044903
- (7) N. Brookhaven National Laboratory. Rhic scientists serve up ‘perfect’ liquid. https://www.bnl.gov/newsroom/news.php?a=110303 (2005). [Online; accessed 03-December-2020]
- (8) C. Gale, S. Jeon, B. Schenke, Int. J. Mod. Phys. A 28, 1340011 (2013). DOI 10.1142/S0217751X13400113
- (9) U. Heinz, R. Snellings, Ann. Rev. Nucl. Part. Sci. 63, 123 (2013). DOI 10.1146/annurev-nucl-102212-170540
- (10) Z. Qiu, C. Shen, U. Heinz, Phys. Lett. B 707, 151 (2012). DOI 10.1016/j.physletb.2011.12.041
- (11) H. Song, Eur. Phys. J. A 48, 163 (2012). DOI 10.1140/epja/i2012-12163-9
- (12) J. Adam, et al., Phys. Rev. Lett. 117, 182301 (2016). DOI 10.1103/PhysRevLett.117.182301
- (13) H. Niemi, K.J. Eskola, R. Paatelainen, Phys. Rev. C93(2), 024907 (2016). DOI 10.1103/PhysRevC.93.024907
- (14) S. Gavin, M. Abdel-Aziz, Phys. Rev. Lett. 97, 162302 (2006). DOI 10.1103/PhysRevLett.97.162302
- (15) M. Sharma, C.A. Pruneau, Phys. Rev. C79, 024905 (2009). DOI 10.1103/PhysRevC.79.024905
- (16) G. Agakishiev, et al., Phys. Lett. B704, 467 (2011). DOI 10.1016/j.physletb.2011.09.075
- (17) S. Acharya, et al., Phys. Lett. B 804, 135375 (2020). DOI 10.1016/j.physletb.2020.135375
- (18) P. Kovtun, D.T. Son, A.O. Starinets, Phys. Rev. Lett. 94, 111601 (2005). DOI 10.1103/PhysRevLett.94.111601
- (19) G. Denicol, A. Monnai, B. Schenke, Phys. Rev. Lett. 116(21), 212301 (2016). DOI 10.1103/PhysRevLett.116.212301
- (20) K. Okamoto, C. Nonaka, Phys. Rev. C 98(5), 054906 (2018). DOI 10.1103/PhysRevC.98.054906
- (21) H. Niemi, G.S. Denicol, P. Huovinen, E. Molnar, D.H. Rischke, Phys. Rev. Lett. 106, 212302 (2011). DOI 10.1103/PhysRevLett.106.212302
- (22) E. Molnar, H. Holopainen, P. Huovinen, H. Niemi, Phys. Rev. C 90(4), 044904 (2014). DOI 10.1103/PhysRevC.90.044904
- (23) M. Haas, L. Fister, J.M. Pawlowski, Physical Review D 90(9) (2014). DOI 10.1103/physrevd.90.091501. URL http://dx.doi.org/10.1103/PhysRevD.90.091501
- (24) N. Christiansen, M. Haas, J.M. Pawlowski, N. Strodthoff, Physical Review Letters 115(11) (2015). DOI 10.1103/physrevlett.115.112002. URL http://dx.doi.org/10.1103/PhysRevLett.115.112002
- (25) J.E. Bernhard, J.S. Moreland, S.A. Bass, Nature Phys. 15(11), 1113 (2019). DOI 10.1038/s41567-019-0611-8
- (26) K. Aamodt, et al., Phys. Lett. B696, 328 (2011). DOI 10.1016/j.physletb.2010.12.053
- (27) J. Adams, et al., Phys. Rev. C 71, 044906 (2005). DOI 10.1103/PhysRevC.71.044906
- (28) D. Adamová, et al., Nucl. Phys. A 714, 124 (2003). DOI 10.1016/S0375-9474(02)01369-6
- (29) M. Lisa, et al., Phys. Rev. Lett. 84, 2798 (2000). DOI 10.1103/PhysRevLett.84.2798
- (30) C. Alt, et al., Phys. Rev. C 77, 064908 (2008). DOI 10.1103/PhysRevC.77.064908
- (31) S. Afanasiev, et al., Phys. Rev. C 66, 054902 (2002). DOI 10.1103/PhysRevC.66.054902
- (32) B. Abelev, et al., Phys. Rev. C 80, 024905 (2009). DOI 10.1103/PhysRevC.80.024905
- (33) B. Back, et al., Phys. Rev. C 73, 031901 (2006). DOI 10.1103/PhysRevC.73.031901
- (34) B. Back, et al., Phys. Rev. C 74, 021901 (2006). DOI 10.1103/PhysRevC.74.021901
- (35) B. Back, et al., Phys. Rev. Lett. 91, 052303 (2003). DOI 10.1103/PhysRevLett.91.052303
- (36) B.I. Abelev, et al., Phys. Rev. C79, 034909 (2009). DOI 10.1103/PhysRevC.79.034909
- (37) J. Adams, et al., Phys. Rev. Lett. 92, 112301 (2004). DOI 10.1103/PhysRevLett.92.112301
- (38) J. Adam, et al., Phys. Rev. C 93(2), 024905 (2016). DOI 10.1103/PhysRevC.93.024905
- (39) B. Abelev, et al., Phys. Rev. C88, 044910 (2013). DOI 10.1103/PhysRevC.88.044910
- (40) F. Becattini, J. Phys. Conf. Ser. 527, 012012 (2014). DOI 10.1088/1742-6596/527/1/012012
- (41) K. Aamodt, et al., Phys. Rev. Lett. 106, 032301 (2011). DOI 10.1103/PhysRevLett.106.032301
- (42) B. Abelev, et al., Phys. Rev. C88(4), 044909 (2013). DOI 10.1103/PhysRevC.88.044909
- (43) E. Abbas, et al., Phys. Lett. B 726, 610 (2013). DOI 10.1016/j.physletb.2013.09.022
- (44) A. Adams, L.D. Carr, T. Schäfer, P. Steinberg, J.E. Thomas, New J. Phys. 14, 115009 (2012). DOI 10.1088/1367-2630/14/11/115009
- (45) D. Everett, et al., Phys. Rev. C 103(5), 054904 (2021). DOI 10.1103/PhysRevC.103.054904
- (46) J. Novak, K. Novak, S. Pratt, J. Vredevoogd, C. Coleman-Smith, R. Wolpert, Phys. Rev. C 89(3), 034917 (2014). DOI 10.1103/PhysRevC.89.034917
- (47) S.W. Mages, S. Borsányi, Z. Fodor, A. Schäfer, K. Szabó, PoS LATTICE2014, 232 (2015). DOI 10.22323/1.214.0232
- (48) J. Ghiglieri, G.D. Moore, D. Teaney, JHEP 03, 179 (2018). DOI 10.1007/JHEP03(2018)179
- (49) A. Dubla, S. Masciocchi, J. Pawlowski, B. Schenke, C. Shen, J. Stachel, Nucl. Phys. A 979, 251 (2018). DOI 10.1016/j.nuclphysa.2018.09.046
- (50) S. McDonald, C. Shen, F. Fillion-Gourdeau, S. Jeon, C. Gale, Phys. Rev. C 95(6), 064913 (2017). DOI 10.1103/PhysRevC.95.064913
- (51) J. Dias de Deus, A. Hirsch, C. Pajares, R. Scharenberg, B. Srivastava, Eur. Phys. J. C 72, 2123 (2012). DOI 10.1140/epjc/s10052-012-2123-x
- (52) Z. Xu, C. Greiner, Phys. Rev. Lett. 100, 172301 (2008). DOI 10.1103/PhysRevLett.100.172301
- (53) H. van Hees, M. Mannarelli, V. Greco, R. Rapp, Eur. Phys. J. C 61, 799 (2009). DOI 10.1140/epjc/s10052-008-0838-5
- (54) X. Dong, Y.J. Lee, R. Rapp, Ann. Rev. Nucl. Part. Sci. 69, 417 (2019). DOI 10.1146/annurev-nucl-101918-023806
- (55) A. Adare, et al., Phys. Rev. Lett. 98, 172301 (2007). DOI 10.1103/PhysRevLett.98.172301
- (56) R.A. Lacey, N. Ajitanand, J. Alexander, P. Chung, W. Holzmann, M. Issah, A. Taranenko, P. Danielewicz, H. Stoecker, Phys. Rev. Lett. 98, 092301 (2007). DOI 10.1103/PhysRevLett.98.092301
- (57) N. Demir, S.A. Bass, Phys. Rev. Lett. 102, 172302 (2009). DOI 10.1103/PhysRevLett.102.172302
- (58) P.B. Arnold, G.D. Moore, L.G. Yaffe, JHEP 05, 051 (2003). DOI 10.1088/1126-6708/2003/05/051
- (59) H.B. Meyer, Phys. Rev. D 76, 101701 (2007). DOI 10.1103/PhysRevD.76.101701
- (60) J.W. Chen, H. Dong, K. Ohnishi, Q. Wang, Phys. Lett. B 685, 277 (2010). DOI 10.1016/j.physletb.2010.01.072
- (61) C. Gale, S. Jeon, B. Schenke, P. Tribedy, R. Venugopalan, Phys. Rev. Lett. 110(1), 012302 (2013). DOI 10.1103/PhysRevLett.110.012302
- (62) C. Shen, U. Heinz, Nucl. Phys. News 25(2), 6 (2015). DOI 10.1080/10619127.2015.1006502
- (63) W. Busza, K. Rajagopal, W. van der Schee, Ann. Rev. Nucl. Part. Sci. 68, 339 (2018). DOI 10.1146/annurev-nucl-101917-020852
- (64) F. Karsch, Lect. Notes Phys. 583, 209 (2002). DOI 10.1007/3-540-45792-5\_6
- (65) B. Muller, J. Schukraft, B. Wyslouch, Ann. Rev. Nucl. Part. Sci. 62, 361 (2012). DOI 10.1146/annurev-nucl-102711-094910
- (66) G. Martinez, in Proceedings of the 2011 Joliot Curie School (2013). URL {https://arxiv.org/abs/1304.1452}
- (67) J. Adams, et al., Phys. Rev. Lett. 90, 172301 (2003). DOI 10.1103/PhysRevLett.90.172301
- (68) M.M. Aggarwal, et al., Phys. Rev. C 82, 024905 (2010). DOI 10.1103/PhysRevC.82.024905
- (69) B. Abelev, et al., Phys. Lett. B723, 267 (2013). DOI 10.1016/j.physletb.2013.05.039
- (70) J. Adam, et al., Eur. Phys. J. C76(2), 86 (2016). DOI 10.1140/epjc/s10052-016-3915-1
- (71) S. Acharya, et al., Phys. Rev. C 100, 044903 (2019). DOI 10.1103/PhysRevC.100.044903
- (72) I. Karpenko, P. Huovinen, H. Petersen, M. Bleicher, Phys. Rev. C 91(6), 064901 (2015). DOI 10.1103/PhysRevC.91.064901
- (73) J. Auvinen, J.E. Bernhard, S.A. Bass, I. Karpenko, Phys. Rev. C 97(4), 044905 (2018). DOI 10.1103/PhysRevC.97.044905
- (74) A. Andronic, P. Braun-Munzinger, K. Redlich, J. Stachel, J. Phys. Conf. Ser. 779(1), 012012 (2017). DOI 10.1088/1742-6596/779/1/012012
- (75) A. Andronic, P. Braun-Munzinger, K. Redlich, J. Stachel, Nature 561(7723), 321 (2018). DOI 10.1038/s41586-018-0491-6
- (76) A. Andronic, P. Braun-Munzinger, J. Stachel, Nucl. Phys. A 772, 167 (2006). DOI 10.1016/j.nuclphysa.2006.03.012
- (77) S. Acharya, et al., Phys. Rev. C 101(4), 044611 (2020). DOI 10.1103/PhysRevC.101.044611
- (78) L. Adamczyk, et al., Nature 548, 62 (2017). DOI 10.1038/nature23004
- (79) J. Adam, et al., Phys. Rev. C 98, 014910 (2018). DOI 10.1103/PhysRevC.98.014910
- (80) B. McInnes, Nuclear Physics B 927, 455 (2018). DOI https://doi.org/10.1016/j.nuclphysb.2018.01.005. URL http://www.sciencedirect.com/science/article/pii/S0550321318300051
- (81) S. Gavin, G. Moschelli, C. Zin, J. Phys. Conf. Ser. 736(1), 012020 (2016). DOI 10.1088/1742-6596/736/1/012020