Updated Measurements of Proton, Electron, and Oxygen Temperatures in the Fast Solar Wind
Abstract
The high-speed solar wind is typically the simplest and least stochastic type of large-scale plasma flow in the heliosphere. For much of the solar cycle, it is connected magnetically to large polar coronal holes on the Sun’s surface. Because these features are relatively well-known (and less complex than the multiple source-regions of the slow wind), the fast wind is often a useful testing-ground for theoretical models of coronal heating. In order to provide global empirical constraints to these models, here we collect together some older and more recent measurements of the temperatures of protons, electrons, and oxygen ions as a function of radial distance.
1
The plasma in coronal holes and the fast solar wind is not in thermal equilibrium. The relatively low density results in a low frequency of particle-particle collisions, and this allows the electrons and individual ion species to all exhibit potentially different kinetic properties (see Marsch, 2006; Verscharen et al., 2019). For example, both in situ and remote-sensing measurements have found preferential heating of ions relative to electrons, systematic differences in bulk flow speeds, and a range of velocity-distribution anisotropies—i.e., unequal temperatures measured in the directions parallel and perpendicular to the background magnetic field. This research note presents a summary of the radial dependences of measured temperatures and field-aligned anisotropies in high-speed wind regions. Figure 1 of this note is an update of Figure 6 of Cranmer (2009) and Figure 5(b) of Cranmer et al. (2017) with some new and reanalyzed data. Specifically, Figure 1(a) shows isotropic temperatures , defined as , and Figure 1(b) shows anisotropy ratios .
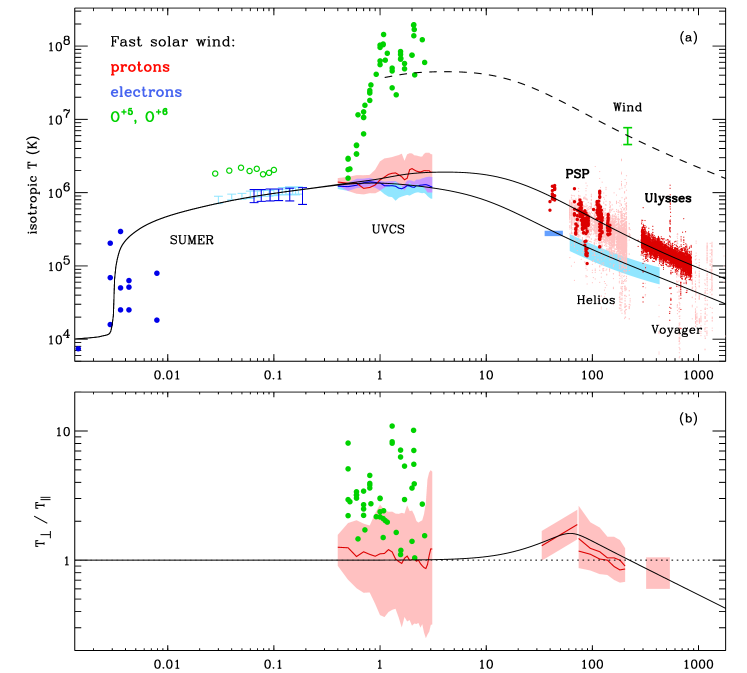
Data from the Solar Ultraviolet Measurements of Emitted Radiation (SUMER) instrument on the Solar and Heliospheric Observatory (SOHO) show trends for the electron temperature near the solar surface. It is likely that the height of the sharp transition region fluctuates rapidly in both time and as a function of position. O VI 103.2, 103.7 nm line widths from Landi & Cranmer (2009) show hints of preferential ion heating at low heights. At larger distances, data from the Ultraviolet Coronagraph Spectrometer (UVCS) on SOHO begin to show even stronger departures from thermal equilibrium (i.e., ). These data were obtained over the north and south polar coronal holes during the 1996–1997 solar minimum. Cranmer (2020) reanalyzed H I Ly profiles with a model that included mass and momentum conservation, which enabled the thermal motions of protons and electrons to be separated from one another and from “nonthermal” transverse-wave motions. The light-colored regions shown in Figure 1(a) are bounds on the median values shown with dark-color curves. Cranmer et al. (2008) analyzed UVCS O VI profiles, but they did not separate thermal from nonthermal wave motions. That was done here using Equation (24) of Cranmer (2020), and for simplicity the error-bars from Cranmer et al. (2008) are omitted.
In situ data from Parker Solar Probe (PSP), Helios, and Voyager were obtained from NASA’s Space Physics Data Facility (SPDF), and data from Wind and Ulysses were extracted from previously published sources (e.g., Collier et al., 1996; Cranmer et al., 2009). For most missions, we plot temperature data only for solar-wind speeds km s-1. However, since PSP has not flown through very much high-speed wind, the criterion was reduced to 500 km s-1 for and 450 km s-1 for (Huang et al., 2020). One-hour-average data from the PSP Solar Probe Cup (Kasper et al., 2016) was obtained for the first five perihelia (i.e., times between 2018 October and 2020 August). Out of 3,742 one-hour intervals with good and data, the fast streams (with km s-1) comprised only 242 intervals (about 6.5% of the total). Reported radial temperatures are interpreted as , and we derive the isotropic using the anisotropy fit shown in Figure 1(b).
The black curves in Figure 1 are meant only to guide the eye, but they are illustrative of coarse trends. They were originally based on the one-fluid semi-empirical model used by Cranmer & van Ballegooijen (2012). With the modifications made here, peaks at 1.35 MK, at a heliocentric distance of , and decreases monotonically outwards. The curve keeps increasing until a peak value of 1.91 MK at . At larger distances, the ratios and approach values of about 2.5 and 23.5, respectively. The latter value indicates more than mass-proportional heating for the oxygen ions, which was noted by Collier et al. (1996) for the fast wind. At distances AU, the fits give and . If one assumes a polytropic index , such that in a spherically expanding wind, then this fit implies for protons and 1.31 for electrons. In Figure 1(b), one can see that at the largest heights, . After solving for and assuming a radial magnetic field (), the magnetic moment is roughly proportional to , indicating ongoing perpendicular heating in interplanetary space (see also Marsch, 2006).
There is much additional work that could be done to supplement these plots. PSP will be getting closer to the Sun in the coming years. Also, kinetic properties of helium (i.e., alpha particles) have been observed extensively in situ (Marsch et al., 1982b; Reisenfeld et al., 2001), and there exists the possibility of extracting these properties from remote-sensing data as well (e.g., Moses et al., 2020). Next-generation UVCS-type instruments may be able to measure the kinetic properties of dozens of different ions and to detect subtle departures from Gaussian line shapes that point to specific non-Maxwellian velocity distributions.
References
- Collier et al. (1996) Collier, M. R., Hamilton, D. C., Gloeckler, G., et al. 1996, GRL, 23, 1191
- Cranmer (2009) Cranmer, S. R. 2009, Living Rev. Solar Phys., 6, 3
- Cranmer (2020) Cranmer, S. R. 2020, ApJ, 900, 105
- Cranmer et al. (2017) Cranmer, S. R., Gibson, S. E., & Riley, P. 2017, Space Sci. Rev., 212, 1345
- Cranmer et al. (2009) Cranmer, S. R., Matthaeus, W. H., Breech, B. A., & Kasper, J. C. 2009, ApJ, 702, 1604
- Cranmer et al. (2008) Cranmer, S. R., Panasyuk, A. V., & Kohl, J. L. 2008, ApJ, 678, 1480
- Cranmer & van Ballegooijen (2012) Cranmer, S. R., & van Ballegooijen, A. A. 2012, ApJ, 754, 92
- Halekas et al. (2020) Halekas, J. S., Whittlesey, P., Larson, D. E., et al. 2020, ApJS, 246, 22
- Huang et al. (2020) Huang, J., Kasper, J. C., Vech, D., et al. 2020, ApJS, 246, 70
- Kasper et al. (2016) Kasper, J. C., Abiad, R., Austin, G., et al. 2016, Space Sci. Rev., 204, 131
- Kohl et al. (1995) Kohl, J. L., Esser, R., Gardner, L. D., et al. 1995, Sol. Phys., 162, 313
- Landi (2008) Landi, E. 2008, ApJ, 685, 1270
- Landi & Cranmer (2009) Landi, E., & Cranmer, S. R. 2009, ApJ, 691, 794
- Marsch et al. (1982a) Marsch, E., Mühlhäuser, K.-H, Schwenn, R., et al. 1982a, JGR, 87, 52
- Marsch et al. (1982b) Marsch, E., Rosenbauer, H., Schwenn, R., et al. 1982b, JGR, 87, 35
- Marsch (2006) Marsch, E. 2006, Living Rev. Solar Phys., 3, 1
- Marsch et al. (2006) Marsch, E., Zhou, G.-Q., He, J.-S., & Tu, C.-Y. 2006, A&A, 457, 699
- Matteini et al. (2007) Matteini, L., Landi, S., Hellinger, P., et al. 2007, GRL, 34, L20105
- Moses et al. (2020) Moses, J. D., Antonucci, E., Newmark, J., et al. 2020, Nature Astron., 4, 1134
- Reisenfeld et al. (2001) Reisenfeld, D. B., Gary, S. P., Gosling, J. T., et al. 2001, JGR, 106, 5693
- Verscharen et al. (2019) Verscharen, D., Klein, K. G., & Maruca, B. A. 2019, Living Rev. Solar Phys., 16, 5
- Wilhelm (2006) Wilhelm, K. 2006, A&A, 455, 697