Effect of pressure on the pseudogap and charge-density-wave phases of the cuprate Nd-LSCO probed by thermopower measurements
Abstract
We report thermopower measurements under hydrostatic pressure on the cuprate superconductor La1.6-xNd0.4SrxCuO4 (Nd-LSCO), at low-temperature in the normal state accessed by suppressing superconductivity with a magnetic field up to T. Using a newly developed AC thermopower measurement technique suitable for high pressure and high field, we track the pressure evolution of the Seebeck coefficient . At ambient pressure and low temperature, was recently found to suddenly increase in Nd-LSCO at the pseudogap critical doping , consistent with a drop in carrier density from above to below. Under a pressure of 2.0 GPa, we observe that this jump in is suppressed. This confirms a previous pressure study based on electrical resistivity and Hall effect which found holes/GPa, thereby reinforcing the interpretation that this effect is driven by the pressure-induced shift of the van Hove point. It implies that the pseudogap only exists when the Fermi surface is hole-like, which puts strong constraints on theories of the pseudogap phase. We also report thermopower measurements on Nd-LSCO and La1.8-xEu0.2SrxCuO4 in the charge density-wave phase near , which reveals a weakening of this phase under pressure.
I Introduction
The pseudogap phase of cuprates is arguably one of their chief mysteries. Understanding the pseudogap phase of cuprates has been hindered in part by the fact that it does not exhibit a clear and well-defined symmetry-breaking phase transition at its characteristic temperature . However, upon crossing the pseudogap end point at doping - where vanishes - at low temperatures, recent measurements have revealed a clear and abrupt change in carrier density , going from above to below. These are based on high-field and low-temperature measurements of the Hall effect on YBa2Cu3Oy (YBCO) Badoux et al. (2016a) and La1.6-xNd0.4SrxCuO4 (Nd-LSCO) Collignon et al. (2017), resistivity on La2-xSrxCuO4 (LSCO) Laliberté et al. (2016) and Nd-LSCO Collignon et al. (2017), and thermal conductivity on Nd-LSCO Michon et al. (2018) and LSCO Bourgeois-Hope et al. (2019). Recently, the single-layer cuprates Bi2Sr2-xLaxCuO6+δ (Bi2201) Lizaire et al. (2020); Putzke et al. (2020) and Tl2Ba2CuO6+δ (Tl2201) Putzke et al. (2020) were also shown to display such a drop in carrier density at via Hall effect measurements, lending a sense of universality to these transport signatures of the pseudogap. Thermodynamic measurements have recently revealed a logarithmic divergence of the electronic specific heat at Michon et al. (2019), both as a function of doping and temperature, a classic signature of a quantum phase transition. Above , the resistivity of Nd-LSCO Daou et al. (2009a) and LSCO Cooper et al. (2009) exhibits a purely linear temperature dependence at low , another signature of quantum criticality, with a slope that reaches the Planckian limit Legros et al. (2019).
In the LSCO-based family of cuprates, an intriguing question is why do LSCO and Nd-LSCO have such a different , namely for LSCO Cooper et al. (2009); Laliberté et al. (2016), and for Nd-LSCO Collignon et al. (2017). This issue was examined via electrical resistivity and Hall effect measurements under hydrostatic pressure on Nd-LSCO Doiron-Leyraud et al. (2017), which found, using the drop in carrier density as a clear marker of , that moves down with pressure at a rate of hole/Cu atom per GPa. This effect was shown to be driven by the pressure displacement of the van Hove point Doiron-Leyraud et al. (2017), where the Fermi surface changes from hole-like to electron-like, demonstrating that the pseudogap phase can only exist on a hole-like Fermi surface. In other words, the doping at which this Fermi surface change occurs, , constrains the pseudogap phase, such that . In Nd-LSCO, Matt et al. (2015) and Collignon et al. (2017); in LSCO, Yoshida et al. (2009); Chang et al. (2008) and Cooper et al. (2009); Laliberté et al. (2016); in Bi2201, Kondo et al. (2004) and Lizaire et al. (2020). This explains why is different in these cuprates. The fact that places a strong constraint on candidate theories of the pseudogap phase, and it was found to be consistent with numerical solutions of the Hubbard model Wu et al. (2018).
Recently, the thermopower was used as a probe of the carrier density across in Nd-LSCO Collignon et al. (2020). Unlike the Hall coefficient, does not depend sensitively on the curvature or shape of the Fermi surface. Unlike the conductivity (electrical or thermal), it does not depend sensitively on the level of impurity scattering. Within a simple model, in the limit and for a single band, the Seebeck coefficient of thermopower depends on two parameters only, the effective mass and the carrier density Behnia et al. (2004); Miyake and Kohno (2005):
| (1) |
Fundamentally, is the specific heat per carrier. While seemingly over-simplistic, this expression was shown Behnia et al. (2004) to hold even in the presence of multiple bands and strong electronic correlations, as evidenced for a great variety of materials that includes common metals, oxides, heavy fermions, cuprates, and organic superconductors. In YBCO at for instance, there is excellent quantitative agreement between the normal-state measured in the limit Laliberté et al. (2011); Doiron-Leyraud et al. (2015) and the estimate from Eq. 1 using the carrier density and the effective mass obtained from quantum oscillations Doiron-Leyraud et al. (2007).
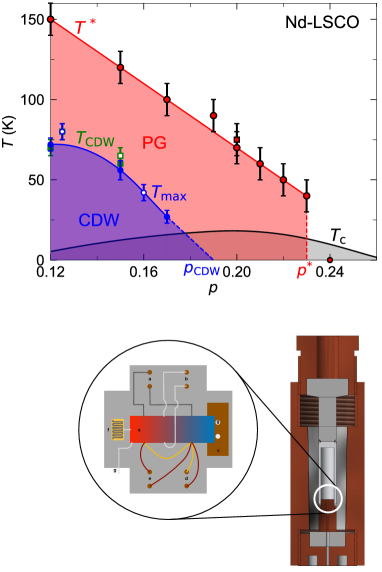
In the present Article, we report our pressure study of the thermopower of Nd-LSCO and La1.8-xEu0.2SrxCuO4 (Eu-LSCO), single-layer, tetragonal cuprate superconductors with a low critical temperature and field , making them ideal candidates to study the field-induced normal-state Seebeck coefficient down to low temperatures. The phase diagram of Nd-LSCO is shown in Fig. 1, where the pseudogap temperature extracted from resistivity measurements Collignon et al. (2020) is displayed and seen to be in agreement with angle-resolved photoemission spectroscopy (ARPES) measurements Matt et al. (2015), showing that the transport signatures of the pseudogap in Nd-LSCO match those seen in spectroscopy. In Nd-LSCO, recent thermopower measurements of the normal state found a sudden increase of below the pseudogap critical doping . This unambiguously confirms that the drop in , from above to below, first inferred from Hall effect, electrical resistivity, and thermal conductivity measurements is not an artifact of those transport properties but a genuine change in carrier density. At lower doping, in the vicinity of , charge density-wave (CDW) order was previously shown to induce a negative at low temperature in YBCO Laliberté et al. (2011), Eu-LSCO Laliberté et al. (2011), HgBa2CuO4+δ (Hg1201) Doiron-Leyraud et al. (2013), and Nd-LSCO Collignon et al. (2020). The aim of the present study is to use the clear signatures of the pseudogap and CDW phases in thermopower to study their evolution with pressure. To that effect, we recently developed a novel AC method which allows us to perform thermopower measurements under hydrostatic pressure and high magnetic field.
Our main finding is a clear suppression of the pseudogap signature in thermopower in Nd-LSCO at , inside the pseudogap phase, while outside the pseudogap phase, at , the thermopower shows a marginal change with pressure. This provides a clear and robust confirmation of the shift of with pressure first deduced from electrical transport measurements Doiron-Leyraud et al. (2017). In Nd-LSCO and Eu-LSCO in the CDW phase, at , we observe a suppression of both the negative amplitude of and its sign-change temperature with pressure, which we interpret as a weakening of CDW order with pressure, as also seen in YBCO via transport Cyr-Choinière et al. (2018), x-rays Souliou et al. (2018), and nuclear magnetic resonance (NMR) Vinograd et al. (2019) measurements. We discuss the implications of our findings for the overall phase diagram of cuprates. Our results highlight the probing power of thermopower measurements under pressure.
II Methods
We measured the Seebeck coefficient using a low AC-technique derived from the Angström method Zhu (2016); Wang et al. (2019) and adapted specifically for experiments in the pressure transmitting fluid encapsulated in a piston-cylinder pressure cell. Our experimental setup is displayed in inset of Fig. 1. A thermal excitation was applied by sending an electrical current through a 120 strain gauge heater located on one side of the pressure chamber. The resulting longitudinal thermal gradient accross the sample was measured using a type E differential thermocouple directly anchored to the sample. An absolute type E thermocouple measures the temperature on the cold side of the differential thermocouple, , allowing a determination of the average temperature of the sample . In all our measurements was found to be very close to , the temperature of our Cernox sensor located just outside the pressure cell, meaning that the heat current generated a small without much elevation of the temperature inside the pressure cell. The Seebeck voltage was measured with phosphor-bronze wires using the same contacts as , which eliminates uncertainties associated with the geometric factor. The Seebeck coefficient is then given by . For the heat current we use a low AC square wave electrical current oscillating between zero and twice the wave amplitude. The thermocouples and Seebeck voltages are amplified using preamplifiers based on EM Electronics A10 chips and picked-up using SR830 lock-in amplifiers at the thermal excitation frequency. Our AC method provides two major advantages over the usual steady-state DC technique: 1) a major boost in measuring speed, which allows recording continuously from 2 to 300K within a few hours and, 2) a greater stability against noise and perturbations that typically plague DC measurements. We carefully benchmarked our approach against the DC method and found no significant difference.
Pressure was applied on our samples using a miniature non-magnetic piston-cylinder cell. The pressure medium is Daphne oil 7474, which remains liquid at all pressures measured here at 300 K, ensuring a high degree of hydrostaticity. The internal pressure is measured both at room temperature and at 4.2 K, using either the fluorescence of a small ruby chip or a Sn manometer. The values quoted throughout are the low temperature pressures. The error bar on all the pressure values is 0.05 GPa, which comes from the uncertainty in measuring the position of the fluorescence peaks For each measurement, the cell was cooled slowly (1 K/min) to ensure a homogeneous freezing of the pressure medium.
Large single crystals of Nd-LSCO were grown at Texas Materials Institute by a traveling float-zone technique in an image furnace, with nominal Sr concentrations , 0.22, and 0.24. Two of these samples (0.22 and 0.24) were previously measured by electrical resistivity and Hall effect Collignon et al. (2017), and all three were studied by thermal conductivity Michon et al. (2019) (sample details can be found in these references). Our crystal of Eu-LSCO with was grown in Tokyo. Thermopower measurements on a closely related sample were previously reported in ref. Laliberté et al. (2011), further sample details can be found there. The hole concentration of each sample is given by . Samples were cut into small rectangular platelets of typical dimensions 1 mm 0.5 mm 0.2 mm, with the shortest dimension along the axis. Contacts were made with H20E silver epoxy diffused by annealing at high temperature in flowing oxygen. Thermopower measurements under pressure in magnetic fields up to 18 T were performed at Sherbrooke, and up to 31 T at the NHMFL in Tallahassee. The magnetic field was applied along the axis and the Seebeck voltage signal was symmetrized with respect to field inversion in order to remove contaminations from the Nernst effect.
III Results and Discussion
III.1 Pseudogap phase at ambient pressure
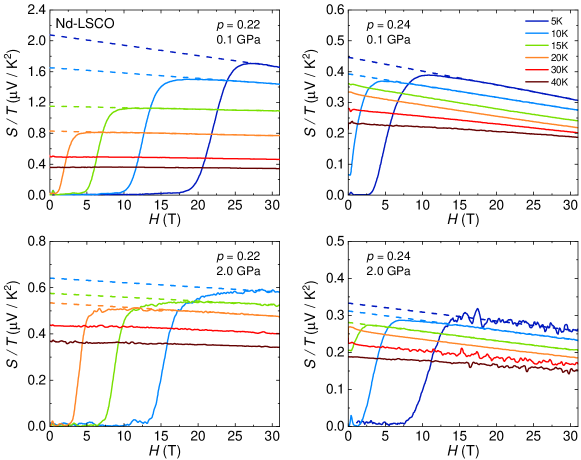
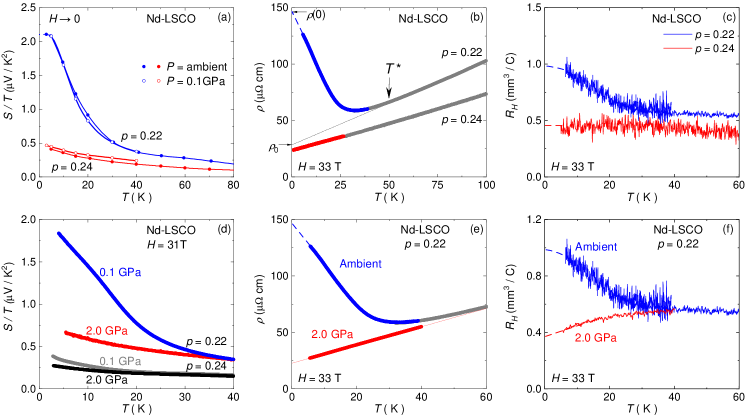
In Fig. 2 we show isotherms of as a function of magnetic field up to 31 T for Nd-LSCO samples at and 0.24 under pressure. With increasing field, is null in the superconducting state at low field, then rises quickly upon crossing the vortex solid melting field , and finally reaches the normal state value above the upper critical field . At both dopings, we observe a rise of the normal state with decreasing temperature. These findings are in overall agreement with our previous report of the zero-pressure thermopower in Nd-LSCO Collignon et al. (2020). In particular, as shown in Fig. 3(a), our data inside a pressure cell at the lowest possible pressure of 0.1 GPa are in excellent quantitative agreement with ambient pressure data on the same sample, free-standing and measured using a standard steady-state DC method Collignon et al. (2020), which demonstrates the reliability of our pressure setup. This holds for both and 0.24. As in ref. Collignon et al. (2020), these curves for versus as are constructed from the isotherms shown in Fig. 2, using the linear fits to the normal state data above , back-extrapolated to in order to capture the intrinsic normal-state free from the sample-dependent negative magneto-Seebeck effect (which is similar to the magnetoresistance of normal metals).
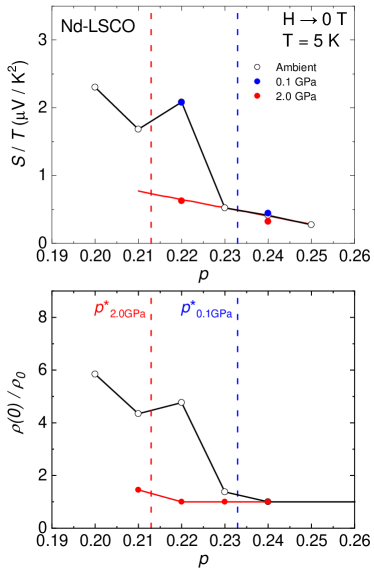
At = 0.1 GPa (Fig. 2), the curves of yield, at 5 K, and 2.1 V / K2 at and 0.22, respectively, roughly a 5-fold increase. As a function of doping, this increase in suddenly occurs at , as shown in Fig. 4 and reported in ref. Collignon et al. (2020), and constitutes a clear thermopower signature of the pseudogap phase. It confirms and reinforces the pseudogap signatures in the electrical resistivity and Hall coefficient Collignon et al. (2017), as shown in the top row of Fig. 3 where we show the parallel low-temperature upturns in , , and in Nd-LSCO . As a result, in the limit the normal-state values of and display a comparable increase between and 0.22, by a factor of about 5 (Fig. 4). Since, in a simple model, , , and , where is the scattering rate, this strongly suggests that it is a drop in carrier density that causes the jump in the three quantities across . As for YBCO Badoux et al. (2016a) and Bi2201 Lizaire et al. (2020), these transport signatures in Nd-LSCO are all indicative of a drop in carrier density at , with going from above to below.
Going just outside the pseudogap phase, at , Nd-LSCO instead displays signatures of quantum criticality, as first noted by the linear- resistivity which extends down to the lowest measured temperature Daou et al. (2009a) (Fig. 3(b)) and whose slope was recently shown to obey the Planckian limit Legros et al. (2019), seen in several other quantum critical metals Bruin et al. (2013). Recent specific heat measurements on Nd-LSCO revealed Log(1/) at Michon et al. (2019), another signature of quantum criticality Löhneysen et al. (2007). A logarithmic divergence is also seen in the Seebeck coefficient, with Log(1/) at in both Nd-LSCO Daou et al. (2009b) and Eu-LSCO Laliberté et al. (2011).
III.2 Pseudogap phase at 2.0 GPa
Our main result is displayed in Fig. 3(d): the low-temperature upturn in at is fully suppressed under a pressure of 2.0 GPa, with now increasing only very slowly with decreasing temperature. Quantitatively, at at 5 K and 31 T goes from 1.8 V / K2 in 0.1 GPa to 0.7 V / K2 in 2.0 GPa. As a result of this suppression, at and 2.0 GPa displays essentially the same temperature evolution as that for at 0.1 GPa, except for a rigid shift. Note that we show continuous -sweeps of in = 31 T taken using our AC method, something not possible with a standard DC technique. Nevertheless, as displayed in Fig. 2(c), the profile of the raw field sweeps (taken with the AC method) of at and 2.0 GPa are similar to those at 0.1 GPa, except for the strong reduction in the amplitude of . This pressure suppression of at mirrors the suppression first observed in and Doiron-Leyraud et al. (2017) and displayed for the same doping in Fig. 3(e) and (f): in 2.0 GPa, goes from showing a huge low-temperature upturn at ambient pressure to displaying a pure linear- behavior, and looses its upturn and becomes flat. Having now the Seebeck coefficient showing the same suppression with pressure demonstrates that the effect is not a peculiarity of or , but is the reflection of a genuine suppression of the drop in carrier density accompanying the pseudogap phase, with all three coefficients at and 2.0 GPa displaying the same behavior as at , where there is no pseudogap. In contrast, we note that 2.0 GPa has a marginal effect on our sample, slightly flattening at low temperature (Fig. 3(d)). Another effect of pressure is a strengthening of superconductivity at , as indicated by the rise of and (Fig. 2).
We observe that pressure impacts only the low temperature behavior, with the curves of , , and in 2.0 GPa all merging with the ambient pressure (or 0.1 GPa) curves at some temperature above 40 K or so (Figs. 3(d,e,f)). Pressure also does not change the actual doping in Nd-LSCO, which is determined by the Sr content. In Fig. 4 we show our data for at 5 K and at 2.0 GPa and observe that the point at naturally extrapolates the line of vs above , showing that itself has moved to lower dopings in 2.0 GPa. Based on our resistivity data under pressure Doiron-Leyraud et al. (2017), shown in Fig. 4, we see that , as signaled by the sudden jump in , has in fact moved from 0.23 to about 0.21 in 2.0 GPa. This implies a rate of suppression of hole per Cu atom/GPa, consistent with our Seebeck data at . We expect that at should also display a near full suppression under 2.0 GPa. As discussed in ref. Doiron-Leyraud et al. (2017), we stress that pressure has no effect on the pseudogap temperature itself, so the suppression of is not accompanied by an overall collapse of , which is a huge energy scale.
Consistent with the fact that moves down with pressure, we observe that at and 0.24, which are both outside the pseudogap phase in 2.0 GPa, exhibit the same slow growth with decreasing temperature but with a roughly 2-fold difference in size (Fig. 3(d)). This is the same factor by which the inelastic part of the resistivity, which is perfectly -linear, changes between and 0.24 (Fig. 3(b,e)). Given that , , and that varies little over this doping range (for ), we infer that the factor of 2 must come from an increase of upon approaching from above, as argued in ref. Legros et al. (2019). Such an increase of is consistent with specific heat data on Nd-LSCO Michon et al. (2019) that show an increase of as is lowered towards from above. So the quantitative values of and in 2.0 GPa are consistent with the doping evolution expected at .
The fact that the shift of under pressure is now seen in thermopower confirms and reinforces the conclusion laid out in ref. Doiron-Leyraud et al. (2017), namely that the shift of with pressure is driving a corresponding shift in , such that continues to be obeyed. Above , the Fermi surface is electron-like and the Hall coefficient is seen to linearly decrease with doping Ando et al. (2004); Tsukada and Ono (2006), reaching negative values well above . Consequently, a relative change of with pressure at constant doping indicates that itself is moving with pressure, as observed Doiron-Leyraud et al. (2017) and expected from band-structure calculations Doiron-Leyraud et al. (2017). The shift of and in 2.0 GPa were found to match, both moving by about 0.02 holes per planar Cu atoms Doiron-Leyraud et al. (2017). That must be obeyed explains why LSCO, Nd/Eu-LSCO, and Bi2201 all have different , and shows that the pseudogap can only exist on a hole-like Fermi surface, which imposes a stringent constraint on theories of the pseudogap phase. This was also found in numerical calculations of the Hubbard model Wu et al. (2018).
III.3 Pressure effect on charge density-wave phase
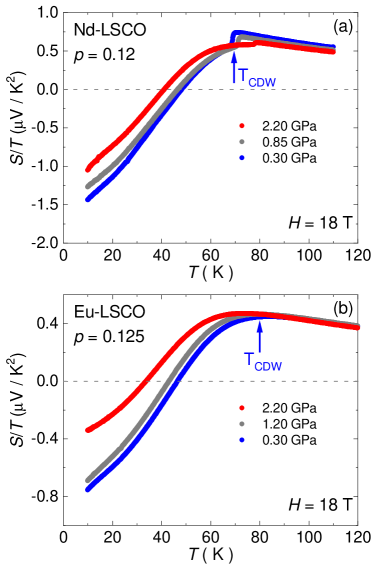
We now turn to dopings well below and at the center of the charge density-wave (CDW) phase, namely in Nd-LSCO and in Eu-LSCO. As displayed in Fig. 1, x-ray diffraction measurements Zimmermann et al. (1998); Niemöller et al. (1999) detect the onset of CDW order in Nd-LSCO at a temperature K. Our data for versus for this sample show a clear departure from the data at , with at near ambient pressure (0.3 GPa) going through a broad maximum at K before falling to negative values at low temperatures (Fig. 5(a)). Eu-LSCO at exhibits a similar behavior for (Fig. 5(b)), while x-ray measurements find a comparable close to 80 K Fink et al. (2011). A negative is typical of cuprates near , as observed in LSCO Badoux et al. (2016b), LBCO Li et al. (2007), Nd-LSCO Nakamura and Uchida (1992); Hucker et al. (1998), Eu-LSCO Hucker et al. (1998); Chang et al. (2010), YBCO Chang et al. (2010); Laliberté et al. (2011), and Hg1201 Doiron-Leyraud et al. (2013). These studies showed that a negative Seebeck coefficient is a consequence of the Fermi surface reconstruction caused by the CDW order. In both Nd-LSCO and Eu-LSCO, this is supported by the fact that coincides with (Fig. 1) Collignon et al. (2020). This recently allowed us to establish the doping range of the CDW phase in Nd-LSCO, present up to about Collignon et al. (2020). Note that in Nd-LSCO , the structural transition from the low temperature orthorombic (LTO) to low temperature tetragonal (LTT) phase also coincides with and , causing the sharp step in our data (Fig. 5(a)). In Eu-LSCO, the LTO-LTT transition occurs at a much higher temperature, with K Klauss et al. (2000) at , and yet it displays the same curve as Nd-LSCO, showing that the CDW and not the LTO-LTT transition is causing the negative Laliberté et al. (2011).
In both Nd-LSCO and Eu-LSCO we observe two clear effects under increasing pressure: 1) at low temperatures, the amplitude of the negative is suppressed and 2) the temperature shifts down. In Eu-LSCO, the suppression of is significant, going at 10 K from about -0.8 V/K2 at 0.3 GPa to -0.35 V/K2 at 2.0 GPa, over a 50% change. on the other hand goes from about 80 K at 0.3 GPa to 70 K at 2.0 GPa. As a result, the sign-change temperature is also clearly suppressed by pressure, moving from 47 K at 0.3 GPa to 32 K at 2.0 GPa. Similar effects are seen on Nd-LSCO, albeit smaller in amplitude. Given that the negative is a clear marker of the CDW phase, its suppression is clear indication that the CDW phase is weakened by pressure. Note that the high temperature above is only weakly affected by the pressure, showing that pressure principally impacts the CDW phase.
Note also that superconductivity is boosted with pressure, as evidenced by the increase in we observe in both Nd-LSCO and Eu-LSCO (at , rises from 7 K at 0.3 GPa to 15 K at 2.2 GPa), suggesting a competition between SC and CDW. This pressure tuning of the competition between SC and CDW was previously inferred in Nd-LSCO using transport measurements Arumugam et al. (2002) and in YBCO based on resistivity and Hall effect measurements under hydrostatic pressure Cyr-Choinière et al. (2018). In YBCO, the suppression of CDW modulations with pressure was directly observed by x-ray diffraction Souliou et al. (2018) and NMR Vinograd et al. (2019) measurements. (Interestingly, in the case of Nd-LSCO 0.12 we observe a clear upward shift of with pressure, in agreement with a previous x-ray study at the same doping Crawford et al. (2005).)
IV Summary
We have used the Seebeck effect to examine the pressure dependence of the pseudogap critical point in the cuprate superconductor Nd-LSCO, and of the CDW phase in both Nd-LSCO and Eu-LSCO. We observe that the large Seebeck coefficient inside the pseudogap phase at , that results from the low carrier density below , is fully suppressed under a pressure = 2.0 GPa. This confirms and reinforces our previous observation, inferred from resistivity and Hall effect measurements Doiron-Leyraud et al. (2017), that in Nd-LSCO shifts down with pressure at the rate of hole per Cu atom/GPa and is fundamentally driven by a shift in pressure of the van Hove point where the Fermi surface changes from hole-like to electron-like. This strengthens the notion that the pseudogap phase only exists on a hole-like Fermi surface, which implies important theoretical constraints. At lower doping, at where the CDW phase is strongest, we observe in both Nd-LSCO and Eu-LSCO a reduction in magnitude of the negative Seebeck coefficient with increasing pressure, which we attribute to a weakening of the CDW order with pressure. This confirms in Nd-LSCO and Eu-LSCO the phase competition between CDW order and superconductivity seen in other cuprates.
V Acknowledgements
We thank S. Fortier for his assistance with the experiments. L.T. acknowledges support from the Canadian Institute for Advanced Research (CIFAR) as a CIFAR Fellow and funding from the Institut Quantique, the Natural Sciences and Engineering Research Council of Canada (PIN:123817), the Fonds de Recherche du Québec – Nature et Technologies (FRQNT), the Canada Foundation for Innovation (CFI), and a Canada Research Chair. This research was undertaken thanks in part to funding from the Canada First Research Excellence Fund and the Gordon and Betty Moore Foundation’s EPiQS Initiative (Grant GBMF5306 to L.T.). The National High Magnetic Field Laboratory is supported by the National Science Foundation through NSF/DMR-1644779 and the State of Florida. J.S.Z. was supported by NSF MRSEC under Cooperative Agreement No. DMR-1720595.
References
- Badoux et al. (2016a) S. Badoux, W. Tabis, F. Laliberté, G. Grissonnanche, B. Vignolle, D. Vignolles, J. Béard, D. A. Bonn, W. N. Hardy, R. Liang, N. Doiron-Leyraud, L. Taillefer, and C. Proust, Nature 531, 210 (2016a).
- Collignon et al. (2017) C. Collignon, S. Badoux, S. A. A. Afshar, B. Michon, F. Laliberté, O. Cyr-Choinière, J.-S. Zhou, S. Licciardello, S. Wiedmann, N. Doiron-Leyraud, and L. Taillefer, Physical Review B 95, 224517 (2017).
- Laliberté et al. (2016) F. Laliberté, W. Tabis, S. Badoux, B. Vignolle, D. Destraz, N. Momono, T. Kurosawa, K. Yamada, H. Takagi, N. Doiron-Leyraud, C. Proust, and L. Taillefer, arXiv:1606.04491 [cond-mat] (2016).
- Michon et al. (2018) B. Michon, A. Ataei, P. Bourgeois-Hope, C. Collignon, S. Li, S. Badoux, A. Gourgout, F. Laliberté, J.-S. Zhou, N. Doiron-Leyraud, and L. Taillefer, Physical Review X 8, 041010 (2018).
- Bourgeois-Hope et al. (2019) P. Bourgeois-Hope, S. Y. Li, F. Laliberté, S. Badoux, S. M. Hayden, N. Momono, T. Kurosawa, K. Yamada, H. Takagi, N. Doiron-Leyraud, and L. Taillefer, arXiv:1910.08126 [cond-mat] (2019).
- Lizaire et al. (2020) M. Lizaire, A. Legros, A. Gourgout, S. Benhabib, S. Badoux, F. Laliberté, M.-E. Boulanger, A. Ataei, G. Grissonnanche, D. LeBoeuf, S. Licciardello, S. Wiedmann, S. Ono, H. Raffy, S. Kawasaki, G.-Q. Zheng, N. Doiron-Leyraud, C. Proust, and L. Taillefer, arXiv:2008.13692 [cond-mat] (2020).
- Putzke et al. (2020) C. Putzke, S. Benhabib, W. Tabis, J. Ayres, Z. Wang, L. Malone, S. Licciardello, J. Lu, T. Kondo, T. Takeuchi, N. E. Hussey, J. R. Cooper, and A. Carrington, arXiv:1909.08102 [cond-mat] (2020).
- Michon et al. (2019) B. Michon, C. Girod, S. Badoux, J. Kačmarčík, Q. Ma, M. Dragomir, H. A. Dabkowska, B. D. Gaulin, J.-S. Zhou, S. Pyon, T. Takayama, H. Takagi, S. Verret, N. Doiron-Leyraud, C. Marcenat, L. Taillefer, and T. Klein, Nature 567, 218 (2019).
- Daou et al. (2009a) R. Daou, N. Doiron-Leyraud, D. LeBoeuf, S. Y. Li, F. Laliberté, O. Cyr-Choinière, Y. J. Jo, L. Balicas, J.-Q. Yan, J.-S. Zhou, J. B. Goodenough, and L. Taillefer, Nature Physics 5, 31 (2009a).
- Cooper et al. (2009) R. A. Cooper, Y. Wang, B. Vignolle, O. J. Lipscombe, S. M. Hayden, Y. Tanabe, T. Adachi, Y. Koike, M. Nohara, H. Takagi, C. Proust, and N. E. Hussey, Science 323, 603 (2009).
- Legros et al. (2019) A. Legros, S. Benhabib, W. Tabis, F. Laliberté, M. Dion, M. Lizaire, B. Vignolle, D. Vignolles, H. Raffy, Z. Z. Li, P. Auban-Senzier, N. Doiron-Leyraud, P. Fournier, D. Colson, L. Taillefer, and C. Proust, Nature Physics 15, 142 (2019).
- Doiron-Leyraud et al. (2017) N. Doiron-Leyraud, O. Cyr-Choinière, S. Badoux, A. Ataei, C. Collignon, A. Gourgout, S. Dufour-Beauséjour, F. F. Tafti, F. Laliberté, M.-E. Boulanger, M. Matusiak, D. Graf, M. Kim, J.-S. Zhou, N. Momono, T. Kurosawa, H. Takagi, and L. Taillefer, Nature Communications 8, 2044 (2017).
- Matt et al. (2015) C. E. Matt, C. G. Fatuzzo, Y. Sassa, M. Månsson, S. Fatale, V. Bitetta, X. Shi, S. Pailhès, M. H. Berntsen, T. Kurosawa, M. Oda, N. Momono, O. J. Lipscombe, S. M. Hayden, J.-Q. Yan, J.-S. Zhou, J. B. Goodenough, S. Pyon, T. Takayama, H. Takagi, L. Patthey, A. Bendounan, E. Razzoli, M. Shi, N. C. Plumb, M. Radovic, M. Grioni, J. Mesot, O. Tjernberg, and J. Chang, Physical Review B 92, 134524 (2015).
- Yoshida et al. (2009) T. Yoshida, M. Hashimoto, S. Ideta, A. Fujimori, K. Tanaka, N. Mannella, Z. Hussain, Z.-X. Shen, M. Kubota, K. Ono, S. Komiya, Y. Ando, H. Eisaki, and S. Uchida, Physical Review Letters 103, 037004 (2009).
- Chang et al. (2008) J. Chang, M. Shi, S. Pailhés, M. Månsson, T. Claesson, O. Tjernberg, A. Bendounan, Y. Sassa, L. Patthey, N. Momono, M. Oda, M. Ido, S. Guerrero, C. Mudry, and J. Mesot, Physical Review B 78, 205103 (2008).
- Kondo et al. (2004) T. Kondo, T. Takeuchi, T. Yokoya, S. Tsuda, S. Shin, and U. Mizutani, Journal of Electron Spectroscopy and Related Phenomena 137-140, 663 (2004).
- Wu et al. (2018) W. Wu, M. S. Scheurer, S. Chatterjee, S. Sachdev, A. Georges, and M. Ferrero, Physical Review X 8, 021048 (2018).
- Collignon et al. (2020) C. Collignon, A. Ataei, A. Gourgout, S. Badoux, M. Lizaire, A. Legros, S. Licciardello, S. Wiedmann, J.-Q. Yan, J.-S. Zhou, Q. Ma, B. D. Gaulin, N. Doiron-Leyraud, and L. Taillefer, arXiv:2011.14927 [cond-mat] (2020).
- Behnia et al. (2004) K. Behnia, D. Jaccard, and J. Flouquet, Journal of Physics: Condensed Matter 16, 5187 (2004).
- Miyake and Kohno (2005) K. Miyake and H. Kohno, Journal of the Physical Society of Japan 74, 254 (2005).
- Laliberté et al. (2011) F. Laliberté, J. Chang, N. Doiron-Leyraud, E. Hassinger, R. Daou, M. Rondeau, B. Ramshaw, R. Liang, D. Bonn, W. Hardy, S. Pyon, T. Takayama, H. Takagi, I. Sheikin, L. Malone, C. Proust, K. Behnia, and L. Taillefer, Nature Communications 2, 432 (2011).
- Doiron-Leyraud et al. (2015) N. Doiron-Leyraud, S. Badoux, S. René de Cotret, S. Lepault, D. LeBoeuf, F. Laliberté, E. Hassinger, B. J. Ramshaw, D. A. Bonn, W. N. Hardy, R. Liang, J.-H. Park, D. Vignolles, B. Vignolle, L. Taillefer, and C. Proust, Nature Communications 6, 6034 (2015).
- Doiron-Leyraud et al. (2007) N. Doiron-Leyraud, C. Proust, D. LeBoeuf, J. Levallois, J.-B. Bonnemaison, R. Liang, D. A. Bonn, W. N. Hardy, and L. Taillefer, Nature 447, 565 (2007).
- Doiron-Leyraud et al. (2013) N. Doiron-Leyraud, S. Lepault, O. Cyr-Choinière, B. Vignolle, G. Grissonnanche, F. Laliberté, J. Chang, N. Barišić, M. K. Chan, L. Ji, X. Zhao, Y. Li, M. Greven, C. Proust, and L. Taillefer, Physical Review X 3, 021019 (2013).
- Zimmermann et al. (1998) M. v. Zimmermann, A. Vigliante, T. Niemöller, N. Ichikawa, T. Frello, J. Madsen, P. Wochner, S. Uchida, N. H. Andersen, J. M. Tranquada, D. Gibbs, and J. R. Schneider, Europhysics Letters (EPL) 41, 629 (1998).
- Niemöller et al. (1999) T. Niemöller, N. Ichikawa, T. Frello, H. Hünnefeld, N. H. Andersen, S. Uchida, J. R. Schneider, and J. M. Tranquada, The European Physical Journal B-Condensed Matter and Complex Systems 12, 509 (1999).
- Fink et al. (2011) J. Fink, V. Soltwisch, J. Geck, E. Schierle, E. Weschke, and B. Büchner, Physical Review B 83, 092503 (2011).
- Cyr-Choinière et al. (2018) O. Cyr-Choinière, D. LeBoeuf, S. Badoux, S. Dufour-Beauséjour, D. A. Bonn, W. N. Hardy, R. Liang, D. Graf, N. Doiron-Leyraud, and L. Taillefer, Physical Review B 98, 064513 (2018).
- Souliou et al. (2018) S. M. Souliou, H. Gretarsson, G. Garbarino, A. Bosak, J. Porras, T. Loew, B. Keimer, and M. Le Tacon, Physical Review B 97, 020503 (2018).
- Vinograd et al. (2019) I. Vinograd, R. Zhou, H. Mayaffre, S. Krämer, R. Liang, W. N. Hardy, D. A. Bonn, and M.-H. Julien, Physical Review B 100, 094502 (2019).
- Zhu (2016) Y. Zhu, International Journal of Heat and Mass Transfer 92, 784 (2016).
- Wang et al. (2019) H. Wang, F. Yang, Y. Guo, K. Peng, D. Wang, W. Chu, and S. Zheng, Measurement 131, 204 (2019).
- Bruin et al. (2013) J. a. N. Bruin, H. Sakai, R. S. Perry, and A. P. Mackenzie, Science 339, 804 (2013).
- Löhneysen et al. (2007) H. v. Löhneysen, A. Rosch, M. Vojta, and P. Wölfle, Reviews of Modern Physics 79, 1015 (2007).
- Daou et al. (2009b) R. Daou, O. Cyr-Choinière, F. Laliberté, D. LeBoeuf, N. Doiron-Leyraud, J.-Q. Yan, J.-S. Zhou, J. Goodenough, and L. Taillefer, Physical Review B 79, 180505R (2009b).
- Ando et al. (2004) Y. Ando, Y. Kurita, S. Komiya, S. Ono, and K. Segawa, Physical Review Letters 92, 197001 (2004).
- Tsukada and Ono (2006) I. Tsukada and S. Ono, Physical Review B 74, 134508 (2006).
- Klauss et al. (2000) H.-H. Klauss, W. Wagener, M. Hillberg, W. Kopmann, H. Walf, F. J. Litterst, M. Hücker, and B. Büchner, Physical Review Letters 85, 4590 (2000).
- Badoux et al. (2016b) S. Badoux, S. Afshar, B. Michon, A. Ouellet, S. Fortier, D. LeBoeuf, T. Croft, C. Lester, S. Hayden, H. Takagi, K. Yamada, D. Graf, N. Doiron-Leyraud, and L. Taillefer, Physical Review X 6, 021004 (2016b).
- Li et al. (2007) Q. Li, M. Hücker, G. D. Gu, A. M. Tsvelik, and J. M. Tranquada, Physical Review Letters 99, 067001 (2007).
- Nakamura and Uchida (1992) Y. Nakamura and S. Uchida, Physical Review B 46, 5841 (1992).
- Hucker et al. (1998) M. Hucker, V. Kataev, J. Pommer, O. Baberski, W. Schlabitz, and B. Buchner, Journal of Physics and Chemistry of Solids 59, 1821 (1998).
- Chang et al. (2010) J. Chang, R. Daou, C. Proust, D. LeBoeuf, N. Doiron-Leyraud, F. Laliberté, B. Pingault, B. J. Ramshaw, R. Liang, D. A. Bonn, W. N. Hardy, H. Takagi, A. B. Antunes, I. Sheikin, K. Behnia, and L. Taillefer, Physical Review Letters 104, 057005 (2010).
- Arumugam et al. (2002) S. Arumugam, N. Môri, N. Takeshita, H. Takashima, T. Noda, H. Eisaki, and S. Uchida, Physical Review Letters 88, 247001 (2002).
- Crawford et al. (2005) M. K. Crawford, R. L. Harlow, S. Deemyad, V. Tissen, J. S. Schilling, E. M. McCarron, S. W. Tozer, D. E. Cox, N. Ichikawa, S. Uchida, and Q. Huang, Physical Review B 71, 104513 (2005).