Simultaneous NICER and NuSTAR Observations of the Ultra-compact X-ray Binary 4U 1543624
Abstract
We present the first joint NuSTAR and NICER observations of the ultra-compact X-ray binary (UCXB) 4U 1543624 obtained in 2020 April. The source was at a luminosity of ergs s-1 and showed evidence of reflected emission in the form of an O VIII line, Fe K line, and Compton hump within the spectrum. We used a full reflection model, known as xillverCO, that is tailored for the atypical abundances found in UCXBs, to account for the reflected emission. We tested the emission radii of the O and Fe line components and conclude that they originate from a common disk radius in the innermost region of the accretion disk ( ). Assuming that the compact accretor is a neutron star (NS) and the position of the inner disk is the Alfvén radius, we placed an upper limit on the magnetic field strength to be G at the poles. Given the lack of pulsations detected and position of , it was likely that a boundary layer region had formed between the NS surface and inner edge of the accretion disk with an extent of 1.2 km. This implies a maximum radius of the neutron star accretor of km when assuming a canonical NS mass of 1.4 .
1 Introduction
Ultra-compact X-ray binaries (UCXBs) are a subclass of low-mass X-ray binaries (LMXBs) with short orbital periods of minutes. The tight orbit of these systems means the compact object, either a neutron star (NS) or black hole (BH), is accreting via Roche-lobe overflow from a degenerate stellar companion, such as a white dwarf or He star (Nelson et al., 1986; Savonije et al., 1986). UCXBs are strong, persistent gravitational wave sources for future missions, such as NASA/ESA’s LISA, that are sensitive in the sub-mHz regime (Nelemans & Jonker, 2010).
The accretion disks in these systems differ from those of typical LMXBs since they are almost devoid of hydrogen while overabundant in oxygen, carbon, and/or neon (Nelemans et al., 2003). When accretion disks are externally illuminated by hard X-rays originating from close to the compact object, the photons are reprocessed and re-emitted as a series of atomic features superimposed onto a ‘reflected’ continuum. These features are then broadened due to Doppler, special, and general relativistic effects in this region (Fabian et al., 2000). The strength of these effects depend on the proximity to the compact object, therefore, these reflection features can be used to infer fundamental properties of the compact object, as well as the accretion disk itself (e.g., Miller 2007; Cackett et al. 2008, 2009b, 2010; Papitto et al. 2009; Di Salvo et al. 2009, 2015; Miller et al. 2013; Ludlam et al. 2017a).
In a typical accretion disk composed of solar abundance material, the Fe K line at keV is the most prominent feature. However, in an UCXB, O VIII ( keV) becomes dominant over Fe K (Ballantyne et al., 2002). It was previously thought that Fe emission should not be present in these systems since most of the ionizing radiation within the disk would be absorbed by the lower-Z atomic elements (Koliopanos et al., 2013). However, this was revealed not to be the case via XMM-Newton and Chandra observations of the UCXBs 4U 1543624 and 4U 0614+091 (Madej & Jonker, 2011; Madej et al., 2014). Indeed other UCXBs observed with XMM-Newton have since shown evidence of Fe emission lines (e.g., 4U 172834, 4U 182030, 4U 191605: Koliopanos et al. 2020a), although some detections are marginal (e.g., MAXI J0911655: Sanna et al. 2017). Additionally, NuSTAR has observed reflection features in 4U 0614+091 (Ludlam et al., 2019a) and the recently classified UCXB IGR J17062-6143 (Degenaar et al., 2017; van den Eijnden et al., 2018; Strohmayer et al., 2018). The predicted absence of Fe emission in these systems was based on models which assume a cold, neutral disk and, therefore, any ionizing photons have a higher probability of being absorbed by the overabundant O atoms rather than Fe (see Fig. 1 in Koliopanos et al. 2013). Yet, the observational evidence of the Fe K line in UCXBs implies that the disk is hot and being illuminated in a similar manner to other accreting LMXBs (Madej et al., 2014).
4U 1543624 is an UCXB with an orbital period of minutes (Wang & Chakrabarty, 2004; Wang et al., 2015) located at a distance between kpc (Wang & Chakrabarty, 2004; Bailer-Jones et al., 2018; Serino et al., 2018). The nature of the compact object in 4U 1543624 is uncertain, but very likely a NS from a tentative association with a Type-1 X-ray burst seen by MAXI (Serino et al., 2018) and its radio–X-ray behavior (Ludlam et al., 2017d, 2019b; Tetarenko et al., 2018). The degenerate companion in this system is a C/O or O/Ne white dwarf due to the absence of hydrogen and helium lines coupled with emission from carbon and oxygen in the optical spectrum (Nelemans et al., 2003).
As mentioned previously, the X-ray spectrum of 4U 1543624 has shown a broad O viii Ly emission feature at keV in conjuction with Fe K emission (Juett & Chakrabarty, 2003; Madej & Jonker, 2011). Madej et al. (2014) presented an X-ray spectral analysis of 4U 1543624 and 4U 0614+091 using a preliminary version of a new reflection model, xillverCO, that was tailored to accommodate the atypical elemental abundances in UCXBs. This model mimics the negligible H and He abundances in the disk by setting the abundance of metals to 10 times solar abundance and allowing for variable abundance of C and O. Though this only had a limited number of grid points (i.e., large steps between parameter values), spectral modeling using this initial xillver grid on 4U 1543624 indicated an inner disk radius (where ) and an inclination of (Madej et al., 2014).
More recently, Ludlam et al. (2019b) reported on NICER monitoring of 4U 1543624 over a day period in 2017 August while the source underwent a period of enhanced accretion activity with supplemental observations by Swift, INTEGRAL, and ATCA. The monitoring of this event allowed for tracking of changes in the accretion disk in this system. There was an increase in the strength of the thermal component at the lowest energies as the accretion disk moved closer to the NS (from to at peak intensity: Ludlam et al. 2019b). There was also a clear change in the shape and strength of the emission lines as well, however, this analysis simply used diskline to model the emission lines from Fe and O rather than a full reflection spectrum framework leading to uncertainties regarding a common emission radius for these two features.
We present simultaneous observations of 4U 1543624 with NICER and NuSTAR from 2020 April. This is the first time that NuSTAR has observed the source. The goal of these observations is to analyze the reflection spectrum in this system with a full reflection model to determine if the O and Fe components originate from similar disk radii and ionization. The combined passband of NICER and NuSTAR are ideal for revealing the presence of reflected emission while pinning down the continuum (Ludlam et al., 2020; Wang et al., 2020). We present the observations and data reduction in §2, our analysis in §3, and discuss the results in §4.
2 Observations and Data Reduction
NICER observed 4U 1543624 twice during the span of the contemporaneous NuSTAR observation. The first observation, ObsID 3604010101, began at 07:09:05 UT on 2020 April 19 for an exposure of 9.1 ks. The second observation, ObsID 3604010102, began at 00:33:20 UT on 2020 April 20 for 863 s. The NICER observations were reduced using nicerdas 2020-04-23_V007a. Data were re-calibrated with the latest calibration files available in CALDB release 20200722 through implementation of the nicerl2 command. Good time intervals (GTIs) were generated using nimaketime to select events that occurred when the particle background was low (KP 5 and COR_SAX 4) and avoiding times of extreme optical light loading (SUN_ANGLE 60 and FPM_UNDERONLY_COUNT 200)111See Bogdanov et al. (2019) regarding information on the NICER screening flags.. Using niextract-events, the GTIs were applied to the data. The resulting event files were loaded into xselect to extract a combined spectrum and light curves in various energy bands. Background spectra were generated using the nibackgen3C50v6222https://heasarc.gsfc.nasa.gov/docs/nicer/tools/nicer_bkg_est_tools.html tool (R. Remillard, in prep.) for each cleaned and ufa (calibrated but unfiltered) event file pair based on instrument proxies to account for the observing conditions at the time. These were then combined into a single background spectrum that was weighted by the duration of each cleaned event file using mathpha. We use the standard public RMF and the on-axis average ARF in CALDB v.20200722 when modeling the NICER spectrum.
NuSTAR observed 4U 1543624 on 2020 April 19 starting at 07:21:09 UT. ObsID 30601006002 contains ks of data from Focal Plane Module (FPM) A and ks from FPMB. The NuSTAR data were reduced using the standard data reduction process with nustardas v1.9.2 and caldb 20191219. Spectra and light curves are extracted using a circular region with a 80′′ radial centered on the source. Backgrounds were generated from a 80′′ radial region on the same detector but away from the source.
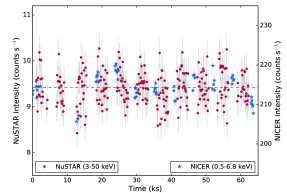
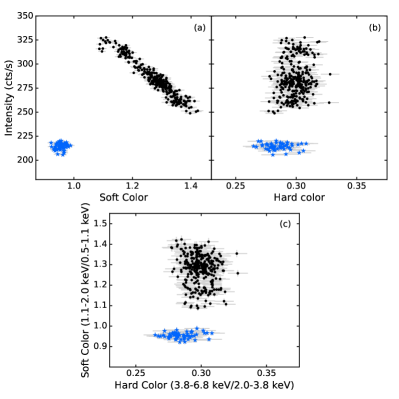
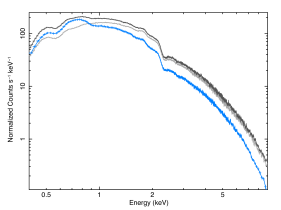
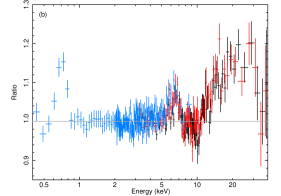
There were no Type-I X-ray bursts present in either data set, therefore no further filtering was needed. Systematic errors of 1% in the keV band and 5% in the keV band were added to the NICER spectrum (Alabarta et al., 2020). The NuSTAR spectra were binned by 3 PI channels using grppha (Choudhury et al., 2017). Figure 1 shows the NuSTAR/FPMA (circles) and NICER (stars) light curves binned to 128 s starting from when NICER began observing 4U 1543624. The source exhibits variability over the ks of elapsed time since the start of the observations. Using the definitions from Bult et al. (2018), we compare the NICER hard color ( keV / keV) and soft color ( keV / keV) of 4U 1543624 to the previous observations that occurred in 2017 August during an enhanced accretion period in Figure 2. The 2020 observations presented here captured the source at a lower intensity. For comparison, we also show the counts spectrum in Figure 3 for the 2020 NICER observations to intervals A and E from Ludlam et al. (2019b).
Furthermore, we search the data for pulsations in §3.2. The data obtained for both NICER and NuSTAR were barycentered to the solar system barycenter using the source position prior to the search. We used the same source regions as previously mentioned to extract source photons in the keV energy band from the NuSTAR observations. NICER photons were extracted from the keV energy band. Note that NICER is not an X-ray imaging mission, therefore there is no need for an extraction region. Events were extracted using the same GTIs as were used for extracting spectra. However, the NuSTAR FPMA and FPMB can have GTI mismatches (Bachetti et al., 2015b), hence we trimmed each GTI interval to be within a safe range of s. We applied clockfile v.108, generated by using nustar-clock-utils 333https://github.com/nustar/nustar-clock-utils, to the NuSTAR event files using the FTOOL barycorr. The clockfile v.108 corrects for both the NuSTAR clock variations and absolute timing uncertainty of 5 s between NuSTAR and NICER.
3 Analysis and Results
3.1 Spectral
The spectral analysis was conducted using xspec v.12.11.0 (Arnaud, 1996). The NICER data were modeled in the keV band, whereas the NuSTAR data were considered in the keV energy range. Data above these energy ranges are dominated by the X-ray background. A constant was allowed to vary for the NuSTAR/FPMB and NICER spectra, while the NuSTAR/FPMA is fixed at 1.0, to allow for cross-calibration differences. The absorption along the line of sight was accounted for with the tbabs model (Wilms et al., 2000). There were two narrow features in the low-energy portion of NICER spectrum that were also seen in Ludlam et al. (2020) for a different source, 4U . These are likely astrophysical in origin, i.e., due to the neutral interstellar medium (ISM) along the line of sight (Pinto et al., 2013), although instrumental uncertainties are also a plausible explanation. We added two edge components with energies bound between keV and keV to account for the features.
The continuum was modeled according to the framework of Lin et al. (2007) in order to provide a direct comparison to the results in the previous analysis on 4U 1543624 using NICER observations (Ludlam et al., 2019b; Koliopanos et al., 2020b). A simple absorbed cutoff power-law to account for weak Comptonizaton from the corona and single-temperature thermal component originating from a boundary layer or NS surface were sufficient to describe the continuum spectra. The model parameters and values are reported in Table 1. The photon index, , is softer and the single-temperature blackbody is hotter in comparison to the 2017 observations reported in Ludlam et al. (2019b) (, keV). However, the thermal component is cooler than the value reported in Koliopanos et al. (2020b) ( keV). The data do not require a disk component suggesting that the thermal emission from the disk is cooler than when the source was observed in 2017 during an enhanced accretion episode.
We switch the empirical continuum model for a more physically motivated model. When using nthcomp to account for Comptonized accretion instead of the cutoff power-law that would arise from the corona, we find , seed photon temperature keV, a high-energy rollover that tends to the upper limit to 1000 keV, and normalization of . This is similar in shape to the cutoff power-law component in the previous continuum model description, but predicts photons out to higher-energy that we are not sensitive to with the current data. We note that the high-enery rollover also tended to 1000 keV when nthcomp was applied to the NICER and INTEGRAL observations of 4U 1543624 (Ludlam et al., 2019b). The fit still requires a single-temperature blackbody component of keV and . The edges and multiplicative constants are similar to the continuum values reported in Table 1 with a slightly lower value for ( cm-2), but this is likely a more reliable measure of the column density given that the nthcomp has a low-energy turn over that the power-law component lacks (which can lead to higher inferred value in the latter case). However, the values between the two continuum models are not largely discrepant. The reduced is upwards of 2.8 (), but statistically better than the simple continuum model description. However, there currently does not exist reflection models that are tailored to the atypical abundances observed in the accretion disks of UCXBs using a Comptonized or blackbody illuminating continuum. Therefore, while we report the model parameter values using nthcomp for completeness, we do not pursue this further when modeling the reflected emission.
| Model | Parameter | Continuum | diskline | xillverCO | |||
| D1 | D2 | X1 | X2 | X3 | |||
| constant | CFPMB | ||||||
| CNICER | |||||||
| tbabs | ( cm-2) | ||||||
| edge | E (keV) () | … | |||||
| () | … | ||||||
| edge | E (keV) () | … | |||||
| () | … | ||||||
| bbody | kT (keV) | ||||||
| normbb () | |||||||
| (km) | |||||||
| cutoffpl | |||||||
| Ecutoff (keV) | |||||||
| normpl () | |||||||
| diskline1 | EO (10-1 keV) | … | … | … | … | ||
| … | … | … | … | ||||
| (∘) | … | … | … | … | |||
| () | … | … | … | … | |||
| (km) | … | … | … | … | |||
| normline1 (10-2) | … | … | … | … | |||
| diskline2 | EFe (keV) | … | … | … | … | ||
| () | … | … | … | … | |||
| (km) | … | … | … | … | |||
| normline2 (10-4) | … | … | … | … | |||
| relconv | … | … | … | ||||
| (∘) | … | … | … | ||||
| () | … | … | … | ||||
| () | … | … | … | ||||
| (km) | … | … | … | ||||
| xillverCO | … | … | … | ||||
| (10-2 keV) | … | … | … | ||||
| FracPL/BB (10-1) | … | … | … | ||||
| normxillver () | … | … | … | ||||
| (dof) | 4935 (1462) | 1732 (1453) | 1748 (1454) | 1814 (1454) | 1613 (1408) | 1355 (1101) | |
Note.— Errors are reported at the 90% confidence level and calculated from Markov Chain Monte Carlo (MCMC) of chain length . NICER is fit in the keV energy band while NuSTAR is fit in the keV band. A multiplicative constant is used on the NICER and FPMB data, while FPMA is fixed to unity. The spherical blackbody radius is calculated assuming a distance of 7 kpc and color correction factor of 1.7 (Shimura & Takahara, 1995). The emissivity index and inclination are tied between the two diskline components. D1 allows the inner disk radii to differ between the two diskline components, whereas D2 assumes a common emission radius for both lines. The outer disk radius is fixed at 990 and the dimensionless spin parameter is set to (hence, 1 = 6 = 12.4 km). The photon index and high-energy cutoff in the xillverCO model are tied to the values of the continuum power-law component. X1 is the full passband from keV, X2 is ignoring the the O VIII line by ignoring below keV and fixing the column density and low-E edges, and X3 uses the keV band but ignores the Fe line region from keV.
Fitting the emission lines with simple Gaussian components provides an equivalent width of eV for the O VIII near 0.7 keV and eV for the Fe K emission at 6.4 keV. These are consistent with the values reported in Ludlam et al. (2019b). For direct comparison to Ludlam et al. (2019b), we add two diskline (Fabian et al., 1989) components to account for the O VIII and Fe K lines with energies between keV and keV, respectively. The inclination () and emissivity index () parameters are tied between the line components. In the first instance, we allow the inner disk radius to differ between components. This is reported in Table 1 under D1. The emitting radius of the Fe line is further out in the disk than the O VIII line, which is consistent with the results reported in Ludlam et al. (2019b) when is allowed to differ. In the second case, we tie the inner disk radius between the two lines, which is reported under D2 in Table 1. In this case, the emission region of both lines is from the inner most accretion disk within , which agrees with the inferred inner disk radius from interval E ( , Ludlam et al. 2019b) and suggests that the disk has not receded after the peak flux observed in 2017. For both spectral fits, the emissivity index is consistent with values reported in Madej et al. (2014) and observed in other NS LMXBs such as 4U 170544, 4U 163653, 4U 1702429, Serpens X-1, as well as the UCXB 4U 0614+091 (Egron et al., 2013; Ludlam et al., 2017a, 2018, 2019a). Additionally, the inclination is lower () than has been reported previously for this source, but in agreement with the inclination inferred from the optical observation (Wang & Chakrabarty, 2004).
It is important to note that while using diskline is acceptable as a preliminary diagnostic for line emission, the profile assumes a single emission line is being broadened by Doppler and relativistic effects. This does not account for the blending of emission from other atomic species or energy levels within the energy region of interest for the emission lines (e.g., the blending of Fe XXV and Fe XXVI Kα, O VIII Lyman and , or even emission of Mg blended with Fe L as shown in Ludlam et al. 2018). The full reflection spectrum is a series of atomic features that are superimposed onto a reprocessed continuum that is then broadened. Hence, a complete reflection model should be utilized when performing spectral modeling of reflection.
We opt for a more consistent approach to describe the reflection spectrum present within the system by using a modified version of xillver (García et al., 2013) that accounts for the unusual elemental abundances in the accretion disk, known as xillverCO. This assumes that coronal emission is illuminating the accretion disk as a power-law, , with a high-energy cutoff, Ecutoff. The reflection model also contains emergent thermal emission from the accretion disk itself, , at the location where the emission features arise. The parameter adjusts the strength of the the power-law illuminating the disk relative to blackbody arising from the disk (), . This is an updated version of the model used in Madej et al. (2014). The earlier grid calculations had set the abundances of all elements to be 10 times those from Lodders (2003), except for H and He (which were left at solar abundance), and in the case of C and O to 100 times the abundance from Lodders (2003). Here, the updated table of the xillverCO model has the abundances set as follows: H and He to 0.1 times solar abundance from Lodders (2003), C and O are allowed to vary using the parameter, and all other elements are set to solar abundance. This model also has over more spectral grid points than the initial model used in Madej et al. (2014).
When using xillverCO, we tie the photon index and high-energy cutoff to those in the continuum power-law component for consistency. The reflection component is convolved with relconv (Dauser et al., 2010) to account for broadening due to different effects within the innermost region of the accretion and proximity to the NS. We tie the inner and outer emissivity index in order to create a single illumination profile, . The outer disk radius is set to and the dimensionless spin parameter is fixed at .
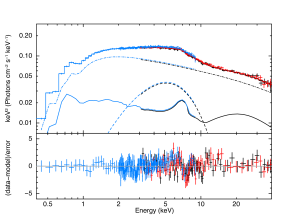
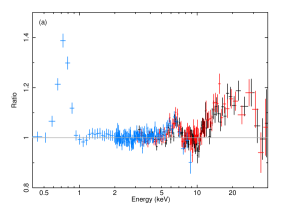
Applying this model to the full keV, we achieve an improved fit of for 8 degrees of freedom (dof) in comparison to the continuum fit. The values for each parameter are shown in Table 1 under X1. While the statistical fit may be worse than the overall model using diskline components, using xillverCO provides more information regarding the emitting material (e.g., abundance of C/O) and correctly accounts for the reprocessed continuum emission. The unfolded model and residuals divided by the error are shown in Figure 5. Note that the discrepancy above 6 keV between NICER and NuSTAR data was also reported in Ludlam et al. (2020) when fitting simultaneous data from both missions. This has to do with the difference in calibration between missions (see Ludlam et al. 2020 for a more detailed discussion).
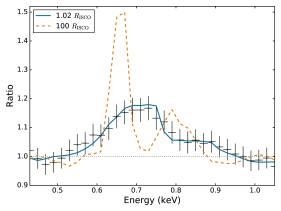
The disk is close to the inner most stable circular orbit ( ) and the inclination is consistent with the values inferred from the diskline modeling (). Figure 6 shows the O VIII line with the blurred reflection model at the best fit inner disk radius overlaid. For reference, we have also plotted the reflection model at a large radius to remove the relativistic effects. The O VIII Lyman and components become evident when relativistic effects are relaxed. The abundance of C/O is about ten times less than the values reported by Madej et al. (2014) when using the previous version of xillverCO, but it is important to note that the abundances in that model were set up ten times larger. Therefore the values obtained for the C/O abundance are consistent. The Frac parameter is in agreement with the value reported in Madej et al. (2014). The thermal emission from the accretion disk is indeed cooler ( keV) than during the 2017 NICER observations at peak intensity ( keV: Ludlam et al. 2019b).
To check if this lower disk temperature is consistent with not being able to detect the accretion disk component in the continuum modeling, we add a diskbb component to the continuum description with keV and the normalization value equivalent to the inner edge of the accretion disk inferred from reflection modeling (norm for , kpc, and a color-correction factor of ). The diskbb component accounts for less than 0.00001% of the photons at 0.5 keV, which is consistent with not being statistically needed during the simple continuum modeling. We can also calculate the expected thermal flux from the xillverCO model itself that would be expected for a distant observer. The expected unabsorbed thermal flux at 7 kpc in the eV band would be ergs cm-2 s-1. For comparison, the unabsorbed continuum flux from the source in the same energy band using ‘energies extend’ command in xspec is ergs cm-2 s-1. This is the same order of magnitude contribution as the check using diskbb and consistent with the disk component not being detected in the overall continuum model.
To check if these line components originate from a concurrent radius in the accretion disk or different radii, we model the spectra by fixing the absorption column and removing the O VIII line by ignoring below 0.9 keV so that the fit will be driven by the Fe line (X2 in Table 1). This provides a position on the inner disk radius of from fitting the reflection emission without the O line. Conversely, we also fit the spectrum from keV but ignore the Fe band from keV to see what constraints are returned from the O line (X3 in Table 1). This gives an inner disk of . The emission radii inferred from each line are consistent within the 90% confidence level, supporting a common emission radius in this system as was suggested from the line profiles plotted in velocity space (see Fig. 5 of Ludlam et al. 2019b).
3.2 Timing
We searched the NICER and NuSTAR data for coherent pulsations that would provide further support for a NS accretor in this system. We utilized the HENDRICS package within the powerful Python X-ray timing software Stingray (Huppenkothen et al., 2019) to search for pulsations. Light curves binned with 0.001 s, 1 s, and 10 s were generated via HENcalibrate and HENlcurve to check for any variations or non-stationary processes within the light curve, but none were found. We proceeded to split the (unbinned) time-series events into chunks of 1/10th the orbital period in order to conduct a search for pulsations. In the case of highly compact binaries, Doppler effects due to orbital motion varies the pulse frequency and spreads power over multiple frequency bins. To mitigate this, a constant acceleration model was used to account for the orbital motion (as outlined in Ransom 2001; Ransom et al. 2002) and searches were conducted over various possible acceleration values. The maximum acceleration value for these searches is given by , where is the acceleration search depth (), is the speed of light, is the pulse frequency, and is the observation duration. We therefore split the time-series in 150 s chunks and then, assuming a bin depth of and maximal pulse frequency of 800 Hz (which would be more rapid than the fastest known milli-second pulsar, PSR J17482446ad: Hessels et al. 2006), we conducted the constant acceleration search. The acceleration searches do not yield any significant candidate for coherent pulsations.
4 Discussion
We present the first NuSTAR observation of the ultra-compact X-ray binary 4U 1543624 that was coordinated with NICER. The source was in a lower flux state than previously observed by NICER during the 2017 enhanced accretion phase. The keV luminosity was ergs s-1, which is 42% of the peak luminosity during the 2017 brightening. At this luminosity, the source has a mass accretion rate of year-1. The source exhibited strong emission features due to the reprocessing of direct continuum emission by the accretion disk. Fitting the reflection spectrum with a model tailored to the atypical abundances found in these systems, xillverCO, we test the emission radii of the O VIII and Fe line components. We find a common emission radius for both line features of , indicating that the disk remains close to the compact object. There are other systems where the accretion disk is consistent with the innermost stable circular orbit at different flux levels and spectral states (e.g., 1RXS J180408.934205: Ludlam et al. 2016; Degenaar et al. 2016), so while 4U 1543624 is not unique in this regard, it is interesting that the disk has not receded after the peak intensity observed in 2017.
Given the amount of evidence supporting a NS accretor in this system (e.g., tentative association with a Type-I X-ray burst: Serino et al. 2018; X-ray–Radio luminosity: Ludlam et al. 2019b), we discuss the results of the spectral modeling in the context of the source being a NS. The measured position of the inner disk radius from xillverCO corresponds to km when assuming a canonical NS mass of 1.4 . The upper limit on the inner disk position ( ) and keV unabsorbed flux of ergs cm-2 s-1 places an upper limit on the dipolar magnetic field of G at the poles. This is within the range estimated from the 2017 enhanced accretion event and further supports a weak B-field in this system. Additionally, this is consistent with the range of magnetic field strengths estimated in Mukherjee et al. (2015) for accreting millisecond X-ray pulsars (AMXPs), though no pulsations have been detected for this system.
Given the lack of pulsations detected and the small inner disk radius inferred from the reflection features, it does not appear that material is being channeled along magnetic field lines onto the surface of the NS, but rather that the accreting material forms a boundary layer region between the disk and NS surface. This would correspond to the single-temperature thermal component in the spectral modeling. The normalization of the blackbody component suggests a compact emission region of 3.4 km at 7 kpc and using a color correction factor of 1.7 (Shimura & Takahara, 1995). However, this conversion assumes spherical emission rather than banded emission from the NS surface. Accounting for a narrow equatorial banded region with a vertical height that is 5%10% of the radius (Popham & Sunyaev, 2001) can easily increase this blackbody emission radius to km. Equation 25 from Popham & Sunyaev (2001) allows us to estimate the size of the boundary layer region normal to the NS surface given the mass accretion rate of year-1 at the time of the observation. This corresponds to a boundary layer with a radial extent of km from the NS surface. This estimate combined with the position of the inner edge of the accretion disk places an upper limit on the radial extent of the NS of km for , if indeed the compact object is a NS in this system.
Koliopanos et al. (2020b) recently looked at the presence of the Fe line feature in 4U 1543624 over a 20 year period from RXTE (1997), Chandra (2000), XMM-Newton (2001), and NICER (2017). The source was in a soft state for all the observations that were analyzed with a keV luminosity (at 7 kpc) ranging from ergs s-1 to ergs s-1. The Fe line was clearly present in the RXTE and NICER data, but not detected in the XMM-Newton or Chandra observations. Given the small range in luminosity and the consistency of spectral parameter values obtained across missions, the disappearance of the Fe line component is attributed to microscopic processes in the disk rather than macroscopic changes (Koliopanos et al., 2020b). Though the observations presented here occurred at a lower keV luminosity of ergs s-1, we see a strong Fe line component. The concurrent strong O line indicates that the oxygen in the disk is not fully ionized but rather only partially ionized, yet we do not see screening effects that are predicted to quench the Fe line as per Koliopanos et al. (2013).
Though the ionization is not explicitly returned as a parameter by xillverCO model, we can estimate the ionization state of the emitting material via (as is defined for all xillver models, García et al. 2013), where is the ionizing flux from keV and is the number density of the material in the disk. The xillverCO model has a hard-coded disk number density of cm-3 (Madej et al., 2014). Using this hard-coded disk number density and that by model definition, then . This is in line with the emitting material being partially ionized rather than fully ionized, but should be considered a lower limit on the ionization state of the material given that illuminating blackbody X-rays from the boundary layer are not included in the model definition of .
Ideally, when modeling the reflection emission in these systems, we would like to be able to account for illumination from the boundary layer or NS surface in addition to the coronal emission. We are currently working to expand the xillverCO model to account for irradiation of the accretion disk by both components, tracking the ionization, and higher disk density. However, these initial results with the current xillverCO model with additional grid points and a more realistic handling of the atypical abundance in these systems than the preliminary grid used in Madej et al. (2014), demonstrates the utility of reflection modeling to determine the emergent radius of multiple reflection features. It is unclear if the O and Fe line arising from a common emission radius within the accretion disk is unique to 4U 1543624 or not, but through observing more UCXBs with NICER and NuSTAR, as well as with future X-ray missions like Athena (Nandra et al., 2013), HEX-P (Harrison et al., 2018), and STROBE-X (Ray et al., 2018), we can ascertain the accretion geometries of these systems.
Acknowledgements: Support for this work was provided by NASA through the NASA Hubble Fellowship grant #HST-HF2-51440.001 awarded by the Space Telescope Science Institute, which is operated by the Association of Universities for Research in Astronomy, Incorporated, under NASA contract NAS5-26555. Additional support was provided from NASA under the NICER Guest Observer grant 80NSSC21K0121. This research has made use of the NuSTAR Data Analysis Software (NuSTARDAS) jointly developed by the ASI Science Data Center (ASDC, Italy) and the California Institute of Technology (Caltech, USA). J.A.G. acknowledges support from NASA grant 80NSSC20K1238 and from the Alexander von Humboldt Foundation. E.M.C. gratefully acknowledges support through NSF CAREER award number AST-1351222. J.A.T. acknowledges partial support from NASA under NICER Guest Observer grant 80NSSC19K1445. D.J.K.B. acknowledges funding from the Royal Society.
References
- Alabarta et al. (2020) Alabarta, K., Altamirano, D., Méndez, M., et al. 2020, MNRAS, 497, 3896
- Arnaud (1996) Arnaud, K. A. 1996, in Astronomical Society of the Pacific Conference Series, Vol. 101, Astronomical Data Analysis Software and Systems V, ed. G. H. Jacoby & J. Barnes, 17
- Bachetti (2015a) Bachetti, M. 2015, ASCL, 1502, 021
- Bachetti et al. (2015b) Bachetti, M., Harrison, F., Cook, R., Tomsick, J., et al. 2015, ApJ, 800, 109
- Bachetti et al. (2020) Bachetti, M., Markwardt, C. B., Grefenstette, B., Gotthelf, E., et al. 2020, ApJ, accepted, arXiv:2009.10347
- Bailer-Jones et al. (2018) Bailer-Jones, C. A. L., Rybizki, J., Fouesneau, M., et al. 2018, AJ, 156, 58
- Ballantyne et al. (2002) Ballantyne D. R., Ross R. R., & Fabian A. C., 2002, MNRAS, 336, 867
- Bogdanov et al. (2019) Bogdanov, S., Guillot, S., Ray, P. S., et al. 2019, ApJL, 887, L25
- Bult et al. (2018) Bult, P., Altamirano, D., Arzoumanian, Z., et al. 2018, ApJL, 860, L9
- Cackett et al. (2008) Cackett, E. M., Miller, J. M., Bhattacharyya, S., et al. 2008, ApJ, 674, 415
- Cackett et al. (2009a) Cackett, E. M., Miller, J. M., Homan, J., et al. 2009a, ApJ, 690, 1847
- Cackett et al. (2009b) Cackett, E. M., Altamirano, D., Patruno, A., et al. 2009b, ApJ, 694, L21
- Cackett et al. (2010) Cackett, E. M., Miller, J. M., Ballantyne, D. R., et al. 2010, ApJ, 720, 205
- Choudhury et al. (2017) Choudhury, K., García, J. A., Steiner, J. F., & Bambi, C. 2017, ApJ, 851, 57
- Coughenour et al. (2018) Coughenour, B. M., Cackett, E. M., Miller, J. M., & Ludlam, R. M. 2018, ApJ, 867, 64
- Dauser et al. (2010) Dauser, T., Wilms, J., Reynolds, C. S., & Brenneman, L. W. 2010, MNRAS, 409, 1534
- Dauser et al. (2014) Dauser, T., García, J., Parker, M. L., Fabian, A. C., & Wilms, J. 2014, MNRAS, 444, L100
- Degenaar et al. (2016) Degenaar, N., Altamirano, D., Parker, M., et al. 2016, MNRAS, 461, 4049
- Degenaar et al. (2017) Degenaar, N., Pinto, C., Miller, J. M., et al. 2017, MNRAS, 464, 398
- Di Salvo et al. (2009) Di Salvo, T., D’Ai, A., Iaria, R., et al. 2009, MNRAS, 398, 2022
- Di Salvo et al. (2015) Di Salvo, T., Iaria, R., Matranga, M., et al. 2015, MNRAS, 449, 2794
- Edwards et al. (2006) Edwards, R. T., Hobbs, G. B., Manchester, R. N., 2006, MNRAS, 372, 1549
- Egron et al. (2013) Egron, E., Di Salvo, T., Motta, S., et al. 2013, A&A, 550, A5
- Fabian et al. (1989) Fabian, A. C., Rees, M. J., Stella, L., & White, N. E. 1989, MNRAS, 238, 729
- Fabian et al. (2000) Fabian A. C., Iwasawa K., Reynolds C. S., & Young A. J., 2000, PASP, 112, 1145
- García et al. (2013) García, J., Dauser, T., Reynolds, C. S., et al. 2013, ApJ, 768, 146
- Gendreau et al. (2012) Gendreau, K. C., Arzoumanian, Z., & Okajima, T. 2012, Proc. SPIE, 8443, 13
- Harrison et al. (2013) Harrison, F. A., Craig, W. W., Christensen, F. E., et al. 2013, ApJ, 770, 103
- Harrison et al. (2018) Harrison, F. A., Madsen, K. K., Grefenstette, B. W., et al. 2018, Proc. SPIE, 106992B. doi:10.1117/12.2313836
- Hasinger & van der Klis (1989) Hasinger, G., & van der Klis, M. 1989, A&A, 225, 79
- HEASARC (2014) HEASARC, N. 2014, HEAsoft: Unified Release of FTOOLS and XANADU, Astrophysics Source Code Library, ascl:1408.004
- Hessels et al. (2006) Hessels, J. W. T., Ransom, S. M., Stairs, I. H., et al. 2006, Sci, 311, 1901. doi:10.1126/science.1123430
- Huppenkothen et al. (2019) Huppenkothen, D., Bachetti, M., Stevens, A. L., Migliari, S., et al. 2019, ApJ, 881, 39
- Juett & Chakrabarty (2003) Juett, A. M., & Chakrabarty, D. 2003, ApJ, 599, 498
- Koliopanos et al. (2013) Koliopanos, F., Golfanov, M., & Bildsten, L. 2013, MNRAS, 432, 1264
- Koliopanos et al. (2020a) Koliopanos, F., Peault, M., Vasilopoulos, G. & Webb, N. 2020a, ArXiv:2001.00716
- Koliopanos et al. (2020b) Koliopanos, F., Vasilopoulos, G., Guillot, S., & Webb, N. 2020b, ArXiv:2001.00713
- Kuulkers et al. (2003) Kuulkers, E., den Hartog, P. R., in’t Zand, J. J. M., et al. 2003, A&A, 399, 663
- Lin et al. (2007) Lin, D., Remillard, R. A., & Homan, J. 2007, ApJ, 667, 1073
- Lodders (2003) Lodders, K. 2003, ApJ, 591, 1220
- Ludlam et al. (2016) Ludlam, R. M., Miller, J. M., Cackett, E. M., et al. 2016, ApJ, 824, 37
- Ludlam et al. (2017a) Ludlam, R. M., Miller, J. M., Bachetti, M., et al. 2017a, ApJ, 836, 140
- Ludlam et al. (2017c) Ludlam, R. M., Miller, J. M., Degenaar, N., et al. 2017c, ApJ, 847, 135
- Ludlam et al. (2017d) Ludlam, R. M., Miller, J. M., Miller-Jones, J., & Reynolds, M. 2017d, ATel, 10690, 1
- Ludlam et al. (2018) Ludlam, R. M., Miller, J. M., Arzoumanian, Z., et al. 2018, ApJ, 858, L5
- Ludlam et al. (2019a) Ludlam, R. M., Miller, J. M., Barret, D., et al. 2019a, ApJ, 873, 99
- Ludlam et al. (2019b) Ludlam, R. M., Shishkovsky, L., Bult, P. M., et al. 2019b, ApJ, 883, 39
- Ludlam et al. (2020) Ludlam, R. M., Cackett, E. M., García, J. A., et al. 2020, ApJ, 895, 45
- Madej & Jonker (2011) Madej, O. K., & Jonker, P. G. 2011, MNRAS, 412, L11
- Madej et al. (2014) Madej, O. K., García, J., Jonker, P. G., et al. 2014, MNRAS, 442, 1157
- Miller (2007) Miller, J. M. 2007, ARA&A, 45, 441
- Miller et al. (2013) Miller, J. M., Parker, M. L., Fuerst, F., et al. 2013, ApJL, 779, L2
- Mukherjee et al. (2015) Mukherjee, D., Bult, P., van der Klis, M., & Bhattacharya, D. 2015, MNRAS, 452, 3994
- Nandra et al. (2013) Nandra, K., Barret, D., Barcons, X., et al. 2013, arXiv:1306.2307
- Nelemans et al. (2003) Nelemans, G., Jonker, P. G., Marsh, T. R., & van der Klis, M. 2003, MNRAS, 348, L7
- Nelemans & Jonker (2010) Nelemans, G., & Jonker, P. G. 2010, New Astronomy Reviews, 54, 87
- Nelson et al. (1986) Nelson, L. A., Rappaport, S. A., & Joss, P. C. 1986, ApJ, 304, 231
- Papitto et al. (2009) Papitto, A., Di Salvo, T., D’Aí, A., et al. 2009, A&A, 493, L39
- Pinto et al. (2013) Pinto, C., Kaastra, J. S., Costantini, E., & de Vries, C. 2013, A&A, 551, 25
- Popham & Sunyaev (2001) Popham, R., & Sunyaev, R. 2001, ApJ, 547, 355
- Ransom (2001) Ransom, S. M., 2001, PhD Thesis, Harvard university
- Ransom et al. (2002) Ransom, S. M., Eikenberry, S. S., Middleditch, J. 2002, AJ, 124, 1788
- Ray et al. (2018) Ray, P. S., Arzoumanian, Z., Brandt, S., et al., 2018, Proc. SPIE, 10699, 19 (arXiv:1807.01179), doi:10.1117/12.2312257
- Sanna et al. (2017) Sanna, A., Papitto, A., Burderi, L., et al. 2017, A&A, 598, A34
- Savonije et al. (1986) Savonije, G. J., de Kool, M., & van den Heuvel, E. P. J. 1986, A&A, 155, 51
- Serino et al. (2018) Serino, M., Hiaka, K., Negoro, H., et al. 2018, ATel, 11302, 1
- Shimura & Takahara (1995) Shimura, T., & Takahara, R. 1995, ApJ, 445, 780
- Strohmayer et al. (2018) Strohmayer, T. E., Arzoumanian, Z., Bogdanov, S., et al. 2018, ApJL, 858, 13
- Tetarenko et al. (2018) Tetarenko, A. J., Bahramian, A., Wijnands, R., et al. 2018, ApJ, 854, 125
- van den Eijnden et al. (2018) van den Eijnden, J., Degenaar, N., Pinto, C., et al. 2018, MNRAS, 475, 2027
- Wang & Chakrabarty (2004) Wang, Z., & Chakrabarty, D. 2004, ApJL, 616, L139
- Wang et al. (2015) Wang, Z., Tziamtzis, A., Kaplan, D. L., & Chakrabarty, D., 2015, PASA, 32, 35
- Wang et al. (2020) Wang, J., Kara, E., Steiner, J. F., et al. 2020, ApJ, 899, 44
- Wilms et al. (2000) Wilms, J., Allen, A., & McCray, R. 2000, ApJ, 542, 914