YouNiverse: Large-Scale Channel and Video Metadata
from English-Speaking YouTube††thanks: This paper has been accepted at the 15th International Conference on Web and Social Media (ICWSM), please cite accordingly.
Abstract
YouTube plays a key role in entertaining and informing people around the globe. However, studying the platform is difficult due to the lack of randomly sampled data and of systematic ways to query the platform’s colossal catalog. In this paper, we present YouNiverse, a large collection of channel and video metadata from English-language YouTube. YouNiverse comprises metadata for over 136k channels and 72.9M videos published between May 2005 and October 2019, as well as channel-level time-series data of weekly subscriber and view counts. Leveraging channel ranks from socialblade.com, an online service that provides information about YouTube, we are able to assess and enhance the representativeness of the sample of channels. Additionally, the dataset also contains a table specifying which videos a set of 449M anonymous users commented on. YouNiverse, publicly available at https://doi.org/10.5281/zenodo.4650046, will empower the community to do research with and about YouTube.
1 Introduction
YouTube plays an important role in society. In 2018, 54% of adult U.S. users said the platform was somewhat or very important for helping them understand what is happening in the world (Pew Research 2018). The role of the platform is also by no means limited to the United States (Statista 2016), attracting content creators that range from prolific music labels in India (Chow 2018) to reactionary influencer–politicians in Brazil (Fisher and Taub 2019).
Given the sheer size of the platform’s catalog and the multimedia nature of its content, systematically finding content on YouTube is hard. Thus, when researchers study the platform, they resort to a variety of heuristics such as using the website’s search functionality (Madathil et al. 2015), snowball sampling recommendations (Horta Ribeiro et al. 2020), and selecting links that are shared on other platforms such as Twitter (Wu, Rizoiu, and Xie 2018). These sampling strategies involve a great amount of extra work and often hinder the generalizability of studies (since the research is carried out with little knowledge about the representativeness of the data analyzed).
While the role of YouTube in our lives is increasing, recent moves by platforms limiting access to data through application programming interfaces (APIs) exacerbate data collection challenges (Bruns 2019). In this context, hoping to foster research about the platform, we present YouNiverse, a large-scale dataset of channel and video metadata from English-language YouTube. To the best of our knowledge, this dataset represents the largest collection of YouTube metadata made publicly available to date.
The dataset is composed of the following parts: (1) channel metadata for over 136k channels, including their numbers of subscribers and videos, as well as creation dates; (2) video metadata for over 72.9M videos, including descriptions, numbers of likes, views, etc; (3) for most of the channels (97%), time series of the numbers of subscribers and views at weekly granularity (2.8 years of data per channel on average); (4) channel-level weights to partially control for sampling biases; (5) a table specifying for each of 449M anonymous users on which videos they commented.
2 Dataset collection and preprocessing
Besides YouTube itself, we collected data from two third-party sources that aggregate YouTube metadata:
-
1.
channelcrawler.com, a website that compiles YouTube channels and makes them searchable through a variety of criteria. 111https://channelcrawler.com/eng/faq The website has existed since mid-2013222https://www.channelcrawler.com/ and uses a snowball sampling approach to collect channels.
-
2.
socialblade.com, a website that tracks social media statistics and analytics. The website has existed since 2008 and originally tracked statistics for digg.com. In 2010, they switched their focus to tracking YouTube statistics333https://socialblade.com/info and have since added other platforms such as Twitch.tv and Instagram. In 2014, the company launched consulting and channel management services to help content creators and companies that want to advertise on them.444https://socialblade.com/blog/nine-years-of-socialblade/
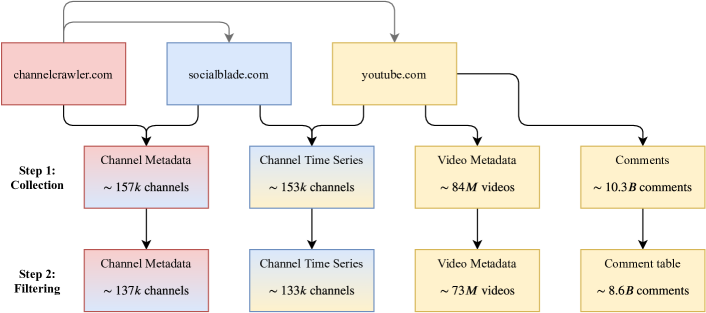
We illustrate the sources and the data collection and processing methodology in Fig. 1.
2.1 Step 1: Collection
Channel metadata. We gathered a pool of 156,978 channels by crawling all English channels with more than 10k subscribers and 10 videos from channelcrawler.com. Data collection took place between 2019-09-12 and 2019-09-17. Language classification was performed by the website using an automatic classifier. Their repository is particularly helpful as channelcrawler.com has been expanding its channel pool since 2013 (when scraping data from YouTube was easier). We crawled additional metadata about subscriber rankings for each of the channels from socialblade.com, which order the channels according to their number of subscribers. For example, if a channel’s subscriber rank equals 10, this means that, among channels tracked by socialblade.com, there are nine channels with a higher number of subscribers. As discussed in Sec. 6, this allows us to assess the representativeness of our channel sample and possibly enhance it by weighting channels when performing data analysis.
Video metadata and comments. For all 156,978 channels obtained from channelcrawler.com, we downloaded the metadata and comments for all their available videos from YouTube. In total, we crawled over 84M videos and 10.3B comments between 2019-10-29 and 2019-11-23.
Channel time-series. Lastly, we compiled time series related to each channel. These come from a mix of YouTube data and time series crawled from socialblade.com. From the former, we derived weekly time series indicating how many videos each channel had posted per week. From the latter, we crawled weekly statistics on the number of viewers and subscribers per channel. This data was available for around 153k channels.
2.2 Step 2: Filtering
Although channelcrawler.com automatically classifies the languages of each channel, we found that many of the channels labeled as English actually posted most of their content in Hindi or Russian. Hence, in order to ensure the consistency of the dataset, we additionally filtered channels using the langdetect library (Shuyo 2010). For each channel, we appended the titles and descriptions for 10 random videos and accepted those predicted to be in English with a probability above 60%. This reduced the channel pool to 136,470 and the video pool to 72,924,794.
For comments, our filtering step was more aggressive. Besides removing all comments from non-English channels, we anonymized users by replacing their names with randomly assigned IDs and strip comments of their textual content. We release only a table that specifies, for each anonymous user, which videos they have commented on. To avoid the possibility of user de-anonymization, we only consider comments on videos with more than 30 commenters (as it would be easier to match an anonymized ID with a specific account if there are few comments).
2.3 Ethics
We collected only data publicly available on the Web and did not (1) interact with online users in any way nor (2) simulate any logged-in activity on YouTube or the other platforms. Data was only collected for channels that had more than 10,000 subscribers and that had previously been collected and made searchable by third parties. The comment table that we release does not allow for easy identification of users unless one crawls a substantial amount of YouTube. YouTube accounts are not typically linked with sensitive information.
3 Dataset description
The YouNiverse dataset consists of four files, each of which we describe below.
Video metadata (df˙videos˙en.jsonl.gz): Metadata associated with the 72,924,794 videos. This includes videos from all 136,470 channels. The metadata include the category of channels (self-defined when they upload a video to YouTube), channel and video IDs, upload date, number of likes, dislikes, and views, duration in seconds, textual description, and self-assigned tags. Importantly, this data is obtained at crawl time (between 2019-10-29 and 2019-11-23), which is also provided as a field.
Channel metadata (df˙channels˙en.tsv.gz): Metadata associated with the 136,470 channels: channel ID, join date, country, number of subscribers, most frequent category, and the channel’s position in socialblade.com’s subscriber ranking. The number of subscribers is provided both as obtained from channelcrawler.com (between 2019-09-12 and 2019-09-17) and as crawled from socialblade.com (2019-09-27). Additionally, we also provide a set of weights (derived from socialblade.com’s subscriber rankings) that can be used to partially correct sample biases in our dataset (see Sec. 6).
Time-series data (df˙timeseries˙en.tsv.gz): Time series of channel activity at weekly granularity. The span of time series varies by channel depending on when socialblade.com started tracking the channel. On average, it contains 2.8 years of data per channel for 133k channels (notice that this means there are roughly 4k channels for which there is no time-series data). Each data point includes the number of views and subscribers obtained in the given week, as well as the number of videos posted by the channel. The number of videos is calculated using the video upload dates in our video metadata, such that videos that were unavailable at crawl time are not accounted for. We provide a brief characterization of the coverage of the time-series data in Sec. 5.
Comment table (youtube˙comments.tsv.gz): A table that specifies for anonymized users on which videos they commented. The table was constructed based on 8.6B comments made by 449M users on 20.5M videos. For each comment, we provide an anonymous user ID, a video ID, the number of replies the comment received, and the number of likes the comment received (again, these were obtained at crawl time, between 2019-09-12 and 2019-09-17).
Raw files. For reproducibility purposes, we also make available the raw files, that is, the data files obtained from the websites before filtering out about 27k channels due to their non-English language. These raw files are made available in the same formats and with the same fields as the previously described files. Scripts to obtain the final files from raw files are also made available.
4 Compliance with FAIR principles
YouNiverse conforms to the FAIR principles. It is findable, as it is made publicly available via Zenodo. It is accessible, as it can be accessed by anyone in the world and as it leverages standard data formats (.tsv, .json, .gz). It is interoperable, as almost every programming language has libraries that allow individuals to work with data in the formats employed. And it is reusable, as it is richly described in this paper.
5 Dataset characterization
Next, we provide a quantitative overview of the dataset, describing the data and assessing its completeness.
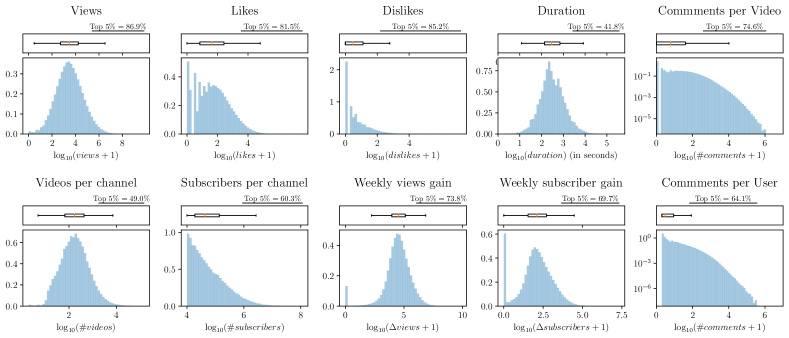
Video and channel statistics. Fig. 2 presents log-transformed distributions associated with different video and channel statistics. In the first four columns of the top row, we show statistics derived from video-level metadata. Using a histogram and a box-plot, we depict the distributions of the number of views, likes, dislikes, and video duration. Note that the video duration distribution is bimodal, with peaks around (about 3 minutes) and (about 10 minutes). The second peak may be explained by a threshold set by YouTube, where content creators could place multiple ads if a video was longer than 10 minutes (Alexander 2020).555YouTube has since changed the threshold to 8 minutes: https://support.google.com/youtube/answer/6175006
In the first four columns of the bottom row, we depict both channel-level statistics (in the first two columns, from channelcrawler.com data), and time series–related statistics (in the last two columns, from socialblade.com data). We note that there is a high number of weeks for which the weekly gain of views and subscribers equals zero (about 2% of view data points and about 8% of subscriber data points). While these may be due to data collection or corrections done by socialblade.com, we find that most of the missing data points for subscriber data are associated with channels with close to 10,000 subscribers. More specifically, around 76% of missing data points belong to channels that had between 9,900 and 10,100 users. We believe this could be indicative of YouTubers artificially boosting their channels towards the 10,000-subscriber mark (and subsequently not gaining any additional subscribers).
Finally, in the last column, we depict the distribution of comments per video and comments per user in the first and second row, respectively. Note that, unlike the other plots, here we also plot the -axis on a logarithmic scale, since the distribution is heavy-tailed.

On top of the box-plot associated with each statistic, we draw a line showing the range of values taken by the top 5% of the data points. Above the line, we also report what percentage of all values belongs to the top 5%. We find that some of the distributions are highly skewed. For example, in accordance with previous work (Rieder, Coromina, and Matamoros-Fernández 2020; Bärtl 2018), the videos with the top 5% most views are responsible for 86.9% of all views and the top 5% most commented videos are responsible for 74.6% of all comments.
| Categories | Views | Videos | Likes | Duration |
|---|---|---|---|---|
| () | () | () | (years) | |
| Autos & Vehic. | 123.1 | 2.3 | 956.3 | 27.0 |
| Comedy | 345.0 | 1.2 | 6134.2 | 18.9 |
| Education | 502.4 | 3.8 | 2881.4 | 117.1 |
| Entertainment | 2287.7 | 12.3 | 20140.6 | 243.1 |
| Film & Anim. | 576.3 | 2.4 | 3737.8 | 47.7 |
| Gaming | 1042.5 | 13.7 | 17351.3 | 623.2 |
| Howto & Style | 420.7 | 4.0 | 5790.8 | 73.6 |
| Music | 2475.0 | 8.3 | 19270.5 | 124.1 |
| News & Pol. | 158.6 | 8.9 | 1892.9 | 144.8 |
| Nonprofits | 18.5 | 0.8 | 242.9 | 29.5 |
| People & Blogs | 617.3 | 6.9 | 9138.1 | 148.8 |
| Pets & Animals | 72.1 | 0.6 | 659.8 | 9.9 |
| Science & Tech. | 175.0 | 2.4 | 1978.4 | 47.5 |
| Sports | 262.0 | 4.4 | 2528.1 | 77.3 |
| Travel & Events | 56.4 | 1.1 | 459.8 | 19.2 |
| Total | 9132.7 | 72.9 | 93162.9 | 1751.8 |
Aggregated video statistics. Table 1 shows the total number of views, videos, and likes, as well as the total duration for each of the 15 categories provided by the platform. We find that Music and Entertainment are the most popular categories (with over 2 trillion views each), while the Gaming category contains the most videos (over 13.7M videos). Gaming videos are also substantially longer than those in other categories: while the 12.3M videos in the Entertainment category amount to around 243 years, the 13.7M Gaming videos amount to more than 600 years.
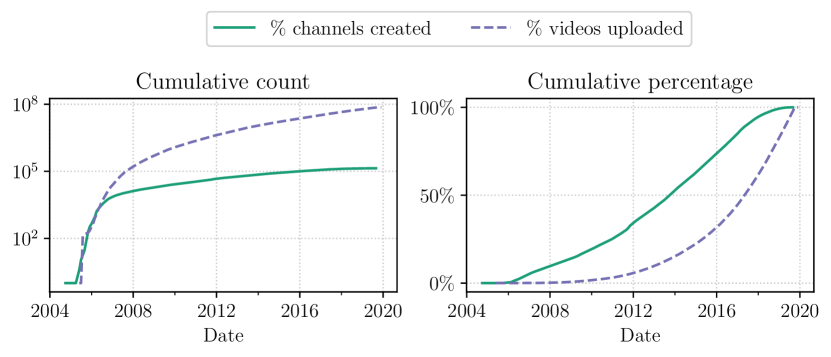
Video and channel creation dates. Fig. 6 shows the creation dates of videos and channels in the dataset in both relative and absolute terms. We find that around 50% of channels in the dataset were created after 2014, and around 50% of videos were created since 2018. The fact that the median creation date for videos is more recent than that for channels could be due to YouTube’s growth over the years. However, it is worth noting that older channels and videos may have been deleted by content creators or taken down following copyright complaints, which could induce a recency bias in our video sample.
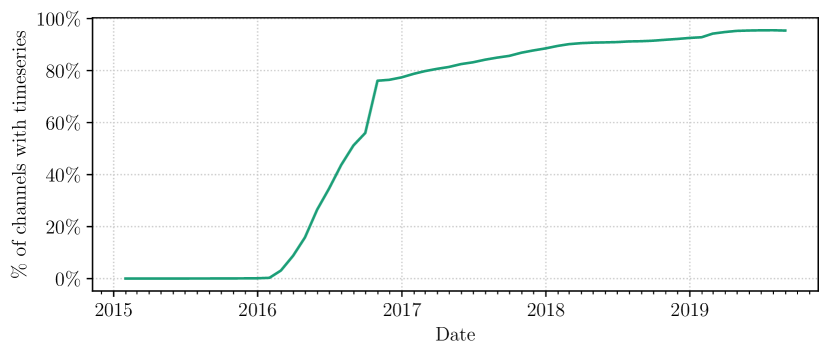
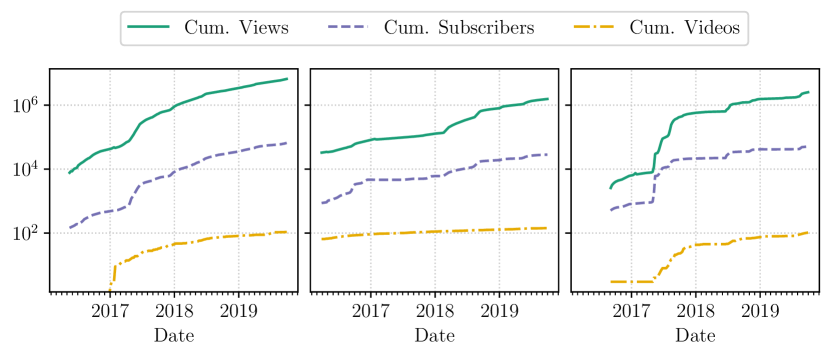
Time-series completeness. Notice that not all channels have the same time series data available. We characterize the completeness of our data over the years in Fig. 6. For each date, shown on the -axis, we plot the percentage of channels that were created by that point for which time-series data is available. Starting in late 2016, most of the channels (about 80%) have time series data available. We additionally illustrate the time-series data made available with three randomly sampled channels in Fig. 6, depicting the cumulative number of views, subscribers, and videos of each channel throughout their full lifespan.
Estimating representativeness via subscriber ranks. In Fig. 6 (left), we explore socialblade.com rankings to get a sense of how representative our data is compared to socialblade.com’s catalog We find that for the top 10k channels, we have around 35% of all channels present in socialblade.com subscriber ranking, and for the top 100k, around 25%. As a sanity check, we additionally study the relationship between the subscriber ranks provided by socialblade.com and the actual number of subscribers of each channel (obtained from channelcrawler.com). Although there are discrepancies between the two, we observe a very high Spearman correlation coefficient ().
6 Correcting for sampling bias
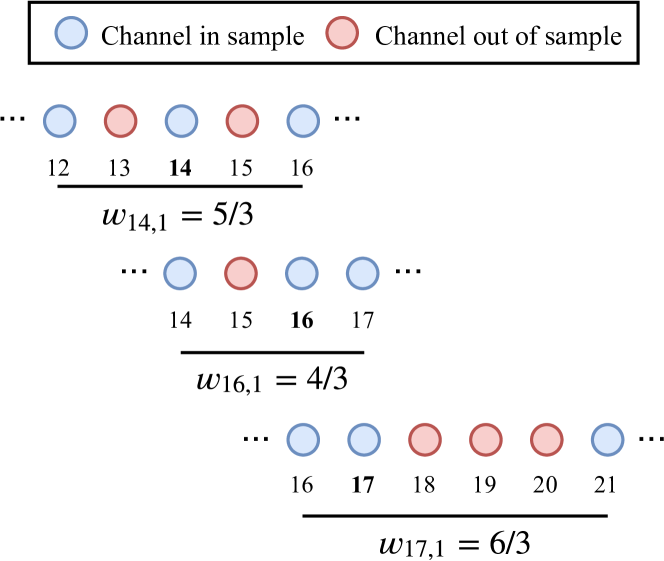
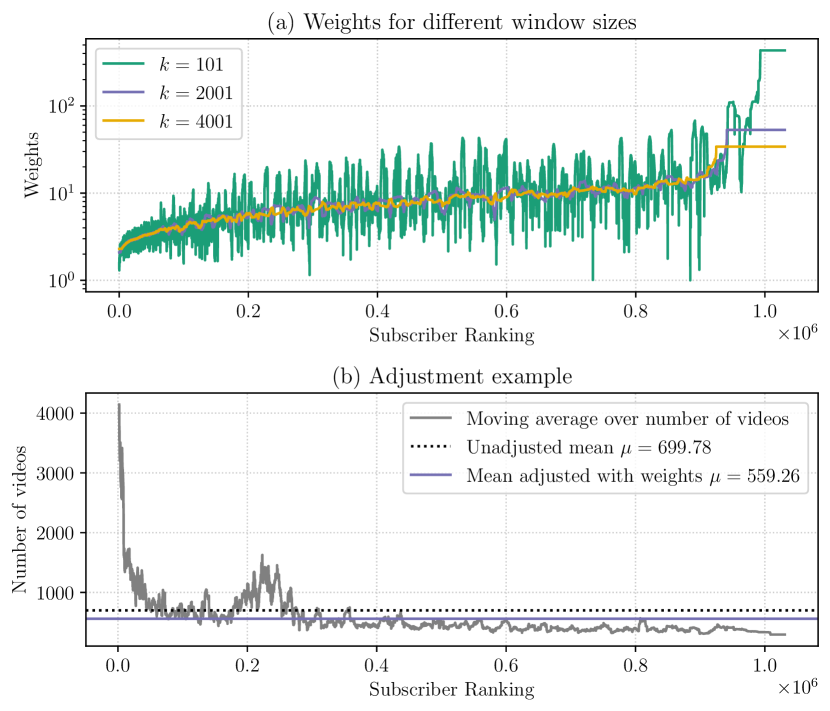
Fig. 6 shows that our sample is biased towards channels higher up in socialblade.com’s ranking with respect to the number of subscribers. In this section, we discuss how we can account for this bias in subsequent analyses by giving more weight to channels from rank ranges that are under-represented in YouNiverse. Note that socialblade.com keeps track of over 23 million YouTube channels666https://socialblade.com/info through the official YouTube Data API, which suggests that their catalog comprises an expressive share of relevant YouTube channels. Unfortunately, we do not know how representative Social Blade’s channel repository is of YouTube, but the authoritativeness with which the YouTube community leverages the platform suggests that it contains a good share of the relevant channels on the platform.
Let be an array that contains socialblade.com ranks for the channels included in the YouNiverse dataset, sorted by subscriber counts in decreasing order; i.e., is the rank (among all of YouTube’s channel, according to socialblade.com) of the channel with -th largest number of subscribers among all channels contained in YouNiverse. For the -th-most followed channel in YouNiverse and an odd-valued window of size , its local sampling probability is
is the percentage of all YouTube channels between ranks and that are contained in YouNiverse. Thus, in order to correct for the sampling bias, we may weight each channel by its inverse local sampling probability, i.e., by
We illustrate this procedure in Fig. 7, but the rationale is simple: while the probability of sampling channels of different ranks is clearly not homogeneous globally, we can estimate the local probabilities and assign to channels weights inverse to those probabilities. In our described method, the size of the window controls in how local a manner we estimate the sampling probability.777Notice that another way to obtain local sampling probabilities would be to use a window of fixed size and slide it through the rankings, calculating the sampling probability at different points. Empirically, we found that the method proposed yielded less noisy results and was capable of better handling the sparse nature of our data at lower ranks. Nevertheless, different weighting schemes could be implemented using the data at hand and the code provided.
Choosing the window size k. An unsolved issue with the proposed method is how to determine the window size . An overly small window size may create noisy weights, while an overly large window size may defeat the purpose of the method altogether (after all, the whole point is to control for local differences in sampling probability). To empirically determine a good window size, we experiment with a wide range of values888 and pick the smallest value for which we find the time series to appear smooth (). We illustrate the weights for three different values of in Fig. 8(a).
Example usage. We provide a concrete example of how to use these weights to obtain more representative statistics. Suppose, for instance, that we want to estimate the average number of videos per channel on YouTube. If we naïvely take the average of our sampled channels, we find that . However, notice that channels in the top ranks have on average many more videos, as shown in Fig. 8(a). Thus, since these channels are much more likely to be in the sample, we are over-estimating the average number of channels. Fortunately, we can correct for our bias by calculating the weighted average, finding . Interestingly, we find little variation from the different window sizes in this estimate, for example, for , we find , and for , we find .
Limitation of the correction scheme. It is important to note that our dataset focuses on English-language YouTube channels, while the subscriber rank is language-agnostic. This implies that we could use this sample to deduce information about YouTube in general. However, when doing so, we are likely to over-emphasize features associated with English-language channels. For example, if we try to estimate the average number of videos per channel in all of YouTube using only our sample, and if it happens that the average number of videos per channel for English channels is smaller than for other languages, we may under-estimate the statistic. Moreover, our weighting methodology presupposes that socialblade.com rankings are complete and correct. Regardless of these limitations, we argue that this method is far superior to what has been done in previous work (which we extensively review in the next section), where the representativeness of the data is often neither considered nor assessed.
7 Related work
We review previous studies using YouTube data with an emphasis on their data collection efforts. We emphasize work that has made data available and that tried to broadly characterize YouTube quantitatively.
Performance-oriented characterizations. Analyses that characterized YouTube were conducted as early as 2007. Back then, the main interest was to characterize content creation and consumption patterns on the platform, often with a focus on enhancing the service quality in terms of performance (Gill et al. 2007, 2008; Zink et al. 2009). In this direction, we highlight the works of Cha et al. (2007) and of Cheng, Dale, and Liu (2008), which characterized YouTube in terms of how much content was produced and consumed, comparing statistics with other video-on-demand systems. In both cases, the authors identified patterns in the creation and consumption of videos that could be leveraged to enhance service quality (which was key to scale video-on-demand systems).
The two papers employ different data collection methodologies. Cha et al. (2007) crawled and analyzed the Entertainment and Science and Technology categories, which had nearly 2 million videos altogether. When data for the paper was collected, YouTube had pages indexing all videos that belonged to a given category, which made data collection viable. Cheng, Dale, and Liu (2008) performed a four-month crawl collecting metadata for over 3 million YouTube videos, using a breadth-first search to find videos via recommendations.
As the platform grew and challenges related to its infrastructure increased, performance-oriented analyses of the website continued to be an active area of research (Finamore et al. 2011; Orsolic et al. 2017; Schwind et al. 2020). Of this subsequent work, of particular relevance is the method developed by Zhou et al. (2011) to obtain an unbiased sample of YouTube videos via random prefixes. They leveraged a feature of YouTube’s search API where one could match the prefix of video IDs by using queries such as watch?v=xyz*. Their analysis estimated that there were around 500 million YouTube videos at the time of the research, and shed light on the bounds on the total storage YouTube must have had, as well as the network capacity needed to deliver videos.
Virality and engagement. Previous research has also leveraged YouTube data to characterize the dynamics of virality, as well as to better understand which factors (content-related or not) make videos popular.
Figueiredo, Benevenuto, and Almeida (2011) characterized the popularity growth of YouTube videos over time. Leveraging a now-deprecated feature that allowed to extract time-series data for statistics such as ratings and views, they collected data associated with over 150k unique videos from YouTube top lists, from the YouTomb project999An initiative to monitor videos removed due to copyright violations., and by using the search functionality with random topics obtained from a lexical ontology. They found popularity growth patterns to be largely dataset-reliant. For example, while videos in the top lists experienced sudden bursts of popularity throughout their lifetime, copyright-protected videos received most of their views earlier in their lifetime.
In a similar vein, Borghol et al. (2011) studied the popularity dynamics of user-generated videos leveraging data obtained by sampling recently uploaded videos and videos obtained through keyword search, finding significant differences from results between the two samples. In subsequent work (Borghol et al. 2012), they crawled a large dataset of 48 sets of identical or nearly identical videos (1,761 videos overall) to study content-agnostic factors that impacted YouTube video popularity. They found a strong “rich-get-richer” behavior, with the total number of previous views being the most important factor for predicting which videos would gain views.
Brodersen, Scellato, and Wattenhofer (2012) investigated the relationship between popularity and locality of online YouTube videos, finding that, despite the global nature of the Web, video consumption is largely constrained by geographic locality. The paper, authored by Google employees, leveraged a random sample of 20M YouTube videos uploaded between September 2010 and August 2011.
Abisheva et al. (2014) analyzed how YouTube videos were shared on Twitter. Their dataset comprised 5.6 million YouTube videos and over 15M video-sharing events from around 87k Twitter users. Among other things, their findings suggest a super-linear relationship between initial video success on Twitter and final success on YouTube.
Wu, Rizoiu, and Xie (2018) studied whether engagement in online videos could be predicted. The authors defined a new metric, relative engagement, which they found to be strongly correlated with recognized notions of quality. To obtain the data for this study, the authors developed a crawler to collect three daily time series related to video attention dynamics: the volume of shares, view counts, and watch time (leveraging the same feature as Figueiredo, Benevenuto, and Almeida (2011)). They analyzed two datasets: a collection of over 5.3M videos published between 2016-07-01 and 2016-08-31 from around 1M channels collected from Twitter’s streaming API, as well as over 96k videos from high-quality sources.
| Kind of data | Dataset size | Sampling strategy | |
|---|---|---|---|
| Cha et al. (2007) | Video metadata | 2M videos | Crawled YouTube categories “Entertainment” and “Science and Technology.” |
| Cheng, Dale, and Liu (2008) |
Video metadata
(repeated crawls) |
3M videos | Multiple BFS crawls done between March 5th and April 16th 2007. |
| Borghol et al. (2011) |
Video metadata
(repeated crawls) |
1.2M videos |
Recently uploaded videos +
keyword search |
| Abisheva et al. (2014) |
Video metadata +
video sharing events |
5.6M videos | Extracted videos from 28h of all public tweets containing URLs |
| Wu, Rizoiu, and Xie (2018) |
Video metadata
popularity time-series |
5.3M videos | Twitter Stream API (between July 1st and August 31st + high quality sources |
| Bärtl (2018) | Video metadata | 8M videos | Keyword search |
| YouNiverse |
Video metadata +
channel metadata + comment data + popularity time-series |
72.9M videos | Crawled websites that publicly display statistics about YouTube. |
Platform features. Several other studies collected YouTube data to understand the impact or usage of specific features, such as comments, ads, or recommendations.
Benevenuto et al. (2009) studied “response videos”, a now-deprecated system where anyone could respond to a YouTube video with a video of their own. The response video would then be shown along with the video to which it responded. Analyzing around 196k YouTube users, 224k videos with responses, and 418k response videos, they found evidence of opportunistic behavior such as self-promotion and spamming.
Zhou, Khemmarat, and Gao (2010) studied the impact of the recommender system on video views, finding that recommendations are the main source of views for the majority of the videos on YouTube. Leveraging the same deprecated feature as Figueiredo, Benevenuto, and Almeida (2011), they analyzed around 700k videos collected (1) via the API or (2) by capturing and parsing video requests at a university network gateway.
Siersdorfer et al. (2010) presented an in-depth study of commenting on YouTube. They analyzed the relationship between comments and views and trained a classifier capable of predicting the community’s acceptance of a given comment. The authors analyze 6M comments on 67k YouTube videos obtained through the website’s search functionality.
Arantes, Figueiredo, and Almeida (2016) leveraged logs of HTTP requests from a large university to study ad consumption on YouTube. Their dataset comprised around 99k video-ad exhibitions, 5.6k unique ads, and 58k unique videos. Their analysis found the fraction of ad exhibitions that are streamed until completion to be high (around 29%) relative to traditional online advertisements (where click-through rates are below 0.01%).
Further characterizations. Recent studies have again tried to provide overall characterizations of YouTube. We highlight two recent papers in this direction. Bärtl (2018) obtained a sample of around 8M videos belonging to approximately 20k channels by randomly searching for keywords. Rieder, Coromina, and Matamoros-Fernández (2020) performed what is perhaps the largest study characterizing YouTube, analyzing the static metadata of over 36M channels and 700M videos. Both these studies provide high-level statistical analysis, finding, for example, that the vast majority of views goes to a small minority of channels.
Other studies. So far, we have discussed attempts to broadly characterize YouTube, its features, and the dynamics of virality on the platform. These are the most relevant previous works to contextualize the contribution provided by our dataset. However, it is worth stressing that previous work has also explored problematic phenomena on the platform (Sureka et al. 2010; Ottoni et al. 2018; Papadamou et al. 2019), the quality of health-related information available (Madathil et al. 2015; Freeman and Chapman 2007), and the utility of the platform for online learning (Alwehaibi 2015; Clifton and Mann 2011).
8 Discussion and conclusion
In this last section, we briefly compare our dataset with existing large-scale YouTube-related data that is publicly available. Additionally, we discuss some research directions where we think YouNiverse may be particularly useful.
Relationship between this and prior work. We briefly discuss the relationship between YouNiverse and the data previously used by researchers to better understand YouTube. We focus our comparison with other datasets that were made publicly available in previous work and depicted in Table 2. Compared to previously available data, YouNiverse is
-
•
Channel-driven. For each channel, we collect metadata and popularity time series along with all available videos. Other recent datasets focus largely on obtaining representative video samples (Bärtl 2018; Wu, Rizoiu, and Xie 2018). Our approach is particularly interesting to study the process of content creation on YouTube (since our dataset has, for each channel, all videos available at crawl time).
-
•
Large. YouNiverse is an order of magnitude larger than other recent publicly available YouTube dataset (Bärtl 2018). This is particularly important due to the heterogeneity of YouTube.
-
•
Recent. Unlike most previous comprehensive large-scale datasets(Cha et al. 2007; Cheng, Dale, and Liu 2008), YouNiverse contains data from more recent years, where problematic phenomena on YouTube, such as troublesome children content (Papadamou et al. 2019) or fringe content (Horta Ribeiro et al. 2020), moved into the spotlight. We hope that YouNiverse enables the better contextualization of such content in the broader YouTube context.
Possible use cases. We believe this dataset can foster research on YouTube in a variety of ways. First, it may help researchers to quantitatively study the evolution of content creation on the platform throughout the years. As “digital influencers” become increasingly important in the public debate, studying the way in which channels grow and professionalize is key to better understand our current information ecosystem. Second, the dataset may help to study the evolution of content itself on YouTube. Since its creation, the “rules of the game” have changed several times on the platform, and video metadata enables us to capture many of these transformations (e.g., what are the ideal video lengths throughout the years?). Lastly, YouNiverse can be a useful resource for a variety of more focused studies. As discussed, previous work often resorts to simple heuristics to find channels or videos related to specific topics (e.g., cancer), and YouNiverse may act as a comprehensive starting point.
Acknowledgements
We would like to thank Richard Patel for useful insights in all things related to crawling. We also like to thank Timoté Vaucher and Jonathan Kaeser for making an awesome data visualization of YouNiverse. Our work is supported in part by Swiss National Science Foundation grant 200021_185043 and by gifts from Google, Facebook, and Microsoft.
References
- Abisheva et al. (2014) Abisheva, A.; Garimella, V. R. K.; Garcia, D.; and Weber, I. 2014. Who watches (and shares) what on Youtube? and when? Using twitter to understand Youtube viewership. In WSDM.
- Alexander (2020) Alexander, J. 2020. YouTube is finally letting creators know exactly how they’re making money on YouTube. https://www.theverge.com/2020/7/10/21319938/youtube-monetization-metric-ad-revenue-cpm-rpm-alternative-memberships-premium. Accessed: 2021-04-06.
- Alwehaibi (2015) Alwehaibi, H. O. 2015. The Impact Of Using YouTube In EFL Classroom On Enhancing EFL Students’ Content Learning. In Journal of College Teaching & Learning (TLC).
- Arantes, Figueiredo, and Almeida (2016) Arantes, M.; Figueiredo, F.; and Almeida, J. M. 2016. Understanding video-ad consumption on YouTube: a measurement study on user behavior, popularity, and content properties. In ACM WebScience.
- Benevenuto et al. (2009) Benevenuto, F.; Rodrigues, T.; Almeida, V.; Almeida, J.; and Ross, K. 2009. Video interactions in online video social networks. In ACM Transactions on Multimedia Computing, Communications, and Applications.
- Borghol et al. (2012) Borghol, Y.; Ardon, S.; Carlsson, N.; Eager, D.; and Mahanti, A. 2012. The untold story of the clones: content-agnostic factors that impact YouTube video popularity. In KDD.
- Borghol et al. (2011) Borghol, Y.; Mitra, S.; Ardon, S.; Carlsson, N.; Eager, D.; and Mahanti, A. 2011. Characterizing and modelling popularity of user-generated videos. In Performance Evaluation.
- Brodersen, Scellato, and Wattenhofer (2012) Brodersen, A.; Scellato, S.; and Wattenhofer, M. 2012. YouTube around the world: geographic popularity of videos. In WWW.
- Bruns (2019) Bruns, A. 2019. After the ‘APIcalypse’: social media platforms and their fight against critical scholarly research. In Information, Communication & Society.
- Bärtl (2018) Bärtl, M. 2018. YouTube channels, uploads and views: A statistical analysis of the past 10 years. In Convergence.
- Cha et al. (2007) Cha, M.; Kwak, H.; Rodriguez, P.; Ahn, Y.-Y.; and Moon, S. 2007. I tube, you tube, everybody tubes: analyzing the world’s largest user generated content video system. In IMC.
- Cheng, Dale, and Liu (2008) Cheng, X.; Dale, C.; and Liu, J. 2008. Statistics and Social Network of YouTube Videos. In International Workshop on Quality of Service.
- Chow (2018) Chow, A. R. 2018. How a Bollywood Music Label Conquered YouTube. https://www.nytimes.com/2018/11/14/world/asia/t-series-youtube-india.html. Accessed: 2021-04-06.
- Clifton and Mann (2011) Clifton, A.; and Mann, C. 2011. Can YouTube enhance student nurse learning? In Nurse Education Today.
- Figueiredo, Benevenuto, and Almeida (2011) Figueiredo, F.; Benevenuto, F.; and Almeida, J. M. 2011. The Tube over Time: Characterizing Popularity Growth of Youtube Videos. In WSDM.
- Finamore et al. (2011) Finamore, A.; Mellia, M.; Munafò, M. M.; Torres, R.; and Rao, S. G. 2011. YouTube everywhere: impact of device and infrastructure synergies on user experience. In IMC.
- Fisher and Taub (2019) Fisher, M.; and Taub, A. 2019. How YouTube Radicalized Brazil. https://www.nytimes.com/2019/08/11/world/americas/youtube-brazil.html. Accessed: 2021-04-06.
- Freeman and Chapman (2007) Freeman, B.; and Chapman, S. 2007. Is ”YouTube” telling or selling you something? Tobacco content on the YouTube video-sharing website. In Tobacco Control.
- Gill et al. (2007) Gill, P.; Arlitt, M.; Li, Z.; and Mahanti, A. 2007. Youtube traffic characterization: a view from the edge. In IMC.
- Gill et al. (2008) Gill, P.; Arlitt, M.; Li, Z.; and Mahanti, A. 2008. Characterizing user sessions on YouTube. In Multimedia Computing and Networking 2008.
- Horta Ribeiro et al. (2020) Horta Ribeiro, M.; Ottoni, R.; West, R.; Almeida, V. A. F.; and Meira, W. 2020. Auditing Radicalization Pathways on YouTube. In FAT*.
- Madathil et al. (2015) Madathil, K. C.; Rivera-Rodriguez, A. J.; Greenstein, J. S.; and Gramopadhye, A. K. 2015. Healthcare information on YouTube: A systematic review. In Health Informatics Journal.
- Orsolic et al. (2017) Orsolic, I.; Pevec, D.; Suznjevic, M.; and Skorin-Kapov, L. 2017. A machine learning approach to classifying YouTube QoE based on encrypted network traffic. In Multimedia Tools and Applications.
- Ottoni et al. (2018) Ottoni, R.; Cunha, E.; Magno, G.; Bernardina, P.; Meira Jr., W.; and Almeida, V. 2018. Analyzing Right-wing YouTube Channels: Hate, Violence and Discrimination. In ACM WebScience.
- Papadamou et al. (2019) Papadamou, K.; Papasavva, A.; Zannettou, S.; Blackburn, J.; Kourtellis, N.; Leontiadis, I.; Stringhini, G.; and Sirivianos, M. 2019. Disturbed YouTube for Kids: Characterizing and Detecting Inappropriate Videos Targeting Young Children. In arXiv:1901.07046 [cs].
- Pew Research (2018) Pew Research. 2018. Many Turn to YouTube for Children’s Content, News, How-To Lessons. Pew Research Center: Internet, Science & Tech. Accessed: 2021-04-06.
- Rieder, Coromina, and Matamoros-Fernández (2020) Rieder, B.; Coromina, O.; and Matamoros-Fernández, A. 2020. Mapping YouTube. In First Monday.
- Schwind et al. (2020) Schwind, A.; Midoglu, C.; Alay, O.; Griwodz, C.; and Wamser, F. 2020. Dissecting the performance of YouTube video streaming in mobile networks. In International Journal of Network Management.
- Shuyo (2010) Shuyo, N. 2010. Language detection library for java. https://code.google.com/archive/p/language-detection. Accessed: 2021-04-06.
- Siersdorfer et al. (2010) Siersdorfer, S.; Chelaru, S.; Nejdl, W.; and San Pedro, J. 2010. How useful are your comments? analyzing and predicting youtube comments and comment ratings. In WWW.
- Statista (2016) Statista. 2016. Leading YouTube Markets 2016. https://bit.ly/34NAOV1. Accessed: 2021-04-06.
- Sureka et al. (2010) Sureka, A.; Kumaraguru, P.; Goyal, A.; and Chhabra, S. 2010. Mining YouTube to Discover Extremist Videos, Users and Hidden Communities. In Information Retrieval Technology.
- Wu, Rizoiu, and Xie (2018) Wu, S.; Rizoiu, M.-A.; and Xie, L. 2018. Beyond Views: Measuring and Predicting Engagement in Online Videos. In ICWSM.
- Zhou et al. (2011) Zhou, J.; Li, Y.; Adhikari, V. K.; and Zhang, Z.-L. 2011. Counting YouTube videos via random prefix sampling. In IMC.
- Zhou, Khemmarat, and Gao (2010) Zhou, R.; Khemmarat, S.; and Gao, L. 2010. The impact of YouTube recommendation system on video views. In IMC.
- Zink et al. (2009) Zink, M.; Suh, K.; Gu, Y.; and Kurose, J. 2009. Characteristics of YouTube network traffic at a campus network - Measurements, models, and implications. In The International Journal of Computer and Telecommunications Networking.