Imaging neutron capture cross sections: i-TED proof-of-concept and future prospects based on Machine-Learning techniques
Abstract
i-TED is an innovative detection system which exploits Compton imaging techniques to achieve a superior signal-to-background ratio in () cross-section measurements using time-of-flight technique. This work presents the first experimental validation of the i-TED apparatus for high-resolution time-of-flight experiments and demonstrates for the first time the concept proposed for background rejection. To this aim both 197Au() and 56Fe() reactions were measured at CERN n_TOF using an i-TED demonstrator based on only three position-sensitive detectors. Two C6D6 detectors were also used to benchmark the performance of i-TED. The i-TED prototype built for this study shows a factor of 3 higher detection sensitivity than state-of-the-art C6D6 detectors in the 10 keV neutron energy range of astrophysical interest. This paper explores also the perspectives of further enhancement in performance attainable with the final i-TED array consisting of twenty position-sensitive detectors and new analysis methodologies based on Machine-Learning techniques.
pacs:
PACS-keydiscribing text of that key and PACS-keydiscribing text of that key1 Introduction
Neutron capture cross-section measurements are fundamental in the study of astrophysical phenomena, such as the slow neutron capture (s-) process of nucleosynthesis operating in red-giant stars Kappeler11 . This mechanism is responsible for the formation of about half of the elements heavier than iron. One prominent method to measure neutron-capture cross sections over the full stellar range of interest is the time-of-flight (TOF) technique. Here, a sample of the isotope of interest is placed in a pulsed neutron beam and the prompt capture -rays originating from the sample are registered by means of radiation detectors. Low-efficiency C6D6 liquid scintillators are widely used to register the capture -rays Macklin67 ; Plag03 . This type of detector, in conjunction with the pulse-height weighting technique (PHWT) Macklin67 allows one to virtually mimic an ideal Total Energy Detector (TED) Moxon63 . A TED is a detection system whose -ray detection efficiency becomes proportional to the registered -ray energy. Thanks to detailed Monte Carlo (MC) calculations Tain02 ; Tain04 ; Borella07 , the working principle of the PHWT is so well under control nowadays that, generally, C6D6 detectors are also directly referred to as TEDs. Additionally, liquid scintillators are particularly convenient for neutron capture TOF experiments because of their of their fast time-response and low intrinsic sensitivity to scattered neutrons Plag03 ; L6D6 ; Balibrea21 .
However, an important limitation in many TOF experiments arises from neutrons that are scattered in the sample and get subsequently captured (prompt or after some thermalization) in the surroundings of the C6D6 detectors (see for instance Refs. Domingo06 ; Tagliente13 ). According to MC studies Zugec14 , in the 1 keV to 100 keV neutron energy interval of relevance for astrophysics, this type of background may represent one of the dominant contributions in many neutron capture experiments.
In order to improve this situation a total-energy detector with -ray imaging capability, so-called i-TED, has been recently proposed Domingo16 . i-TED exploits Compton imaging techniques with the aim of obtaining information about the incoming direction of the detected -rays. This additional information can help to reject events which do not arise directly from the capture sample under study, thereby enhancing the signal-to-background ratio (SBR). This novel detection system is under development at IFIC, a first demonstrator has been assembled and its main components and techniques have been characterized and optimized in the recent years Olleros18 ; Babiano19 ; Babiano20 ; Balibrea20 .
This article discusses the status and future perspectives for background rejection with i-TED and it consists of two parts. In the first part (Sec. 2) we present a proof-of-concept (PoC) experiment carried out with an i-TED demonstrator. The latter is intended to technically validate its overall performance for TOF experiments and to demonstrate the background rejection concept. The PoC experiment was carried out at CERN n_TOF, which is introduced in Sec. 2.1. The i-TED demonstrator assembled for the present study consisted of 3 position-sensitive detectors (PSDs) as described in Sec. 2.2. Its energy- and spatial-sensitivities are discussed in Sec. 2.3. The experimental validation of the i-TED prototype for TOF experiments is reported in Sec. 2.4. Finally, Sec. 2.5 describes the background rejection results and the limitations in detection efficiency when the so-called analytical approach Domingo16 is applied. Empowered by these results, we have investigated alternative analysis methodologies, which allow one to preserve a better detection efficiency. These are reported in the second part of this article, which starts in Sec. 3. First, we discuss the prospects for the final detector Domingo16 consisting of 20 PSDs arranged in four Compton modules. The perspectives for background rejection using Compton imaging techniques with the final 4 i-TED detector are presented in Sec. 3.1. Finally, Sec. 3.2 explores the new analysis methodology for the background rejection with i-TED, which is based on Machine-Learning techniques and allows one to remarkably improve its performance, when compared to the analytical method previously used. A summary and outlook of our results is provided in Sec. 4.
2 i-TED Proof-of-concept
The objective of the PoC experiments was twofold. On one hand, the aim was to investigate the suitability of i-TED for neutron-capture TOF experiments, whereby a sufficiently fast detector response is mandatory to preserve the TOF or neutron-energy resolution. On the other hand, the goal was to demonstrate the applicability of the proposed -ray imaging technique to suppress spatially localized -ray background sources.
Hence, two different neutron capture experiments were carried out at the CERN n_TOF facility Gunsing17 . This installation and the conventional experimental set-up of two C6D6 detectors L6D6 are described in Sec. 2.1. The C6D6 detectors represent the state-of-the-art in this field and thus they are systematically used as reference for comparison purposes along this work. The i-TED demonstrator is described in Sec.2.2. The reconstruction of the -ray energy depositions and interaction points in i-TED were based on our previous works Olleros18 ; Babiano19 ; Babiano20 and for more details the reader is referred to those articles and references therein. Sec. 2.3 shows the performance of the imager in terms of energy and Compton imaging capability by the time of the experiment. The first PoC experiment is described in Sec. 2.4. Here, a simultaneous measurement of the 197Au() reaction both with C6D6 detectors and with i-TED was performed in order to demonstrate the suitability of i-TED for the neutron-TOF technique in a high-resolution facility. The second PoC experiment is described in Sec. 2.5 and consisted of a simultaneous measurement of the 56Fe() reaction with both C6D6 detectors and i-TED. The objective here was to demonstrate the background rejection capability of i-TED and to quantify the attainable enhancement in terms of signal-to-background ratio (SBR). This reaction was chosen because it shows an isolated resonance at keV, which is well suited to evaluate SBRs in the several 10 keV of neutron energy, which is the range of interest for astrophysics.
2.1 The n_TOF facility and experimental set-up
The CERN proton synchrotron (PS) delivers a pulsed beam of protons (71012 protons/pulse, 7 ns rms) with a typical duty cycle of 0.25 Hz and an energy of 20 GeV. This beam impinges onto a lead target generating about 300 neutrons per incident proton by means of spallation reactions. Most unwanted charged particles generated from the spallation reactions are removed from the beam by using magnets and collimators, which do not prevent a significant portion of -rays to remain in it. After crossing a water moderator which surrounds the spallation source, a white neutron spectrum becomes available for experiments at two experimental areas EAR1 and EAR2, which are located at 185 m and 20 m distance from the source. In both cases, the energy of the incoming neutrons is determined by measuring their TOF. The different distances of the flight paths yield a better energy resolution at EAR1, and a higher neutron flux at EAR2. A prompt and intense flash of -rays arrives at both experimental areas few nanoseconds after being created by the proton beam impact. This flare is employed for the conventional C6D6 detectors to time-stamp the beginning (t∘) of the neutron bunch.
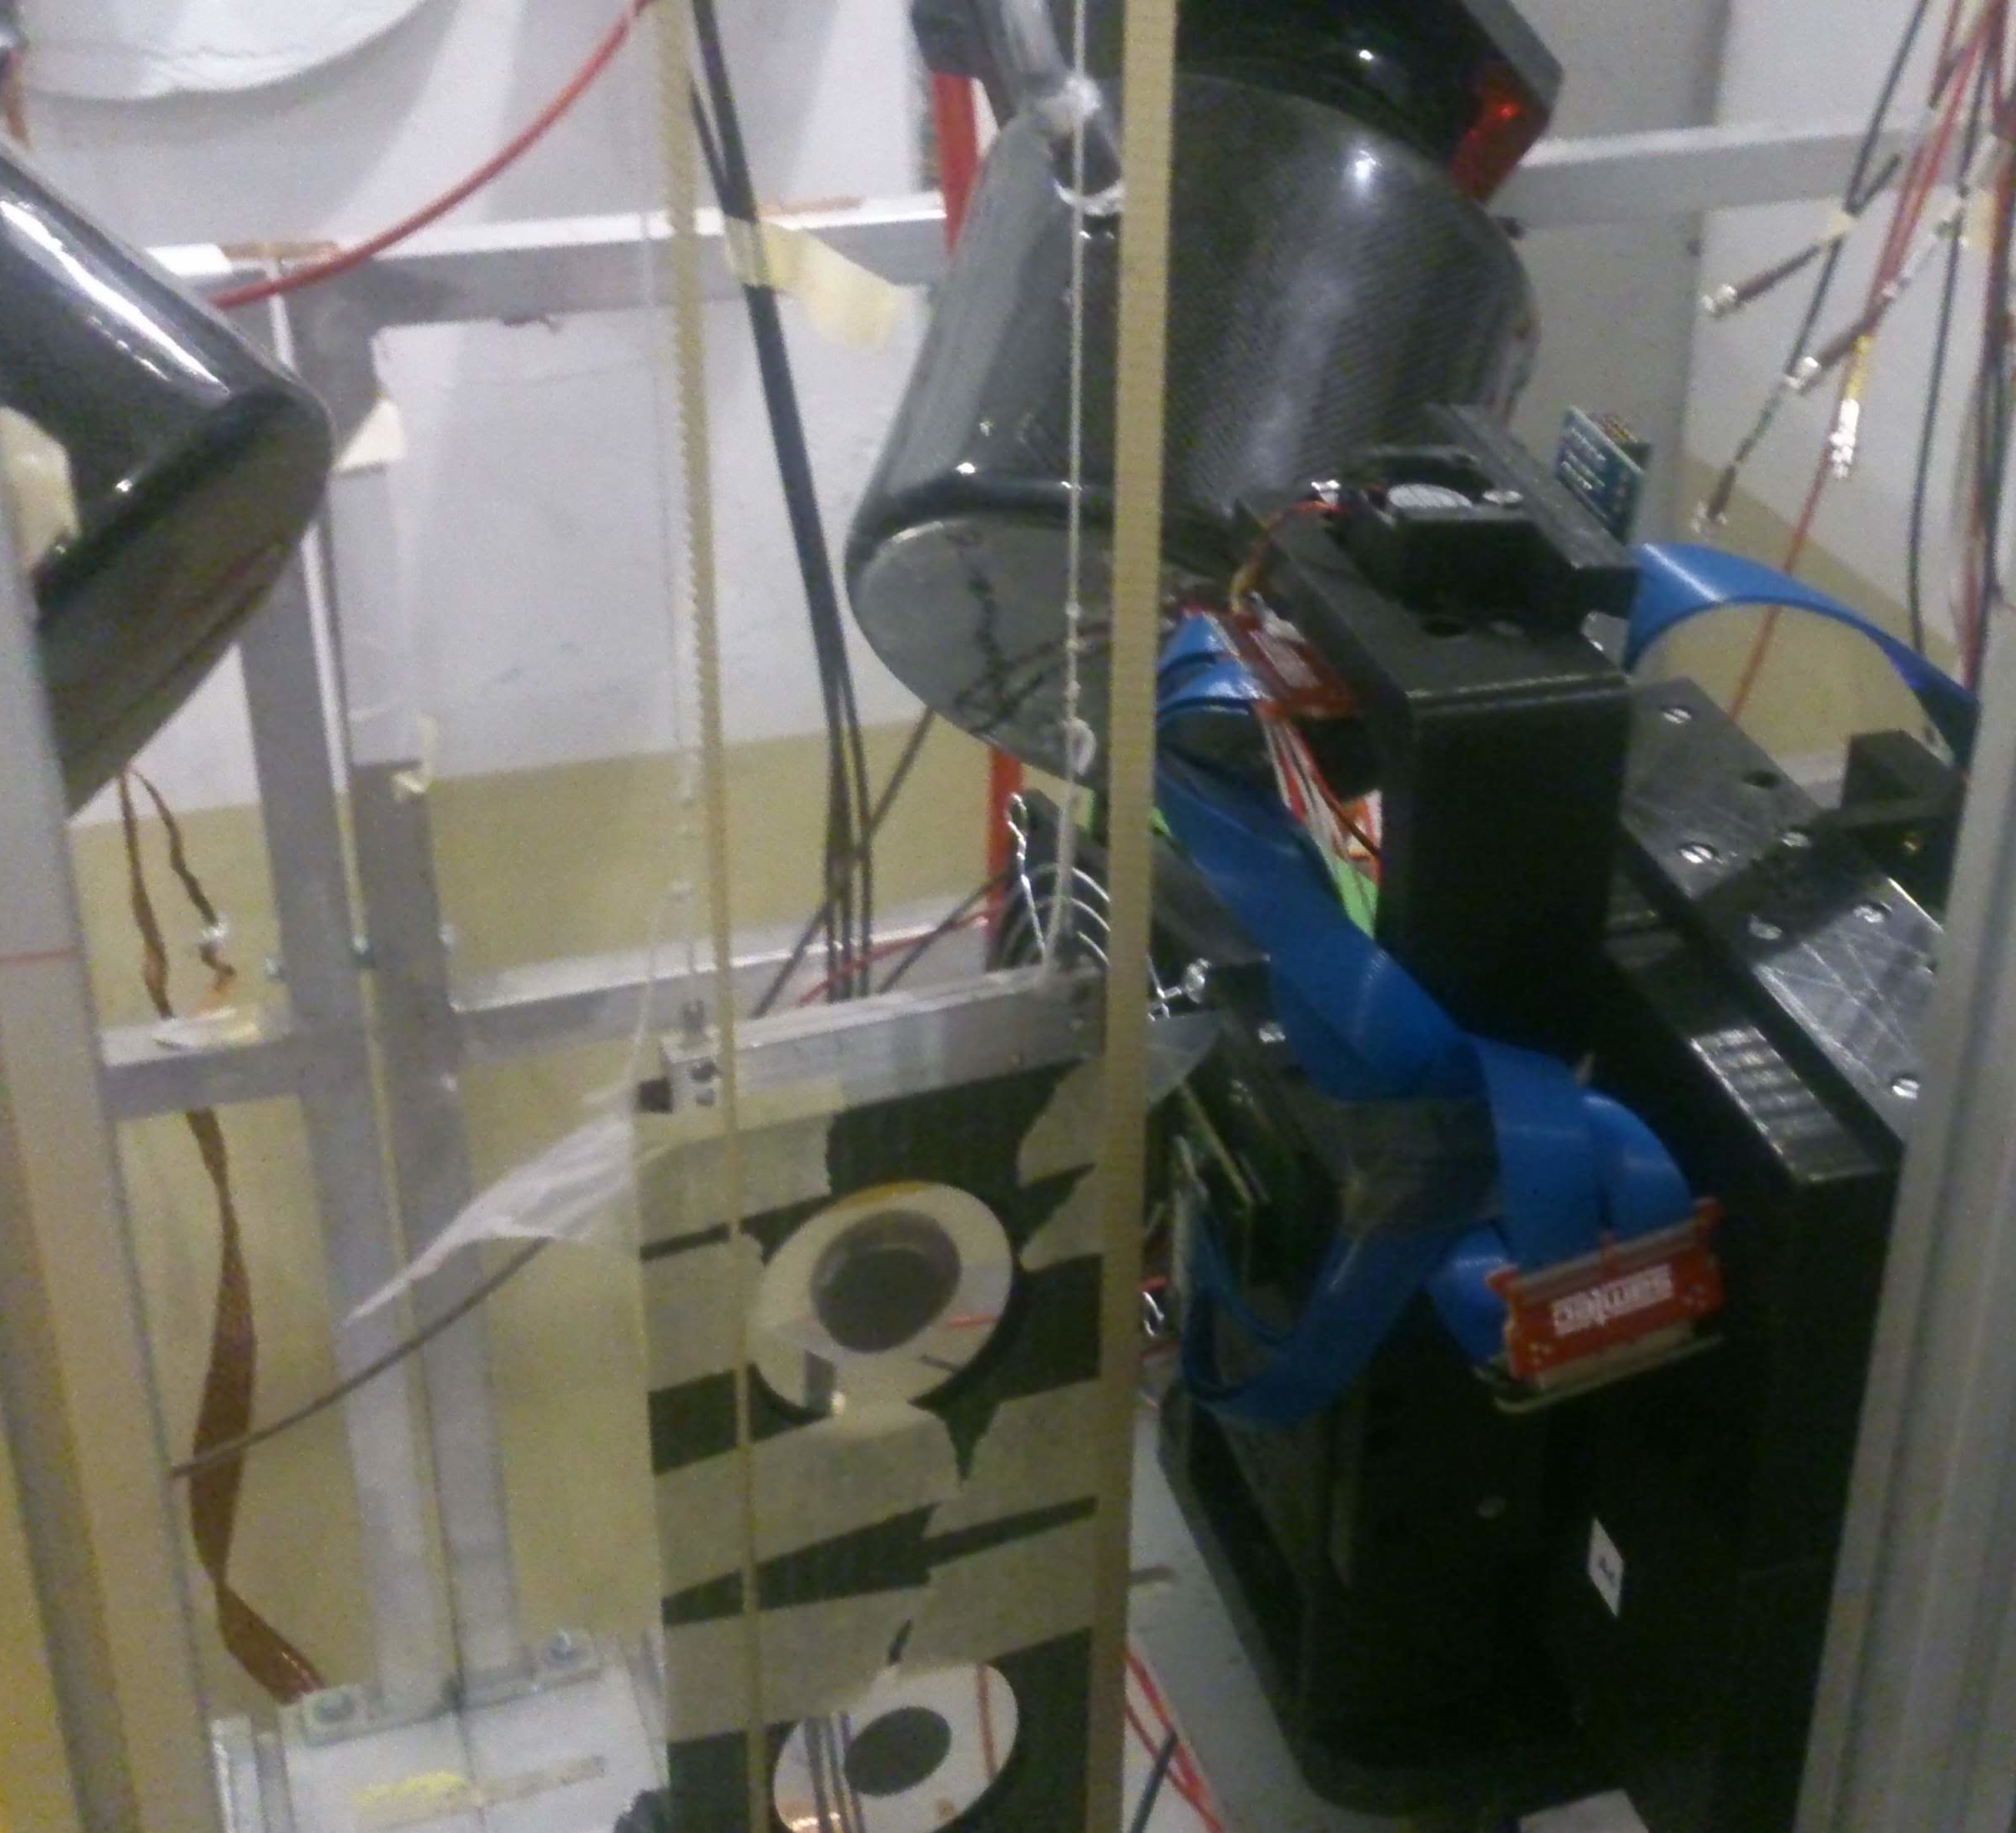
The PoC experiments were carried out at the EAR1 experimental area of n_TOF. A picture of the measuring setup is shown in Fig. 1. The i-TED demonstrator was placed at an angle of about 90∘ with respect to the beam and at 63 mm distance from the center of the capture sample under study. The distance between the two position-sensitive detection planes of i-TED, so called Scatter and Absorber (see Sec. 2.2) was kept fixed to 10 mm, which represented a reasonable trade-off between angular resolution and efficiency Babiano20 . In the neighbourhood of i-TED two C-fibre C6D6 detectors were set up. The latter detectors are used as reference along the whole work.
The two C6D6 detectors were oriented at an angle of 60∘ with the vertical, with their faces pointing to the capture sample placed at a distance of 10 cm. The two photomultiplier tube (PMT) readout channels are connected to the n_TOF digital acquisition system Abbondanno05 . The acquisition system of i-TED is described in Sec. 2.2. The i-TED data was stored in a PC located in the experimental hall and remotely controlled via Ethernet connection.
Samples of gold and iron were placed in the neutron beam for these PoC measurements. Gold is commonly employed as reference for the normalization of the capture yield via the Saturated Resonance method Macklin67 . However, in this case gold was only measured to validate the TOF calibration and response of both detection systems. On the other hand, the iron sample (enriched 99% in 56Fe) was measured because of its high scattering-to-capture ratio and its isolated resonance at 1.15 keV. This resonance, in conjunction with the background ”plateau” at 10 keV mostly induced by scattered neutrons was used to systematically evaluate the SBR for both detection systems and under different analysis conditions. Finally, to monitor the detector gain along the experiment a 152Eu radioactive source with 14 kBq of activity was placed at about 10 cm distance from i-TED.
2.2 The i-TED demonstrator
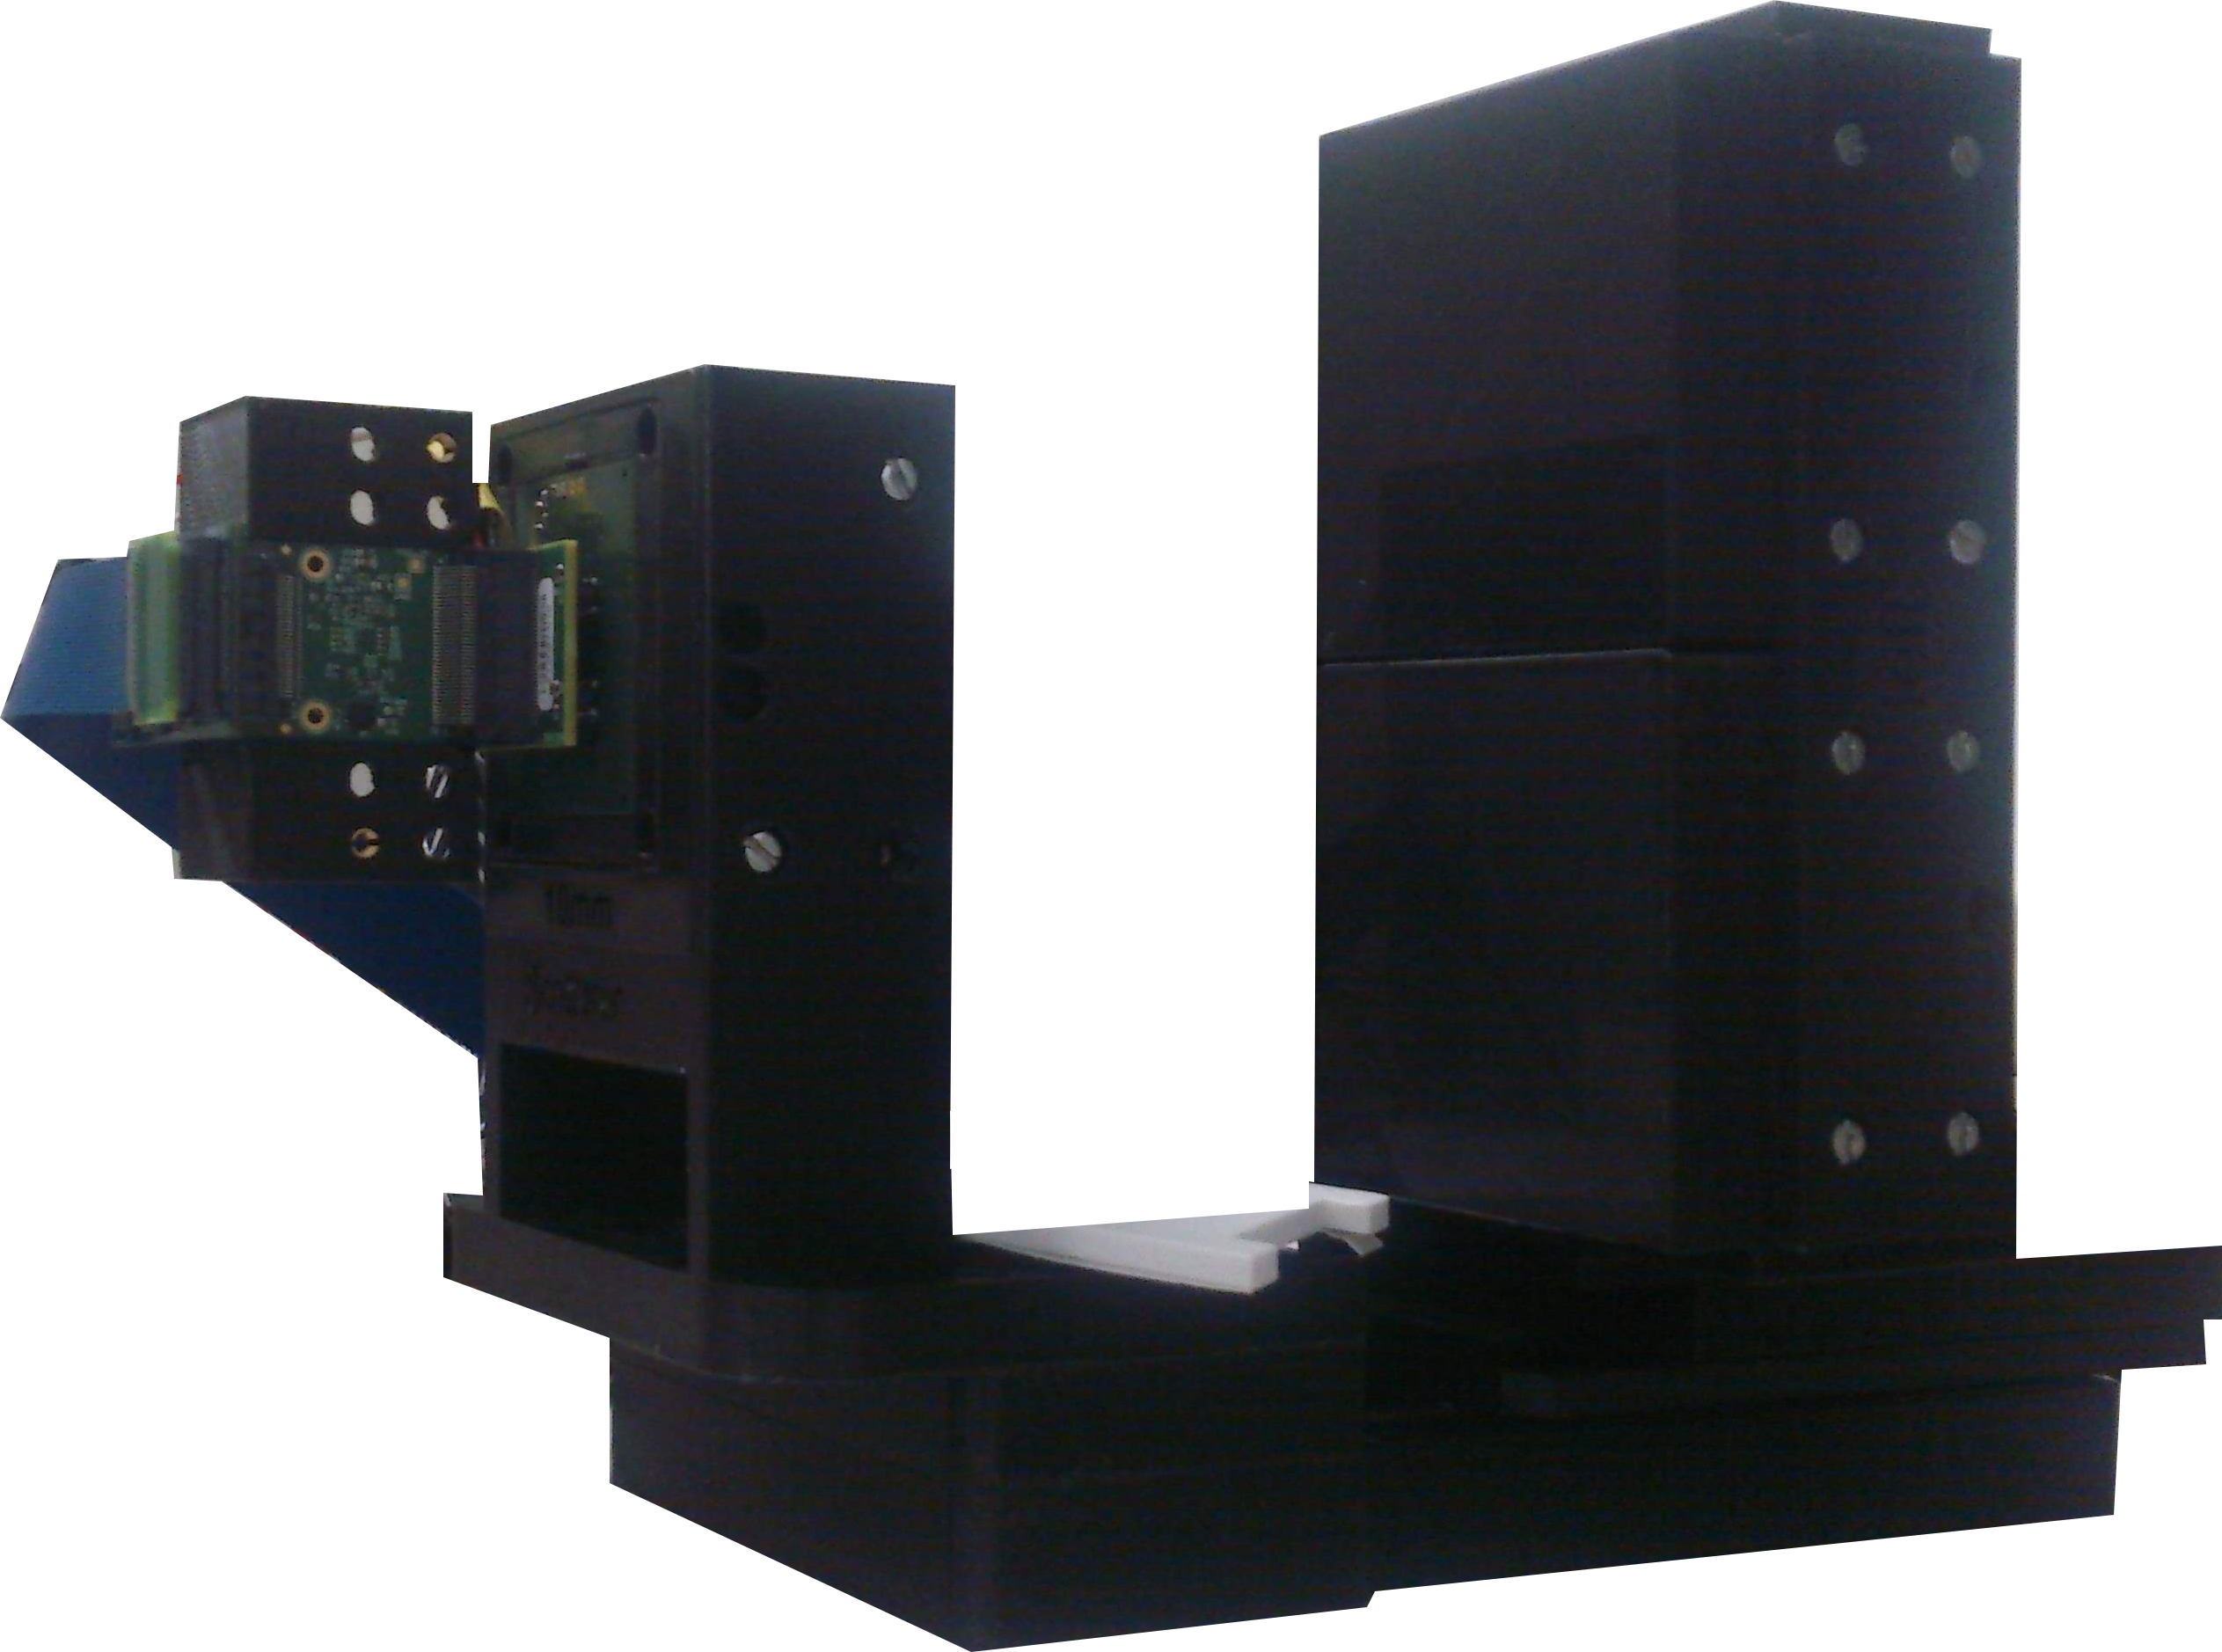
The imager used in this work consists of a Compton camera that utilizes three PSDs distributed in two parallel detection planes, Scatter (S) and Absorber (A), as shown in Fig. 2. Each PSD contains a LaCl3(Ce) monolithic crystal with a square-cuboid shape and a base surface of 5050 mm2. The LaCl3(Ce) is hygroscopic and thus it is encapsulated in an aluminum housing. The crystal base is coupled to a 2 mm thick quartz window, which is optically coupled to a silicon photomultiplier (SiPM) from SensL (ArayJ-60035-64P-PCB). The photosensor features 88 pixels over a surface of 5050 mm2. A 10 mm thick crystal is used for the PSD in the S-plane. Two 25 mm thick crystals are utilized for the two PSDs placed in a vertical stack for the A-plane (see Fig. 2). In total, 192 SiPM channels are biased and readout by means of front-end and processing PETsys TOFPET2 ASIC electronics PETsys16 . In order to minimize gain shifts due to changes in the temperature of the experimental hall, every ASIC is thermally coupled to a refrigeration system composed by Peltier cells (see Ref. Babiano20 for further details).
On the other hand, since i-TED is intended for TOF measurements, the PETsys readout electronics had to be supplemented with an external module especially designed to provide an accurate time-stamp for the time reference of each neutron bunch. The latter device was based on the high-speed differential-line driver SN65LVDS9638 from Texas Instruments lvds . This chip features a propagation delay of only 1.7 ns and delivers a Low-Voltage Differential Signal (LVDS) with output rise- and fall-times of only 500 ps. Using this trigger-module, every TTL-trigger signal from the CERN PS was converted into a LVDS-pulse, which was fed into the PETsys communication mezzanine via two available ports. The time of arrival of the latter trigger signal was digitized with a 20 ps time resolution using one of the 192 ASIC channels. In practice we experienced jitter issues with this external trigger module, which apparently were due to an insufficient electromagnetic compatibility in the harsh conditions of the n_TOF environment. These difficulties could be circumvented to a large extent by means of a software-correction algorithm applied to the raw data. However, this correction is rather complex and not fully accurate and thus, for future experiments a hardware solution will be pursued.
2.3 Energy calibration and -ray imaging validation
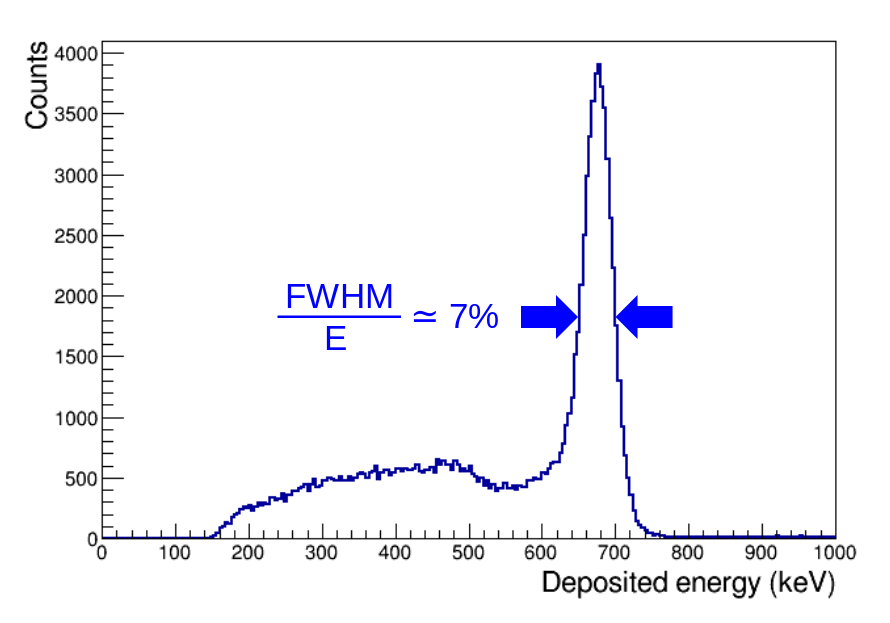
Deposited-energy values and 3D-localization of the -ray hit position in each LaCl3(Ce) crystal are necessary to apply the Compton scattering law on an event-by-event basis and obtain information on the incoming -ray direction Babiano20 . An energy calibration of every i-TED PSD in the energy range between 122 keV and 1408 keV was performed by placing a 152Eu radioactive source near both detection planes. Additionally, the intrinsic -activity of the LaCl3(Ce) crystals Hartwell05 was used to extend the calibration range up to 2.8 MeV. Finally, capture -ray spectra of the gold and iron samples measured at CERN n_TOF with i-TED were used, in combination with a MC-simulation of the capture-cascades, to extend the calibration range up to 7.6 MeV. A combination of two second-degree polynomials were used as energy-calibration function for each PSD in the full energy range of the neutron-capture experiments. Energy resolutions between 7% and 5% fwhm at 662 keV have been found for the crystals placed in the S- and in the A-layers, respectively. Operating both layers in time-coincidence mode, a resolution of 7% fwhm was found at 662 keV for the add-back spectrum of a 137Cs source (see Fig. 3).
The 2D-coordinates of the -ray interaction in the transverse -plane of each PSD in i-TED is accomplished by fitting, on an event-by-event basis, the analytical expression of Li et al. Li10 to the SiPM charge response of each PSD, in a similar fashion as reported in Ref. Babiano19 . After a careful characterization of all detectors, spatial resolutions of around 1 mm fwhm were found for the 10 mm and 25 mm thick crystals at 511 keV. The third space coordinate or depth-of-interaction in each crystal is obtained from an empirical parameterization of the SiPM response at half-height of the maximumBabiano20 . In the latter case, typical uncertainties between 4 mm and 5 mm are obtained. The field of view in which the PSD has a linear response was determined to be of around 20 cm2, which corresponds to about 80% of the crystal base surface Babiano19 .
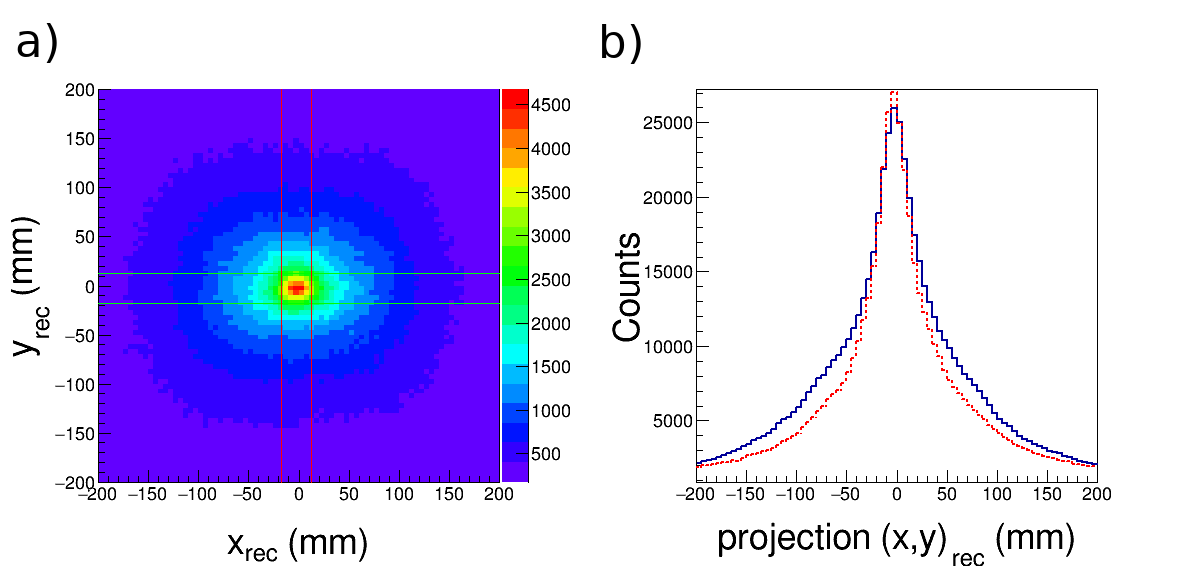

A simple back-projection Compton image reconstruction algorithm was implemented Babiano20 in order to validate the overall -ray imaging performance of i-TED, which relies on accurate energy- and spatial-calibrations. Thus, a point-like 137Cs source with an activity of 325 kBq was attached to one of the capture samples at a distance of 63 mm in front of the S-detector of i-TED (see also Fig. 1). In a second measurement, the 137Cs-source was lifted 10 cm up in the vertical direction. The resulting Compton images are shown in Fig. 4, thereby illustrating the angular sensitivity of the i-TED imager and the proper implementation of calibrations and spatial reference systems.
2.4 TOF performance of i-TED
In order to benchmark the TOF performance of i-TED with respect to C6D6 detectors we measured a sample of 197Au with a diameter of 20 mm, a thickness of 0.125 mm and a mass of 645 mg. Gold has the advantage that its resolved-resonance region is well known Massimi10 ; Carlson18 and the narrow resonances can be used to calibrate the TOF- relation and to verify the TOF-resolution.
The TOF is measured as the time-interval between the origin of the neutron bunch, , and the time of detection of any of the capture -rays arising from the sample under study, . With C6D6 detectors the -value can be reliably determined from the signature of the so-called -flash, which are the prompt -rays produced in the spallation reactions Abbondanno05 . In the latter case, , where takes into account the time needed for the light to travel along the flight-path of 185 m. On the other hand, the acquisition system of i-TED does not allow to digitize the whole movie of pulses and thus an alternative methodology had to be implemented. The latter consisted of time-stamping in the i-TED acquisition system the rising-edge of the external PS-trigger TTL-signal, , as described in Sec. 2.2. Thus, for i-TED the TOF of each registered -ray was determined as . The offset-correction is due to the time-difference between the PS-trigger signal and the actual time of the proton-beam on the target. The value of was determined empirically from the wealth of resonances in the 197Au+n spectrum measured with i-TED during these experiments. After these considerations, the TOF is converted into neutron energy by means of the relationship
| (1) |
where =185 m is the flight-path and =72.29 with expressed in s.
Fig. 5 shows the neutron-energy spectra obtained with both i-TED and one C6D6 detector for the 197Au(n,) reaction. All spectra correspond to the same measuring time and thus, differences in counting statistics are only due to the different intrinsic and geometric efficiencies of each detector. This is an important aspect, for it shows that the S-detector of i-TED placed at 63 mm distance from the sample has an efficiency which is about 75% of the one obtained with a C6D6 detector placed at 10 cm. Thus, if one assumes similar sample-detector distances in future experiments, the four S-detectors of the 4 i-TED array will provide an efficiency comparable to that of the conventional C6D6-array of four detectors. On the other hand, the efficiency of the i-TED prototype in coincidence mode is only 6.3% of the one shown by the one C6D6 detector. Considering that the demonstrator had only two A-detectors instead of the four intended for the final 4 i-TED detector, according to our MC calculations for the latter (Sec. 3.1.1) one can expect an efficiency between 10% and 14% of that obtained with four C6D6 detectors. The precise value depends on the separation between the S- and A-layers. The additional interplay between detection efficiency and background rejection will be discussed in detail in Sec. 2.5 and in the second part of this paper.
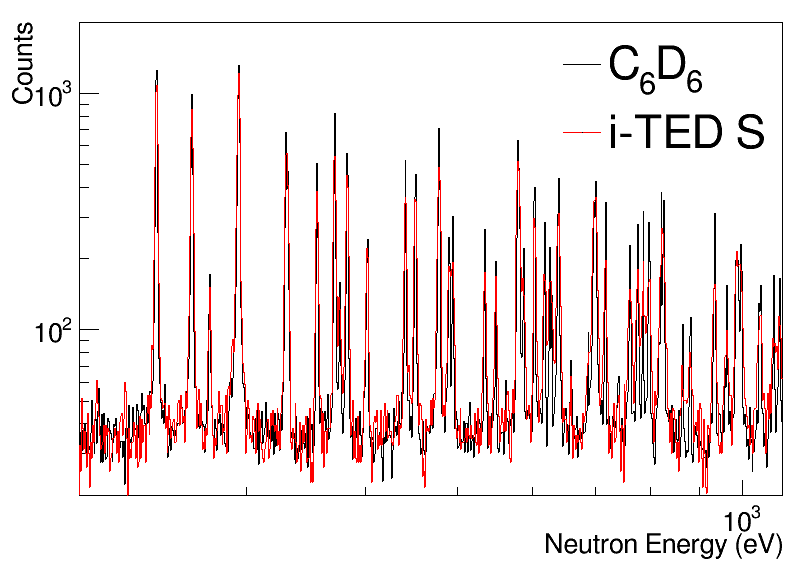
In terms of TOF resolution, a good agreement was found for both detection systems. This result was not evident beforehand, given the large differences in terms of scintillation materials (LaCl3(Ce) and C6D6), readout photo-sensors (SiPM and PMT) and processing electronics (ASICs and digitizer modules). Fig. 6 shows an expansion of the energy range between 200 eV and 1 keV using 1000 bins per decade. A more detailed assessment of the possible detector contribution to the TOF-resolution would require much higher counting statistics and additional measurements of very narrow resonances over the entire neutron-energy range, preferably employing samples of 32S and 238U. This aspect will be investigated in more detail in future measurements with the entire 4 i-TED detection system, where the efficiency will be sufficient to perform such studies in a reasonable time span.
At this stage, one can conclude that the fast time-response of the PSDs embedded in i-TED and its readout electronics is satisfactory for performing high-resolution TOF experiments with pulsed neutron beams.
2.5 Background rejection with i-TED
The second PoC experiment was the measurement of the 56Fe() reaction at n_TOF EAR1 using the same experimental set-up. This isotope was chosen because it has a narrow and isolated resonance at =1.15 keV and elastic scattering overcomes capture in the 1 keV-to-10 keV energy range by about four orders of magnitude. The large fraction of neutrons scattered in the iron sample are expected to undergo further scattering in the surroundings of the set-up until they are eventually captured, mainly in the concrete walls of the experimental hall Zugec14 , emitting further background radiation. Thus, this experimental situation is particularly well suited to explore the capability of i-TED to reject background -ray events that do not emerge from the capture sample.
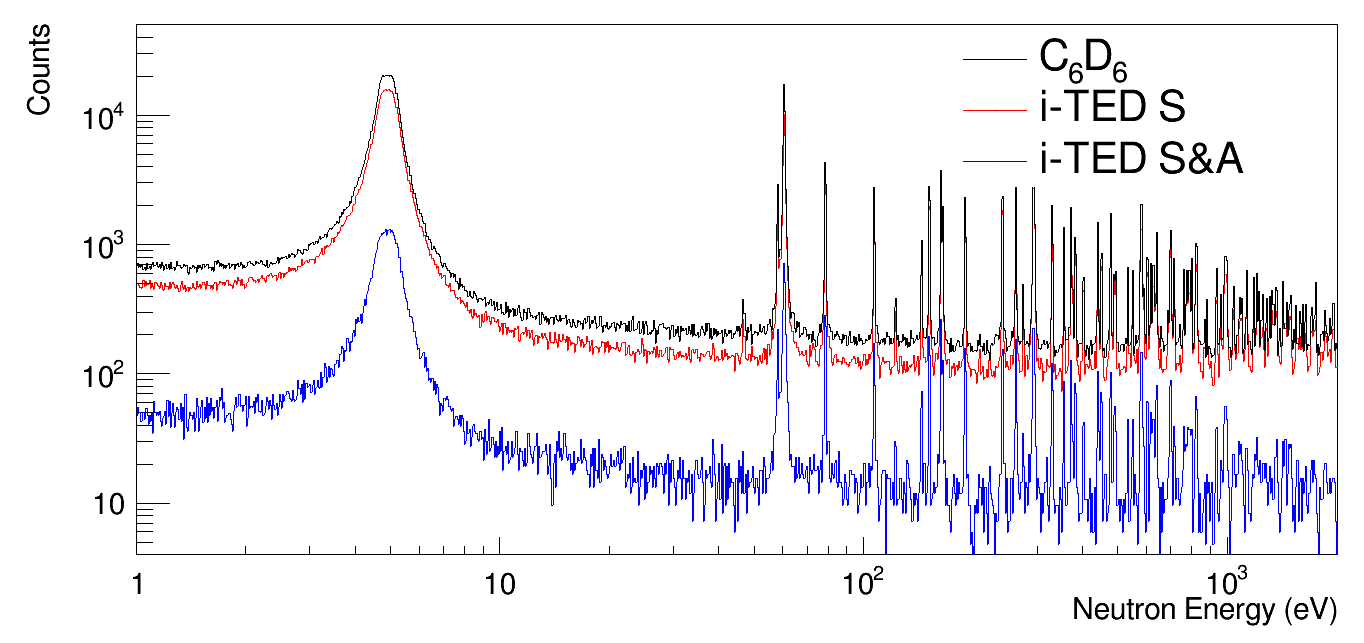
The iron sample was isotopically enriched in 56Fe (99.93%), it had a diameter of 20 mm and a mass of 2.1035 g. Fig. 7 shows the neutron energy spectra of counting statistics obtained with C6D6 detectors and with i-TED using only 40 bins per decade. In this case a rather coarse binning had to be used due to the low cross section and the limited counting statistics. For the sake of comparison all spectra have been normalized to the peak of the 1.15 keV resonance in 56Fe+n.
Let us discuss first the singles-response measured with the S-detector of i-TED shown with a solid-blue line in Fig. 7. In the neutron energy range from 1 eV up to 1 keV the background level of the S-detector is a factor of 2 higher than that of the C6D6 detectors. This is mainly due to the intrinsic -activity of the LaCl3(Ce) crystals, which dominates the counting rate in the low neutron-energy range. In addition, a few neutron-capture resonances can be observed that do not belong to 56Fe+n. The peak at 5.2 eV corresponds to a small silver impurity (100 ppm) in the iron sample and thus it appears with a similar strength in all spectra. Other prominent contaminants are found mainly in the i-TED data at 72.3 eV, 398 eV and 617 eV. These peaks correspond to the largest neutron capture resonances in 139La and 35Cl, and are the signature of the intrinsic neutron sensitivity of the LaCl3(Ce) crystals in this neutron-energy range. Although inconvenient, this type of background cannot be considered yet an important limitation. On one side, for the final system we plan to use a neutron absorber made from polyethylene enriched in 6Li, which is expected to reduce significantly this effect, while becoming essentially transparent to -rays Domingo16 . Similar techniques are conventionally used for the same purpose in experiments using the Total-Absorption Calorimeter (TAC) Guerrero2008 . On the other hand, the higher neutron-energy range is more relevant for -process studies dealing with hydrogen burning (=8keV) and He-shell flashes (=23keV) in AGB-stars, and during core He-burning (=26 keV) and shell C-burning (=90 keV) in massive stars. Experimentally, it is indeed in the 1 keV to 100 keV neutron energy range where there is a need for enhancing the SBR with respect to C6D6 detectors, owing to the 1/-dependence of the cross sections and the increasing contribution of the scattered-neutrons induced -ray background Zugec14 . At the 1.15 keV resonance, the SBR is comparable for both C6D6-detectors and the S-detector of i-TED. This indicates a similar performance between them at this neutron energy. The background level remains more or less constant and similar for both C6D6 detectors and the S-detector of i-TED up to the second strong resonance of 56Fe+n at 30 keV. Let us compare now the i-TED spectrum in time-coincidence between the S- and any of the A-detectors (S&A), with respect to C6D6 detectors. The first remarkable aspect is that below 1 keV the background of i-TED increases with respect to the C6D6 detectors and with respect to the S-detector. To a large extent this is due to the bottom LaCl3(Ce) A-crystal, which had an anomalously large contribution of -emitting isotopes, yielding an -counting rate of 1 kHz in that particular crystal. This activity is about one order of magnitude higher than average values. However, by the time of the experiment there was no other crystal available for replacement and efficiency was a major concern.
Beyond neutron energies of 1 keV one can observe a decreasing trend in the background of i-TED when compared to the C6D6 detectors and to the S-detector. This effect was expected from the MC-simulations (see Sec. 3.1.2) and it is ascribed to the configuration of i-TED and the nature of the background in this energy range Zugec14 . Firstly, neutron-induced background -rays coming from the walls into the detector have a rather soft energy spectrum compared to capture -rays and thus, the thick A layer of i-TED acts as a veto for a large portion of these events. Moreover, in-beam -rays scattered in the iron sample, featuring a soft spectrum dominated by 478 keV -rays LoMeo15 , are also significantly shielded by the S crystal. In contrast to i-TED, the C6D6 detectors register in equal measure all the -rays which reach their sensitive detection volume, regardless of their origin and hardness. As a consequence of the different sensitivity to the background components, the level of the background in i-TED operating in time-coincidence mode is reduced by a factor of 2.5 at 10 keV with respect to C6D6 detectors. Consequently, the SBR of the 56Fe(n,) resonances have been noticeably improved from a factor of 2 in both resonances for the C6D6, to a factor of 3 and 2.6 for i-TED in both resonances, respectively.
Finally, in order to explore the reduction in background by means of the -ray imaging capability of i-TED a discrimination analysis was made on an event-by-event basis. To apply the Compton technique only events in time coincidence between the S- and A-layers were considered (solid red curve in Fig. 7). The main drawback of the time-coincidence mode is the drastic reduction of the detection efficiency. As a consequence of the small number of A-detectors used in the present prototype, only 8% of the events detected in the S-detector make a further interaction in the A layer. In future measurements, the use of four PSDs in the A- plane will help to enhance the efficiency in coincidence mode significantly (see Ref. Babiano20 ).
Deposited energies and respectively in the S- and A-layers, and 3D-localization of the -ray hits, and in both layers were reconstructed as described in Sec. 2.3 for each coincidence event. From these quantities, one can trace a cone, whose central axis corresponds to the straight line defined by the -ray interaction position in the two layers and its aperture is obtained from the measured energies using the Compton scattering formula (see Fig. 8).
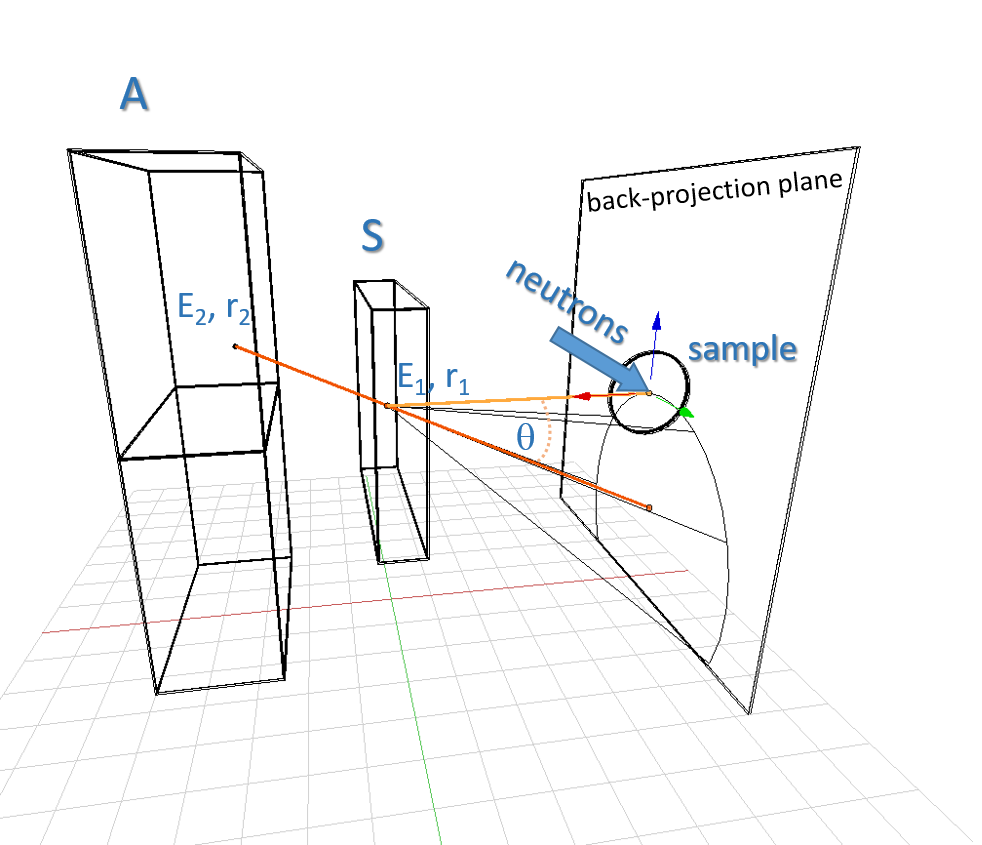
The aim of this procedure is to filter out events whose reconstructed Compton cone does not intersect with the sample position within a certain uncertainty range. To perform this spatial discrimination, the quantity , defined in Eq. (2), can be employed Domingo16 .
| (2) |
In this equation, are the components of the unit vector along the cone axis defined by , where . When is expressed in mm, has units of mm2. For convenience, the origin of the Cartesian coordinates system is defined at the center of the sample position. The -parameter represents the solution for the quadratic describing the intersection of the Compton cone with a plane at the sample center and perpendicular to the circular sample surface. For a point-like -ray source located at the origin the cone coincides with the sample position for . Because of the finite sample size and taking into account also instrumental uncertainties both on position and energy, in actuality one may expect good or true capture events for values of in a region around . As described below, in this work we determine empirically the best choice of for an optimal SBR.
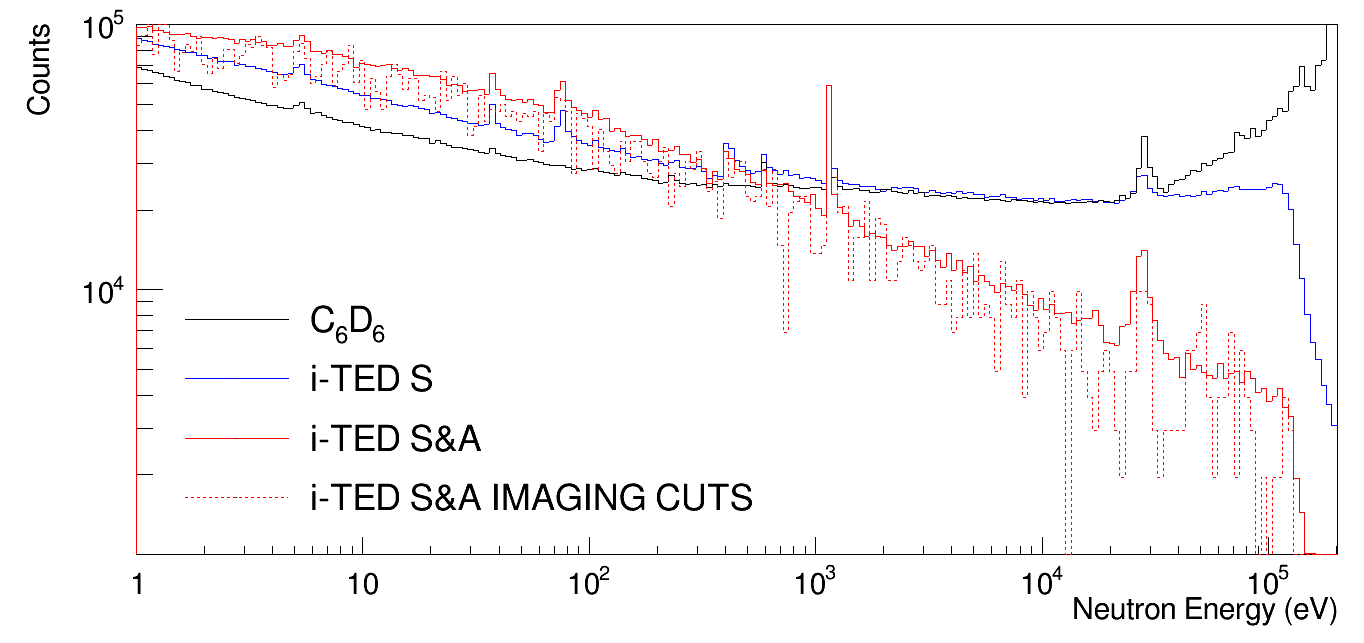
On top of the time-coincidence technique, which leads to the aforementioned 8% coincidence efficiency relative to the S-singles efficiency, the selection in the -distribution leads to an additional decrease in efficiency. This is shown in Fig. 9, which shows the variation of relative efficiency as a function of the selection on , from up to a maximum value of . The dashed-blue line with square symbols represents the fraction of counts in the 56Fe(n,) neutron-energy spectrum as a function of the selection on the parameter, taking as reference (100%) the situation where no cut is applied. The latter corresponds to the solid-red line spectrum in Fig. 7. The dashed-blue line with triangles shows the same result taking as reference the number of single events in the S-detector of i-TED. Since the efficiency of the S-detector is comparable to that of one C6D6 detector (see Sec. 2.4), the latter line is a good representation of the efficiency for the i-TED prototype used in this work, compared with state-of-the-art systems (C6D6 detectors) as a function of the imaging cut applied to analyze the data. The maximum value (solid blue line) represents the fraction of the S-detector total counts which are selected in time-coincidence mode (the aforementioned 8%). Finally, the SBR obtained for the 56Fe capture spectrum, as defined before using the background levels at 10 keV as reference, is displayed with the red line in Fig. 7.
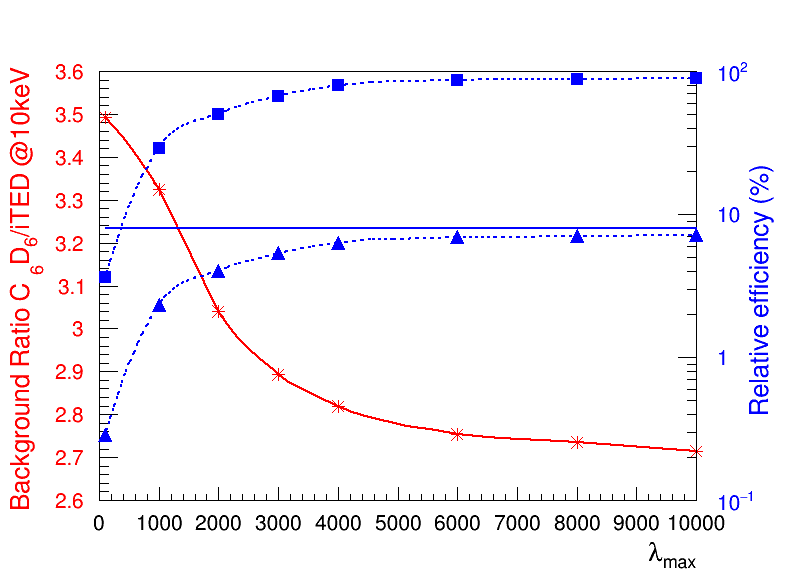
As expected, both efficiency and SBR curves follow an opposite trend. A stringent angular cut around the sample position corresponds to small -values, which provide an enhancement in SBR and a consequent decrease in counting statistics. The detection efficiency with cuts in imaging rapidly decreases for lower values of , becoming lower than 1% for a lambda cut below 500 mm2. A background ratio C6D6 over i-TED of 3 corresponds to a relative efficiency of about 4% and a -cut of 2000 units. A more restrictive cut of 1000 increases the background ratio to about 3.3 and yields a relative efficiency of about 2%. Last, the maximum background ratio of 3.5 is achieved with 100 at the cost of reducing the relative efficiency to just 0.2%.
The resulting neutron energy spectrum of 56Fe() for an illustrative imaging selection of 500 is shown (red-dashed line) in Fig. 7. For the sake of comparison, this spectrum has also been normalized to the top of the 1.15 keV resonance. An enhancement in SBR becomes apparent in the 1 keV-30 keV neutron energy range, although the total counting statistics after the selection on are rather limited.
The analytical analysis based on angular- or -selections is intended to prove the SBR-performance of the imager using experimental data. However, the efficiency reduction implied by this type of analysis obviously represents an important drawback for the practical implementation of the proposed method. For this reason, an alternative analysis technique has been developed, which is discussed in the second part of this article.
In summary, a significant reduction of the background level is obtained in the 10 keV neutron energy range for the measurement of the 56Fe() reaction with i-TED, when compared to state-of-the-art C6D6 detectors. An additional background suppression effect is achieved after implementing selections in the -ray imaging domain, although the counting statistics are at the limit to extract accurate information. The results obtained here are limited, to a large extent, due to the limitations in hardware and reconstruction software used in these tests. We expect to improve these aspects both by means of additional A-modules as shown in Ref. Babiano20 , and by means of improved position-reconstruction techniques Balibrea20 . The expected performance of the final i-TED detector after these recent upgrades is discussed in the following Sec. 3. In addition, this Section explores alternative analysis algorithms, which help to mitigate significantly the limitation in detection efficiency related to the imaging cuts.
3 Prospects for background suppression: the final 4 i-TED and innovative methods
3.1 Perspectives on background suppression with 4 i-TED
The previous sections have presented the first experimental proof-of-concept on background suppression using an i-TED prototype with limited hardware characteristics and position-reconstruction algorithms compared to the final 4 i-TED detector, hereafter simply referred to as i-TED. The latter will be composed of four individual Compton Imaging modules, each of the them consisting on two position sensitive detection layers based on monolithic LaCl3(Ce) crystals. Each scintillator is optically coupled to a SiPM, which features a segmentation of 8x8 pixels. The S plane is composed of a single 50x50x10 mm3 crystal, while the A plane consists of an array of four crystals, each of them with a size of 50x50x25 mm3. A detailed description of the first demonstrator of an i-TED module can be found in Ref. Babiano20 .
To illustrate the impact of the aforementioned upgrades, the detection efficiency and background suppression perspectives with the final i-TED detector have been studied on the basis of MC simulations described in Sec. 3.1.1. In Sec. 3.1.2 we present the expected performance of i-TED in terms of background suppression.
3.1.1 MC simulations of i-TED
The final i-TED is currently under construction and characterization Babiano20 and the position-reconstruction algorithms have recently undergone a major upgrade based on the use of Machine Learning techniques Balibrea20 . In this context, Monte Carlo (MC) simulations become an essential tool for testing the sensitivity of the detector performance to the improved features, developing new background suppression methods and planning the upcoming neutron capture time-of-flight experiments Se79Proposal . Initial MC simulations of the background suppression concept were presented in Ref. Domingo16 . To evaluate the prospects and capabilities of the final detector, more accurate MC simulations including the details in the geometry as well as experimental effects have been carried out in this work. The simulations have been made with the Geant4 Geant4_2 toolkit (v10.6) using the officially released QGSP_BIC_HP Physics List Geant4PL which contains the standard Electromagnetic Package.
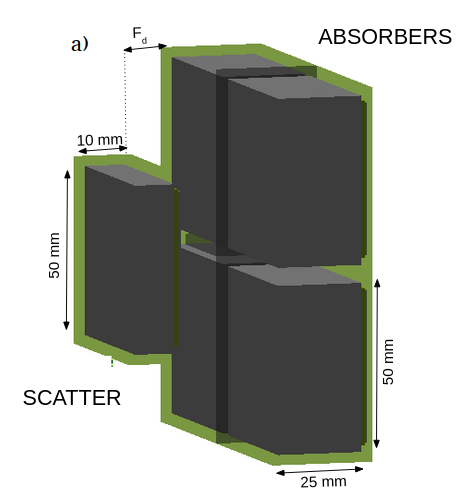
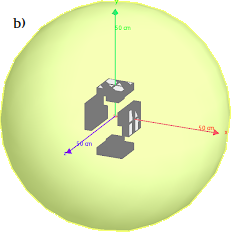
The general view of each of the i-TED modules as implemented in Geant4 is displayed in Fig. 10 (a). A critical parameter of this system is the distance between the two detection planes, so-called focal distance, which was set to 15 mm for all the simulations in this work. According to a previous work Babiano20 , this value ensures a good balance between efficiency an angular resolution. Each of the four i-TED modules was placed at a different distance (25, 50, 75 and 100 mm) from the sample to study its impact in the signal-to-background ratio (SBR).
A realistic study of the expected background suppression using i-TED requires an accurate modelling of both the capture cascades and the background events. The well known 197Au(n,) cascade was chosen to simulate capture events. The -rays emitted in the de-excitation of 198Au were generated using the Captugens code Captugen , which combines the known level scheme with an statistical description of the compound nucleus, as explained in Ref. Guerrero2008 . The 197Au(n,) cascades were emitted within the Geant4 application from a 0.1 mm thick Au disc with a diameter of 20 mm placed at the expected sample position in the center of i-TED (see Fig. 10) to replicate the actual experimental conditions at n_TOF. As for the simulation of the extrinsic neutron-induced background, the input for the Geant4 simulations was the experimental -ray spectrum registered with the absorber crystal of the i-TED prototype described in Sec. 2.2 during a measurement of a carbon sample, a pure neutron scatter. These -rays, coming in the real experiment from neutrons scattered in the sample and captured in the walls of the experimental area, were emitted from a random position on a sphere of 1 m in diameter surrounding i-TED (see Fig. 10 (b)).
A total of 107 197Au(n,) capture events and 3109 background events were simulated to register about 105 coincidence events of each type in the individual detectors. The output of the MC simulation resembles that of the experimental set-up, including for each simulated event the deposited energy, interaction position and time of all the -ray hits in the S- and A-layers of the four i-TED modules. Experimental effects such as the low energy threshold, position and energy resolutions were included in the simulations to consider their impact in the imaging resolution (see Ref. Babiano20 ) and consequently in the performance of the background suppression method.
3.1.2 Compton imaging method for background suppression with i-TED: the analytical approach
The background reduction perspectives with i-TED with respect to the state-of-the-art C6D6 detectors have been studied on the basis of MC simulations introduced in the previous section. For the C6D6, the same (n,) and background events were simulated using the Geant4 application described in Ref. Lerendegui16 and the C6D6 set-up geometry of previous experiments at n_TOF-EAR1 Lerendegui18 .
The results of these MC study indicate that the upgrades in the final i-TED detector will enhance not only the efficiency, as it was mentioned in Sec. 2.4, but also the background reduction effect with respect to the commissioned prototype.
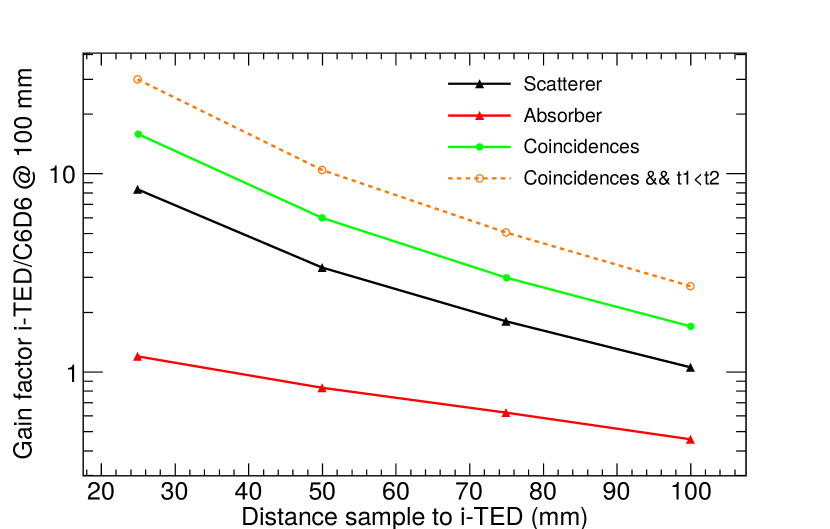
As it was mentioned in Sec. 2.5, the background suppression capability of i-TED is not only based on the application of selections in the -ray imaging domain. The operation of the S- and A-planes in time-coincidence, required to apply the Compton technique, also enhances the SBR. The MC simulations of the final i-TED, confirm the effect of the time-coincidence mode in the SBR, as it is shown in Fig. 11. This figure displays the expected SBR of an i-TED module at different distances in single- and coincidence-mode relative to a C6D6 detector at 10 cm. For C6D6 and i-TED at the same distance, one can appreciate that the scatter detector in singles-mode would present a similar SBR than a C6D6, while the operation in coincidence is expected to improve the SBR in a 60%. According to Fig. 11, for an i-TED module placed at 63 mm from the sample, replicating the setup of the commissioned prototype, the time-coincidence mode will yield a 4 times higher SBR than a C6D6, improving the results obtained with the i-TED demonstrator (see Fig. 7).
The results in Fig. 11 indicate also that selecting the events in which the scatter (t1) is fired before the absorber (t2) improves the SBR in an additional factor 1.8, due to the different spatial origin of (n,) and background events. The relevance of the time discrimination has triggered an on-going study to optimize the coincidence resolving time (CRT) of i-TED, which will be presented in future works.
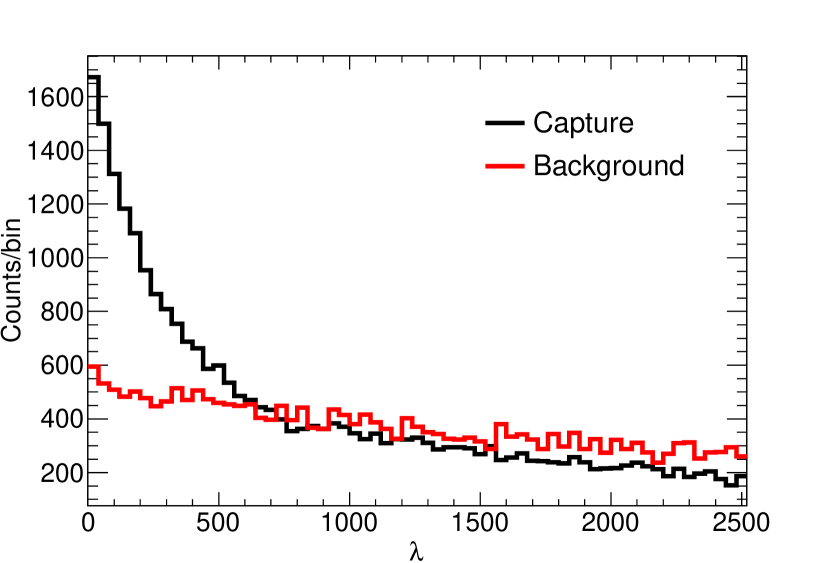
The application of Compton Imaging techniques for background suppression, introduced in Sec. 2.5, is based on setting selections in the imaging parameter , defined in Eq. (2). The expected distribution for capture and background events extracted from the MC simulations of i-TED is displayed in Fig. 12. From this figure it is clear that selecting events below a given lambda (=500-1000) leads to an enhanced SBR.
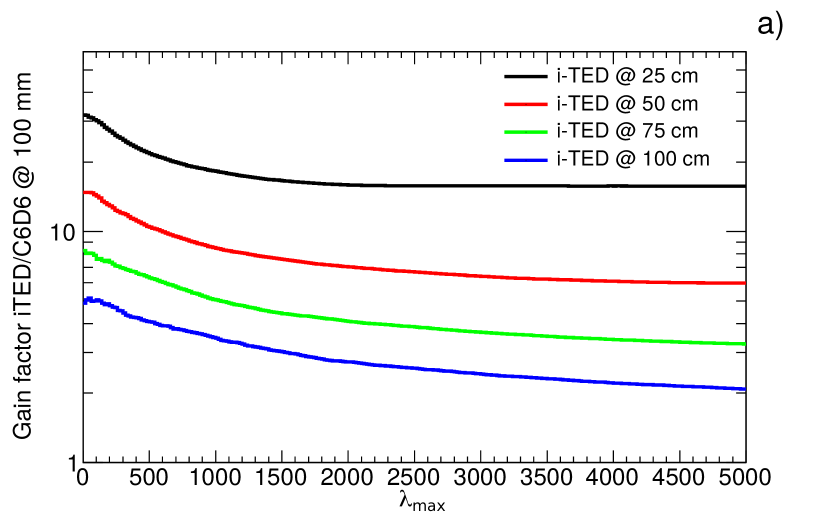
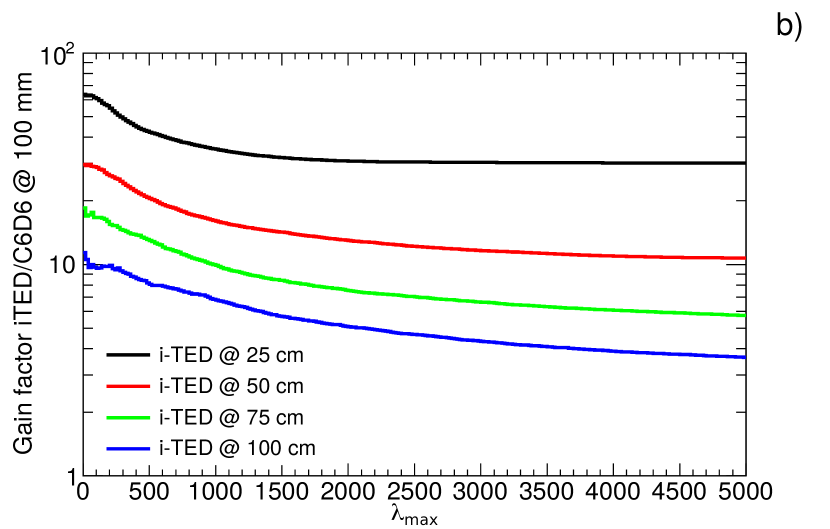
By combining the coincidence-mode and the imaging selections, the total expected SBR gain of i-TED with respect to a C6D6 detector is presented in Fig. 13 for modules placed at different distances. In this figure, panel a) presents a conservative scenario with time information (no CRT), while in panel b) we show the best SBR after selecting only events with t1t2 with an ideal CRT. The experimental CRT, still under optimization, will yield an intermediate situation.
Our MC study indicates that i-TED with an imaging cut of e.g. =500 would yield an SBR gain factor between 4 and 10 (depending on the achievable CRT and the choice of ) with respect to a C6D6 placed at the same distance. The background can be further suppressed by placing the i-TED modules closer to the sample. Indeed, for the sample to detector distance used in the i-TED PoC measurements (63 mm), a background ratio of 8 (no CRT) to 15 (ideal CRT) would be expected. These values indicate that the experimentally proven SBR gain () using the commissioned prototype of only three crystals (see Fig. 9) would be significantly improved with the final detector of 20 crystals. The large impact of the detector positioning in the background suppression shown in Fig. 13 will be experimentally investigated during the commissioning phase of i-TED at CERN n_TOF in 2021.
The major drawback of the imaging-based background suppression is the drop of efficiency, discussed in Fig. 9, due to the lost (n,) events after applying a given cut. This could represent a major limitation for establishing this technique in TOF facilities, where beam-time needs to be shared over several experiments every year. Therefore, a radically new approach based on Machine Learning (ML) algorithms has been explored and tested on the basis of the MC simulation of the final i-TED. This is presented in the following section.
3.2 ML algorithms for background rejection with i-TED
Exploiting the background suppression capability of i-TED while preserving a larger fraction of the capture efficiency is the aim of testing innovative methods beyond the analytical imaging cuts presented before. In particular, the high time- and energy-resolution and the granularity of i-TED provide an ideal test-bench for ML techniques, when compared to other detectors commonly used in (n,) experiments. From the physics perspective, capture gamma-ray events in i-TED yield a pattern, which is spatially inward and energetically hard. This signature is, on average, quite different from the backward and softer spectrum related to background gamma-rays, that originate after neutron capture in the surroundings of the set-up. This makes i-TED especially suited to benefit from the power of ML techniques, that can be trained to differentiate between one pattern and another.
A brief introduction to the methodology followed in this work to test ML algorithms for background suppression is presented in Sec. 3.2.1. Sec. 3.2.2 presents the perspectives for background rejection with i-TED using ML discrimination. Last, preliminary tests of ML-based background suppression on experimental data are presented in Sec. 3.2.3.
3.2.1 Machine Learning: algorithms and methodology
The background suppression with i-TED can be simplified as a problem of binary classification in the framework of ML techniques. In this work, the performance of several state-of-the-art ML algorithms included in Scikit-learn Python module scikit-learn has been evaluated: k-Nearest neighbors, Logistic Regression, Support Vector Classifier (SVC), Gaussian Naive Bayes (NB), Random Forest, XGBoost Classifier and Keras.
To train the ML algorithms in the discrimination of capture and background events, the same number (50k - 100k) of (n,) and background events were selected from the MC output individually for each i-TED module. Each MC event (S&A coincidence) contains the same nine features determined with the detector in a real measurement: 3D coordinates of the -ray interactions in the two PSDs (6), energy deposited in the S- and A-planes (2) and time difference between both interactions in scatter and absorber (1). Additionally, the Compton angle, calculated from the deposited energies, and the parameter, calculated using Eq. (2) from these parameters, were also included in the training to improve the classification performance.
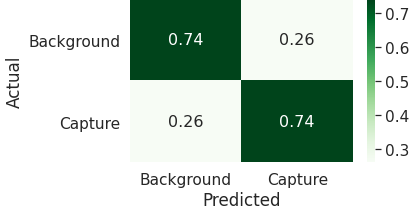
The MC-based input data-set was split, being 75% of the events devoted to training the ML classifier and the remaining 25% to testing its accuracy. The performance of a ML classifier is typically expressed in the so-called Confusion Matrix ConfusionMatrix , which represents the fraction of events of either type (capture and background in our case) that are correctly and wrongly classified by the ML algorithm. Fig. 14 shows an example of Confusion Matrix obtained in this work for the best performing algorithm, XGBoost (eXtreme Gradient Boosting) XGBoost classifier. An optimization of the algorithm based on the minimization of the log loss function lead to the following parameters:
-
•
The number of gradient boosted trees in the model was set to n_estimators = 150.
-
•
A learning_rate = 0.1. This parameter shrinks the weight of each feature after each boosting step to prevent over-fitting and is optimized in parallel to the number of trees.
-
•
A tree depth of Max_depth = 8 determines the complexity of the model or the ability to learn relations very specific to a particular data sample.
The remaining parameters were proven to have a negligible impact in the outcome of the classifier. Similar results are obtained using deep neural networks with the Keras deep learning framework Keras , while other algorithms featured worse performances (see Table 1).
| ML algorithm | Best accuracy (%) |
|---|---|
| k-Nearest neighbors | 69.2 |
| Support Vector Classifier (SVC) | 69.5 |
| Gaussian Naive Bayes (NB) | 69.9 |
| Logistic Regression | 70.1 |
| Random Forest | 72.7 |
| XGBoost Classifier | 74.3 |
| Keras | 74.3 |
3.2.2 ML-based background suppression with i-TED
The ML algorithm showing the best performance, the XGBoost classifier, has been applied to study the perspectives of background suppression with i-TED. This algorithm was trained to discriminate capture and background events from the MC simulation following the methodology described in the previous section. In a similar way than in the imaging-based method (see Fig. 13), two scenarios in terms of time resolution have been considered: MC events with ideal CRT and MC events with no time information.
Two Figures of Merit have been extracted from the Confusion Matrix (see Fig. 14) and used to evaluate the performance of the ML classifier:
-
•
(n,) efficiency: fraction of capture events which are correctly classified (bottom right entry).
-
•
SBR gain factor: fraction of correct (n,) event (bottom right) over the fraction of background events wrongly predicted as capture (top right).
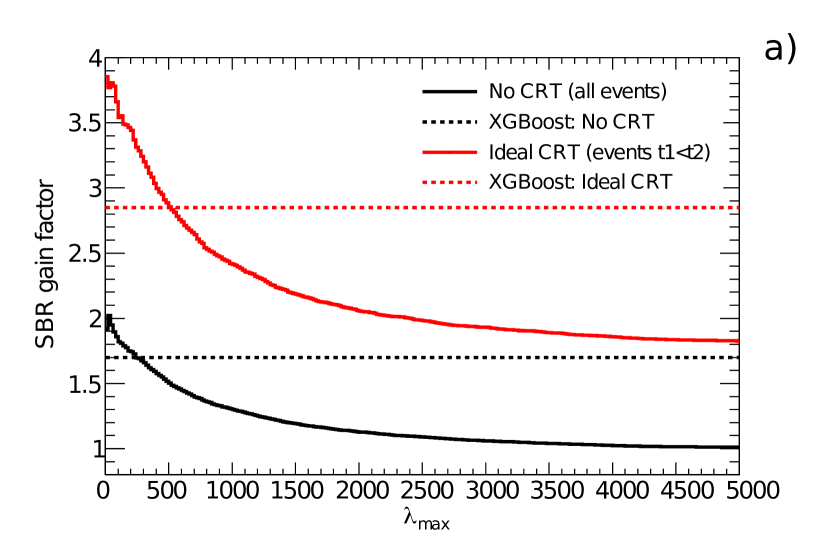
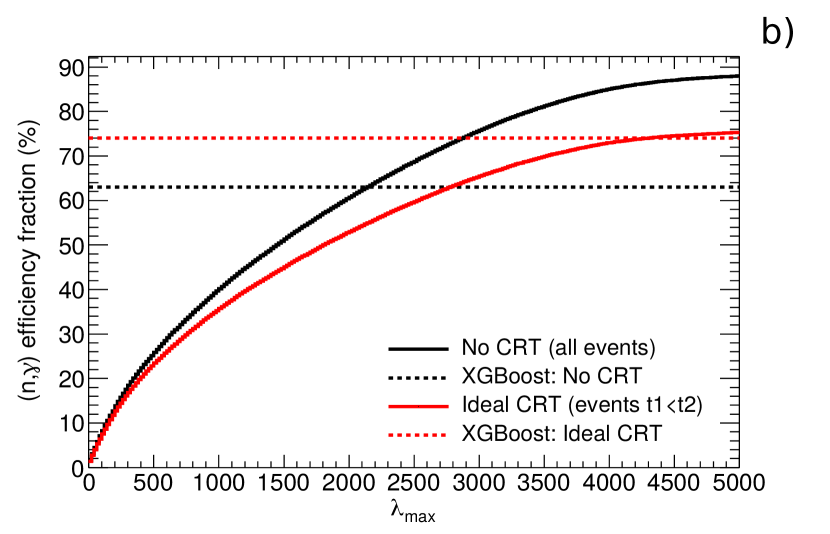
The performance of the XGBoost classifier is compared to the imaging-based results in Fig. 15 for the two CRT scenarios. The top panel shows the additional SBR gain factor related to the imaging or ML selection on top of the background reduction related to the operation of i-TED in coincidence-mode (see Fig. 11). The level of background reduction obtained with XGBoost is equivalent to an imaging selection with that ranges between 300 and 600 depending on the time resolution scenario. From Fig. 15 one concludes that an ideal CRT also enhances substantially the performance of the ML-based background suppression from a SBR of 1.7 to 2.8. An intermediate result can be expected for the experimental scenario and it will depend on the CRT experimentally attainable and the separation between the two detection planes.
The main advantage of the ML-based method compared to the imaging approach is demonstrated in panel (b) of Fig. 15. The ML-based technique keeps 63 to 74% of the efficiency (depending on the CRT), a factor between 2 and 3 higher than the imaging method with the same SBR gain factor.
According to the results presented in this section, Machine Learning methods seem very promising for background suppression with i-TED, providing a similar SBR and a clear efficiency enhancement with respect to the imaging method. However, the final application of ML methods for background suppression in (n,) experiments should be based on experimental data rather than MC events since the MC modelling of the detector response may not include all the experimental features. Preliminary tests of ML-based background suppression based on experimental data taken with the prototype described in Sec. 2.2 are presented in the following section.
3.2.3 ML-based background suppression on i-TED prototype data
The same XGBoost classifier described in Sec. 3.2.1 has been tested using experimental data measured during the commissioning of the aforedescribed i-TED prototype at n_TOF-EAR1. In a first step, our aim is to demonstrate experimentally the higher (n,) efficiency and the similar background suppression of ML- and imaging-based methods.
The training of the ML algorithm was carried out using two separate measurements. The same number (8 kEvents) of capture and background events were extracted from measurements of 197Au and natPb samples, respectively. For the case of 197Au, events were selected from the 4.9 eV saturated resonance, where the background represents less than 0.1% of the events. On the other hand, neutron capture in Pb is negligible and this sample can be considered a pure neutron and -ray scatter, both contributing to the overall background at n_TOF Zugec14 .
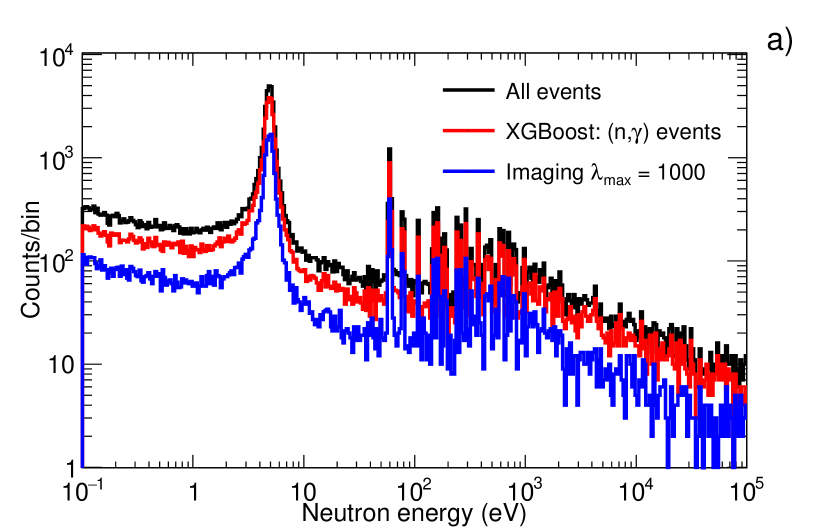
To prove the higher (n,) efficiency of the ML-classifier with respect to the standard imaging method, we applied the trained algorithm to the full 197Au(n,) data set and selected only those events predicted as being capture. The result is shown in top panel of Fig. 16, where the resulting counting rate of 197Au(n,) obtained with the XGBoost classifier is compared to the original data set and the results with an imaging cut =1000. From this figure one concludes that the efficiency for 197Au(n,) is almost 75-80% in the whole energy range, clearly improved with respect to the 30% obtained with the selection in the imaging domain.
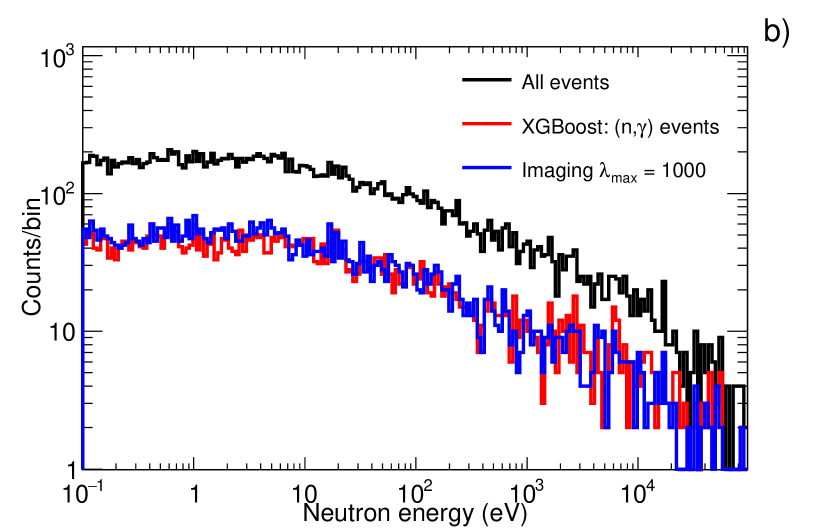
The same XGBoost classifier has been applied to a background-like measurement obtained with a carbon sample which, similarly to the case of Pb, is a pure neutron scatter. The events classified as capture by the ML algorithm, presented in the bottom panel of Fig. 16, show a reduction in 65% with respect to the original background level, very similar to the reduction obtained by selecting events with =1000.
In summary, the first tests of ML-based background suppression on experimental data confirm the higher (n,) efficiency and similar reduction of the background with respect to the experimentally proven imaging method. At this stage, the only limitation to explore further the performance of the ML method is the limited statistics available in the data-set discussed in Sec. 2.5. With only 2000 counts in the 1.15 keV 56Fe+n resonance (in coincidence mode) it does not become feasible to train the algorithm reliably. This fact prevented us from applying the ML-method to the 56Fe data set and compare the SBR gain with the ML approach and the results from the analytical method shown in Sec.2.5. The further development and experimental validation of the ML methods will be completed in the upcoming commissioning of the full i-TED at CERN n_TOF in 2021.
4 Summary and outlook
i-TED is an innovative total energy detector which exploits Compton imaging techniques to enhance the signal-to-background ratio (SBR) in (n,) time-of-flight experiments. This paper has discussed the status and perspectives of the background rejection capabilities using i-TED.
The first experimental validation of the background reduction in a 56Fe(n,) measurement at CERN n_TOF using a previous prototype has been presented. This result is based on a comparison with state-of-the-art C6D6 detectors to benchmark the performance of this novel methodology and apparatus. Despite of the use of a prototype under development, a SBR gain of a factor 2.5-3.7 with respect to a C6D6 has been experimentally demonstrated in a neutron capture measurement on 56Fe, confirming the applicability of this concept. Moreover, this work has shown that the performance of the scatter crystals in singles-mode yields an efficiency and SBR performance comparable to that of a state-of-the-art C6D6 detector, with the additional strength of the better energy resolution in LaCl3(Ce).
In light of the experimentally validated SBR gain, this work has explored the background rejection prospects for the final i-TED design. Accurate MC simulations of the final detector have shown that a two-fold increase in efficiency and a factor 3-5 improvement in SBR with respect to the commissioned prototype is expected. This MC study has also highlighted the large impact of the CRT in the reduction of the neutron-induced background with this system.
The main drawback of the analytical imaging method, the sharp drop in (n,) efficiency, is clearly improved using new methods based on Machine Learning (ML) techniques, which are very powerful thanks to the complexity of this Compton Imager. In this work we have shown that these ML algorithms (XGBoost) applied to MC data keep the (n,) efficiency loss below 30% compared to the 70% experimentally reported using Compton imaging. Last, preliminary tests of the ML-based background rejection using experimental data from the prototype commissioning confirm a similar performance than analytical imaging cuts in terms of background reduction, while the efficiency for capture events is about 3 times larger than with the analytical approach.
The last steps in the development of the final i-TED detector and the implementation of the enhanced position reconstruction techniques will be carried out in the forthcoming year. Moreover, neutron sensitivity studies at HiSPANoS-CNA are also planned. Last, the commissioning of the detector at CERN n_TOF will provide the experimental validation of the new ML-methodology, prior to the first neutron cross section experiments with i-TED, planned for 2022.
Declaration of competing interest
The authors declare that they have no known competing financial interests or personal relationships that could have appeared to influence the work reported in this paper.
CRediT authorship contribution statement
V. Babiano-Suárez: Investigation, Methodology, Formal analysis, Data curation, Visualization, Writing - original draft. J. Lerendegui-Marco: Investigation, Methodology, Conceptualization, Formal analysis, Data curation, Visualization, Writing - original draft. J. Balibrea-Correa: Investigation, Methodology, Formal analysis, Data curation. D. Calvo: Investigation. L. Caballero: Investigation, Methodology. I. Ladarescu: Software, Visualization. C. Domingo-Pardo: Conceptualization, Methodology, Supervision, Writing -review & editing, Funding acquisition, Investigation, Formal analysis. F. Calviño: Investigation. A. Casanovas: Investigation. A. Tarifeño-Saldivia: Investigation. V. Alcayne: Investigation. C. Guerrero: Investigation. M.A. Millán-Callado: Investigation. M.T. Rodríguez-González: Investigation. M. Barbagallo: Investigation. Other co-authors n_TOF Collaboration: Investigation, Resources, Writing review.
Acknowledgment
This work has been carried out in the framework of a project funded by the European Research Council (ERC) under the European Union’s Horizon 2020 research and innovation programme (ERC Consolidator Grant project HYMNS, with grant agreement n∘ 681740). The authors acknowledge support from the Spanish Ministerio de Ciencia e Innovación under grants PID2019-104714GB-C21, FPA2017-83946-C2-1-P, FIS2015-71688-ERC and CSIC for funding PIE-201750I26. We would like to thank the crew at the Electronics Laboratory of IFIC, in particular Manuel Lopez Redondo and Jorge Nácher Arándiga for their excellent and efficient work.
References
- (1) F. Käppeler et al. The s process: Nuclear physics, stellar models, and observations. Reviews of Modern Physics, 83(1):157–194, 2011.
- (2) R. L. Macklin and J. H. Gibbons. Capture-Cross-Section Studies for 30-220-keV Neutrons Using a New Technique. Physical Review, 159(4):1007–1012, 1967.
- (3) R. Plag et al. An optimized C 6D 6 detector for studies of resonance-dominated (n,) cross-sections. Nuclear Instruments and Methods in Physics Research A, 496:425–436, 2003.
- (4) M. C. Moxon and E. R. Rae. A gamma-ray detector for neutron capture cross-section measurements. Nuclear Instruments and Methods, 24:445–455, 1963.
- (5) J. Tain et al. Accuracy of the pulse height weighting technique for capture cross section measurements. Journal of Nuclear Science and Technology, 39:689–692, 2002.
- (6) U. Abbondanno et al. New experimental validation of the pulse height weighting technique for capture cross-section measurements. Nuclear Instruments and Methods in Physics Research A, 521:454–467, 2004.
- (7) A. Borella et al. The use of C6D 6 detectors for neutron induced capture cross-section measurements in the resonance region. Nuclear Instruments and Methods in Physics Research A, 577:626–640, 2007.
- (8) P. Mastinu. New C6D6 detectors: reduced neutron sensitivity and improved safety. n_tof-pub-2013-002 26/06/2013, CERN n_TOF Collaboration, 2013. n_TOF-PUB-2013-002 26/06/2013.
- (9) J. Balibrea-Correa et al. A first prototype of C6D6 total-energy detector with SiPM readout for neutron capture time-of-flight experiments. Nuclear Instruments and Methods in Physics Research A, 985:164709, 2021.
- (10) C. Domingo-Pardo et al. New measurement of neutron capture resonances in Bi209. Physical Review C, 74(2):025807, 2006.
- (11) G. Tagliente et al. The 93Zr() reaction up to 8 keV neutron energy. Phys. Rev. C, 87:014622, 2013.
- (12) P. Žugec et al. GEANT4 simulation of the neutron background of the C6D6 set-up for capture studies at n_TOF. Nuclear Instruments and Methods in Physics Research Section A: Accelerators, Spectrometers, Detectors and Associated Equipment, 760:57 – 67, 2014.
- (13) C. Domingo-Pardo. i-TED: A novel concept for high-sensitivity (n,) cross-section measurements. Nuclear Instruments and Methods in Physics Research A, 825:78–86, 2016.
- (14) P. Olleros et al. On the performance of large monolithic LaCl3(Ce) crystals coupled to pixelated silicon photosensors. Journal of Instrumentation, 13(03):P03014–P03014, 2018.
- (15) V. Babiano et al. -Ray position reconstruction in large monolithic LaCl3(Ce) crystals with SiPM readout. Nuclear Instruments and Methods in Physics Research A, 931:1–22, 2019.
- (16) V. Babiano et al. First i-TED demonstrator: A Compton imager with Dynamic Electronic Collimation. Nuclear Instruments and Methods in Physics Research A, 953:163228, 2020.
- (17) J. Balibrea et al. Machine Learning aided position reconstruction in large LaCl3 crystals for enhanced performance. Nuclear Instruments and Methods in Physics Research Section A: Accelerators, Spectrometers, Detectors and Associated Equipment (submitted), arXiv:2010.13427, 2020.
- (18) F. Gunsing et al. The measurement programme at the neutron time-of-flight facility n_TOF at CERN. In European Physical Journal Web of Conferences, volume 146 of European Physical Journal Web of Conferences, pp. 11002, 2017.
- (19) U. Abbondanno et al. The data acquisition system of the neutron time-of-flight facility n_TOF at CERN. Nuclear Instruments and Methods in Physics Research A, 538:692–702, 2005.
- (20) A. Di Francesco et al. TOFPET 2: A high-performance circuit for PET time-of-flight. Nuclear Instruments and Methods in Physics Research A, 824:194–195, 2016.
- (21) Texas Instruments. SN65LVDS9638 1500 Mbps LVDS Dial High Speed Differential Driver. https://www.ti.com/product/SN65LVDS9638, 2020.
- (22) J. Hartwell and R. Gehrke. Observations on the background spectra of four lacl3(ce) scintillation detectors. Applied Radiation and Isotopes, 63(2):223 – 228, 2005.
- (23) Z. Li et al. Nonlinear least-squares modeling of 3D interaction position in a monolithic scintillator block. Physics in Medicine and Biology, 55(21):6515–6532, 2010.
- (24) C. Massimi et al. Au197(n,) cross section in the resonance region. Physics Review C, 81(4):044616, 2010.
- (25) A. Carlson et al. Evaluation of the neutron data standards. Nuclear Data Sheets, 148:143 – 188, 2018. Special Issue on Nuclear Reaction Data.
- (26) C. Guerrero et al. Application of Photon Strength Functions to (n,g) measurements with the n_TOF TAC. In Proceedings of Workshop on Photon Strength Functions and Related Topics PoS (PSF07), volume 044, pp. 006, 2008.
- (27) S. Lo Meo et al. GEANT4 simulations of the n_TOF spallation source and their benchmarking. The European Physical Journal A, 51(12):160, 2015.
- (28) J. Lerendegui-Marco et al. First measurement of the s-process branching 79Se(n,). CERN-INTC-2020-065;INTC-P-580, 2020.
- (29) J. Allison et al. Recent developments in Geant4. Nuclear Instruments and Methods in Physics Research Section A: Accelerators, Spectrometers, Detectors and Associated Equipment, 835:186 – 225, 2016.
- (30) GEANT4 Reference Physics Lists. https://geant4.web.cern.ch/node/155.
- (31) J. Tain and D. Cano-Ott. The influence of the unknown de-excitation pattern in the analysis of -decay total absorption spectra. Nuclear Instruments and Methods in Physics Research Section A: Accelerators, Spectrometers, Detectors and Associated Equipment, 571(3):719 – 727, 2007.
- (32) J. Lerendegui-Marco et al. Geant4 simulations for the analysis of (n,) measurements at n_tof. In J.-E. García-Ramos et al., editors, Basic Concepts in Nuclear Physics: Theory, Experiments and Applications, pp. 209–210, Cham, 2016. Springer International Publishing.
- (33) J. Lerendegui-Marco et al. Radiative neutron capture on in the resonance region at the CERN n_TOF-EAR1 facility. Physical Review C, 97:024605, 2018.
- (34) F. Pedregosa et al. Scikit-learn: Machine learning in Python. Journal of Machine Learning Research, 12:2825–2830, 2011.
- (35) K. M. Ting. Confusion Matrix, pp. 260–260. Springer US, Boston, MA, 2017.
- (36) T. Chen and C. Guestrin. Xgboost: A scalable tree boosting system. In Proceedings of the 22nd ACM SIGKDD International Conference on Knowledge Discovery and Data Mining, KDD ’16, pp. 785–794, New York, NY, USA, 2016. Association for Computing Machinery.
- (37) F. Chollet et al. Keras. https://keras.io, 2015.