Motional heating of spatially extended ion crystals
Abstract
We study heating of motional modes of a single ion and of extended ion crystals trapped in a linear radio frequency (rf) Paul trap with a precision of phonons s-1. Single-ion axial and radial heating rates are consistent and electric field noise has been stable over the course of four years. At a secular frequency of kHz, we measure phonons s-1 per ion for the center-of-mass (com) mode of linear chains of up to eleven ions and observe no significant heating of the out-of-phase (oop) modes. By displacing the ions away from the nodal line, inducing excess micromotion, rf noise heats the com mode quadratically as a function of radial displacement by phonons s-1 m-2 per ion, while the oop modes are protected from rf-noise induced heating in linear chains. By changing the quality factor of the resonant rf circuit from to , we observe an increase of rf noise by a factor of up to 3. We show that the rf-noise induced heating of motional modes of extended crystals also depends on the symmetry of the crystal and of the mode itself. As an example, we consider several 2D and 3D crystal configurations. Heating rates of up to 500 ph s-1 are observed for individual modes, giving rise to a total kinetic energy increase and thus a fractional time dilation shift of up to s-1 of the total system. In addition, we detail how the excitation probability of the individual ions is reduced and decoherence is increased due to the Debye-Waller effect.
precision metrology, ion Coulomb crystals, vibrational mode heating, rf noise, multi-ion clocks
1 Introduction
Single-ion spectroscopy has lead to accurate optical atomic clock operation and enabled searches for new physics with high sensitivity over the past decades [1]. This includes the search for a variation of fundamental constants [2, 3, 4], dark matter [5], a hypothetical fifth force [6, 7, 8, 9, 10, 11, 12] and, in general, more precise tests of Einstein’s theory of general relativity [13, 14, 15, 16].
In many cases, the resolution is limited by the poor signal-to-noise ratio from a single atomic absorber. To overcome this limitation, several new approaches have been proposed, which utilize multiple ions in a so-called Coulomb crystal, e.g. based on Ca+[17], Lu+[18] or In+[19, 20] ions trapped in linear radio frequency (rf) Paul traps. Also, quantum simulations with trapped ions is advancing towards 2D and 3D systems to simulate more complex Hamiltonians [21, 22]. However, new challenges arise from extending the crystal size and dimension. These are both of fundamental nature to trapping ions in rf-traps, e.g. frequency shifts induced by excess micromotion (EMM) or additional electric field gradients from neighbouring ions, and of a technical nature, e.g. reaching the required homogeneity of spectroscopy beam intensities, electric and magnetic fields over a larger region. Many of these effects have been investigated in linear ion chains, where micromotion can be well controlled and uncertainties on frequency shifts are expected to be at the level [20, 23]. For two- and three-dimensional crystals, where high rf electric fields are probed, techniques for cancelling rf field shifts have been investigated [24, 25, 26, 27].
In this article, we take a linear chip trap with well controlled electromagnetic fields as a platform to investigate the heating of ion Coulomb crystals in two scenarios, i.e. under influence of noise induced by static electric fields (dc) and noise induced by rf fields. From this, we extrapolate its impact onto 2D and 3D crystals. We measure dc heating of the centre-of-mass (com) mode and higher modes in a linear chain of ions with an uncertainty of 0.1 phonons s-1 and find that the dc heating along the radial direction has been consistent over the course of four years.
By applying controlled radial EMM we can systematically amplify the coupling of rf noise to the ion motion, leading to an enhanced heating rate of the com mode. By filtering the rf noise by resonant circuits of different quality factors, we deduce the power spectral density of the electric field noise. Using the experimentally obtained parameters, we investigate heating of larger radially extended 2D and 3D ion crystals and find that rf-noise induced heating of modes strongly depends on the symmetry of the crystal and of the modes themselves. We also calculate the time dilation shifts and the influence from the Debye-Waller effect on each individual ion for spectroscopy applications of extended crystals.
2 Experimental setup and methods
2.1 Experiment
The experiment is based on sideband thermometry of ground-state cooled 172Yb+ ions, which are stored in a linear rf Paul trap. The trap consists of four wafers with segmented electrodes (figure 1(a) and (b)). The radial confinement is set by an rf electric field supplied by a resonant circuit to the inner two wafers, where additionally a combination of DC voltages may be applied to lift the degeneracy and to rotate the principal axes of the radial confinement (, ) and to compensate for stray electric fields (, ). The axial confinement in the trapping segment is provided by the voltages of the neighbouring segments. The trap rf drive frequency is MHz and typical secular frequencies are kHz. The trap was designed for low axial EMM and was proposed as a platform for scalable multi-ion clock-based experiments with mixed species of 115In+ and 172Yb+ [19, 20, 28]. A detailed description and characterization of the Paul trap and the laser systems can be found in [29] and [30], respectively.
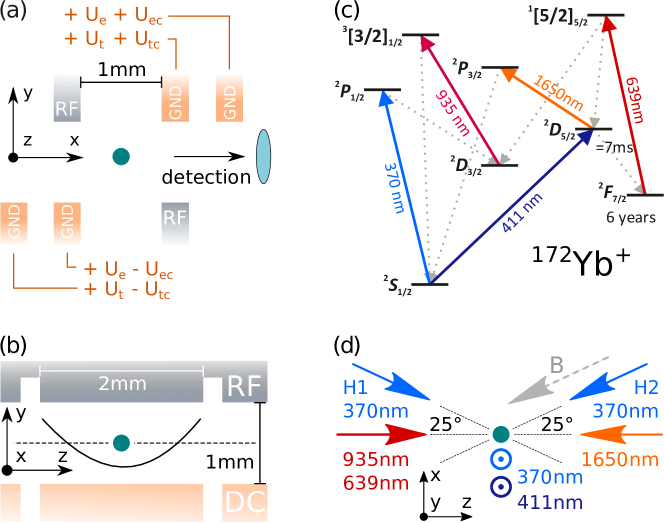
Ion trap geometry is shown in the (a) plane and (b) in the plane. The ions are trapped in a 2 mm segment of the linear Paul trap, where the adjacent segments provide axial confinement. Additional voltages may be applied to rotate the radial axes (, ) and to compensate stray electric fields (, ).
(c) Reduced energy level scheme of the 172Yb+ ion, showing the relevant transitions and decay channels for Doppler cooling (370 nm), sideband cooling (411 nm and 1650 nm), repumping (935 nm and 639 nm) and spectroscopy (411 nm).
(d) The repump lasers are aligned along the trap axis , while the spectroscopy laser at 411 nm and one of the radial Doppler cooling lasers at 370 nm are aligned vertically along . Two 370 nm lasers in the plane are used for micromotion measurements (H1 and H2) and for state preparation through optical pumping (H2). The quantization axis is set by the magnetic field (), which is parallel to H2.
Figure 1(c) and (d) show the relevant part of the atomic energy level scheme of 172Yb+ and the laser geometry, respectively. The ions are loaded from a thermal atomic beam via two-step photo-ionization and stored by laser cooling on the electric dipole transition at 370 nm. The cooling-cycle is closed using a repump laser at 935 nm. Fluorescence from the decay of the short lived -state is detected with an electron multiplying charged-coupled device (EMCCD) camera. At the beginning of the experimental sequence, a reference image is recorded with 2.5 ms exposure time to decide whether the measurement cycle is valid, i.e. whether the ion is in the cooling cycle or not. The ion is then cooled to the Doppler limit of about 0.5 mK via a radial beam with a wavelength at 370 nm along the direction. Optical pumping into the Zeeman-substate is achieved via a -polarized beam at 370 nm (H2 in figure 1(d)), aligned along the quantization axis set by a magnetic field of T at an angle of 25∘ with respect to the trap axis .
From here, the ion is cooled further to its quantum mechanical ground state via quench-assisted resolved sideband cooling (RSC) on the electric quadrupole transition and the dipole allowed . Similar schemes have been previously reported for Ca+ ions, see e.g. [31, 32]. For a single ion, this continuous-wave (cw) sideband cooling scheme is applied for 5 ms along the direction, the principal axis of the higher-frequency radial mode (within 3∘), to achieve phonons (ph). Here, describes the mean motional state occupation of an ion in the harmonic trap potential according to a thermal distribution. For simultaneous sideband cooling of multiple motional modes of larger crystals, the frequency of the 411 nm laser is tuned to the centre of the red sideband spectrum (again for the modes along the direction). The intensity of the 1650 nm laser is first increased to sufficiently broaden the effective linewidth and address all motional modes simultaneously, trading final temperature for cooling time. In the final part of the cooling sequence, the intensity is reduced to cool the modes to ph, within typical cooling times of 5 - 10 ms.
2.2 Thermometry
To determine the temperature of a certain mode, we use resolved sideband thermometry on the narrow electronic quadrupole transition [33, 34]. This technique is based on detecting the ratio of the excitation probabilities of the first-order red () and blue () motional sidebands, from which we can determine the average motional state occupation according to [33]
| (1) |
By varying the delay between the end of the sideband cooling cycle and the sideband interrogation pulse, we determine the heating rate. To detect the red and blue sideband amplitudes, a resonant first-order blue and red sideband pulse is alternately applied and the average excitation probability of each sideband is extracted from 200 measurement cycles. The uncertainty of a temperature measurement is given by
| (2) |
The uncertainty of increases at higher temperature, because it is directly proportional to . To obtain the highest measurement accuracy, the fixed interrogation pulse time is optimized for maximum excitation probability on the blue sideband after ground state cooling. The maximum delay is set such that the temperature is ph, where this method is most sensitive when using first-order sidebands. With 200 measurement cycles, a relative accuracy of % is reached in the range of - . For each heating-rate measurement, we typically determine the temperature at about ten different values of the . Under normal operating conditions, heating rates of ph s-1 per ion are observed, which can be determined with an uncertainty of ph s-1. The required maximum delay for such a measurement is on the order of a second, leading to a total time of around 15 minutes per heating-rate measurement.
The population in the Zeeman sublevel has a finite probability to leave the SBC cycle via decay to the long-lived state. Since no fluorescence is observed in this case, the ion is detected as dark, leading to a background signal of 2.7% after sideband cooling. As a result, the temperature measurement is limited to a minimum of (included in the error bars). After each measurement cycle, the population is repumped from the metastable , the and the states to the ground state as shown in figure 1(c).
3 Heating due to dc electric field noise
Fluctuations of the static electric field at the ion position can change the motional state in the direction of the noise field. In a macroscopic ion trap with an electrode-to-ion distance of = 0.71 mm, the noise field originating from the electrodes is expected to be spatially correlated at a crystal lengths [33, 35] (in our case between 10 and 100 m). This noise leads to an energy transfer to the com mode of a chain of ions, where all ions oscillate in phase. For this process, the heating rate increases proportionally to the number of ions () and to the frequency-dependent electric field noise spectral density , according to [36, 37, 38]
| (3) |
where is the reduced Planck’s constant, is the secular frequency of the com mode, is the total electric charge of the crystal, with being the elementary charge, and is the total mass of the crystal, with being the atomic mass of ytterbium.
3.1 Further heating mechanisms
In modes other than the com mode, the ions oscillate out of phase relative to each other. We refer to them as out-of-phase (oop) modes and distinguish them by the number of oscillatory nodes, e.g. the first oop mode has one node, the second oop mode has two, and so on. Heating of the oop motional modes due to local fluctuations of electric fields on the electrodes requires gradients of these fields along the crystal and, therefore, is suppressed relative to that of the com mode by at least [33, 35], which in our system is on the order of or above.
Further sources of heating can arise from the non-linearity of the Coulomb interaction via mode mixing [39], where phonons from two different modes can resonantly combine to an excitation in a third mode or reverse, if energy conservation is fulfilled. In a linear chain, this can be avoided by choosing trapping conditions that prevent the modes from coupling, i.e. far from any structural phase transition (e.g. 1D2D). In contrast to the oop modes, the com mode is the only one, where the centre of mass actually moves. An external force is required to transfer energy between com and any other mode. Thus, coupling of the com mode to oop modes is suppressed[39].
Motional modes can also be heated, if the ion samples anharmonicities of the trapping potential and if the resonance condition is fulfilled, where is a rational number related to the order of the anharmonicity, is the secular frequency of mode and is the number of ions [40, 33]. In typical Paul trap experiments, this source of heating is avoided by choosing the Mathieu parameters () and by properly choosing the secular frequencies [33].
3.2 Heating of a single ion
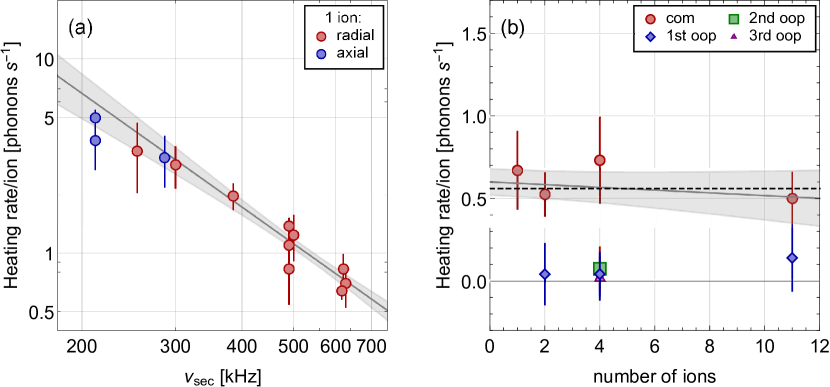
(a) Measured axial (blue circles) and radial (red circles) heating rates of a single ion as a function of the secular frequency . A power law function is fitted to the heating rate of the radial modes (grey curve), from which is obtained. The uncertainty of the fit is indicated by the shaded grey area. The frequency dependent heating rate of the axial modes are consistent with that of the radial modes, indicating an isotropic noise distribution.
(b) Heating rate per ion of the radial centre-of-mass (com) mode (red circles) and the first out-of-phase mode (blue diamonds) is shown as a function of the number of ions. A linear fit (grey curve) shows that there is no significant dependence as a function of ion number within a uncertainty of the fit (grey shaded area), therefore, we extract the weighted mean value (black dashed line) over all 4 data points of the com modes to be ph s-1 per ion. The secular frequencies of the com mode are in the range of kHz to kHz and the corresponding first oop modes are 4 to 8 kHz lower than the com modes. For the four-ion crystal the heating rates of the other two radial out-of-phase modes at kHz (green square) and at kHz (purple triangle) are also measured. No significant heating of any of these modes is observed.
To study dc electric field noise, we measure the heating rate of the radial motional mode of a single 172Yb+ ion as a function of the secular frequency (see figure 2, red circles). Part of the data has been published in [20]. Data at about kHz to kHz was recorded repeatedly and shows consistent results over the course of four years. A power law function is fitted (grey line) to the data of the radial mode (red circles) as shown in figure 2(a), yielding , in agreement with what is found in other traps, see e.g. [41]. By fixing the exponent to , we obtain a heating rate of , which corresponds to an electric field noise spectral density of , according to (3). In addition, the heating rate of the axial motional mode is measured for secular frequencies between kHz and kHz and is found to be consistent with this electric field noise spectral density, as shown in figure 2(a) (blue circles). Currently, the operating voltages of V provide a maximal axial secular frequency of kHz. The heating rate of the axial mode as a function of secular frequency is in agreement with that of the radial mode, indicating that the DC noise field is isotropic.
3.3 Heating of linear crystals
During sideband thermometry of larger ion chains, the spectroscopy laser at 411 nm addresses all the ions globally, producing entangled states when driving motional sidebands, while detection of the electronic state is done on one of the outer ions in the chain. If the average motional state occupation is low, i.e. the number of phonons is smaller than the number of ions, the probability of a red sideband excitation of one of the ions depends on the state of the other ions. We numerically calculate a correction factor for the extracted value of from the detected sideband ratio, which takes the correlation between the ions into account [36, 42, 35]. A more detailed description is reported in A.
The heating rates of radial modes of linear crystals of two, four and eleven ions are measured at a fixed radial confinement, see figure 2(b). The axial potential is adapted to the crystal length for several reasons. Firstly, the critical axial secular frequency for the 1D to 2D transition (linear-to-zigzag [43, 44, 45]) reduces with increasing number of ions. Therefore, if the radial secular frequency is kept constant, the axial secular frequency should be kept low enough to prevent cross-coupling of modes. Secondly, the frequency splitting of the radial modes is proportional to the axial secular frequency and a reduction of the axial secular frequency, therefore, facilitates simultaneous sideband cooling of several modes. Note, that this is limited by the ability to sufficiently resolve individual motional modes during sideband thermometry. Using the RSC method discussed in section 2, all radial modes of the two-ion and four-ion crystal were cooled to . For the 11-ion crystal, the detuning of the spectroscopy laser at 411 nm is set such that the four modes with the highest secular frequency are cooled efficiently. To exclude heating from non-linear coupling between sideband cooled modes and Doppler cooled modes in the investigated crystals, we perform molecular dynamics simulations as described in B. With this, we numerically verify, that under the experimental conditions there is no significant energy flow to the cooled modes from any other mode. The calculated energy fluctuations in the sideband-cooled modes due to non-linear coupling are below ph.
The heating rate of the com mode is measured to be ph s-1 per ion, as can be seen from the black dashed line. The data is fitted to a linear function (grey line), verifying that the heating rate per ion is constant as function of ion number within the uncertainty (shaded grey area). The heating rate of the first oop mode is consistent with zero within the uncertainty of ph s-1 per ion for all crystal sizes, ranging between . Heating rates of the third and fourth oop mode in the four-ion crystal are also measured and no significant heating is observed at the level of our resolution.
4 RF electric field noise coupling to secular motion
When the ion is exposed to EMM, external and technical noise at Fourier components couple to the ion motion, leading to additional heating at secular frequency [33, 46]. The ponderomotive trapping potential [47]
| (4) |
where is the ion mass, is the ion charge, is the rf drive frequency, the applied electric field, which is time averaged over a full rf period of . Assume a trapping electric field with a small noise contribution at ,
| (5) |
The time average of (4) reproduces the confining pseudopotential and, additionally, yields a - dependent beating term. The gradient of the beating term provides a periodic noise force at frequency acting on the ion motion
| (6) |
The noise force spectral density is related to the voltage noise spectral density via , providing an extension to (3) for the rf-induced heating rate of mode with secular frequency . The total heating rate is then given by , where
| (7) |
Since the ion senses always both contributions, we set here .
Decomposing the ion oscillations in the trapping potential into normal modes of motion [48], the modes are described by sets of eigenfrequencies and normalized eigenvectors . In this formalism, the relative motional amplitude of ion in mode is given by the -th component of the eigenvector .
In general, a mode with a normalized mode vector will experience a noise force according to its projection on the force vector. For a single ion with its mode direction parallel to the gradient of the pseudopotential, the relation for the heating rate is given by [46]
| (8) |
Thus, measuring the heating rate as function of provides access to a part of the voltage noise spectrum at the ion position.
4.1 Heating of a single ion
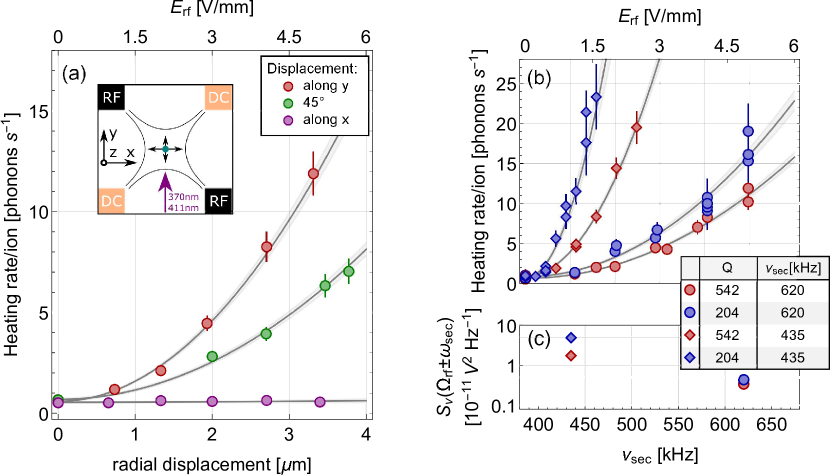
(a) Heating rate of a single-ion radial mode when exposed to radial EMM. The inset shows the orientation of the principle axes in the trap and the direction of the spectroscopy laser. The ion is displaced along (red circles), along (purple circles) and diagonally in the plane (green circles). The data is fitted (grey curves) to equation (8) and the 1-uncertainty is shown by the grey shade.
(b) Heating rate of the radial mode of a single ion as a function of displacement for two different values of the quality factor () of the resonant circuit. Data is recorded at (red data points) and (blue data points) and at a secular frequency kHz (diamonds) and kHz (circles).
(c) Extracted voltage noise spectral density from the curves shown in (b). A significant increase of is observed at a reduced and .
To measure the heating rate of an ion under the influence of rf noise, the experimental sequence is modified to radially displace the ion by , inducing excess micromotion. For this, the compensation voltages and are changed, such that the ion is displaced radially by a few m and stored at a specific (). After the delay , the ion is returned to the nodal line and the temperature of the mode is determined in the same manner as described in section 2.
| [m] | [m] | [mV] | [mV] | [V/mm] | [V/mm] | [V/m] | [V/m] |
|---|---|---|---|---|---|---|---|
| 1 | - | 33 | -165 | 1.505 | 0 | 0 | 27.0 |
| - | 1 | -2.9 | 278 | 0 | 1.505 | 27.0 | 0 |
| 0.707 | 0.707 | 21.5 | 79.7 | 1.063 | 1.063 | 19.1 | 19.1 |
was measured up to V mm-1 once as a function of the applied compensation voltages to obtain the four relations , , and with uncertainties below 2%, using photon correlation method [24, 49]. From day to day, the stray electric fields are compensated within V mm-1 and the ion is displaced in the plane using a combination of voltages and , where we extrapolate for V mm-1. Table 1 shows exemplary values for kHz.
The low-pass filters connected to the DC electrodes suppress frequencies higher than 113 Hz [20], resulting in a characteristic rise and fall time of 9 ms for externally applied voltage changes. This ensures adiabatic transport of the ions as voltages are adjusted on much longer time scales than an oscillation period of the ion. We verify that the displacement itself does not heat the investigated mode by repeatedly shifting the ion outwards and back without any additional delay () and measuring the temperature. Accounting for additional small delays in experiment control, the total duration of the displacement sequence (back and forth) is about 28 ms. Therefore, we extend by a fixed additional delay time ms, so that the experiment remains synchronous with the 50 Hz mains line cycle. As discussed in section 2, the highest measurement sensitivity is reached at values . Therefore, the total is adapted at each displacement to account for the expected heating rate.
Figure 3(a) shows the measured heating rate of the radial mode along the direction at kHz as a function of displacement in three directions. First, the ion is displaced along , so that the measured mode is parallel to (red points). A quadratic increase of the heating rate is observed as a function of the displacement. A fit to the relation yields ph s-1 m-2, corresponding to a voltage noise spectral density of V2Hz-1 according to (8). Next, the ion is displaced diagonally in the plane (green points) at an angle of , where less heating is observed as a function of displacement. The fit yields a quadratic coefficient ph s-1 m-2. From the projection of the -mode on the radial gradient , a factor of , i.e. a coefficient ph s-1 m-2, is expected for a diagonal displacement. Finally, when shifting the ion along , where the gradient is perpendicular to the mode vector, no additional heating of the radial -mode due to rf noise is observed (purple points). It is worth noting, that the total energy transfer from the noise field to the ion is unchanged, but is differently distributed over the two radial modes.
4.2 Impact of the quality factor of the rf circuit
As the ion motion couples to noise at under the influence of EMM, this type of heating is expected to be strongly dependent on both, the quality factor () of the resonant rf circuit that drives the confining rf field and on the secular frequency of the interrogated mode.
In order to study this effect, the heating rate of a single ion is measured under the influence of EMM in two different configurations. At typical operating conditions, where the trap drive frequency is MHz, the Lorentzian-shaped rf resonance has a full width at half maximum (FWHM) of kHz, corresponding to a loaded quality factor of (unloaded ). The measurement is repeated with a reduced quality factor of . Besides the increased FWHM = kHz, the resonance frequency shifts to MHz. To retain the same secular frequency of the ion to the initial configuration, the power of the rf source is increased. For each value of , data is recorded at two different secular frequencies of kHz and kHz, as is shown in figure 3(b). As expected, no influence of is observed on the heating rate at compensated micromotion, i.e. within V mm-1. However, when the ion motion couples to rf noise through EMM, a significant increase of the heating rate is observed, as can be seen from the slope of the curves in figure 3(b). This effect becomes larger at lower secular frequency, because then the noise at is amplified more by the resonant circuit. From the fits, the voltage noise spectral density is determined for and , see figure 3(c), and yields, e.g., V2 Hz-1. At , the voltage noise is amplified by a factor for a secular frequency of kHz, while a factor of is observed for kHz. Using the Lorentzian relation for transmission of the helical resonator (12), a power spectral density of the noise is determined to be W Hz-1, comparable with values obtained in other systems, see e.g. [50]. The extracted values of at the four different frequencies are significantly different, showing that the noise is not white in this range.
4.3 Heating of a two-ion crystal
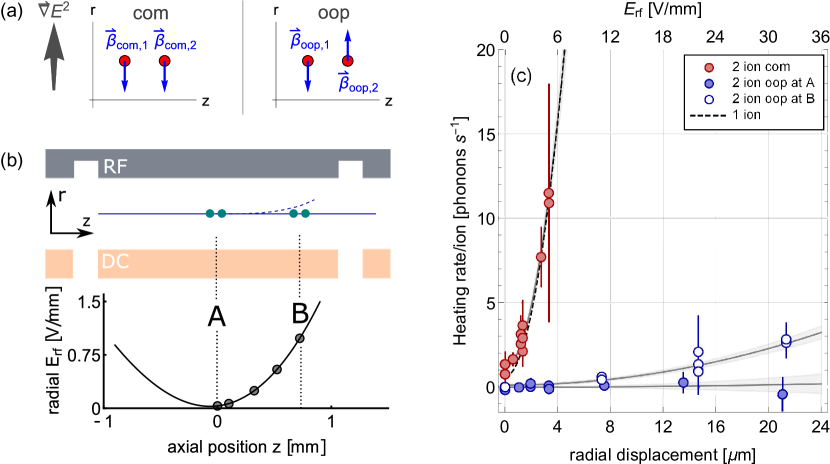
(a) Radially displaced two-ion crystal and the vectors (blue arrows) of the com mode (left) and oop mode (right), together with the pseudopotential gradient () (grey arrows).
(b) Schematic representation of the investigated trap segment (top) and measured excess micromotion (error bars are smaller than symbols) along with a spline to guide the eye (bottom). The positions in the trap segment, where heating-rate measurements are performed are indicated by A (centre) and B (edge). In the trap schematic, the solid line indicates the rf nodal line and ion positions at compensated EMM. The dashed blue line exaggerates the deviation of the ion position from the nodal line, when they are shifted to position B (see text).
(c) Heating rate of the radial com and oop mode when exposed to EMM in the centre of the trap segment (A, full blue circles) and at the edge of the trap segment (B, empty blue circles). In the latter position, heating of the oop mode is observed due to a significant axial gradient of the radial electric field. The single ion data set reproduces consistently the one from figure 3, which was recorded about five months earlier.
In order to investigate the impact of the rf field gradient on extended ion Coulomb crystals, we first consider the most simple example of a two-ion crystal. Figure 4(a) shows an axial crystal of two ions and the mode vectors (blue arrows) of the radial com mode and the radial oop mode, together with the pseudopotential gradient (), which is identical for both ions (grey arrows). The energy transfer to the com mode is expected to be twice that of a single ion as the force on the mode is doubled. As a result, the heating rate per ion should be equal. For the oop mode though, the mode vectors are oriented in opposite direction () leading to a cancellation of the noise force, i.e. the net force on the mode is zero, and thus no heating of the oop mode should occur. In fact, this is the case for all radial oop modes in larger strings of ions, which are radially displaced, as pairwise cancellation of the noise force occurs. Or more fundamentally, for each oop mode (), the sum of the mode vectors components in positive direction is equal to the sum of those in the negative direction, since the centre of mass is at rest in those modes. As the ions are placed in an identical gradient , the force contributions must cancel
| (9) |
As a result, only the radial com mode of an ion chain should be heated by rf noise.
To experimentally study the influence of rf noise on a larger crystal, the heating rate of a linear chain of two ions at a separation of 17 m is measured as a function of radial displacement in the same way as described in section 4.1. The results are shown in figure 4(c), where the red points show the heating rate of the com mode at around kHz, and the filled blue points show the heating rate of the oop mode at around kHz. The data is fitted to , yielding ph s-1 m-2 per ion for the com mode, which is in agreement with that of a single ion (the single-ion fit is given by the black dashed line) and confirms the expected scaling of the heating rate with ion number. The grey shaded area indicates the uncertainty of the fit. As expected from (9), no significant heating of the oop mode is observed (blue full symbols in figure 4(c)) up to a displacement 21 m.
In order to induce heating by rf noise of the oop mode, we apply voltages in the neighbouring segment. In this manner, the radial component of the rf electric field as seen by the ions near the segment edge strongly depends on the coordinate, as shown in figure 4(b), i.e. the ions will deviate from the nodal line while shifting them along . Next, the ions were moved from the segment centre (position A in figure 4(b)) by 720 m along the axial trapping direction towards the edge of the segment (position B in figure 4(b)), keeping the ion separation constant. The difference in the pseudopotential gradient at the ion positions results in a different coupling of noise to the individual ions, preventing the noise force from fully cancelling. This differential noise coupling becomes larger as we displace the ions radially and leads to significant heating of the oop mode at high values of EMM (open blue circles in figure 4(c)). With respect to the heating rate of the com mode, times less heating is observed in the case of the oop mode.
5 RF-noise induced heating of radially extended crystals
Based on the observed rf-noise induced heating of secular motion in few-ion systems under the presence of rf field gradients, we extend the discussion now by theoretical calculations of more complex 2D and 3D crystals. Here, we focus on the heating effect due to rf noise and neglect the known heating effect due to non-linearity of the Coulomb potential, which becomes relevant at higher temperatures [51]. The ground state configuration of an N-ion crystal is calculated at temperature K under high damping using molecular dynamic simulations. The chosen trapping potential is approximated to the second-order and sets of eigenfrequencies and mode vectors are obtained from solving for the eigensystem.
In the case of 2D or 3D crystals, the mode structure becomes complicated and the mode vectors of individual ions are typically no longer oriented along a single principal axis of the trap. Therefore, the total noise force () on mode is obtained by summing over the forces acting on each individual ion , according to
| (10) |
which is proportional to the projection of its normalized mode vector on the gradient of the electric field. This modifies equation (8) to
| (11) |
from which the heating rate on a mode can be obtained. Since is proportional to the absolute ion distance from the nodal line, the square of the term is dominated by contributions from the outermost ions at radial distance around from the nodal line. Therefore, we obtain an approximate scaling of the heating rate .
For simplicity, we assume a constant power spectral density of W/Hz over the range of frequencies at the input of the resonant rf circuit. This value is in the range of the experimentally obtained values, see section 4.1. Using a Lorentzian transfer function, the spectral voltage noise on the rf electrode is calculated [50]
| (12) |
The transmission is dependent on the quality factor and the inductance H of the resonant circuit and scales approximately as . Using (11), we obtain .
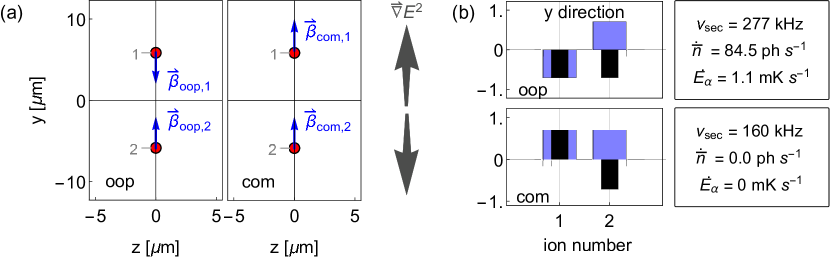
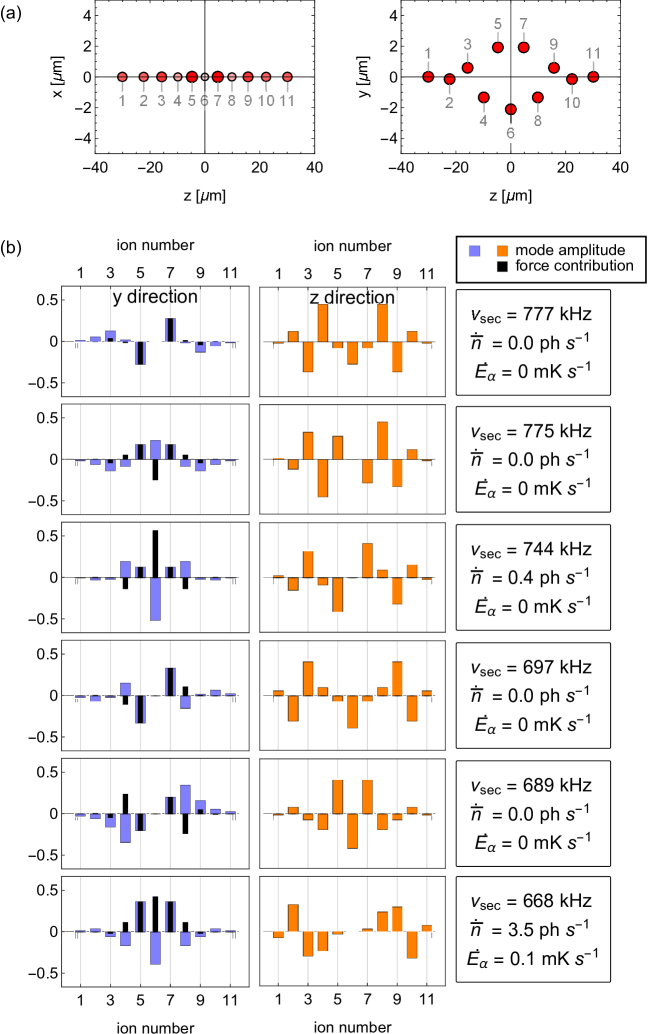
(a) A radially extended two-ion crystal for kHz. The mode vectors of the out-of-phase (oop) mode and for the centre-of-mass (com) mode are depicted with blue arrows. The direction of the gradient of the pseudopotential () is shown with thick grey arrows.
(b) Normalized mode vector amplitudes in the direction (blue shaded bars) and individual force contributions on the mode (black bars) for both the oop mode and the com mode. The mode frequency , the calculated heating rate in ph s-1 and in mK s-1 of the different modes are given in the textboxes on the right.
5.1 Radially oriented linear crystals
To understand the behaviour of radially extended crystals, we first consider a simple two-ion crystal oriented along a radial direction (). Please note, that from here on, we make the choice of the weaker confinement to be along the direction. We assume an ideal linear ion trap, where no axial rf fields or gradients are present, and only focus on the radial components of the modes. Figure 5(a) depicts the calculated ion positions for a confinement of kHz. The blue arrows indicate the direction of mode vectors of the radial oop mode at kHz and the radial com mode at kHz. The two ions are symmetrically placed around the nodal line, at a distance of 5.8 m. The pseudopotential gradient (), coupling the noise to each ion, points in opposite directions with respect to the nodal line (), as depicted by grey arrows. The mode vectors of the oop mode also point in opposite directions and are of equal amplitude (). Therefore, the individual noise force contributions add constructively. This is visualized in figure 5(b) with black bars showing the normalized individual force contributions and blue bars showing the normalized mode amplitudes for each mode along the direction. In this case, the oop mode is heated by 84.5 ph s-1, corresponding to mK s-1.
In contrast, the mode vectors of the com mode point in the same direction (). Therefore, the force contributions of the individual ions have opposite sign, as seen from the black bars in the lower panel of figure 5(b), and the net force on this mode is zero (). As a result, the com mode of the extended two-ion crystal is protected from rf-noise induced heating. This perfect cancellation only holds if the ions are symmetrically placed around the nodal line. In the case of uncompensated stray electric fields, the net force on the com mode is finite and it is also heated.
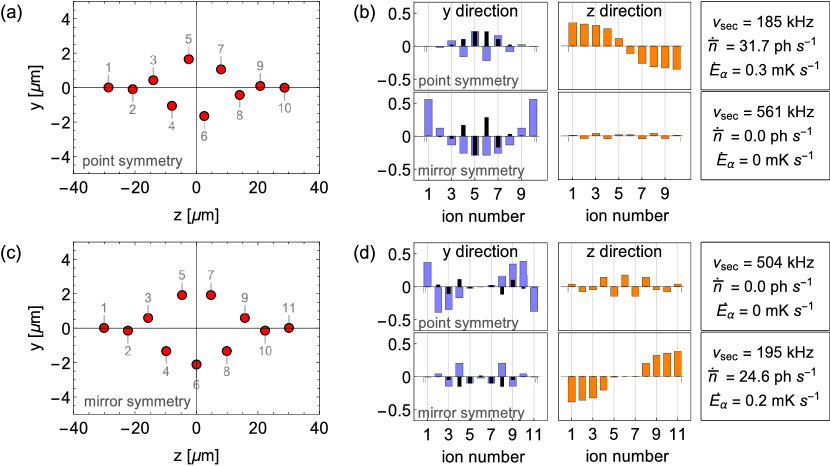
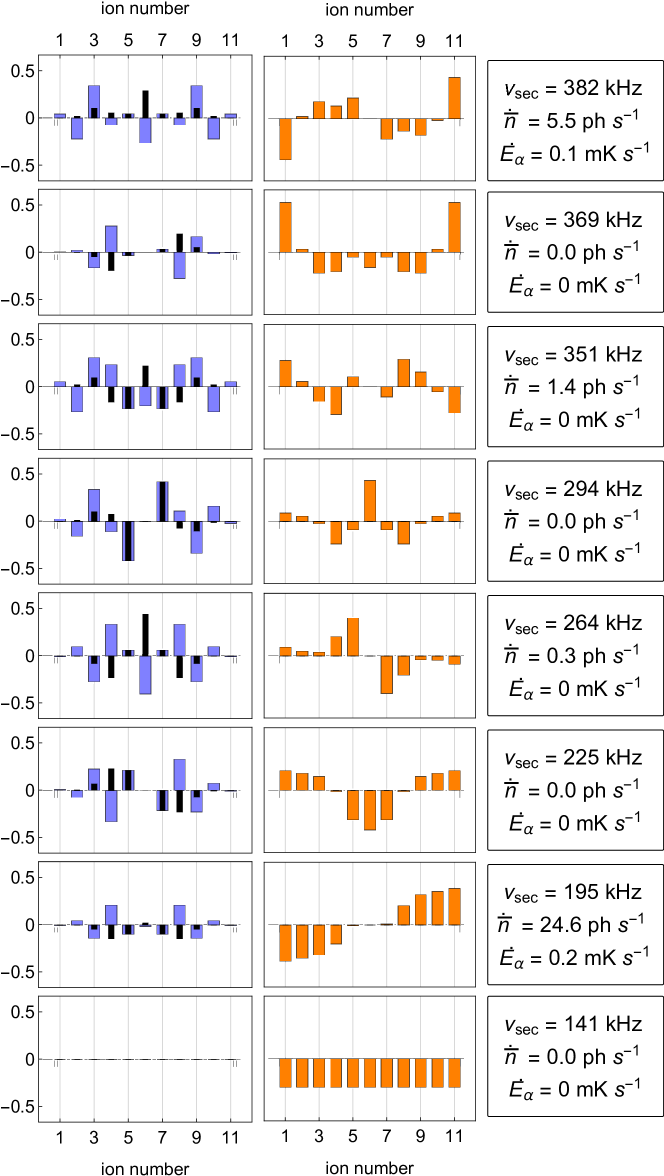
Ion positions of a (a) 10-ion and (c) an 11-ion 2D crystal for kHz. The respective normalized mode amplitude (-component blue, -component orange) and force contribution (black bars) in the and direction are shown in (b) and (d) together with the mode frequency and the heating rate in terms of both phonon number and energy. The 10-ion crystal is point-symmetric with respect to the crystal center, while the 11-ion crystal is mirror-symmetric with respect to the axis (). Heating of radial modes occur if the symmetry of the mode is of the same kind as the symmetry of the crystal (see text). For each crystal, the upper panel of (b) and (d) shows a mode with radial point symmetry while the lower panel shows a mode with radial mirror symmetry, respectively. For both crystals the most heated mode is shown as well as an example of a protected mode.
5.2 2D zig-zag crystals
The calculated ion positions of a 10- and an 11-ion zig-zag crystal for trap frequencies kHz are shown in figure 6(a) and (c), respectively. Due to the slight radial anisotropy, both crystals are extended in the -plane, leading to a coupling of the and modes.
The 10-ion crystal is axially m long and the two central ions (labelled as 5 and 6) are at a distance of m from the nodal line. The 10-ion crystal is point symmetric (figure 6(a)), i.e. it is symmetric with respect to the crystal center. We can identify pairs of ions, which are positioned opposite to each other at equal distance from the nodal line ( with N being the number of ions). These paired ions are subject to opposite gradients (), e.g. the two central ions (5,6). The radial vibrational modes can be divided in two groups, those that have point symmetry and those that have mirror symmetry with respect to the axis (at ). A point-symmetric mode behaves like the oop mode of the radial two-ion crystal (section 5.1), where the mode vectors point in opposite direction () and the force contributions add constructively, leading to heating. The most heated mode is shown in the upper panel of figure 6(b). Assuming the rf noise W/Hz in our system, it heats with ph s-1 ( mKs-1) at a mode frequency of kHz. It is the breathing-like mode in the direction and has the largest number of nodes in the direction. In contrast, in a mirror-symmetric mode, the mode vectors of two ions in a pair point in the same direction and have the same mode amplitude . Similarly as for the com mode of the radial two-ion crystal, their force contributions cancel and the mode is protected from this source of heating. An example of a mirror-symmetric mode at kHz is shown in the lower panel of figure 6(b).
The 11-ion zig-zag crystal shown in figure 6(c) is 60 m long and the central ion (6) is at 2.1 m from the nodal line. In contrast to the 10-ion crystal, it has mirror symmetry, leading to heating of mirror-symmetric modes, while point-symmetric modes are protected. This can be understood by drawing the analogy with the radially displaced axial two-ion crystal (see figure 4(a)). Again, symmetrically placed pairs of ions are identified, e.g. ions (5,7) or (4,8) with . But now, if the pairs of ions show a oop-like motion (), pairwise cancellation occurs and, consequently, point-symmetric modes are protected from heating (upper panel figure 6(d)). For mirror-symmetric modes (lower panel figure 6(d)), the pairs of ions behave like a com mode (), where the force contributions add up constructively and rf-noise induced heating occurs. For the 11-ion crystal, the highest heating rate is calculated to be ph s-1 ( mK s-1) at kHz. Note, that in the 11-ion crystal, the centre ion is unpaired. It has a finite radial mode amplitude in mirror-symmetric modes which are heated, while it is radially at rest in point-symmetric modes (), which are protected from heating. For most of the heated modes, there are also partial cancellations, e.g. the force adds up pairwise, but partially cancels with respect to other ion pairs. For a full list of motional modes of the 11-ion crystal, see C.
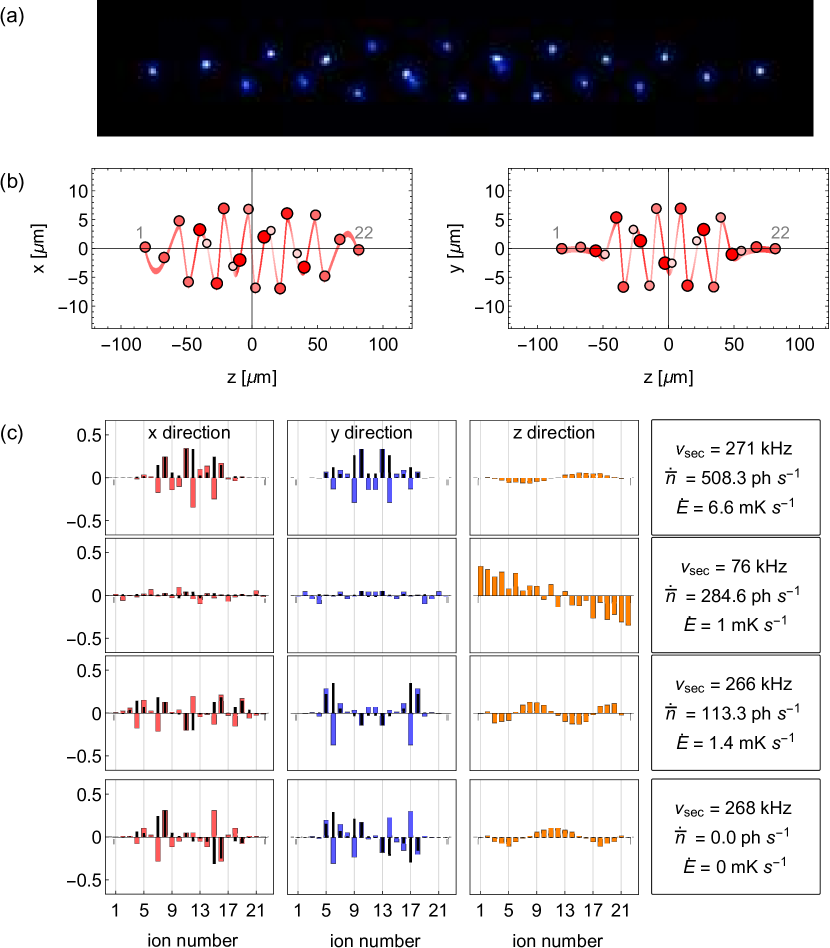
(a) Experimental image of a 22-ion helix crystal, with a length of 160 m and a radial diameter of 13 m.
(b) Calculated ion positions in two planes ( and ) for a 22-ion helix at similar confinement as in (a) at kHz. To guide the eye, the position of the ion in the direction perpendicular to the plane is indicated by the size and shade of the points and the ions are connected by a spline. The crystal is point symmetric in the plane and mirror symmetric in the plane.
(c) Panels with mode vector amplitudes in the (red bars), (blue) and (orange) direction of four exemplary modes together with force contributions (see text). The calculated heating rates, both in phonon number and energy, for each mode are shown together with the mode frequency in the textbox. In the most heated modes, ions that have a large radial displacement have a large mode amplitude. However, if the frequency of the mode is low, the becomes large and the mode is also significantly heated.
5.3 3D crystals
As an example for a three dimensional crystal, we take a 22-ion helix [43, 44, 45] at trap frequencies kHz. It has a crystal length of 163 m and a maximum radial extension of 7 m. An experimentally obtained image of such a crystal under similar conditions is shown in figure 7(a). The calculated ion positions in two planes are plotted in figure 7(b), where the size and the brightness of the colour of the points indicate the position in the third dimension. The panels in figure 7(c) show the normalized mode amplitudes and the individual force contributions in all three directions for four exemplary modes. Similar as in section 5.2, the behaviour can be understood by looking at the symmetries of the crystal. In the plane the crystal is point symmetric (, ) and in the plane the crystal is mirror-symmetric (, ). Consequently, modes with point-symmetric components and mirror-symmetric components are heated. The upper panel of figure 7(c) shows the most heated mode at kHz with a heating rate of ph s-1 (6.6 mK s-1), where the biggest contribution comes from a few ions with large mode amplitudes, located in the helix region. The second panel shows a mode with much smaller and evenly distributed mode amplitudes, both in the and direction, which is still significantly heated (1.0 mK s-1) due to the low mode frequency and, therefore, a big change in phonon number of ph s-1. In addition, due to the transmission function of the resonant circuit, the noise gets amplified much more at lower secular frequencies. The lower two panels show two modes which are very similar, but have the opposite symmetry, both in the and direction, leading to rf-noise induced heating in one case and full cancellation in the other.
Summing over all modes, we obtain a total heating from rf noise of this crystal of J s-1 corresponding to mK s-1, of which 58% is contributed by a single mode (the mode shown in the upper panel in figure 7(c)). Due to heating of individual modes, the crystal is not in thermal equilibrium though. For comparison, we estimate the heating of the crystal due to DC noise taking into account the scaling with frequency and ion number. Here, only the three com modes are heated by 1.5 mK s-1, 1.5 mK s-1 and 6.1 mK s-1 and the total energy increase is J s-1. The low-frequency com mode in the direction shows the largest heating rate due to the frequency scaling of the DC electronic noise, see figure 1(a).
6 Implications on spectroscopy
Extended ion crystals are promising candidates for more stable optical clock operation [17, 18, 19, 20] and for quantum simulation, which are rapidly advancing towards higher dimensional crystals [21, 22]. While the approach of arrays of 1D crystals, with tens of ions each, allows for a high level of control of systematic shifts at the level [19, 20], clock spectroscopy in 3D crystals was proposed in [18] in view of the possible larger number of ions, ranging up to 1000 ions in a single crystal. The latter approach possibly will require cryogenic setups to handle the collisional heating of large Coulomb crystals, but also will require a careful investigation of the complex many-body dynamics of a large Coulomb crystal with motional modes (= phonons).
Here, we briefly discuss the consequences of rf-noise induced heating of ion Coulomb crystals on spectroscopy and coherent manipulation using the 3D crystal of 22 172Yb+ ions studied in section 5.3 as an example. For comparison, we first estimate second-order Doppler shifts due to the simple presence of the rf trapping field in the 3D crystal configuration. We then calculate the second-order Doppler shifts due to heating of motional modes via rf noise. Finally, we estimate the reduction and the fluctuation of the Rabi frequency, for individual ions inside the Coulomb crystal due to a finite thermal excitation of motional modes. Since the Rabi-frequency governs the excitation probability of the ions, spatial and temporal variations will limit the stability of a clock measurement. We consider both the residual excitation of modes after laser cooling, and the additional heating of motional modes of the 3D crystal during the clock interrogation time.
6.1 Second-order Doppler shift due to excess micromotion
The relative second-order Doppler shift (time dilation shift) due to micromotion can be calculated from at the ion position
| (13) |
where is the transition frequency, the electron charge, and is the speed of light. For the 22-ion crystal, the calculated relative shifts are all below . The highest values are obtained for ions and , which have the largest radial extension in the helix region at Vmm-1 (7 m radial distance from nodal line). For the inner 18 ions, forming the helix, the shift ranges between and . The use of specific ion species with a negative differential static scalar polarizability , enables the cancellation of two rf induced shifts. By operating at the ‘magic’ rf drive frequency, the time dilation shift and the scalar AC Stark shift can cancel each other [24, 25, 26, 27].
6.2 Thermal second-order Doppler shift
In a crystal of ions at finite temperature, the thermal motion of the ions within the vibrational modes induces a time dilation shift according to the mean squared ion velocities . These are obtained from the mode amplitudes and the mode temperature
| (14) |
For the 22-ion crystal of 172Yb+ cooled to Doppler temperature ( = 0.5 mK), the motional state occupation of, e.g., the radial and axial com mode are ph and ph, respectively. Assuming that the crystal is in thermal equilibrium, the relative time dilation shift for each of the ions is . At a crystal temperature of K, this shift reduces by two orders of magnitude to .
Due to heating by rf fields in the extended crystal, we obtain an increase in time dilation shift for ion , according to
| (15) |
This increase is inhomogeneous over the 22-ion crystal due to heating of particular modes only, and ranges between and per second for the individual ions, in the case of a quality factor of the resonant circuit. This increase would be higher by a factor of 2.4 for reduced quality factor of . Note that this dynamic shift can not be suppressed by using a magic drive frequency.
6.3 Debye-Waller-effect
The thermal motion of the ions also affects the coupling between the ions and light fields. Firstly, the motion along the propagation direction of the interrogation laser reduces the average Rabi frequency of the ion relative to the free atom Rabi frequency [33]
| (16) |
where is the Lamb-Dicke-factor of mode for the th ion. Secondly, it introduces a fluctuation of the Rabi frequency between subsequent experiments. The relative scatter from shot to shot (rms) can be calculated using modified zeroth-order Bessel functions [33]
| (17) |
For radial interrogation on the electric quadrupole transition at 411 nm (see figure 1) at the Doppler temperature ( ph), the Rabi frequencies for all ions are reduced to . For axial interrogation ( ph), they are all and the shot-to-shot scatter is about 100 % of the reduced Rabi frequency in both cases.
Even at ideal conditions of a crystal cooled to close to the motional ground state, the effect remains significant. At a crystal temperature of 5 K, the mean occupation number of the radial com modes is ph and that of the axial com mode is at ph. For radial interrogation, the Rabi frequencies range between 11 % () and 96 % () for the most affected and the least affected ion, respectively. A more favourable direction of interrogation is along the crystal axis. In this case, the Rabi frequencies range between 83% and 92% of the free atom Rabi frequency, and the shot-to-shot fluctuations are . Within 100 ms of rf-noise induced heating, the distribution becomes less homogeneous, as the Rabi frequencies reduce to between 54% and 75%, with a shot-to-shot noise between and 12 %, respectively, through coupling between radial and axial modes. Note that in a planar 2D radial crystal, the coupling of radial heating to axial modes can be strongly reduced[22].
7 Conclusion
We have experimentally studied heating effects from electric field noise on the motion of trapped ions, originating from both dc and rf electric fields. The previously reported low heating rate of about ph s-1 per ion at kHz due to noise of static electric fields [20] was not significantly changed over a time period of four years and could be confirmed for linear chains of up to 11 ions. The heating rate of the first out-of-phase mode of a m-crystal was below our measurement resolution of 0.2 ph s-1. The electric field noise spectral density () is in the lower range of values reported for other traps[52].
We have measured heating rates in the presence of excess micromotion by radially displacing a single ion and investigated the influence of the quality factor Q of the resonant circuit by reducing it from to . This led to a significant increase of motional heating of up to a factor 2.8 depending on the secular frequency. For a two-ion crystal, heating of the com mode is observed, while the out-of-phase mode is protected from rf-noise induced heating, even at a large radial displacement of m, confirming the suppression of this heating mechanism in the out-of-phase modes in linear ion chains.
Based on our experimental result and measured voltage noise spectral density, we have calculated the motional heating effect of rf noise on radially extended 2D and 3D crystals. The rf-noise induced heating of any mode is largely determined by the symmetry of the crystal and of the mode. Ions which are far away from the nodal line and have a large mode amplitude contribute most. In a 3D 22-ion helix-shaped crystal, the energy increases by mK s-1 due to rf noise dominated by a single mode (6.6 mK s-1) and is comparable to heating of com modes induced by dc electric field noise (1.5 mK s-1 for the radial modes and 6.1 mK s-1 for the axial mode).
The micromotion-induced fractional second-order Doppler shift is on the level of , which can be cancelled in some specific ion species by use of a magic trap rf drive frequency [24, 25, 26, 27]. The calculated rf-noise induced heating leads to an increase of the second-order Doppler shift of up to s-1, which is inhomogeneous across the crystal and cannot be suppressed by a magic frequency drive. By reducing the quality factor of the rf circuit from to , this shift increases by a factor of 2.4. Furthermore, the Debye-Waller effect leads to a dominating noise contribution to excitation of the atomic qubit. Therefore, the exact crystal configuration should be carefully chosen and ground state cooling is critical. The calculated spectroscopic properties and heating rates are highly dependent on the quality factor of the resonant circuit. Strong filtering of rf noise is required for precision spectroscopy of 2D and 3D crystals, such as is proposed for multi-ion clock-based experiments [18] and scalable quantum information processing [21, 22].
Appendix A Temperature determination of larger ion crystals
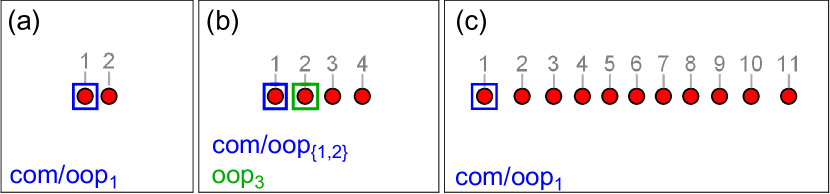
The ions are numbered from left to right as seen on the EMCCD camera in the experiment.
(a) Ion 1 (blue square) was selected for heating rate measurements of all modes in the two-ion crystal.
(b) In the four-ion crystal, ion 1 (blue square) was selected for heating rate measurements of the com and the first and second oop mode. For heating rate measurements of the fourth oop mode, the second ion (green square) was selected for better coupling.
(c) In the 11-ion crystal, ion 1 (blue square) was selected for heating rate measurements of the com and the first oop mode.
The heating rate measurements of larger ion chains were done with global addressing and single-ion state-detection. The ion selected for detection in the three measured crystals are shown in figure 8. Global addressing of ions on motional sidebands creates entangled states, which has to be taken into account for accurate temperature determination using resolved sideband thermometry. In this section, we elaborate on this effect and its influence on the measurements. For simplicity, only the derivation for a two-ion crystal is given.
The two involved electronic levels are denoted by and . The motional state of the centre-of-mass (com) mode at frequency is indicated with quantum number and that of the out-of-phase (oop) mode at with quantum number . For simplicity, we will only consider motional excitation of the com mode. The Lamb-Dicke parameter of the com mode for two ions is given by , where and the Rabi frequency of the carrier, first red- and blue sideband are , and , respectively. The interaction Hamiltonian for two ions that are both addressed with equal intensity is given by (neglecting terms of order )
| (18) |
where indicates index of the ion and is the phase of the laser at ion . If only resonant terms are taken into account, the Hamiltonian for the first red- and blue sideband are given by
| (19) | |||
| (20) |
respectively.
In the experiment, both ions are first prepared in the electronic ground state . By tuning the frequency to the first red sideband, the ions can be in one of four possible final states , , and taking either 0, 1 or 2 phonons out of the system. Similarly, the four possible final states of the blue sideband are , , or .
The time dependent evolution of the state can be found by using the propagator , which yields [42, 35]
| (24) | |||
| (28) |
where and .
In the experiment, only the state of one of the two ions was detected. Therefore, the excitation probability of the red- and blue sideband are given by and , respectively. Using (24) and (28) and a thermal Maxwell-Boltzmann state distribution the red and blue sideband amplitude can be written as
| (31) | |||
| (34) |
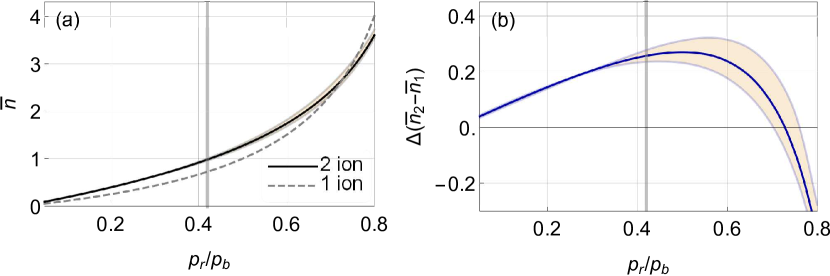
(a) Mean occupation number as a function of the red- and blue side ratio obtained from the numerical solution of the two-ion wavefunction (black curve) at optimal pi-time. The shaded area indicates the deviation from having a 10% different pulse time. For comparison, the curve of a single-ion (dashed line) is shown.
(b) Difference between the two-ion result and the single-ion relation. The shaded area indicates the deviation from having a 10% different pulse time.
The vertical grey line in (b) and (c) indicates the limit of below which we typically operate.
From (31) and (34), as a function of sideband ratio can be obtained numerically for a specific interrogation time , as can be seen in figure 9(a). Similar as in the experiment, the interrogation time is fixed to reach maximum excitation probability on the blue sideband directly after ground state cooling, when a typical temperature of is reached. However, the determined temperature is no longer independent of the interrogation time, as it is for a single ion. The deviation from having a 10% longer or shorter interrogation pulse is shown by the shaded area in figure 8. For comparison also the curve for a single-ion, as given by (1), is shown with the dashed line in figure 9. For our operating range, (grey vertical line in figure 9), the two-ion result is systematically higher than that of a single ion. In this range, it can be well approximated by a linear function, where the slope of the two-ion result is 35% larger than that of a single ion. The absolute difference between the two curves is shown in figure 9(b). The largest deviation occurs at and is ph. The shaded area indicates the calculated value with a different interrogation time.
The results show that when the state of only a single ion is detected, while sidebands are globally driven, a systematically too low temperature is obtained from the simple relation given by (1). In order to correct for this, the experimental data is scaled by a factor 1.35(4). The additional uncertainty on this factor stems from taking into account a uncertainty of the pulse area. Note that the correction factor of the oop mode is nearly equal to that of the com mode, because the normalized mode amplitude of the detected ion remains the same for both modes and the mode frequencies are almost equal.
By extending the Hamiltonian of (18), the same calculation can be carried out numerically to obtain correction factors for the com mode of the linear 4- and 11-ion linear chains. It yields correction factors of and for the com mode of 4 and 11 ions, respectively. The correction factors of all three oop modes of the linear 4-ion crystal were calculated by taking into account the ion-dependent Lamb-Dicke factors. The normalized mode amplitudes of the ions in 2nd oop mode are the same as those in the com mode, leading to a nearly equal correction factor of . Similarly, due to the choice of ion in the experiment (see figure 8), the correction factor of for the 1st and 3rd oop mode were nearly equal.
For the 11-ion oop mode, no correction factor was calculated due to its complexity. Instead, the error bar was increased to ph s-1, which is a relative error of %. We are confident that the heating rate of this mode is well within this range, as the calculated correction factors for the heating rate per ion of the other measured modes lead to a reduction of the measured values by % to %. Moreover, the other data points were all scaled down by their respective correction factor, thus the uncorrected heating rate obtained for the first oop mode of the 11-ion crystal is an overestimation.
Appendix B Influence on heating rates due to non-linear mode coupling
Heating due to non-linear coupling between the ground state (GS) cooled modes and Doppler cooled modes can be addressed by performing higher-order expansions of the mutual Coulomb interaction [39, 53, 54, 55] or using molecular dynamics simulations. Since we are treating large Coulomb systems with up to 22 ions, we decided to perform molecular dynamics simulations involving the full Coulomb potentials as described in the following. By determining the time evolution of ion motion, we verify that under the experimental conditions, there is no significant energy flow to the cooled modes from any other mode. We use the respective experimental trapping parameters for the 2, 4 and 11-ion linear crystal configurations investigated in section 3.3. We initially sample all mode velocities from a Maxwell-Boltzmann distribution at around 1 mK. To simulate GS cooling, we set the initial mode-velocities of the GS cooled modes to . We propagate the ion crystals in time and deduce the average kinetic energy of the normal modes every 50 ms by integration of their Fourier spectra, using a time sample of ms with steps. Details about the method can be found in [56]. As the strength of the non-linear coupling depends on the mode energies of the Doppler-cooled modes, we average over 20 simulation runs for each crystal size using different initial conditions in each run.
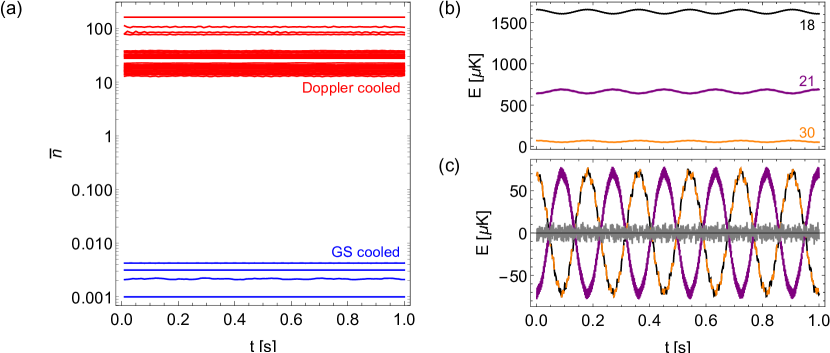
(a) Mode occupation numbers over time for an 11-ion crystal at mK (red lines), where the four highest-frequency radial modes (modes 1 through 4) along the direction have been set to initial velocity (blue lines). For better visibility, ph is added to of the ground state (GS) cooled modes to shift them upwards. Each line represents an average over 20 simulation runs.
(b) Individual simulation run of mode temperatures is shown for three of the Doppler-cooled modes from (a) as an example of non-linear mode coupling in the 11-ion crystal (see text).
(c) Amplitudes of energy oscillations during mode coupling. The energy of mode 18 and of mode 30 are added and multiplied by 2 (black-orange dashed line), the energy of mode 21 is multiplied by 3 (solid purple line), according to (35). For each curve, the mean of the curve was subtracted to center them around zero. To indicate energy conservation, the sum of the two curves is also shown (grey line).
For both the two-ion crystal and the four-ion crystal, where all radial modes in the directions with the strongest confinement () are cooled, we find no significant coupling between the GS cooled modes and Doppler cooled modes. In the case of the 11-ion crystal, only the four highest-frequency radial modes in direction were cooled. Figure 10(a) shows the calculated mean motional state occupation of all motional modes over a period of a second. For the Doppler-cooled modes (red lines), the mean motional state occupation ranges between ph and ph. For better visibility, the plots of the four GS cooled modes (blue lines) are shifted upwards by ph. During 1 second, the mean motional state occupation of these four modes varies by ph.
We see non-linear coupling between some of the Doppler cooled modes, especially in the low frequency range. As an example, figure 10(b) shows the calculated mode energies as function of time for a single simulation run. For clarity, only the energy of the three coupled modes are depicted. Two of them are radial modes at kHz (black line) and at kHz (purple) along the weaker confined direction and the third mode is an axial mode at kHz (orange). The index identifies the mode, sorted from highest (1) to lowest (33) mode frequency. Periodic energy exchange between the three modes is observed, where energy is transferred from mode 18 and 30, oscillating in phase with each other, to mode 21, oscillating out-of-phase. In this case, two phonons of both mode 18 and mode 30 are converted resonantly into three phonons of mode 21 and reversely,
| (35) |
This is illustrated in figure 10(c), where the curves from (b) are centred around zero by subtracting the mean mode energy. The energies of mode 18 and 30 are summed and multiplied by 2 (black-orange dashed line) according to (35), while the energy of mode 21 is multiplied by 3 (purple line). The sum of the amplitudes (grey line) fluctuates around zero indicating energy conservation. The amount of energy exchanged in this process corresponds to two phonons at kHz, which can be relevant, if heating rates of the weaker confined radial direction () or of the axial modes are considered. Note that we only measured heating rates along the direction and were not bothered by this effect. In addition, a slight change of confinement shifts the secular frequencies away from this resonance [39].
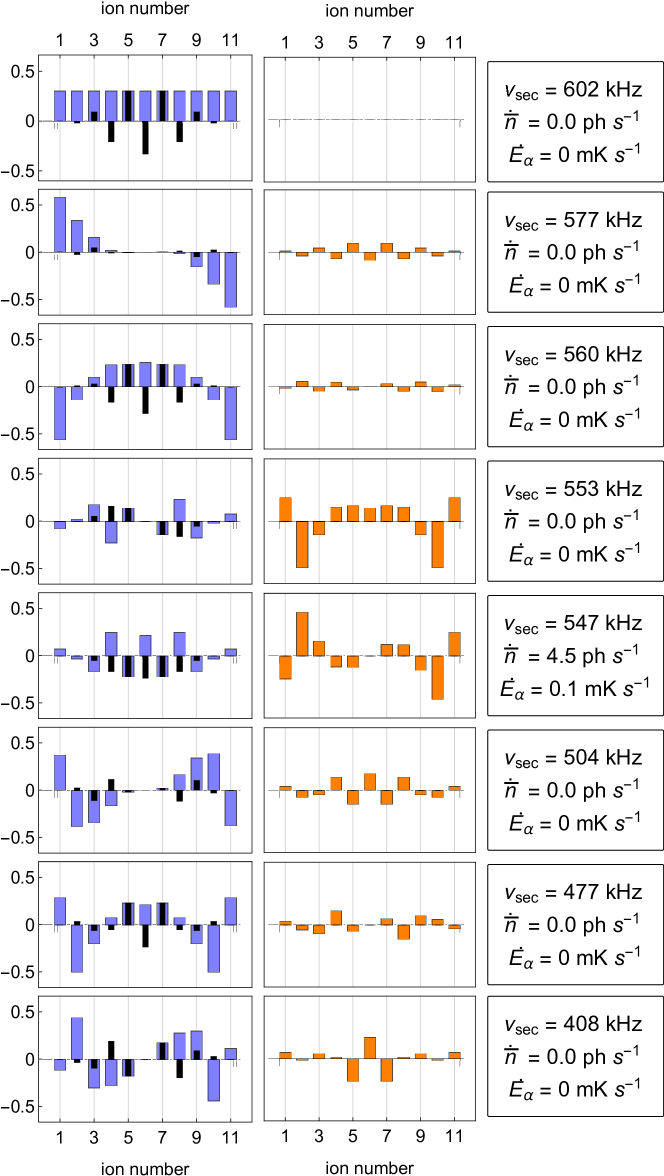
Appendix C All modes of the 11-ion crystal
(a) Crystal geometry of the zig-zag crystal in two directions.
(b) Mode amplitude of the individual ions in two directions and the corresponding force contributions. The frequency of the mode and the calculated heating rates are given both in phonon number and energy transfer in the text box on the right.
References
References
- [1] MS Safronova, D Budker, D DeMille, DFJ Kimball, A Derevianko, and CW Clark. Search for new physics with atoms and molecules. Rev. Mod. Phys., 90:025008, Jun 2018.
- [2] T Rosenband, DB Hume, PO Schmidt, CW Chou, A Brusch, L Lorini, WH Oskay, RE Drullinger, TM Fortier, JE Stalnaker, SA Diddams, WC Swann, NR Newbury, WM Itano, DJ Wineland, and JC Bergquist. Frequency Ratio of Al+ and Hg+ Single-Ion Optical Clocks; Metrology at the 17th Decimal Place. Science, 319:1808–1812, 2008.
- [3] N Huntemann, B Lipphardt, C Tamm, V Gerginov, S Weyers, and E Peik. Improved limit on a temporal variation of from comparisons of Yb+ and Cs atomic clocks. Phys. Rev. Lett., 113:210802, Nov 2014.
- [4] RM Godun, PBR Nisbet-Jones, JM Jones, SA King, LAM Johnson, HS Margolis, K Szymaniec, SN Lea, K Bongs, and P Gill. Frequency ratio of two optical clock transitions in 171Yb+ and constraints on the time variation of fundamental constants. Phys. Rev. Lett., 113:210801, Nov 2014.
- [5] A Derevianko and M Pospelov. Hunting for topological dark matter with atomic clocks. Nat. Phys., 10(12):933–936, 2014.
- [6] C Delaunay, R Ozeri, G Perez, and Y Soreq. Probing atomic Higgs-like forces at the precision frontier. Phys. Rev. D, 96:093001, Nov 2017.
- [7] VV Flambaum, AJ Geddes, and AV Viatkina. Isotope shift, nonlinearity of King plots, and the search for new particles. Phys. Rev. A, 97:032510, Mar 2018.
- [8] JC Berengut, D Budker, C Delaunay, VV Flambaum, C Frugiuele, E Fuchs, C Grojean, R Harnik, R Ozeri, G Perez, and Y Soreq. Probing new long-range interactions by isotope shift spectroscopy. Phys. Rev. Lett., 120:091801, Feb 2018.
- [9] FW Knollmann, AN Patel, and SC Doret. Part-per-billion measurement of the SD5/2 electric-quadrupole-transition isotope shifts between 42,44,48Ca+ and 40Ca+. Phys. Rev. A, 100:022514, Aug 2019.
- [10] C Solaro, S Meyer, K Fisher, JC Berengut, E Fuchs, and M Drewsen. Improved isotope-shift-based bounds on bosons beyond the standard model through measurements of the 2D3/2 - 2D5/2 interval in Ca+. Phys. Rev. Lett., 125:123003, Sep 2020.
- [11] I Counts, J Hur, DPL Aude Craik, H Jeon, C Leung, JC Berengut, A Geddes, A Kawasaki, W Jhe, and V Vuletić. Evidence for nonlinear isotope shift in Yb+ search for new boson. Phys. Rev. Lett., 125(12):123002, 2020.
- [12] JC Berengut, C Delaunay, A Geddes, and Y Soreq. Generalized King linearity and new physics searches with isotope shifts. Phys. Rev. Research, 2:043444, Dec 2020.
- [13] VA Dzuba, VV Flambaum, MS Safronova, SG Porsev, T Pruttivarasin, MA Hohensee, and H Häffner. Strongly enhanced effects of Lorentz symmetry violation in entangled Yb+ ions. Nat. Phys., 12(5):465–468, 2016.
- [14] R Shaniv, R Ozeri, MS Safronova, SG Porsev, VA Dzuba, VV Flambaum, and H Häffner. New methods for testing Lorentz invariance with atomic systems. Phys. Rev. Lett., 120:103202, Mar 2018.
- [15] C Sanner, N Huntemann, R Lange, C Tamm, E Peik, MS Safronova, and SG Porsev. Optical clock comparison for Lorentz symmetry testing. Nature, 567(7747):204–208, 2019.
- [16] R Lange, N Huntemann, JM Rahm, C Sanner, H Shao, B Lipphardt, C Tamm, S Weyers, and E Peik. Improved limits for violations of local position invariance from atomic clock comparisons. Phys. Rev. Lett., 126:011102, Jan 2021.
- [17] C Champenois, M Marciante, J Pedregosa-Gutierrez, M Houssin, M Knoop, and M Kajita. Ion ring in a linear multipole trap for optical frequency metrology. Phys. Rev. A, 81:043410, Apr 2010.
- [18] K Arnold, E Hajiyev, E Paez, CH Lee, MD Barrett, and JJ Bollinger. Prospects for atomic clocks based on large ion crystals. Phys. Rev. A, 92:032108, Sep 2015.
- [19] N Herschbach, K Pyka, J Keller, and TE Mehlstäubler. Linear Paul trap design for an optical clock with Coulomb crystals. Appl. Phys. B, 107(4):891–906, Jun 2012.
- [20] J Keller, T Burgermeister, D Kalincev, A Didier, AP Kulosa, T Nordmann, J Kiethe, and TE Mehlstäubler. Controlling systematic frequency uncertainties at the level in linear Coulomb crystals. Phys. Rev. A, 99:013405, Jan 2019.
- [21] J Zhang, G Pagano, PW Hess, A Kyprianidis, P Becker, H Kaplan, AV Gorshkov, Z-X Gong, and C Monroe. Observation of a many-body dynamical phase transition with a 53-qubit quantum simulator. Nature, 551(7682):601–604, 2017.
- [22] P Richerme. Two-dimensional ion crystals in radio-frequency traps for quantum simulation. Phys. Rev. A, 94:032320, Sep 2016.
- [23] TR Tan, R Kaewuam, KJ Arnold, SR Chanu, Z Zhang, MS Safronova, and MD Barrett. Suppressing inhomogeneous broadening in a lutetium multi-ion optical clock. Phys. Rev. Lett., 123:063201, Aug 2019.
- [24] DJ Berkeland, JD Miller, JC Bergquist, WM Itano, and DJ Wineland. Minimization of ion micromotion in a Paul trap. J. App. Phys., 83(10):5025–5033, 1998.
- [25] MD Barrett. Developing a field independent frequency reference. New J. Phys., 17(5):053024, May 2015.
- [26] P Dubé, AA Madej, M Tibbo, and JE Bernard. High-accuracy measurement of the differential scalar polarizability of a 88Sr+ clock using the time-dilation effect. Phys. Rev. Lett., 112:173002, Apr 2014.
- [27] Y Huang, H Guan, P Liu, W Bian, L Ma, K Liang, T Li, and K Gao. Frequency comparison of two 40Ca+ optical clocks with an uncertainty at the level. Phys. Rev. Lett., 116:013001, Jan 2016.
- [28] K Pyka, N Herschbach, J Keller, and TE Mehlstäubler. A high-precision segmented Paul trap with minimized micromotion for an optical multiple-ion clock. Appl. Phys. B, 114(1-2):231–241, 2014.
- [29] T Burgermeister. Development and characterization of a linear ion trap for an improved optical clock performance. PhD thesis, QUEST-Leibniz-Forschungsschule der Gottfried Wilhelm Leibniz Universität Hannover, QUEST LUH, 2019.
- [30] J Keller. Spectroscopic characterization of ion motion for an optical clock based on Coulomb crystals. PhD thesis, QUEST-Leibniz-Forschungsschule der Gottfried Wilhelm Leibniz Universität Hannover, QUEST LUH, 2015.
- [31] RJ Hendricks, JL Sørensen, C Champenois, M Knoop, and M Drewsen. Doppler cooling of calcium ions using a dipole-forbidden transition. Phys. Rev. A, 77:021401, Feb 2008.
- [32] F Lindenfelser, M Marinelli, V Negnevitsky, S Ragg, and JP Home. Cooling atomic ions with visible and infra-red light. New J. Phys., 19(6):063041, Jun 2017.
- [33] DJ Wineland, CR Monroe, WM Itano, D Leibfried, BE King, and DM Meekhof. Experimental issues in coherent quantum-state manipulation of trapped atomic ions. J. Res. Natl. Inst. Stand. Technol., 103(3):259–328, 1998.
- [34] D Leibfried, R Blatt, C Monroe, and DJ Wineland. Quantum dynamics of single trapped ions. Rev. Mod. Phys., 75(1):281, 2003.
- [35] BE King, CS Wood, CJ Myatt, QA Turchette, D Leibfried, WM Itano, C Monroe, and DJ Wineland. Cooling the collective motion of trapped ions to initialize a quantum register. Phys. Rev. Lett., 81:1525–1528, Aug 1998.
- [36] JP Home. Chapter 4 - quantum science and metrology with mixed-species ion chains. In E Arimondo, PR Berman, and CC Lin, editors, Advances in Atomic, Molecular, and Optical Physics, volume 62 of Advances In Atomic, Molecular, and Optical Physics, pages 231 – 277. Academic Press, 2013.
- [37] BC Sawyer, JW Britton, and JJ Bollinger. Spin dephasing as a probe of mode temperature, motional state distributions, and heating rates in a two-dimensional ion crystal. Phys. Rev. A, 89:033408, Mar 2014.
- [38] R Lechner, C Maier, C Hempel, P Jurcevic, P Ben Lanyon, T Monz, M Brownnutt, R Blatt, and CF Roos. Electromagnetically-induced-transparency ground-state cooling of long ion strings. Phys. Rev. A, 93:053401, May 2016.
- [39] C Marquet, F Schmidt-Kaler, and DFV James. Phonon–phonon interactions due to non-linear effects in a linear ion trap. Appl. Phys. B, 76:199–208, 2003.
- [40] R Alheit, S Kleineidam, F Vedel, M Vedel, and G Werth. Higher order non-linear resonances in a Paul trap. International Journal of Mass Spectrometry and Ion Processes, 154(3):155 – 169, 1996.
- [41] IA Boldin, A Kraft, and C Wunderlich. Measuring anomalous heating in a planar ion trap with variable ion-surface separation. Phys. Rev. Lett., 120:023201, Jan 2018.
- [42] JP Home. Entanglement of Two Trapped-Ion Spin Qubits. PhD thesis, Linacre College, Oxford, 2000.
- [43] G Birkl, S Kassner, and H Walther. Multiple-shell structures of laser-cooled 24 Mg+ ions in a quadrupole storage ring. Nature, 357(6376):310–313, 1992.
- [44] JP Schiffer. Phase transitions in anisotropically confined ionic crystals. Phys. Rev. Lett., 70:818–821, Feb 1993.
- [45] DHE Dubin. Theory of structural phase transitions in a trapped Coulomb crystal. Phys. Rev. Lett., 71:2753–2756, Oct 1993.
- [46] RB Blakestad, C Ospelkaus, AP van Devender, JM Amini, J Britton, D Leibfried, and DJ Wineland. High fidelity transport of trapped-ion qubits through an X-junction trap array. Phys. Rev. Lett., 102:153002, 2009.
- [47] HG Dehmelt. Radiofrequency spectroscopy of stored ions I: Storage. volume 3 of Adv. At. Mol. Phys., pages 53 – 72. Academic Press, 1968.
- [48] DFV James. Quantum dynamics of cold trapped ions with application to quantum computation. Appl. Phys. B, 66:181, 1998.
- [49] J Keller, HL Partner, T Burgermeister, and TE Mehlstäubler. Precise determination of micromotion for trapped-ion optical clocks. J. App. Phys., 118(10):104501, 2015.
- [50] JA Sedlacek, J Stuart, W Loh, R McConnell, CD Bruzewicz, JM Sage, and J Chiaverini. Method for determination of technical noise contributions to ion motional heating. J. App. Phys., 124(21):214904, 2018.
- [51] VL Ryjkov, X Zhao, and HA Schuessler. Simulations of the rf heating rates in a linear quadrupole ion trap. Phys. Rev. A, 71:033414, Mar 2005.
- [52] M Brownnutt, M Kumph, P Rabl, and R Blatt. Ion-trap measurements of electric-field noise near surfaces. Rev. Mod. Phys., 87:1419–1482, Dec 2015.
- [53] CF Roos, T Monz, K Kim, M Riebe, H Häffner, DFV James, and R Blatt. Nonlinear coupling of continuous variables at the single quantum level. Phys. Rev. A, 77:040302, Apr 2008.
- [54] XR Nie, CF Roos, and DFV James. Theory of cross phase modulation for the vibrational modes of trapped ions. Phys. Lett. A, 373(4):422–425, 2009.
- [55] J Kiethe, L Timm, H Landa, D Kalincev, G Morigi, and TE Mehlstäubler. Finite temperature spectrum at the symmetry-breaking linear-zigzag transition. arXiv:2012.11236, 2020.
- [56] HA Fürst, NV Ewald, T Secker, J Joger, T Feldker, and R Gerritsma. Prospects of reaching the quantum regime in Li-Yb+ mixtures. J. Phys. B: At. Mol. Opt. Phys., 51(19):195001, Sep 2018.