1INAF Osservatorio Astrofisico di Asiago, Via Osservatorio 8, 36012 Asiago, Italy.
\affilTwo2INAF Osservatorio Astronomico di Padova, Vicolo dell’Osservatorio 5, 35122 Padova, Italy.
\affilThree3 Dept. of Physics & Astronomy, The Johns Hopkins University, 3400 N. Charles St., Baltimore, MD 21218, USA
\affilFour4 Dept. of Physics and Astronomy, University of Padova, Vicolo dell’Osservatorio 3, 35122 Padova, Italy
\affilFive5 INAF-Osservatorio Astronomico di Capodimonte, Salita Moiariello 16, 80131 Napoli, Italy
\affilSix6 University of Calgary, 2500 University Drive NW, Calgary, Alberta, Canada
\affilSeven7 Centre for Astrophysics and Supercomputing, Swinburne University of Technology, Hawthorn, Victoria 3122, Australia
\affilEight8 INAF-IASF, Via A. Curti, 12, 20133 Milano (Italy)
Dorado and its member galaxies II.
A UVIT picture of the NGC 1533 substructure
Abstract
Dorado is a nearby (17.69 Mpc) strongly evolving galaxy group in the Southern Hemisphere. We are investigating the star formation in this group. This paper provides a FUV imaging of NGC 1533, IC 2038 and IC 2039, which form a substructure, south west of the Dorado group barycentre. FUV CaF2-1 UVIT-Astrosat images enrich our knowledge of the system provided by GALEX. In conjunction with deep optical wide-field, narrow-band H and 21-cm radio images we search for signatures of the interaction mechanisms looking in the FUV morphologies and derive the star formation rate. The shape of the FUV luminosity profile suggests the presence of a disk in all three galaxies. FUV emission is detected out to the optical size for IC 2038, and in compact structures corresponding to H and H ii bright features in NGC 1533. A faint FUV emission, without an optical counterpart, reminiscent of the H i structure that surrounds the outskirts of NGC 1533 and extends up to IC 2038/2039, is revealed above the local background noise.
keywords:
Ultraviolet: galaxies – Galaxies: elliptical and lenticular, cD – Galaxies: spiral – Galaxies: interaction – Galaxies: evolutionroberto.rampazzo@inaf.it
31 October 2020
12.3456/s78910-011-012-3 \artcitid#### \volnum000 0000 \pgrange1– \lp1
1 Introduction
One of the breakthrough provided by the Galaxy Evolution Explorer (GALEX hereafter) (Martin et al. 2005, Morrissey et al. 2007) is the direct evidence of galaxy transformation in groups. UV - optical colour magnitude diagrams (CMDs hereafter) highlighted an intermediate region, the green valley, populated by transforming galaxies (see e.g. Salim et al. 2007, Schawinski et al. 2007) located between the sequence of red galaxies, mostly evolved early-type (Es+S0s=ETGs hereafter), and the blue cloud composed of late-type (LTGs hereafter), star forming galaxies. Ranking groups according to their blue vs. red sequence and green valley galaxy populations, UV - optical CMDs contribute to correlate the group structure, kinematics and dynamics to its members evolutionary phase. Marino et al. (2010, 2013) investigated loose groups, rich of LTGs, analogs of our Local Group. This kind of groups lack a well defined red sequence. At odd, less dispersed groups with an increasing fraction of ETGs start to develop a galaxy population inhabiting both the red sequence and the green valley. Very rich groups, in an advanced stage of virialization, like NGC 5486 group, the third richest association in the nearby universe after Virgo and Fornax, show a well developed red sequence and a still rich green valley (Marino et al. 2016, Mazzei et al 2014b, Mazzei et al. 2019 and references therein). The enrichment of the red sequence and of the green valley traces the transition from loose yet un-virialized groups to rich, more compact and virialized ones (see e.g. Rampazzo et al. 2018).
Driven by the gravitational force, that collapses groups and makes galaxies to interact, mechanisms leading to a galaxy morphological metamorphosis can either quench or re-ignite the star formation (SF). Mechanisms involved are of several types and seem to depend on the environment density (see e.g Boselli et al. 2006, Boselli et al. 2014). Mergers can transform spirals into ellipticals and S0s (see e.g. Toomre & Toomre 1972, Barnes 2002, Mazzei et al. 2014a and references therein) and quench SF by ejecting the interstellar medium via supernovæ, AGN or shock-driven winds (see e.g. Di Matteo et al. 2015 and references therein). Ram-pressure, that may strip the gas reservoirs is supposed to work mostly in rich environments (Boselli et al. 2014, Ramatsoku et al. 2019), but there are evidences (e.g. in H i ) that it also works for groups (Bureau et al. 2002, Kantharia et al. 2005). There are examples of mass–transfer between gas rich and gas poor companion galaxies, e.g physical pairs composed of a LTG and an ETGs, that may re-fuel SF (see e.g. Domingue et al. 2003, Keel et al. 2004, Chung et al. 2006, Plana et al. 2017 ).
In this paper, we focus on the nearby Dorado group in the Southern Hemisphere (RA=64.3718 [deg], Dec=-55.7811 [deg]) as defined by (Kourkchi & Tully (2017; see also Firth et al. 2006 and references therein). Throughout the paper we adopt 17.69 Mpc as the distance of all Dorado candidate members. Dorado CMD is described by Cattapan et al. (2019, their Figure 1). The red sequence of the group includes several ETGs. A set of intermediate luminosity member galaxies is still crossing the green valley. Basically only NGC 1566, a bright grand design spiral, is still located in the blue cloud. With respect to evolved groups (e.g. NGC 5486, see Marino et al. 2016) Dorado seems to be in an earlier and active evolutionary phase. Several indications support this view like the group clumpy structure. A compact group, SGC 0414-5559 (Iovino 2002) is located at the barycentre of the group as defined by Kourkchi & Tully (2017). The compact group is dominated by two ETGs, NGC 1549 an E and NGC 1553 an S0, both showing a wide shell structure. The Dorado group members morphology shows indeed the nearly ubiquitous presence of interaction signatures such as shells, asymmetries, tails. (see e.g. Malin & Carter 1988, Cattapan et al. 2019). Star forming rings have been also revealed in several ETGs (Rampazzo et al. 2020). Dorado is an atomic gas rich group. Nearly half of the entire H i content of the Dorado group, 3.51010 M⊙, is located in the spiral member NGC 1566, although H i has been also detected in several other members, independently from their morphological classification (Kilborn et al. 2005, 2009). Rampazzo et al. (2020), presented their H+[N II] study aiming at investigating the star formation rate (SFR hereafter) of the Dorado backbone galaxies. They found that SFR in LTGs is fading while in ETGs is not yet shut-down. Rampazzo et al. (2020) suggested that mechanisms such as gas stripping and gas accretion, through galaxy-galaxy interaction, seem relevant in the evolutionary phase of Dorado.
| Field | ID | RA | Dec. | FUV | Vhel | Morpho. |
|---|---|---|---|---|---|---|
| centre | source | (J2000) | (J2000) | [mag] | km s-1 | Type |
| A | IC 2038 | 04 08 53.76 | -55 59 22.2 | 17.250.02* | 712 | 7.0 |
| IC 2039 | 04 09 02.37 | -56 00 42.1 | 19.980.07* | 817 | -3.1 | |
| B | NGC 1533 | 04 09 51.84 | -56 07 06.6 | 16.900.021 | 764 | -2.5 |
Column 1: UVIT field. Column 2: source identification. Columns 3 and 4 provides Right Ascension and Declination of the sources. Column 5 lists the FUV total integrated magnitudes from GALEX Archive (indicated with an *) and reported in NED (indicated with 1). Columns 6 and 7 report the heliocentric radial velocity and the galaxy morphological Type, respectively, from Kourkchi & Tully (2017).
This work complements the Rampazzo et al. (2020) study, using FUV CaF2-1 (1300-1800 Å) broad filter (similar to GALEX FUV; see Tandon et al. 2017) observations obtained with Astrosat-UVIT of the Dorado members. The UVIT targets partly cover the galaxy set observed in H+[N II] by Rampazzo et al. (2020). In this paper we investigate the sub-structure, SW of the Dorado barycentre, formed by NGC 1533, IC 2038 and IC 2039. Our goal is to analyze the FUV morphological structure of galaxies in this sub-structure and the relation between H regions and the FUV emission. H emission has been found not only in the Scd galaxy IC 2038 but also in the E-S0 galaxy NGC 1533 (Rampazzo et al. 2020).
The paper plan is the following. In Section 2 we summarize our knowledge about the NGC 1533 sub-structure. UVIT observations and the reduction are presented in Section 3. In Section 4 the photometric analysis and the comparison with GALEX observations are presented. Results and the discussion in Section 5 are given in Section 6, respectively.
2 NGC 1533 substructure and the Dorado group
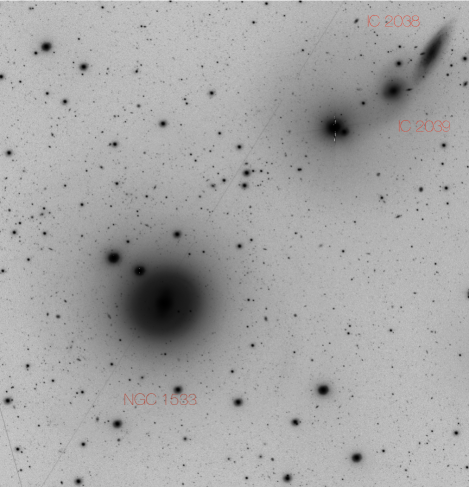
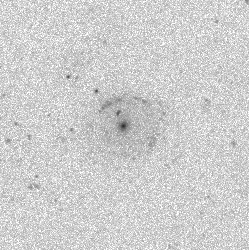
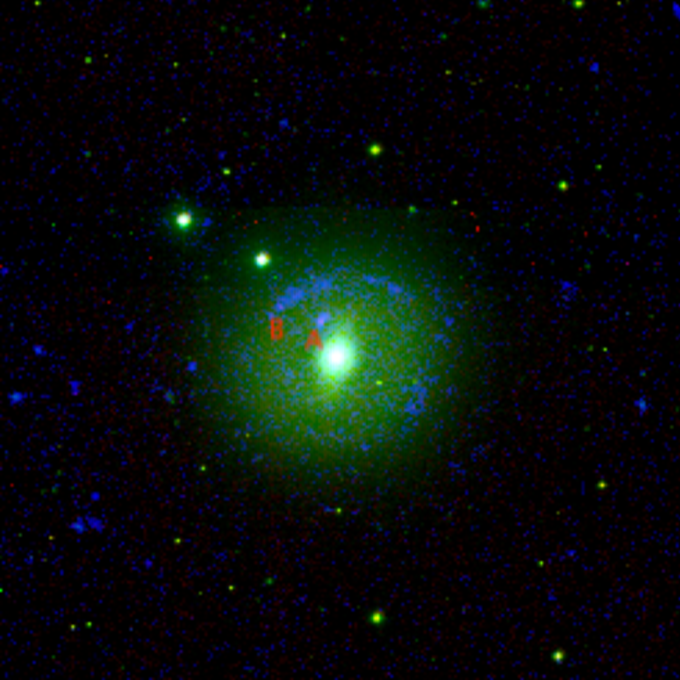
According to Kourkchi & Tully (2017), Dorado has an average redshift of 123089 km s-1 and a velocity dispersion of 242 km s-1. NGC 1533 and the pair IC 2038/39 form a sub-structure of the group with an average redshift of 76443 km s-1 (see Table 1). Figure 1 shows a deep image of the NGC 1533 sub-structure in the SDSS -band ( mag arcsec-2) obtained within the VST Early-type GAlaxy Survey (VEGAS111Visit the website http://www.na.astro.it/vegas/VEGAS/Welcome.html) (see e.g. Capaccioli et al. 2015). This substructure is located at the south west periphery of Dorado group barycentre formed by the SCG 0414-5559 compact group, well separated, both in radial velocity and in projection, from other member candidates.
NGC 1533 has been investigated with GALEX by Marino et al. (2011a,2011b). Rampazzo et al. (2017) investigated this galaxy with Swift. All these studies evidenced an outer FUV bright ring. In correspondence to the FUV ring, Rampazzo et al. (2020) found some H complexes. Moreover they found that while the SFR is enhanced in NGC 1533 it is depressed in IC 2038, if compared with the general sample of ETGs (Gavazzi 2018) and of Spirals (James et al. 2004), respectively. Rampazzo et al. (2020) found that in IC 2038 H ii regions are distributed along the galaxy body, which appears slightly elongated towards the companion galaxy, IC 2039, in the SE direction.
More recently, deep optical observations, in and bands, of NGC 1533 and IC 2038/39 have been analysed by Cattapan et al. (2019) using the VLT Survey Telescope (VST) at the European Southern Observatory, Chile. They evidenced a large disk around NGC 1533 and several tails suggesting that NGC 1533 and the nearby pair are evolving together (Cattapan et al. 2019).
The NGC 1533 Dorado substructure has been mapped in H i by Ryan-Weber et al. (2004) (see also Kilborn et al. 2005,2009) showing and extended H i structure that extends from 1533 up to IC 2038/39 pair. Werk et al. (2008,2010) reported that there are some star forming regions well outside NGC 1533 with the same radial velocity as the H i gas revealed by Ryan-Weber et al. (2004; see their Figure 7 for J0409-56). The narrow-band H+[N II] study by Rampazzo et al. (2020) detected three H regions in correspondence of the regions detected by Werk et al. (2010) confirming that such outer H ii regions belong to NGC 1533 sub-structure.
In this context, the study of the NGC 1533 sub-structure is relevant both for the general understanding of the evolution of gas-rich merging events and for the study of local SF mechanisms.
| Field | Obs ID | Observing date | Exp. Time | Target |
|---|---|---|---|---|
| ID | [s] | ID | ||
| A | A07_010T04_9000003220 | October 5, 2019 | 6481.278 | IC 2038 |
| B | A07_010T05_9000003236 | October 16, 2019 | 6628.734 | NGC 1533 |
Field identification in col. 2 refers to the proposal A07010 (PI. R. Rampazzo). Col. 3 and col. 4 report the observing date and the total reduced exposure time. In col. 5 is quoted the central target. The nominal zero point magnitude of the FUV channel and the physical plate scale are 18.08 mag and 333 respectively, as reported in Tandon et al. (2017).
3 Observations and reduction
Astrosat is a multi-wavelength satellite that has been launched by the Indian Space Research Organization on September 28, 2015. The ultraviolet-optical telescope on board is the Ultra-Violet Imaging Telescope facility UVIT (Tandon et al. 2017). It is composed of two Ritchey-Chretien telescopes with 37.5 cm aperture, a circular field of view of 28’ diameter, observing simultaneously one in FUV (1300-1800 Å) and the other both in NUV (2000-3000 Å) and optical band, VIS (3200-5500 Å), by means of a beam-splitter directing NUV and VIS to individual cameras.
Since the NUV channel was not operative during our runs, observations have been performed with the FUV channel only. We used the full field of view, in photon counting mode with the Filter F148W CaF2 (=1481, =500Å). Photons are counted on a planar CMOS array at approximately 28 Hz and stacked on the ground with shift and add algorithms (see for details Kumar et al. 2012, Postma et al. 2011, Postma & Leahy 2017, Tandon et al. 2017) with the astrometric world coordinate solution solved automatically by a trigonometric algorithm (Postma & Leahy 2020).
Table 2 reports the relevant characteristics of our UVIT observations. Astrosat-UVIT observations are the result of the proposal A07_010 (PI R. Rampazzo) and cover the south west part of Dorado, in particular Astrosat-UVIT fields contain IC 2038 and IC 2039 (Field A) and NGC 1533 (Field B).
4 Data Analysis and comparison with the literature
In this section we present the data analysis performed and the comparison with the current literature mainly from GALEX study. Original images with 0416 per sub-pixel have been rebinned 44 providing a final scale of 1664 px-1.
4.1 Integrated FUV magnitudes
4.2 Surface photometry
The surface photometry is obtained using the IRAF task ELLIPSE (Jedrzejewski 1987). In obtaining the surface brightness profile, ELLIPSE accounts for the geometrical information contained in the isophotes and allows the variation of the ellipticity, and of the position angle, , along the ellipse major axis (). IN addition, ELLIPSE provides measure of the isophotal shape parameter, the so-called parameter from the fourth cosine component of the Fourier analysis of the fitted ellipse, allowing to distinguish between boxy () and discy (0) isophotes (Bender et al. 1988). This approach, widely used with optical images of ETGs, has been adopted to investigate GALEX FUV data by Jeong et al (2009) and Marino et al. (2011b). FUV geometric profiles have not been provided by the above papers.
In fitting isophotes we allowed , and PA to variate with the galacto-centric distance, in order to obtain a good description of the FUV luminosity distribution. Our FUV images either show irregular peculiar features (NGC 1533), clumpy and spiral features (IC 2038) or have a low signal-to-noise (IC 2039). This is the reason for which we provide in Table 3 only the average ellipticity, and position angle, , (colums 4 and 5 respectively) of the galaxy. In presence of irregular, peculiar features, sudden variations in both and are expected and, in particular, the isophotal shape parameter, , looses its physical meaning.
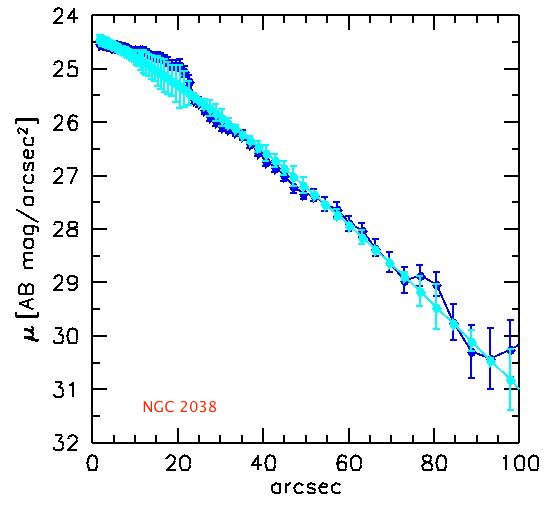
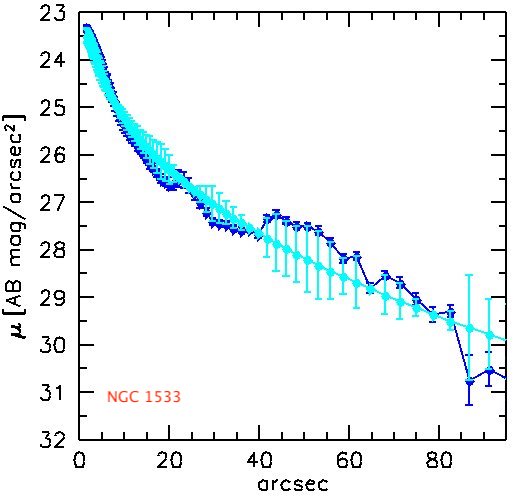
The pair IC 2038/IC 2039 has not been previously investigated with GALEX. Marino et al. (2011b) obtained the surface brightness profiles NGC 1533. Figure 3 shows the comparison between the Marino et al. (2011b) and our luminosity profile. The luminosity profiles compare quite well outside 30′′, suggesting that there is a very small, if any, zero point effect, while the central region differs significantly. The reason of such a difference in the central part is not entirely clear, although in FUV the GALEX PSF FWHM is 4.2′′with respect to 1.5′′of UVIT (see Morrissey et al. 2007 and Tandom et al. 2017). Substructures on spatial scales (projected on the sky) kpc are washed out in the GALEX profile, but are picked up in the UVIT data. In particular, the FUV knot that peaks at 25′′(indicated as A in Figure 5) is clearly smoothed out in Marino et al. (2011b), suggesting a significant role played by the PSF in driving the GALEX surface photometry.
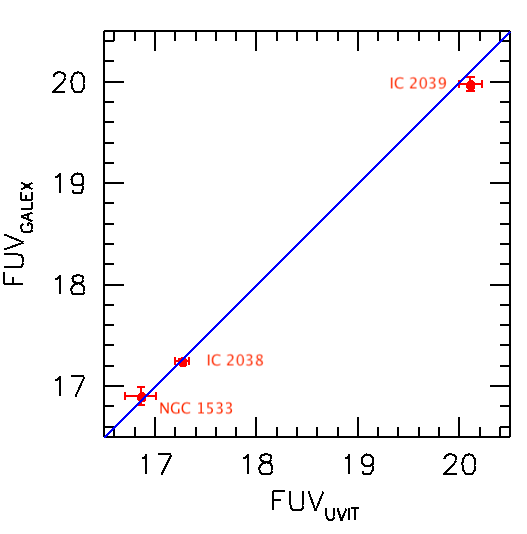
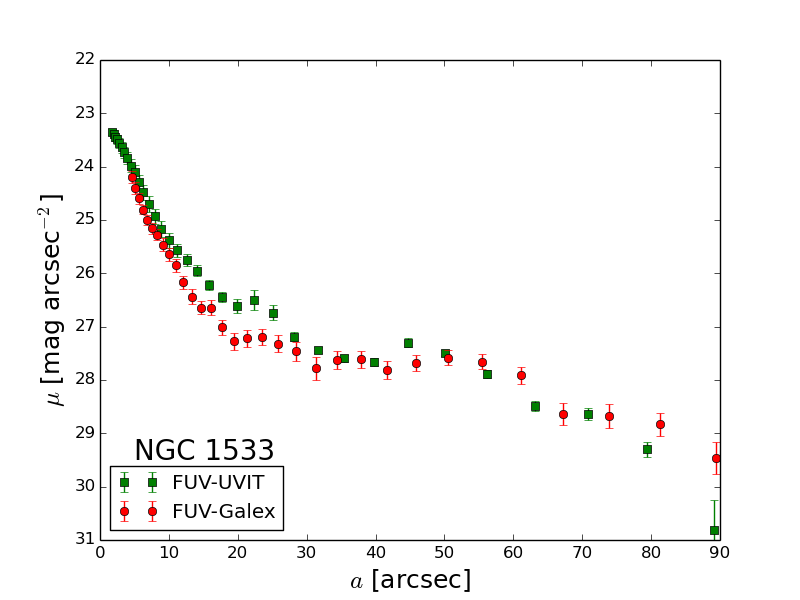
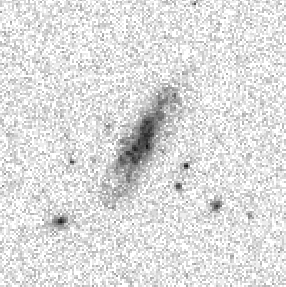
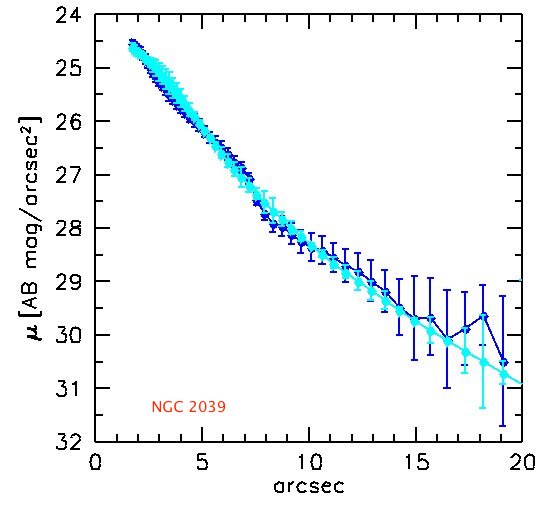
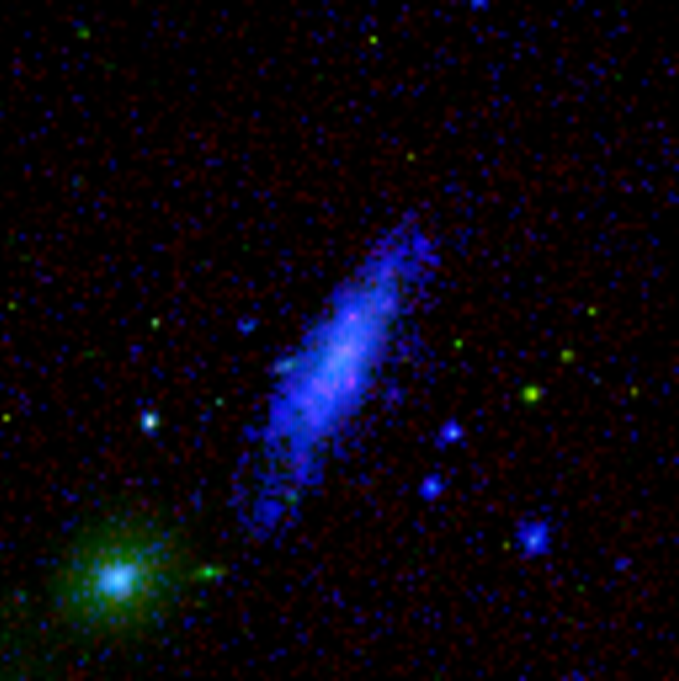
Figure 4 and Figure 5 show the FUV image and the luminosity profile of the pair members IC 2038/39 and of NGC 1533, respectively. The bottom panel of these figures shows a color composite RGB image of the galaxies obtained from the present FUV image, the continuum and H+[N II] images from Rampazzo et al. (2020).
4.3 Luminosity profile fitting
We fit the shape of the FUV luminosity profile with a Sérsic law (Sérsic 1963). Even a crude representation of the light profile, as a simple Sérsic law fit, provides useful information, and sometimes is the only decomposition that can be compared with the literature. The Sérsic law, where is the surface brightness and the radius, is a generalization of the de Vaucouleurs (1953) and of the Freeman (1970) exponential laws. The variation of the Sérsic index, , describes the manifold of the shapes of luminosity profiles of ETGs. The watershed can be considered the value representing a ‘classic’ elliptical. A classic exponential disc (Freeman 1970) in S0s has an index .
FUV luminosity profiles of ETGs may reach large values of (see e.g. Marino et al. 2011b). Rampazzo et al. (2017) suggested that in luminosity profiles with the presence of a disc starts to emerge.
The Sérsic law fit is shown in the right panel/s of Figures 4 and of Figure 5 for IC2038/IC 2039 and NGC 1533, respectively, superposed to the luminosity profile. The fit is extended to the entire profile without masking FUV bright sub-structures such as the ring (B) and the knot (A) in NGC 1533. The Sérsic fit accounts for the UVIT-PSF so it is not necessary to avoid the inner part of the luminosity profile certainly ‘contaminated’ by the instrument PSF.
| Field | ID | FUV | n | LFUV | SFR | ||
|---|---|---|---|---|---|---|---|
| source | [mag] | [deg] | [erg s-1 Hz-1] | [M⊙ yr-1] | |||
| A | IC 2038 | 17.190.07 | 0.720.02 | 154.44.6 | 0.810.09 | 1.811027 | 0.0250.002 |
| IC 2039 | 20.030.11 | 0.190.05 | 104.18.7 | 1.450.18 | 1.331025 | 0.0020.0002 | |
| B | NGC 1533 | 16.740.15 | … | … | 2.640.06 | 2.741026 | 0.0380.006 |
Column 1 UVIT field. Column 2 Source identification; column 3 FUV integrated magnitude corrected for galactic extinction accounting for AFUV=7.9E(B-V); E(B-V) is 0.01 mag both for IC2038 and IC 2039, 0.015 mag for NGC1533 from NED. Luminosities are computed accounting for the same distance, 17.69 Mpc, for all our targets. In columns 4 and 5 are provided the average ellipticity and position angles: for NGC 1533 see Section 5 In column 6 is reported the Sérsic index from the best-fit of the entire profile. In columns 7 and 8 are reported the FUV luminosity and the SFR computed according to the Lee et al. (2009) recipe provide in Section 6.3.
5 Results
In the following sections we discuss the shape of the surface brightness profile and the morphology of the FUV emission.
5.1 Members surface photometry
IC 2038
In Figure 4 top panels the FUV image and the luminosity profiles of IC 2038 and IC 2039 are shown.
IC 2038, classified as Sbc in optical by HyperLeda, does not show a bulge (see e.g. Rampazzo et al. 2020 their Figure 3). The FUV emission appears clumpy in the centre of the galaxy, where H ii regions are detected by Rampazzo et al. (2020), while an arm-like structure appears out the both sides of the galaxy body.
The FUV surface brightness profile is flat in the central 20′′Ṫhe best fit to the entire profile has a Sérsic index of suggesting the galaxy is dominated by the disk. In the central 25′′ there is an excess of luminosity with respect to the Sérsic law best fit, in correspondence to FUV clumps.
The FUV emission extends out to the optical size of the galaxy as shown by Figure 4 and Figure 1: there is no evidence of a XUV disk (Thilker 2008).
The average ellipticity, and the average position angle , compare well with values from optical bands, 0.740.04 and 155.2∘ respectively, from the HyperLeda catalog.
IC 2039
In FUV IC 2039 is the faintest galaxy of the sub-structure (Figure 2). We best fit luminosity profile of IC 2039 (top right panel of Figure 4) with a single Sérsic law with an index indicating that it is basically composed of a disc.
The average ellipticity is and the position angle to compare with optical values of 0.150.07 and 124.3∘ from HyperLeda.
NGC 1533
The galaxy, classified as E-S0 (HyperLeda) is known to have an outer ring and a inner bar, so Comerón et al. (2014) classified it as (RL)SB00. However, in FUV this galaxy shows no signature of the bar. The presence of a FUV-bright outer ring was evidenced using GALEX by Marino et al. (2011b) both in NUV and FUV. UVIT clearly reveals a bright FUV spot at 25′′ and the ring in the range 39′′– 81′′, in agreement with Marino et al. 2011 (their Table 1). Their presence causes a sudden jump of both and PA. ELLIPSE provides and PA within 39′′ and 0.17 and PA= outside the region of the ring up galaxy outskirts. The value of the ellipticity and PA provided by HyperLeda from optical bands are 0.360.09 and 141.5∘.
The surface brightness profile (Figure 5 top right panel) is best-fitted by a Sérsic law with index suggesting the presence of a disc. This value agrees with the UV Sérsic index of obtained from the luminosity profile in the Swift W2 filter (=2030 Å) by Rampazzo et al (2017).
5.2 FUV regions outside galaxies main body
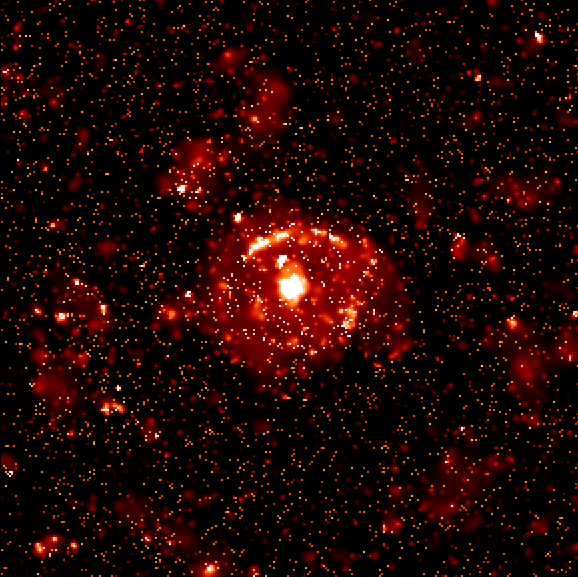
To enhance the signal-to-noide ratio (S/N) in the galaxy outskirts and bring out any possible faint structures in the UV emission, we adopted the procedure outlined by Ebeling et al. (2006), called ASMOOTH. The only parameter required by by the procedure is the desired minimal S/N, . For each individual pixel, the algorithm increases the smoothing scale until the S/N within the kernel reaches a specified input value. ASMOOTH suppresses very efficiently the noise while the signal, locally significant at the selected S/N level, is preserved on all scales. In the right and left panels of Figure 6, the FUV image has been treated with ASMOOTH selecting a S/N above the back-ground of =1.5 and =2.0, respectively. The possible physical causes of the features that emerged using this procedure are discussed below.
Cattapan et al. (2019; see their Figure 7) superposed the emission of NGC 1533 in the W2 filter derived by Rampazzo et al. (2017) from Swift-UVOT observations to their wide field, deep g-band image obtained at VST (see Figure 1). They found that the FUV ring of NGC 1533 is superposed to spiral-like residuals obtained after a model of the optical luminosity profile has been subtracted. The right panel of Figure 6, the FUV image treated with ASMOOTH shows an arm-like structure is emerging also in FUV outside the ring in the west side.
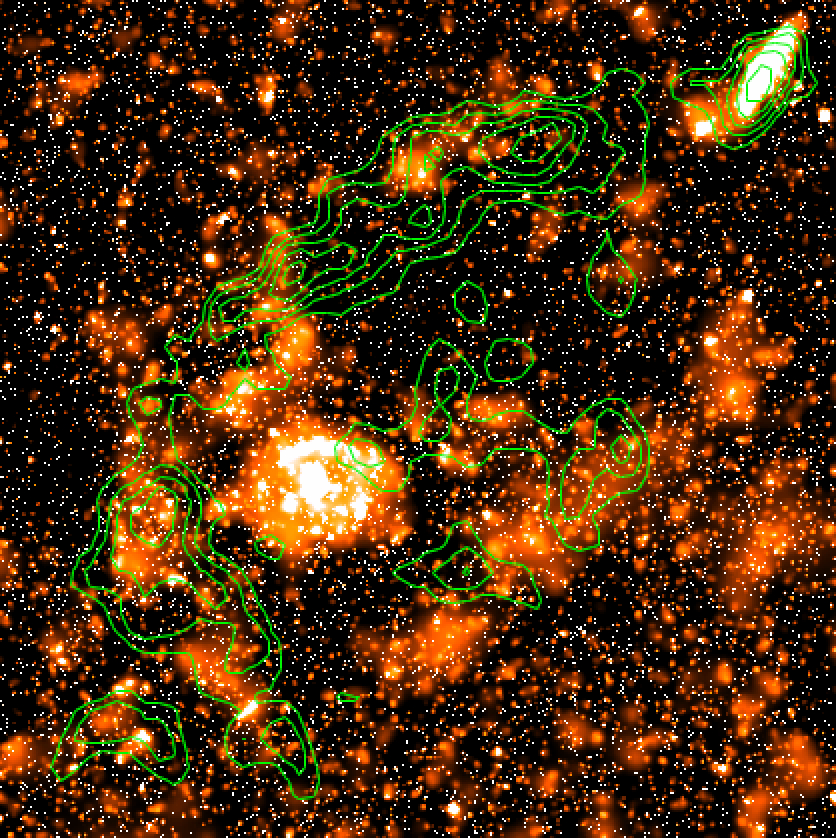
In the left panel of Figure 6 we overplot the H i emission isophotes from Ryan-Weber et al. (2004). While the center of NGC 1533, in particular the ring, is devoid of H i the large scale structure of H i seems to corresponds to the faint extended FUV emission derived using ASMOOTH. The ATCA H i observations by Ryan-Weber et al. (2004) extended over an area at least 5′ to west (partly covered by the Figure 6). They do not detect any H i to the west within their detection limit. Some FUV emission regions above =1.5 are still visible in that area. The presence of this FUV emission would be consistent with the N-body SPH numerical simulations by Ryan-Weber et al. (2003) describing the H i ring around NGC 1533 as the remnant of a tidally destroyed galaxy (see Section 6.2).
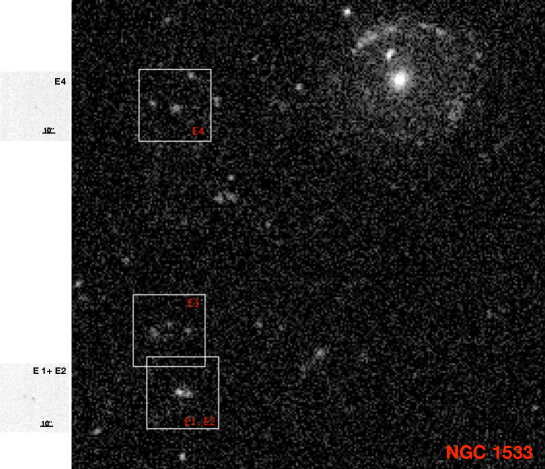
Figure 7 shows the outer FUV emission regions of NGC 1533, investigated by Werk et al. (2008, 2010) in the first systematic search for outlying H ii regions, as part of a sample of 96 emission-line point sources (referred to as ELdots–emission-line dots) derived from the NOAO Survey for Ionization in Neutral Gas Galaxies (SINGG). Such regions, selected from GALEX FUV, are indicated in the above paper as J0409-56 E1, E2, E3 and E4. Rampazzo et al. (2020) inspected also the corresponding areas looking for H ii regions in their frames. Those found are shown right panels of Figure 7 and indicated as E1+E2 and E4. Rampazzo et al. did not detect H ii regions in the zone indicated as E3. Indeed, Werk et al. (2010) found that their targets span over a large range in H luminosities which correspond to a few O stars in most of the nearby cases. Werk et al. (2010) emphasized that often FUV sources are mixed to unresolved dwarf satellite companions and background galaxies. Outer H ii regions of NGC 1533 may be linked to the strong interacting phase suggested by Cattapan et al. (2019) and well imaged in their Figure 6. H ii regions detected and their embedded young stars are definitely correlated with H i as their velocities are the same (see Section 6.2).
6 Discussion
The NGC 1533 sub-structure in the Dorado group has been recently studied by Cattapan et al. (2019) in and SDSS-bands and by Rampazzo et al. (2020) in H+[N II] . This substructure with a heliocentric velocity 764 km s-1 is still evolving separately from the Dorado core, the compact group SCG 0414-5559 (Iovino 2002), with 1230 km s-1. Both IC 2038/ IC 2039 and NGC 1533 show several interaction signatures as described in Cattapan et al. (2019 see their Figure 6). Their environment is H i rich (Ryan-Weber et al. 2003, Kilborn et al. 2009). The above studies suggest a common evolutionary picture of the galaxies members of the NGC 1533 sub-structure.
6.1 FUV and evolution of member galaxies
Mazzei et al. (2014a, 2019 and references therein), using smoothed particle hydrodynamic simulations with chemo-photometric implementation (SPH-CPI), investigated the evolutionary path of NGC 1533, the dominant member of the sub-structure.
From a large grid of simulations of galaxy encounters and mergers, starting from triaxial halos of gas and dark matter, a simulation matching the global properties of this SB0 galaxy (absolute B mag, SED, luminosity profile, morphology at different wavelengths and kinematics properties) has been single out. According to this study NGC 1533 is the result of a major merging occurred at . 40% of its current mass is assembled before .
The FUV bright ring has been one of the morphological features used to single out the simulation from the SPH-CPI grid. The ring is, indeed, well reproduced by the selected simulation as the result of a resonance that appeared when the galaxy is 8 Gyr old and is maintained up to now. The simulation showed the path of NGC 1533 in the (NUV-r) vs. Mr color magnitude diagram. NGC 1533 is 13.7 Gyr old, that it spends as follows. It lies on the blue cloud for 7.2 Gyr, from there it takes about 0.9 Gyr to reach the green valley that will cross reaching the red sequence in 1.6 Gyr, finally it gets its current position on the red sequence after additional 4 Gyr.
The evolution of the pair IC 2038/ IC 2039 has not been studied yet. The pair badly lack a detailed kinematic study in order to constrain the SPH-CPI grid of simulations. As relevant examples in this context, we mention the SPH-CPI studies of the pair NGC 454 by Plana et al. (2017) and of the false pair NGC 3447/ NGC 3447A by Mazzei et al. (2018).
6.2 FUV and SF regions
The FUV emission is a short scale ( 107 years) SF indicator. Therefore it can be associated to a measure of the SF obtained from H ( 106 years) (see Kennicutt & Evans 2009). Next sections will focus on SF regions and SFR estimates from H and FUV.
The FUV emission of IC 2038 is more extended than the area where H ii regions are found. Indeed, the FUV emission covers the entire galaxy seen in the continuum (optical) image (Fugure 4 bottom panel). The FUV emission is also present in the inner regions of IC 2039 (Figure 4). However, no H ii regions have been detected in this E-S0 by Rampazzo et a. (2020).
At odds, in NGC 1533 H ii regions are found in two small complexes by Rampazzo et al. (2020) and labelled as A and B in the panel of Figure 5. In this galaxy the FUV emission concentrates in the ring and a bright FUV spot, that includes the above H ii regions.
We revealed in this paper a faint FUV emission (Figure 6) associated to a complex H i structures composed of two major arcs one north west and a second south east (Ryan-Weber et al. 2004). No optical counterparts are connected with these arcs. Faint H ii regions are found south east of NGC 1533 (Werk et al. 2008, 2010; Rampazzo et al. 2020) and are correlated to the H i envelope. In particular regions indicated in Figure 7 as E1-E2 have a recession velocity of 831 and 846 km s-1 (another region indicated E5 by Ryan-Weber et al. (2004, see their Figure 2) has a recession velocity of 901 km s-1). With these recession velocities H ii regions are compatible with being associated to NGC 1553 sub-structure (see Table 1) and with the H i structure as well.
Concerning the origin of the H i clouds around NGC 1533, Ryan-Weber, Webster & Bekki, K. (2003) suggested that it could be the merger remnant of a tidally destroyed galaxy. Ryan-Weber et al. (2004) noticed that the H i gas in the south east cloud has velocity dispersion up to 30 km s-1 and velocity gradient in the range 7– 50 km s-1 kpc-1. These conditions makes this site unlikely for SF since the latter usually requires the gas to have a low velocity dispersion in order to collapse.
We conclude that the H i arcs detected by Ryan-Weber et al. (2004), the correspondent faint FUV structure revealed in this paper in addition to the optical evidence of faint tails and arcs shown by the Cattapan et al. (2019) deep surface photometry are indication that galaxy-galaxy encounters, leading to galaxy tidal disruption (Ryan-Weber et al. 2003) and merging events (Mazzei et al. 2019) are the drivers of the complex evolution within the NGC 1533 sub-structure.
6.3 SFR from FUV integrated galaxy luminosity
In this section we compare the SFR for our three targets as derived by H emission (Rampazzo et al. 2020) with that by the integrated FUV emission in this paper.
We follow the recipes of Lee et al. (2009, their equation 3) to compute the SFR for FUV:
Lee et al. find the following relation when the effects of internal dust attenuation are not included:
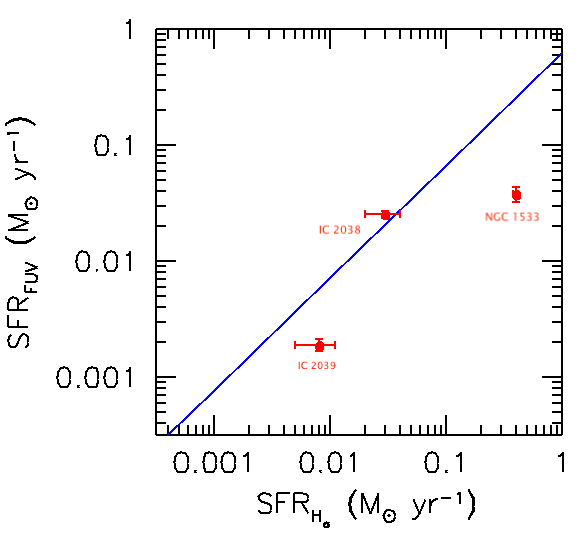
This is highlighted by a solid blue line in Figure 8. Lee et al. noticed that H and FUV SFRs agree to within factor of 2 for all galaxies with SFR M⊙yr-1.
The SFR of IC 2038, the only LTG in the sub-structure, do not deviate from Lee et al. relatio However, according to Rampazzo et al. (2020) the SFR of IC 2038 estimated from H is below the average for its morphological class estimated by James et al. (2004).
The SFR of the two ETGs, IC 2039 and NGC 1533 seems to deviate from the Lee et al. relation, suggesting a higher SFR from Hα than from UV. This point is quite surprising given that UV stars trace SFR with a time scale longer than Hα and the activity of SF is residual for ETGs.
Figure 2 and Table 2 in Lee et al. (2009) shows the trend of the ratio log[SFR(H )/SFR(FUV)] as a function of the B-band galaxy absolute magnitude. At the distance of Dorado, the absolute B magnitude of NGC 1533 and IC 2039 is MB=-19.52 and -16.3, respectively. At these magnitudes, Lee et al. (2009) reported the average values of log[SFR(H )/SFR(FUV)]-0.100.36 (1) and log[SFR(H )/SFR(FUV)]-0.120.18. Our measured values are log [SFR(H )/SFR(FUV)]=1.02 and log [SFR(H )/SFR(FUV)]=0.6 for NGC 1533 and IC 2039, respectively. However, Figure 2 (bottom panel) in Lee et al. (2009) shows discrepant cases of galaxies, with values of log [SFR(H )/SFR(FUV)] similar to ours. Investigating the SF properties in the Local Volume of Galaxies with H and FUV fluxes, Karachentsev & Kaisina (2013) provided a log [SFR(H )/SFR(FUV)]=1 for NGC 1533, in well agreement with our value.
We plan to further explore the comparison of SFR from H and FUV using the entire UVIT data-set of the Dorado backbone, considering extinction effects in more detail than in Lee et al (2009) assumptions (Rampazzo et al. in preparation). The SPH chemo-photometric simulation of NGC 1533 by Mazzei et al. (2019) provided an estimate of the internal galaxy extinction. We will use also such estimates.
7 Summary and conclusion
We performed with UVIT a FUV photometric study of a substructure of the Dorado group of galaxies that includes three galaxies: the mixed morphology pair IC 2038 (Sbc)/2039 (E-S0) and NGC 1533. We derived their luminosity profiles and discussed their FUV morphologies.
We found the following results:
-
•
The shape of the FUV luminosity profile indicates the presence of a disc in all three galaxies. The presence of disc suggests that dissipative mechanisms have been at work.
-
•
In IC 2038 the FUV emission is detected out to the optical size for IC 2038, further out than the H ii regions system detected by Rampazzo et al. (2020). There is no evidence of a XUV disk (Thilker 2008).
-
•
In IC 2039 the FUV emission is detected in the inner regions where no H ii regions have been detected by Rampazzo et al. (2020).
-
•
In NGC 1533 the FUV emission is more extended than the system of H ii regions detected by Rampazzo et al. (2020). The extended FUV emitting regions likely correspond to outer arm-like structures detected at different wavelengths (Marino et al. 2011a, Rampazzo et al. 2017, Cattapan et al. 2019).
-
•
We reveal a faint FUV emission, just above the local background noise, reminiscent of the wide H i structure detected by Ryan-Weber et al. (2004). In the east and south east regions of this FUV emission lurk few H ii regions highlighted by Werk at al. (2008,2010) and Rampazzo et al. (2020) with the same redshift as the H i structure (Ryan-Weber at al. 2004) and of the NGC 1533 sub-structure as well.
-
•
We derive the SFR from the FUV luminosity and we compare the results with SFR, following the Lee et al. (2009) recipe, with SFR from H by Rampazzo et al. (2020). The SFR for IC 2038 only agrees with Lee et al. (2009) expected ratio between FUV and H derived values. At odds, our measure of the SFR H /FUV for NGC 1533 well agrees with that found by Karachentsev & Kaisina (2003).
Lee et al. (2009) SFR(FUV) - SFR (Ha) relation does not account for internal dust effects. Such relation will be investigated further in the analysis of our UVIT FUV observations of the whole galaxy group.
In a forthcoming paper we will analyze the central part of Dorado, the compact group SGC 0414-5559 Iovino (2002), composed of NGC 1553, NGC 1549, NGC 1546 and IC 2058 plus the dwarf galaxy PGC 75125. The study of the SBc galaxy NGC 1536 and of the mixed pair NGC 1596/NGC 1602 (S0+Irr), part of the A07 program but non yet observed, will complete our study of the Dorado backbone with UVIT.
Acknowledgements
The UVIT project is collaboration between the following institutes from India: Indian Institute of Astrophysics (IIA), Bengaluru, Inter University Centre for Astronomy and Astrophysics (IUCAA), Pune, and National Centre for Radioastrophysics (NCRA) (TIFR), Pune, and the Canadian Space Agency (CSA). The detector systems are provided by the Canadian Space Agency. The mirrors are provided by LEOS, ISRO, Bengaluru and the filter-wheels drives are provided by IISU, ISRO, Trivandrum. Many departments from ISAC, ISRO, Bengaluru have provided direct support in design and implementation of the various sub-systems.
References
- [1] Barnes, J. E. 2002, MNRAS, 333, 481
- [2] Bender, R., Döbereiner, S., Möllenhoff, C. 1988, A&AS, 74, 385
- [3] Boselli, A., Gavazzi, G. 2006, Publications of the Astronomical Society of the Pacific, 118, 517
- [4] Boselli, A., Gavazzi, G. 2014, Astronomy and Astrophysics Review, 22, 74
- [5] Bureau, M., Carignan, C. 2002, AJ, 123, 1316
- [6] Capaccioli, M., Spavone, M., Grado, A., et al. 2015, A&A, 581, A10
- [7] Cattapan, A., Spavone, M., Iodice, E., et al. 2019, ApJ, 874, 130
- [8] Chung, A., Koribalski, B., Bureau, M., van Gorkom, J. H. 2006, MNRAS, 370, 1565
- [9] Ciambur, B.C. 2016, PASA, 33, 62
- [10] Comerón, S., Salo, H., Laurikainen, E., et al. 2014, A&A, 562, A121
- [11] de Vaucouleurs, G. 1953, MNRAS, 113, 134.
- [12] Di Matteo, T. 2015, in IAU General Assembly, Vol. 29, 2257908
- [13] Domingue, D. L., Sulentic, J. W., Xu, C., et al. 2003, AJ, 125, 555
- [14] Ebeling, H., White, D. A., & Rangarajan, F. V. N. 2006, MNRAS, 368, 65
- [15] Freeman, K.C. 1970, ApJ, 160, 811
- [16] Gavazzi, G., Consolandi, G., Pedraglio, S., et al. 2018, A&A, 611, A28
- [17] Iovino, A. 2002, AJ, 124, 2471
- [18] Jedrzejewski, R. I. 1987, MNRAS, 226, 747
- [19] James, P. A., Shane, N. S., Beckman, J. E., et al. 2004, A&A, 414, 23
- [20] Jeong, H., Yi, S. K., Bureau, M., et al. 2009, MNRAS, 398, 2028
- [21] Karachentsev, I.D., Kaisina, E.I. 2013, AJ, 146, 46.
- [22] Kantharia, N. G., Ananthakrishnan, S., Nityananda, R., Hota, A. 2005, A&A, 435, 483
- [23] Keel, W. C. 2004, AJ, 127, 1325
- [24] Kennicutt, R.C., Evans, N.J. 2009, Ann. Rev. A&A, 50, 531
- [25] Kilborn, V.A., Koribalski, B.S., Forbes, D.A. et al. 2005, MNRAS, 356, 77
- [26] Kilborn, V. A., Forbes, D. A., Barnes, D. G., et al. 2009, MNRAS, 400, 1962
- [27] Kourkchi, E. & Tully, R. B. 2017, ApJ, 843, 16
- [28] Malin, D. F., Carter, D. 1983, ApJ, 274, 534
- [29] Marino, A., Bianchi, L., Rampazzo, R., et al. 2011a, ApJ, 736, 154
- [30] Marino, A., Rampazzo, R., Bianchi, L. et al. 2011b, MNRAS, 411, 311
- [31] Marino, A., Plana, H., Rampazzo, R., et al. 2013, MNRAS, 428, 476
- [32] Marino, A., Mazzei, P., Rampazzo, R., Bianchi, L. 2016, MNRAS, 459, 2212
- [33] Martin, D. C., Fanson, J., Schiminovich, D., et al. 2005, ApJ, 619, L1
- [34] Mazzei, P., Marino, A., Rampazzo, R., Galletta, G., Bettoni, D. 2014a, Advances in Space Research, 53, 950
- [35] Mazzei, P., Marino, A., Rampazzo, R. 2014b, ApJ, 782, 53
- [36] Mazzei, P., Marino, A., Rampazzo, R. et al. 2018, A&A, 610, A8
- [37] Mazzei, P., Rampazzo, R., Marino, A., Trinchieri, G., Uslenghi, M., Wolter, A. 2019, ApJ, 885, 165
- [38] Morrissey, P., Conrow, T., Barlow, T. A., et al. 2007, ApJS, 173, 682
- [39] Plana, H., Rampazzo, R., Mazzei, P. 2017, MNRAS, 472, 3074.
- [40] Plana, H, Rampazzo, R., Mazzei, P. et al. 2017, MNRAS, 472, 3074
- [41] Postma, J., Hutchings, J. B., Leahy, D. 2011, Publications of the Astronomical Society of the Pacific, 123, 833
- [42] Postma, J., Leahy, D. 2017, PASP, 129, 981
- [43] Postma, J., Leahy, D. 2020, PASP, 132, 1011
- [44] Ramatsoku, M., Serra, P., Poggianti, B. M., et al. 2019, MNRAS, 487, 4580
- [45] Rampazzo, R., Mazzei, P., Marino, A. et al. 2017 A&A, 602, A97
- [46] Rampazzo, R., Mazzei, P., Marino, A., et al. 2018, Ap&SS, 363, 80
- [47] Rampazzo, R., Ciroi, S., Mazzei, P. et al. 2020, A&A, 643, A176
- [48] Ryan-Weber, E. V., Meurer, G. R., Freeman, K. C. et al. 2004, AJ, 127, 143
- [49] Ryan-Weber, E., Webster, R., Bekki, K. 2003 The IGM/Galaxy Connection: The Distribution of Baryons at z=0, ASSL Conference Proceedings Vol. 281. Edited by Jessica L. Rosenberg and Mary E. Putman. ISBN: 1-4020-1289-6, Kluwer Academic Publishers, Dordrecht, p.223
- [50] Salim, S., Rich, R. M., Charlot, S., et al. 2007, ApJS, 173, 267
- [51] Schawinski, K., Kaviraj, S., Khochfar, S., et al. 2007, The Astrophysical Journal Supplement Series, 173, 512
- [52] Sérsic, J. L. 1963, Jan, Boletin de la Asociacion Argentina de Astronomia La Plata Argentina, 6, 41.
- [53] Tandon, S. N., Subramaniam, A., Girish, V., et al. 2017, AJ, 154, 128
- [54] Tandon, S. N., Postma, J., Joseph, P., et al. 2020, AJ, 159, 158
- [55] Thilker, D. 2008, Astrophysics & Space Science Proceedings, Galaxies in the Local Volume, Koribalski, B. S., Jerjen, H. (Eds.), 109
- [56] Toomre, A., Toomre, J. 1972, ApJ, 178, 623
- [57] Werk, J. K., Putman, M. E., Meurer, G. R. et al. 2008, ApJ, 678, 888
- [58] Werk, J. K., Putman, M. E., Meurer, G. R., et al. 2010, AJ, 139, 279