Gaia GraL: Gaia DR2 Gravitational Lens Systems. VI.
Spectroscopic Confirmation and Modeling of Quadruply-Imaged Lensed Quasars
Abstract
Combining the exquisite angular resolution of Gaia with optical light curves and WISE photometry, the Gaia Gravitational Lenses group (GraL) uses machine learning techniques to identify candidate strongly lensed quasars, and has confirmed over two dozen new strongly lensed quasars from the Gaia Data Release 2. This paper reports on the 12 quadruply-imaged quasars identified by this effort to date, which is a increase in the total number of confirmed quadruply-imaged quasars. We discuss the candidate selection, spectroscopic follow-up, and lens modeling. We also report our spectroscopic failures as an aid for future investigations.
Subject headings:
strong gravitational lensing — quasars1. Introduction
Strongly lensed quasars provide rare, powerful tools for a range of key studies, including measuring the Hubble constant at intermediate cosmic times (e.g., Chen et al., 2019; Shajib et al., 2020), constraining the properties of dark matter (e.g., Gilman et al. 2019, Nierenberg et al. 2020), inferring the structure near the event horizon of supermassive black holes (SMBHs; e.g., Pooley et al., 2009; Chartas et al., 2016), measuring the accretion disk size of AGN (e.g., Blackburne et al., 2011, 2015), constraining the quasar broad emission line region size and geometry (e.g., Sluse et al., 2011; Braibant et al., 2017), measuring black hole spins at redshifts and intrinsic luminosities that would otherwise be inaccessible (e.g., Walton et al., 2015), and testing general relativity in the strong-gravity regime (e.g., Collett et al., 2018). A key challenge is finding and confirming these rare sources, particularly the quadruply-imaged ones which are the most constraining for further modelling and physical parameter inference.
Over the past two years, the Gaia Gravitational Lenses working group (GraL) has discovered % of all currently confirmed strongly lensed quasars.111As of December 2020, the Gravitationally Lensed Quasar Database lists 220 confirmed lensed quasars, including 56 quadruply-imaged quasars. Matching a comprehensive list of known quasars with the Gaia source catalog, and then using a supervised machine-learning method to identify which sources were most likely lensed, Krone-Martins et al. (2018, Paper I) presented two new quadruply-imaged quasar candidates. Ducourant et al. (2018, Paper II) reported on the Gaia Data Release 2 properties of an as-complete-as-possible list of known gravitationally lensed quasars, both confirmed and candidates, that were published prior to Gaia Data Release 2 (DR2; Gaia Collaboration et al., 2018). Delchambre et al. (2019, Paper III) presented a list of 15 new quadruply-imaged quasar candidates based on an update to the supervised machine-learning method used in Paper I. Wertz et al. (2019, Paper IV) presented spectroscopic confirmation of a quad lens candidate identified in Papers I and III, and modeled the lens, including time delays. Krone-Martins et al. (2020, Paper V) presents the 15 confirmed doubly-imaged quasars selected by GraL using new candidate selection principles based on unresolved photometric time-series and ground-based images. This paper (Paper VI) presents the 12 confirmed quadruply-imaged lensed quasars identified by GraL to date (including the one in Paper IV, for completeness); we also include one doubly-imaged quasar that was selected as a quad candidate.
New data sets are making this an active time for identifying new lensed quasars, and several other teams are using Gaia data, machine learning, and additional approaches to find these rare systems. In a series of papers making use of Gaia and WISE data, Lemon et al. (2018), Lemon et al. (2019), and Lemon et al. (2020) confirmed a total of new multiply-imaged quasars, including eight lensed quasars with three or more images. Agnello et al. (2018) present two confirmed lensed quasars also identified from Gaia. Using supervised machine learning, Ostrovski et al. (2017) identified and confirmed a gravitationally lensed quasar at in the Dark Energy Survey, while Khramtsov et al. (2019) report on machine-learning selection of candidate lensed quasars in the Kilo-Degree Survey. Ostrovski et al. (2018) present the discovery and modeling of a five-image lensed quasar at identified using supervised machine learning from a combination of Gaia and ground-based imaging. As one final example from our incomplete survey of the recent literature, Chao et al. (2020) report on a search algorithm for four-image lensed quasars based on their time variability.
This paper is organized as follows. Section 2 summarizes the GraL lens candidate selection methods. Section 3 summarizes all GraL spectroscopic observations prior to telescope shutdowns caused by COVID-19. We also include one subsequent observing run from Summer 2020. Section 4 presents the 12 GraL confirmed quaduply-imaged lensed quasars, providing brief details on each system. Section 5 presents those candidates which spectroscopic observations have shown not to be quadruply-imaged lensed quasars, including a discussion of the primary failure modes and details on a few interesting interlopers. Section 6 presents the lens modeling, and Section 7 summarizes our results. Throughout this paper, magnitudes are reported in the Vega system.
2. Lens Candidate Selection
ESA’s Gaia mission is conducting the largest, most precise, most accurate all-sky astrometric and spectrophotometric survey to date (Gaia Collaboration et al., 2016a). With an effective angular resolution comparable to that provided by Hubble (Ducourant et al., 2018), Gaia’s main goal is to better undestand the Milky Way and produce a three-dimensional dynamical map of our Galaxy based on astrometric measurements of stars. While achieving this goal, Gaia also detects millions of compact galaxies and quasars. This presents a unique opportunity to perform the first homogeneous, magnitude-limited census of strongly lensed quasars over the entire sky, down to lensed image separations of . Prior to the first data release (DR1; Gaia Collaboration et al., 2016b), Finet & Surdej (2016) conservatively estimated that Gaia would detect quasars down to mag, including resolved, multiply imaged quasars. Considering that Gaia is detecting quasars as faint as , these estimates are likely too low by %.
The GraL team has devised three new methods to identify gravitational lenses (for details, see Krone-Martins et al., 2018) from Gaia Data Release 2 (Gaia Collaboration et al., 2018). The first method relies on a supervised machine learning technique using a Hierarchical Triangular Mesh to identify potential multi-image candidates based on Gaia astrometric and photometric properties, and then uses an Extremely Randomized Tree (ERT) to rank these candidates based on simulated lenses. Delchambre et al. (2019) reported this ranking with the ERT probability, . Note that the ERT probability does not constitute a probability in a mathematical sense, but rather should be viewed as a figure of merit or score that reflects how well matched the source image positions and relative magnitudes are to simulated lens systems. Delchambre et al. (2019) presented 15 candidate quadruply-imaged quasars with , 11 of which have . Of the 21 known, confirmed quadruply-imaged quasars discussed in that paper, 19 have . Tests indicate a completeness of 77% for 3-lensed images and 97% for 4-lensed images (quads), with contamination rates of just 1% and 0.02%, respectively.
The second new method uses the information present in the light curves of quasars, supplemented with the Gaia astrometry and colors. For an unresolved lensed system (and ignoring microlensing caused by stars in the lensing galaxy), the observed time series is the addition of multiple identical light curves with time delays. Compared to an unlensed quasar, this results in a less stochastic light curve, which we identify using multiscale sample entropy (Ahmed & Mandic, 2011) as a proxy for light curve stochasticity. The optical light curves that we adopted to select the candidates come from the Catalina Real-Time Transient Survey (CRTS; Drake et al., 2009) and the Zwicky Transient Facility (ZTF; Bellm et al., 2019; Graham et al., 2019).
The third new method uses the information present in the images of quasars, supplemented with the Gaia analysis and colors. In brief, the wavelet power spectrum of barely resolved lenses are separated from single quasars, allowing the efficient identification of close systems. The Gaia astrometric and photometric properties of candidates are then combined with mid-IR photometry to efficiently distinguish stellar asterisms from quasars (e.g., Stern et al., 2012; Assef et al., 2018).
| UT Date | Code | Telescope/Instr. | Conditions/Notes |
|---|---|---|---|
| 2018 May 13 | N01-K | Keck/LRIS | photometric |
| 2018 Jun 16 | N02-K | Keck/LRIS | cirrus, poor seeing |
| 2018 Jul 16 | N03-K | Keck/LRIS | clear, lost 4 hr to elec. prob. |
| 2018 Aug 18 | N04-P | Palomar/DBSP | clouds |
| 2018 Aug 20 | N05-P | Palomar/DBSP | clear, 10 seeing |
| 2018 Sep 15 | N06-K | Keck/LRIS | light cirrus, 10 seeing |
| 2018 Oct 03 | N07-K | Keck/LRIS | clear, 065 seeing |
| 2019 Jan 12 | N08-K | Keck/LRIS | clear, good seeing |
| 2019 Feb 06 | N09-K | Keck/LRIS | clear, good seeing |
| 2019 Apr 07 | N10-G | Gemini-S/GMOS | queue; clear, 05 seeing |
| 2019 Apr 07 | N11-N | NTT/EFOSC2 | clear, 07 seeing |
| 2019 Apr 08 | N12-N | NTT/EFOSC2 | clear, 08 seeing |
| 2019 Apr 09 | N13-N | NTT/EFOSC2 | clear, 10 seeing |
| 2019 May 01 | N14-P | Palomar/DBSP | lost to clouds |
| 2019 Jun 01 | N15-K | Keck/LRIS | clear |
| 2019 Jun 02 | N16-K | Keck/LRIS | clear; half night |
| 2019 Sep 19 | N17-K | Keck/LRIS | cloudy |
| 2019 Dec 04 | N18-K | Keck/LRIS | cirrus, 07 seeing; half night |
| 2020 Jan 26 | N19-K | Keck/LRIS | clear, 075 seeing |
| 2020 Jun 20 | N20-K | Keck/LRIS | scattered cirrus, good seeing |
3. Observations
Spectroscopic follow-up for the GraL program began in May 2018 and has used the Keck I telescope atop Maunakea, Hawaii, the 200” Hale Telescope at Palomar Observatory, California, the 3.6-m New Technology Telescope (NTT) at La Silla, Chile, and the Gemini-South telescope at Cerro Pachon, Chile. The 20 GraL observing nights are listed in Table 1, including both dedicated nights (for which we also list nights lost to weather), as well as nights dedicated to other projects but where we were able to obtain at least one GraL spectrum (generally the earlier nights for this program while we were proving our techniques). In addition to the nights listed in Table 1, the Gemini-South observations were obtained in queue-mode. The following subsections provide details on these observations, split by telescope/instrument. All observations were processed using standard methods within IRAF. Table 2 lists the confirmed GraL quadruply-imaged quasars, discussed in detail in § 4. The maximum lens separations are based on the astrometry provided in Table 5 in the Appendix; these values, primarily coming from Gaia, are also reported in the text of §4. Table 6 in the Appendix lists the spectroscopically observed GraL targets which proved not to be lensed quasars, and are discussed in § 5.
3.1. Keck/LRIS
The primary instrument for GraL spectroscopic follow-up has been the Low Resolution Imaging Spectrometer (LRIS; Oke et al., 1995) on the Keck I telescope, used for 13 of the 20 GraL nights listed in Table 1. For all listed LRIS observing runs, we used the 600 mm-1 blue grism ( Å), and the 400 mm-1 red grating ( Å). Most runs used the 5600 Å dichroic, though the 6800 Å dichroic was used for the June 2019 nights. The slit widths were tailored to the observing conditions for each night, with the 15 used for most nights, though we used the 10 slit on the May 2018, July 2018, October 2018, January 2019, and February 2019 nights. Our LRIS instrument configuration covers the full optical window at moderate resolving power, for the 15 slit and for the 10 slit (for objects filling the slit). Over the course of these nights, standard stars from Massey & Gronwall (1990) were observed for flux calibration.
3.2. Palomar/DBSP
Several lens candidates were observed with the Palomar Double Spectrograph (DBSP) in August 2018, and a Palomar night dedicated for this project was lost to clouds in May 2019. None of the confirmed quadruply-imaged quasars were observed with Palomar, though two doubly-imaged quasars in Krone-Martins et al. (2020) were confirmed on these runs, and several of the GraL lens candidates were invalidated at Palomar (Table 6). We used the 10 slit, the 5600Å dichroic, the 600 mm-1 blue grism ( Å), and the 400 mm-1 red grating ( Å) for all Palomar observations reported here. This instrument configuration covers the full optical window at moderate resolving power, . Standard stars from Massey & Gronwall (1990) were observed for flux calibration.
3.3. NTT/EFOSC2
We used the ESO Faint Object Spectrograph and Camera (v.2; EFOSC2) on the NTT telescope on the nights of UT 2019 April 7-9 (PI: Ducourant; Program ID 0103.A-0077). Conditions were clear with seeing. We observed 9 candidates using the 50 and 15 width slits, Grism1 covering 3185-10940 Å ( Å), and the GG375 order-blocking filter. The LTT3864 and LTT7379 spectrophotometric standards from Hamuy et al. (1994) were observed on the first two nights for flux calibration.
3.4. Gemini-S/GMOS-IFU
Seven candidates were observed in queue mode using the Gemini-South Multi-Object Spectrograph (GMOS; Hook et al., 2004) in integral field unit (IFU; Allington-Smith et al., 2002) mode (PI: Teixeira; Program ID GS-2019A-Q-104). We used the lowest resolution grating available at the time of these observations, namely the 400 grating which covered the Å spectral range with a resolving power . We used the IFU in two-slit mode in order to fit the targets within the IFU field ( arcsec2) and obtained a single 1200 s exposure of each target. The observational conditions varied between targets, though all occurred with cloud cover below 70%, image quality better the 70% (i.e., seeing better than 075), and airmass below 1.5. The spectra were flux calibrated using standards supplied by the Gemini baseline calibrations. The limited spectral range prevented clear assessments for most targets; only the target observed on UT 2019 April 7 proved useful and is discussed below.
| Max. | Exposure | |||||
|---|---|---|---|---|---|---|
| Name | Sep’n | Night | PA | Time (s) | Notes | |
| GraL J024848.7+191331 | 17 | N03-K | 450 | 2.424 | Paper III | |
| GraL J060710.8215217 | 17 | N19-K | 20∘ | 1.302 | ||
| N19-K | 352∘ | |||||
| N19-K | 57∘ | |||||
| GraL J060841.4+422937 | 13 | N18-K | 222∘ | 2.345 | “Auriga’s Slingshot” | |
| N18-K | 275∘ | |||||
| GraL J065904.1+162909 | 68 | N06-K | 66∘ | 3.083 | Paper III; “Orion’s Crossbow” | |
| N07-K | 0∘ | 600 | ||||
| N07-K | 40∘ | 600 | ||||
| N08-K | 66∘ | deflector at | ||||
| N08-K | 5∘ | |||||
| N08-K | 132∘ | |||||
| GraL J081828.3261325 | 62 | N09-K | 0∘ | 2.164 | “Argo’s Rose” | |
| GraL J113100.0442000 | 16 | N01-K | 60∘ | 300 | 1.090 | Paper I,III,IV; “Centaurus’ Victory” |
| N01-K | 135∘ | 300 | ||||
| N10-G | 10∘ | 1200 | IFU | |||
| GraL J153725.3301017 | 33 | N03-K | 165∘ | 1.721 | Paper III; “Wolf’s Paw” | |
| GraL J165105.3041725 | 101 | N13-N | 51∘ | 1800 | 1.451 | “Dragon Kite” |
| N13-N | 142∘ | 1800 | ||||
| N15-K | 51∘ | |||||
| N15-K | 142∘ | deflector at | ||||
| GraL J181730.8+272940 | 18 | N03-K | 135∘ | 300 | 3.074 | Paper III; “Hercules’ Sword” |
| GraL J201749.1+620443 | 07 | N03-K | 120∘ | 300 | 1.724 | Paper III |
| GraL J203802.7400814 | 25 | N01-K | 90∘ | 300 | 0.775 | Paper I,III, Agnello et al. (2018); deflector at ; “Microscope Lens” |
| GraL J210329.0085049 | 10 | N15-K | 0∘ | 2.455 | “Aquarius’ Tear” |
Note. — In addition to these 12 quadruply-imaged lensed quasars, we also confirm the doubly-imaged lensed quasar GraL J201454.2302452 (see § 5).
4. Confirmed Quad Lenses
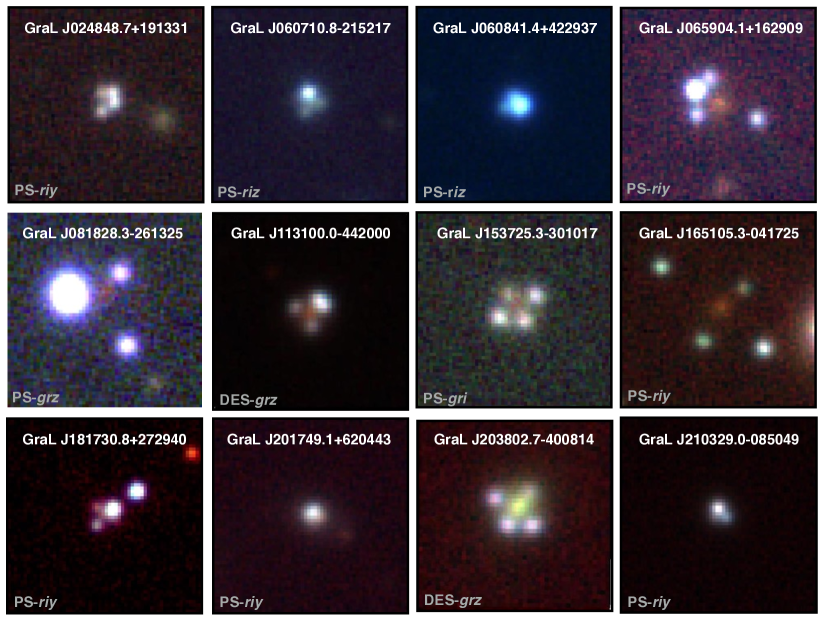
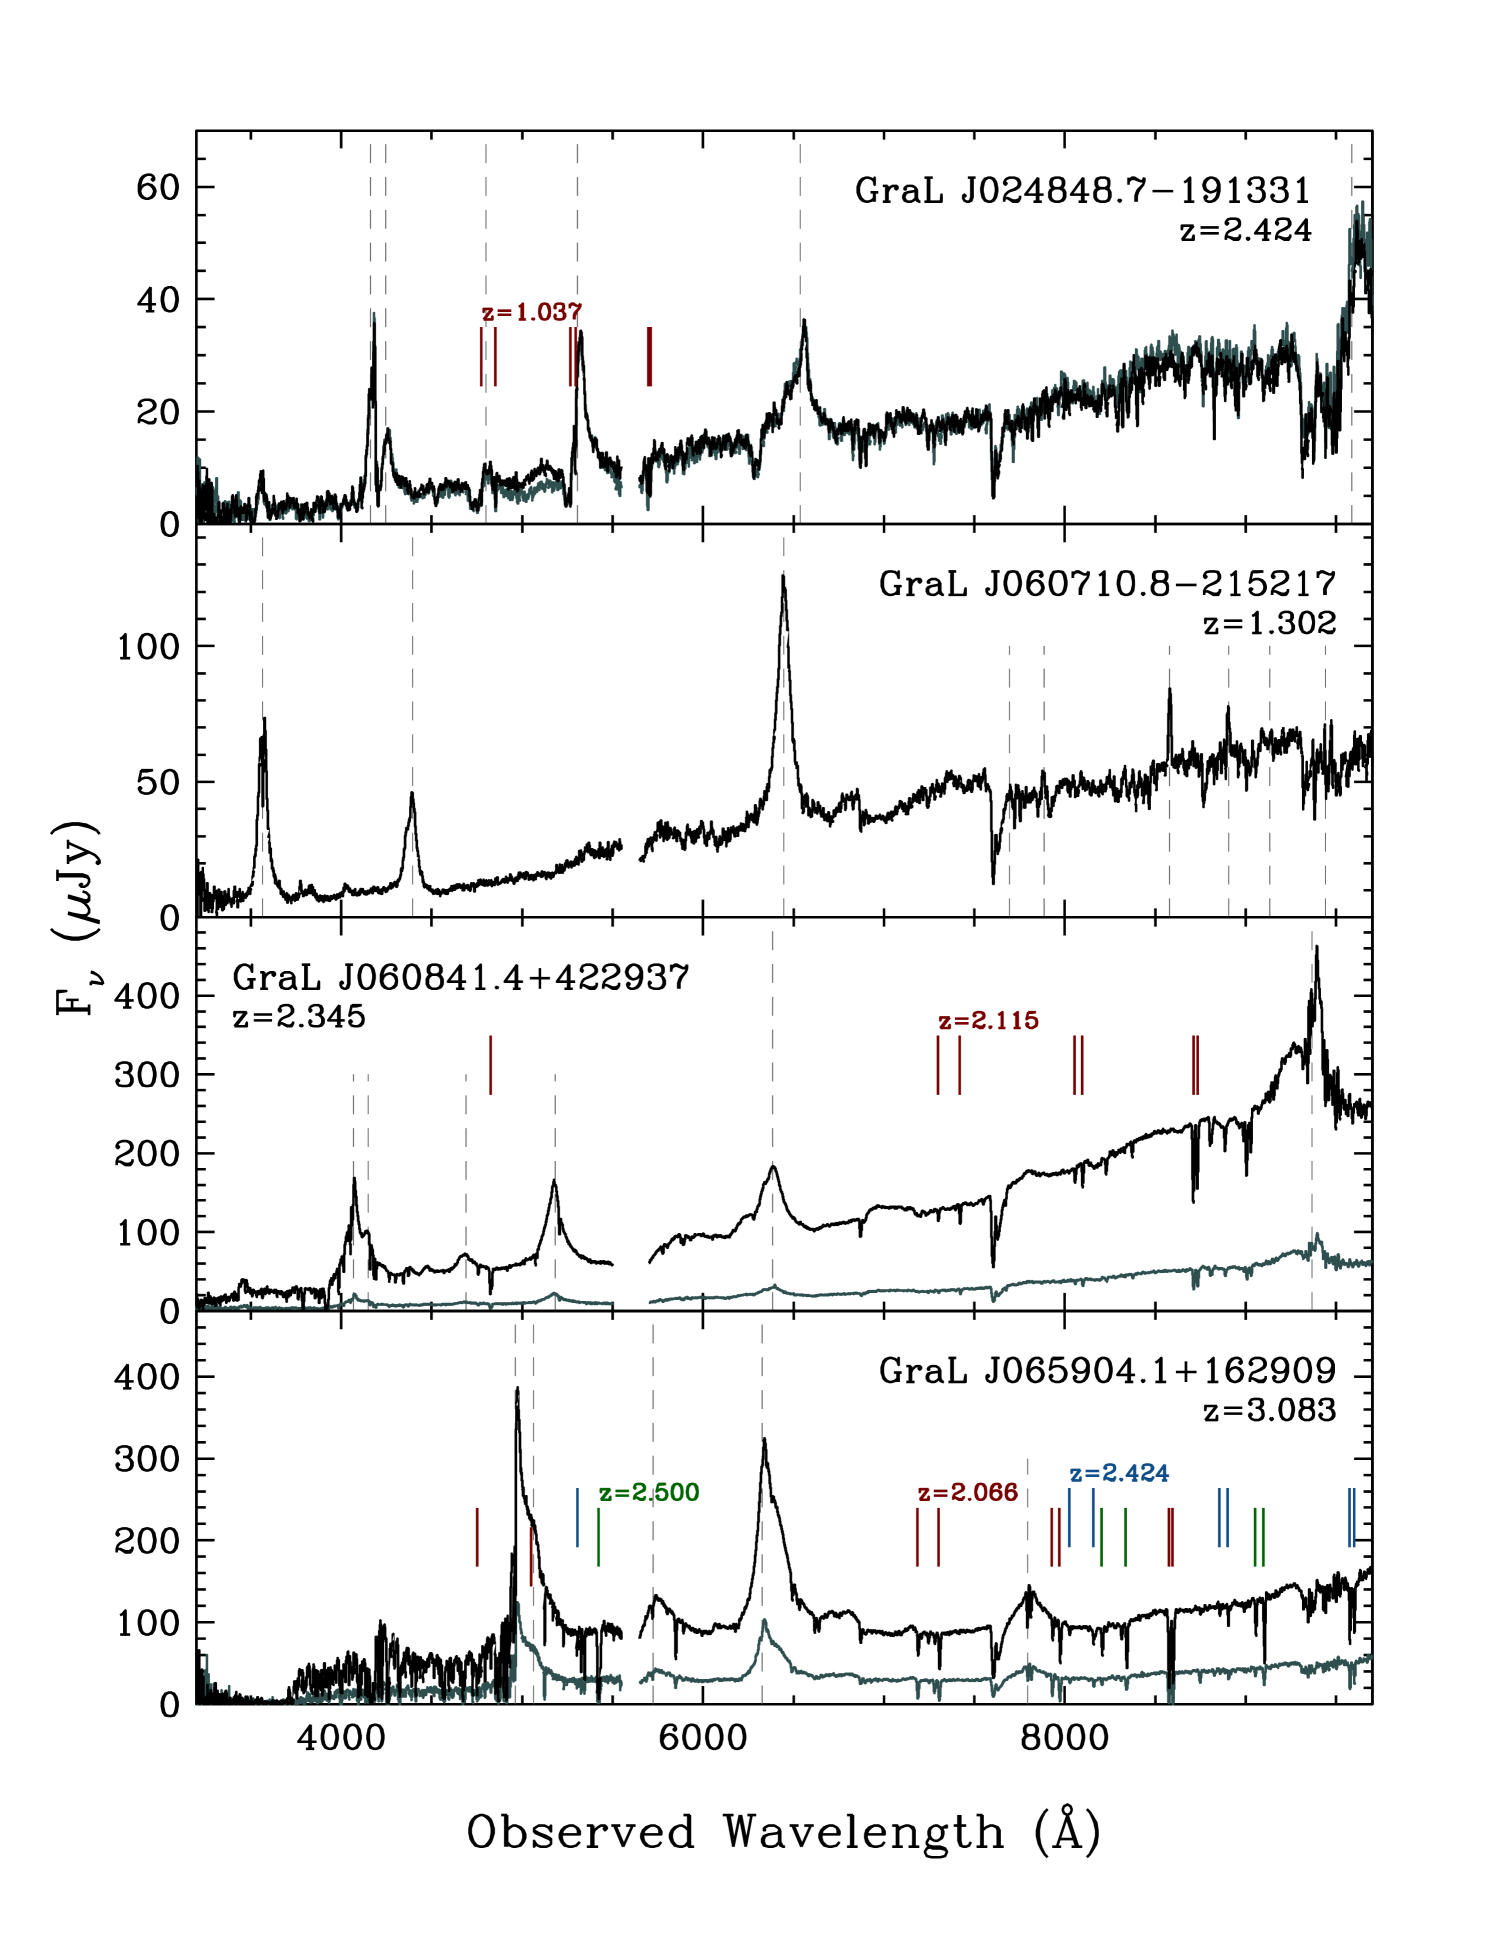
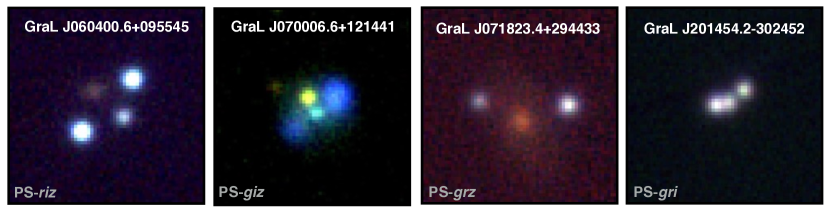
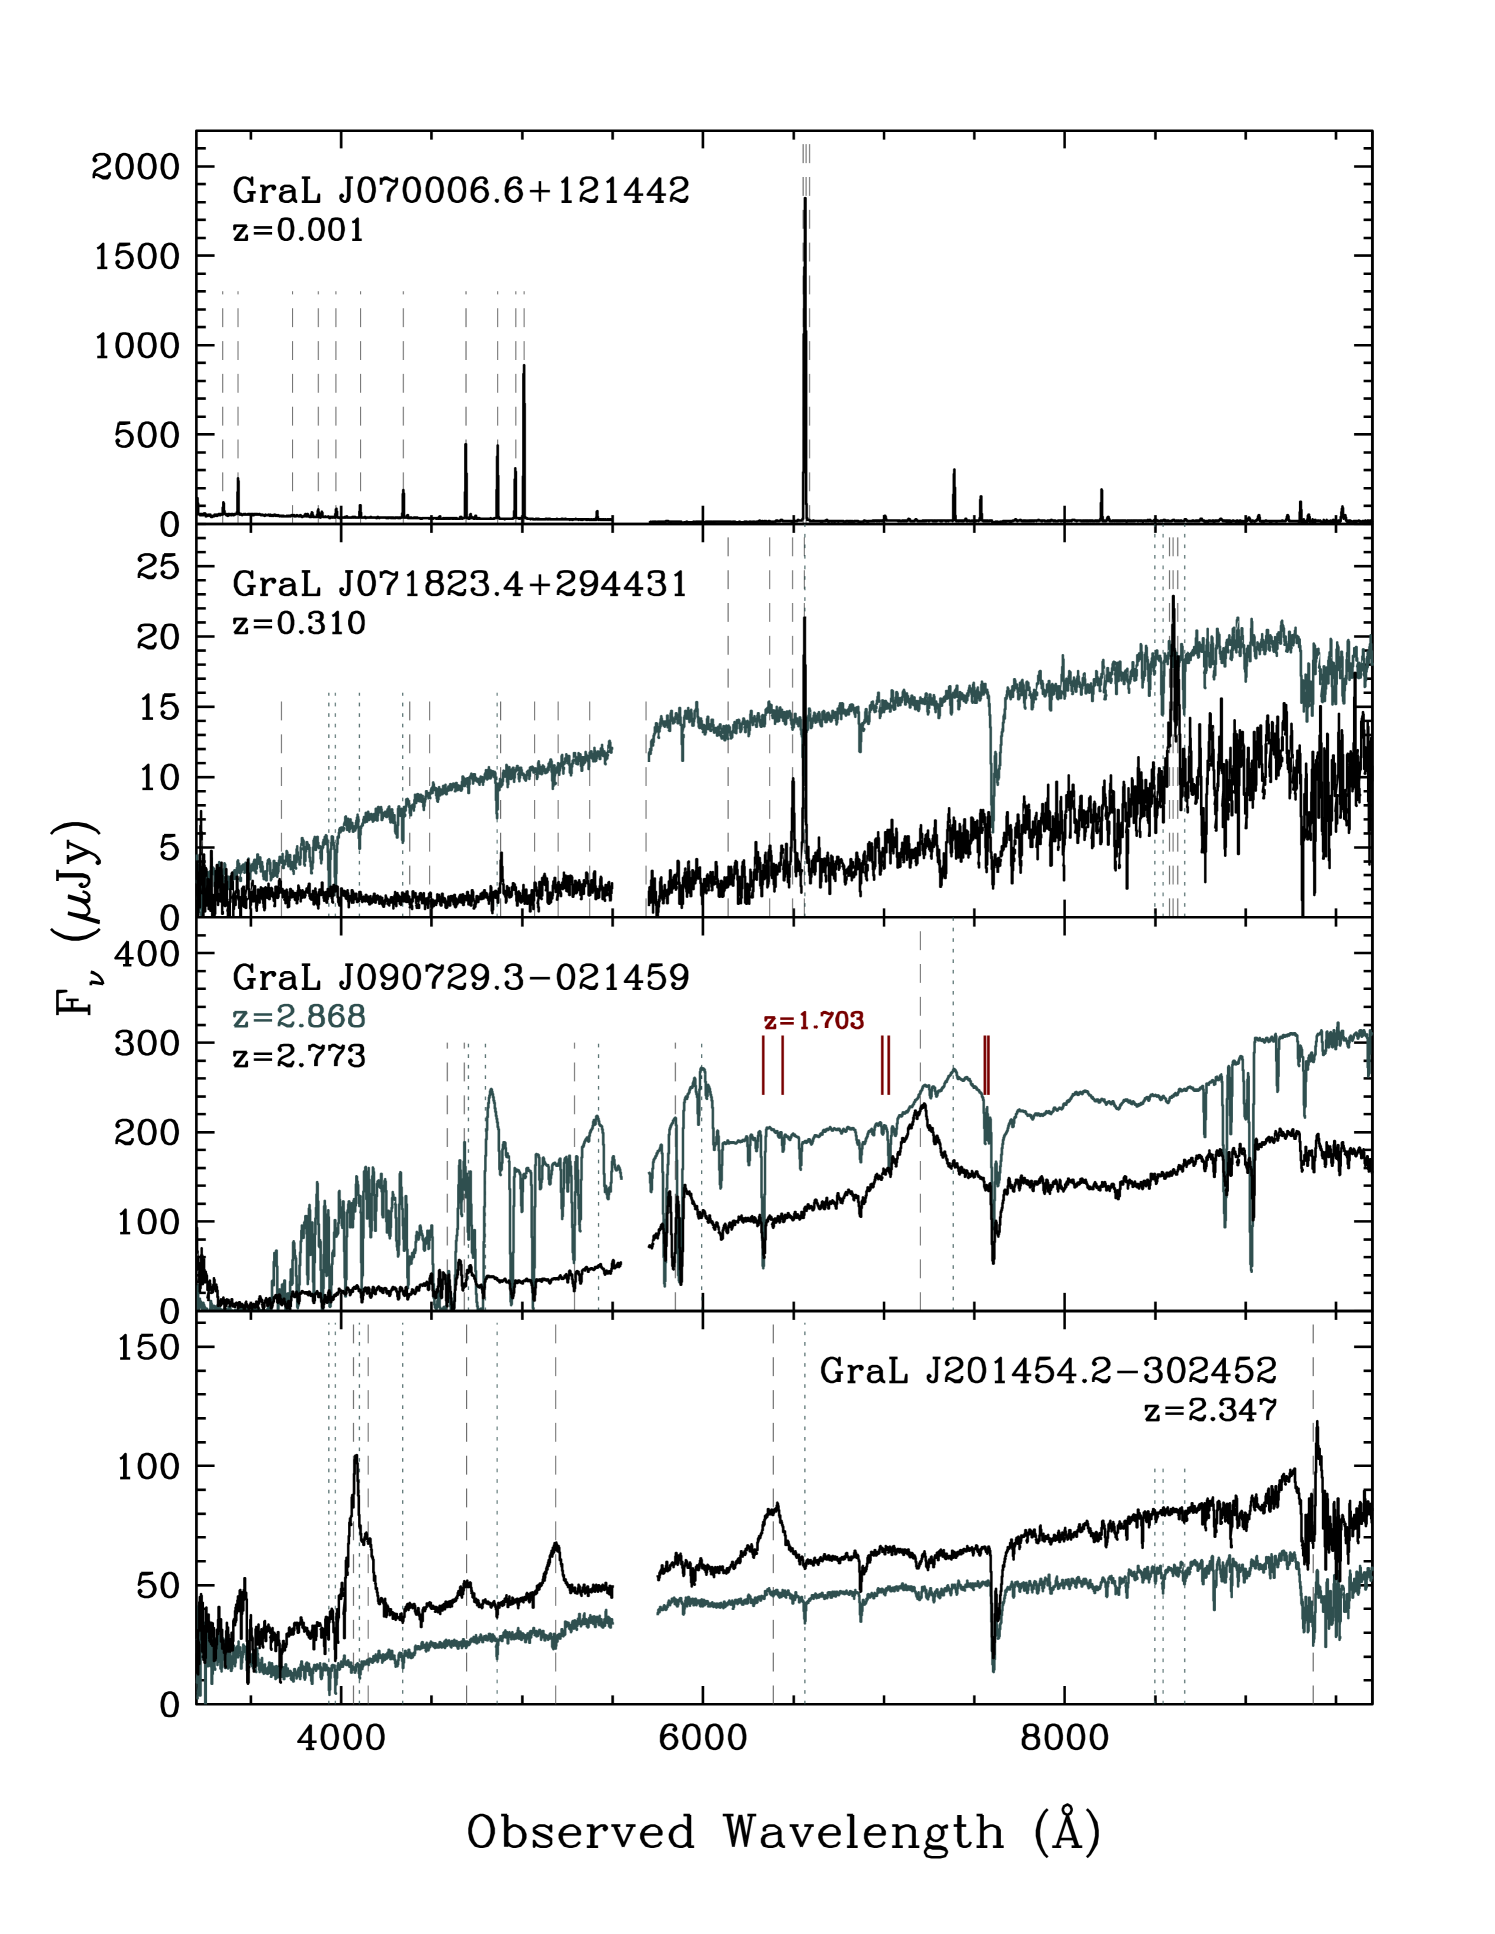
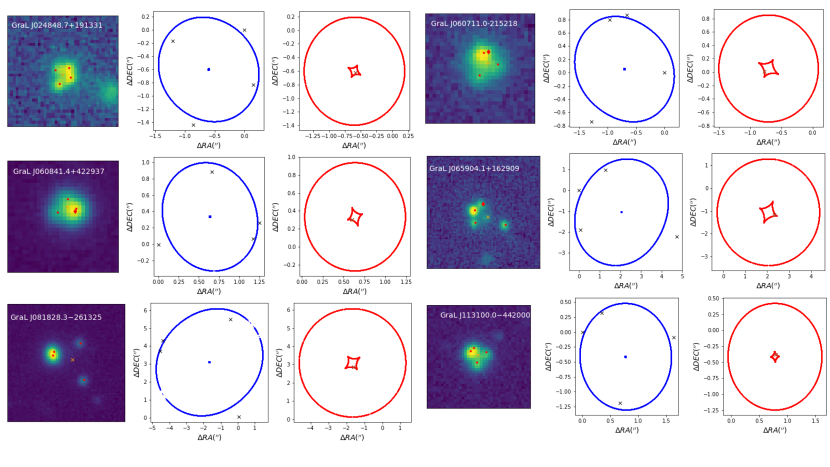
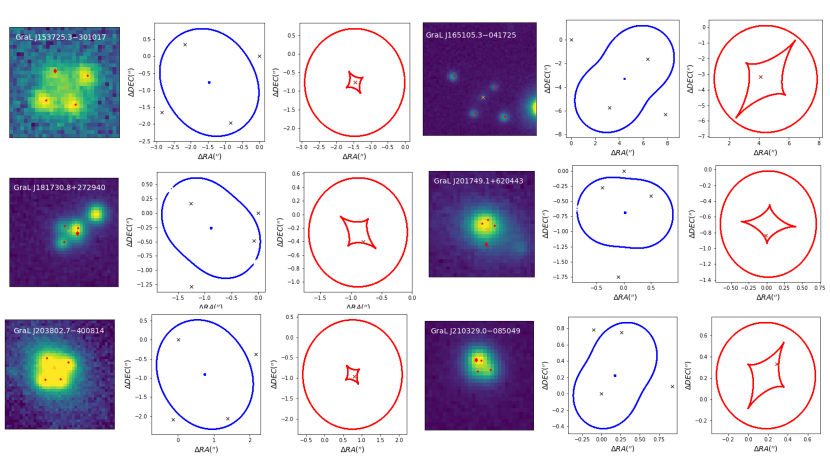
In the following, we present details on all quadruply-imaged quasars confirmed by the GraL collaboration to date. Figure 1 presents false-color optical images of these sources, and Figures 2-4 present their processed spectra.
GraL J024848.7+191331 — This source was presented in Delchambre et al. (2019) as a candidate lensed quasar with three Gaia-detected lensed images, an ERT probability of , and a maximum separation of 17. The PanSTARRS image shows all four components. A single Keck spectrum, aligned to observe the two brightest components, confirms the lensed nature of the source with two spatially separated, nearly identical spectra of the source broad absorption line (BAL) quasar. The spectra show strong O VI emission, as well as a foreground absorption line system at , potentially associated with the lensing galaxy. There are also strong, broadened unidentified absorption features at observed wavelengths of 4525 and 6292 Å, corresponding to rest-frame 1321 and 1838 Å respectively, at the quasar redshift. No radio or X-ray counterparts are reported by NED.
GraL J060710.8215217 — This candidate was selected from a more recent ERT run using Gaia DR2, and has a compact, 17 separated configuration with WISE colors indicative of the presence of an AGN. The lensed quasar nature was confirmed in January 2020 based on Keck spectroscopy at multiple position angles (PAs) that all clearly showed traces of two very close quasars at the same redshift. Figure 2 presents the spectrum obtained at PA=20∘, obtained with a single 30 wide extraction aperture. No radio or X-ray counterparts are reported by NED.
GraL J060841.4+422937 — This candidate was also selected from the more recent ERT run using Gaia DR2, and has a compact, 13 separated configuration. The source had a high (86%) likelihood of being a quasar from the Million Quasars Catalog (ver. 6.4c; Flesch, 2015). Keck spectroscopy was obtained in December 2019 at two PAs, both of which clearly show two spatially distinct spectra of the same lensed quasar. Figure 2 presents the spectra obtained at PA=275∘. An absorption system with multiple features from C IV 1549 to Mg II 2800 is detected at , which is presumed too close to the quasar redshift to be associated with the lensing galaxy. Located in the constellation Auriga, the charioteer, this source has been given the name “Auriga’s Slingshot”. No radio or X-ray counterparts are reported by NED.
GraL J065904.1+162909 — This source was presented in Delchambre et al. (2019) as a candidate lensed quasar with three Gaia-detected lensed images, an ERT probability of , and a wide maximum separation of 52; including SDSS imaging which detects a fourth image, the maximum separation increases to 68. The PanSTARRS image shows all four components, in a kite-like pattern of blue sources around the clearly detected lens galaxy with red optical colors. Owing to this configuration and its location on the sky, we have dubbed this source “Orion’s Crossbow”. We obtained several Keck spectra over multiple observing runs at multiple PAs, and confirmed that all four blue components correspond to a quasar at ; Figure 2 presents just the two spectra of the most separated components, obtained in January 2019 at PA . That spectrum also confirmed the lensing galaxy to be an early-type galaxy at with strong absorption from Ca HK and Mg Ib, as well as a pronounced 4000 Å break. The quasar spectra show multiple absorption line systems, at redshifts of , 2.424, and 2.500. Absorption lines from the lensing galaxy are not seen, likely due to its low redshift placing key features in the dense Ly forest. No radio or X-ray counterparts are reported by NED.
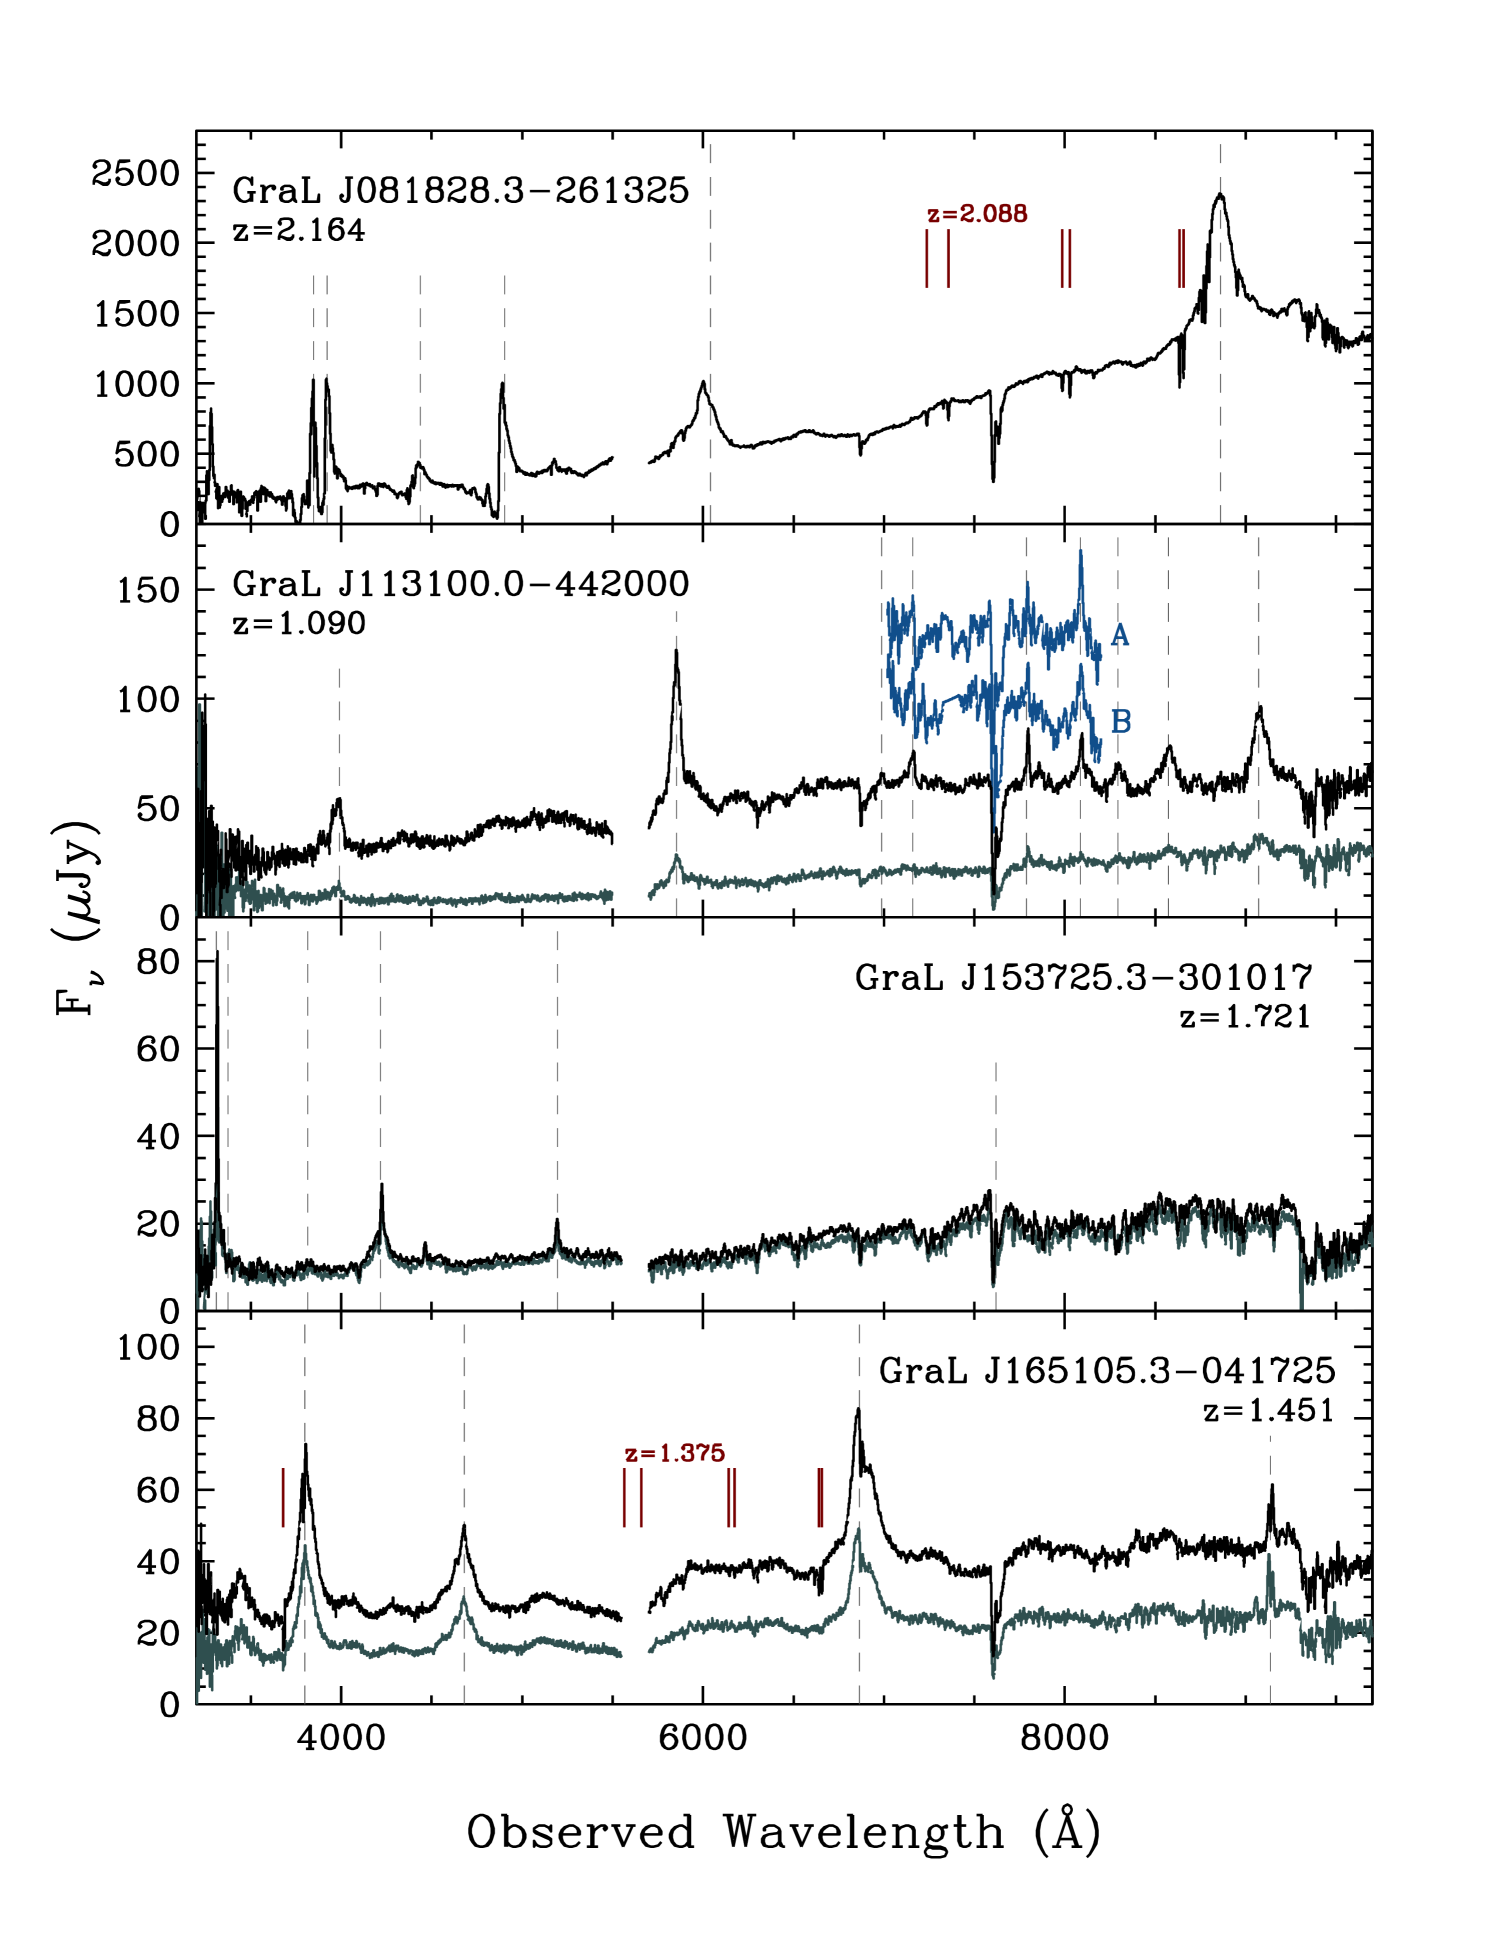
GraL J081828.3261325 — This is a quadruply-imaged quasar at . Two components are closely spaced, with the other two a few arcseconds to the west. Faint red flux potentially associated with the lensing galaxy is evident in Figure 1. This source was identified from a revised ERT search for lensed quasars performed in 2019 combined with the wavelet method discussed in § 2. The Keck observation, presented in Figure 2, targeted the compact pair and shows a spatially extended system in the two-dimensional spectrum, indicative of a lensed quasar, though the seeing was insufficient to resolve the individual components. Instead, a single wide extraction was used. The quasar itself has a red continuum and weak Ly emission, indicative of moderate absorption either at the quasar itself or along the line of sight. We identify several absorption lines due to a foreground system at , unlikely to be associated with the lensing galaxy given the small redshift difference between the quasar and this absorption line system. No radio or X-ray emission are reported by NED. With a WISE m magnitude of , this is the brightest mid-IR lensed quasar presented here. Based on it’s red colors and location in the Puppis constellation, which references the stern deck of the Argo, the ship on which Jason and the Argonauts sailed to get the Golden Fleece, we have named this source “Argo’s Rose”.
GraL J113100.0442000 — This is the quadruply-imaged quasar presented as a candidate in Krone-Martins et al. (2018) and Delchambre et al. (2019), and then spectroscopically confirmed and modelled in Wertz et al. (2019). The latter is a detailed paper dedicated to this single source. This was the first confirmed gravitational lens to be discovered from a machine learning technique that relied only on the relative positions and fluxes of the observed images, without consideration of color information, and thus earned the name “Centaurus’ Victory.” Delchambre et al. (2019) reported an ERT probability of , and a maximum separation of 16. The source is at intermediate redshift, , and the Keck spectroscopy shows no evidence of the central lens galaxy. Gemini IFU observations separated the two quasar images with the smallest angular separation, called A and B in Wertz et al. (2019), as seen in Fig. 3. The lensed quasar is likely associated with 1RXS J113058.9-441949 from the ROSAT all-sky survey bright source catalogue (Voges et al., 1999), which reports an X-ray astrometric uncertainty of 325 in each coordinate. No radio emission is reported by NED.
GraL J153725.3301017 — This source was presented in Delchambre et al. (2019) as a candidate lensed quasar with three Gaia-detected lensed images, an ERT probability of , and a wide maximum separation of 33. The PanSTARRS image shows all four components in a classic diamond configuration, with hints of a red lensing galaxy in the center. We obtained two Keck spectra at PA=165∘, simultaneously observing the eastern and western pair of lensed quasar images in turn. We confirmed that all four blue components correspond to a quasar at ; Figure 3 presents the spectra of the two western components, which show an AGN with strong narrow-line components superposed on broad emission lines. There was no evidence of the lensing galaxy in these spectra, nor do we detect a foreground absorption line system. Located in the constellation Lupus with a configuration suggestive of a paw print, this source has earned the moniker “The Wolf’s Paw”. No radio or X-ray counterparts are reported by NED.
GraL J165105.3041725 — This is the widest separation quadruply-imaged quasar in our sample, with a maximum separation of 101. It was identified from an ERT analysis, initially confirmed at NTT and then deeper spectra were obtained with Keck with two longslit spectra aligned to observe both pairs of lensed quasar images. All four spectra show a quasar at ; Figure 3 presents the Keck/LRIS spectra for the two components observed with the PA = 142∘ slit. That spectrum also confirmed the lensing galaxy to be an early-type galaxy at with strong absorption from Ca HK and Mg Ib, as well as a pronounced 4000 Å break. No absorption from the lensing galaxy is evident in the quasar spectra, though an absorption line system at with strong C IV 1549 and Mg II 2800 absorption is evident. Owing to the large size of this diamond-shaped lens system and its location within the Ophiuchus, or Serpent Bearer, constellation, this lens has been named the “Dragon Kite”. No radio or X-ray counterparts are reported by NED.
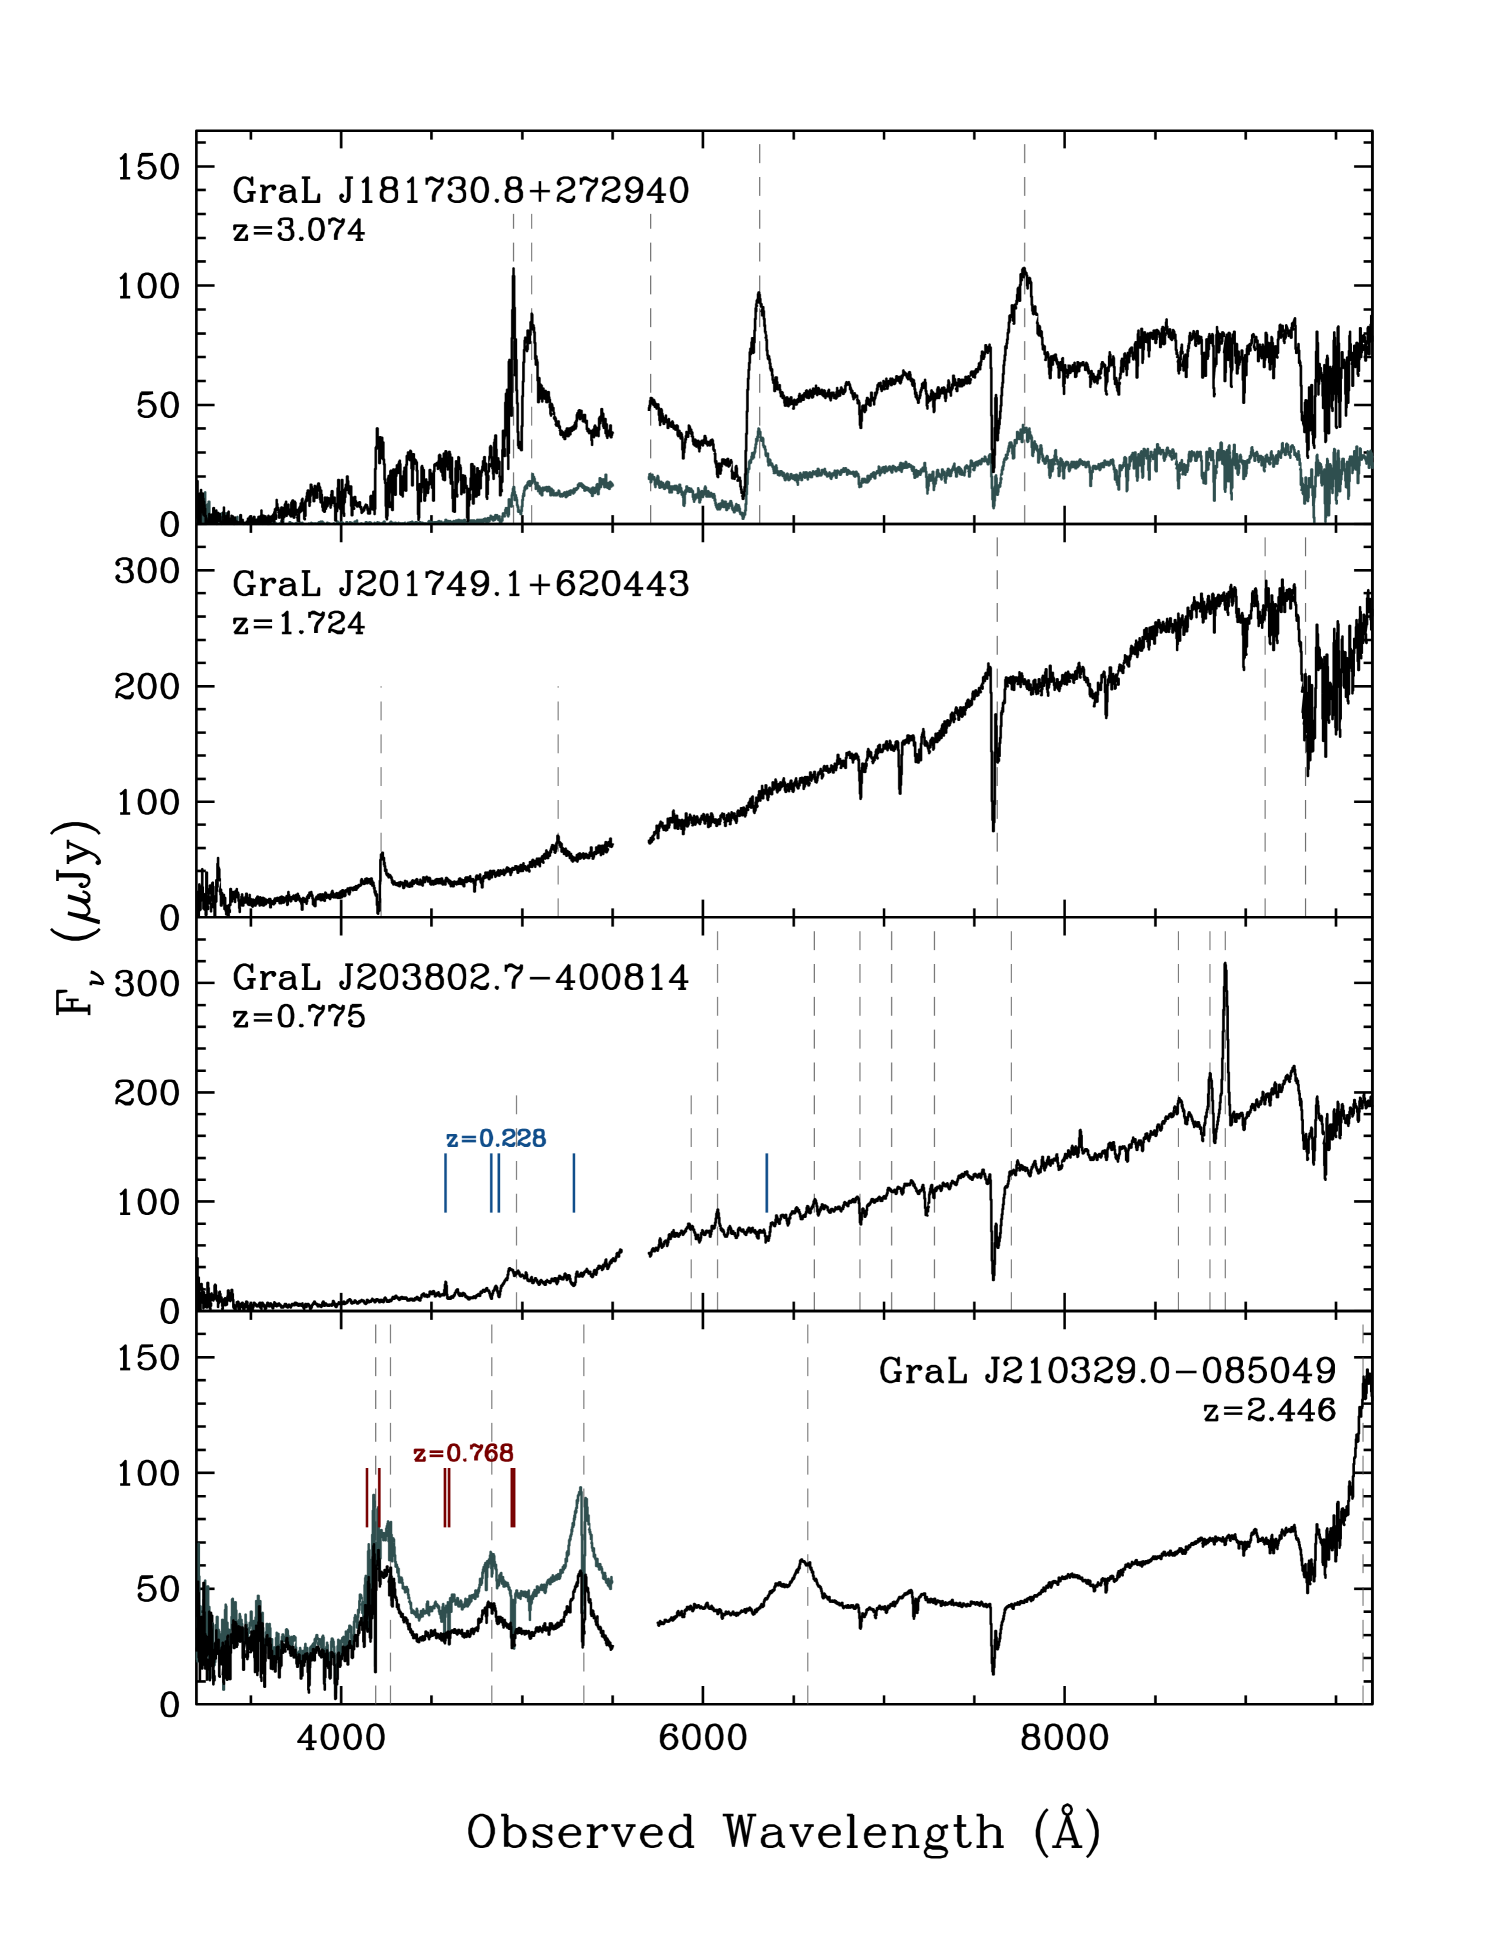
GraL J181730.8+272940 — This source was presented in Delchambre et al. (2019) as a candidate lensed quasar with three Gaia- detected lensed images, an ERT probability of , and a maximum separation of 18. Our Keck spectrum at PA=135∘ confirmed that the fainter SE component and the brighter NW component of the compact configuration are a lensed quasar at with strong C IV 1549 BAL features and weak Ly. The bright point source 2″ NW of the lens was also observed in that slit configuration and shown to be a Galactic mid-type star with absorption from Ca HK, H, and the calcium triplet. Owing to the configuration suggestive of a hilt and a blade, we have named this source “Hercules’ Sword”. The faint radio source NVSS J181731+272951 ( mJy) is approximately 10″ NE of the lens, but is unlikely associated. No X-ray counterparts are reported by NED.
GraL J201749.1+620443 — This source was presented in Delchambre et al. (2019) as a candidate lensed quasar with three Gaia-detected lensed images, an ERT probability of , and a compact maximum separation of just 07. This was the smallest lens system candidate presented in that paper, as well as lowest ERT probability that we have confirmed; only one candidate had an even lower in that paper, which we spectroscopically identified as an asterism of Galactic stars (J011559.5+562506; Table 6). The Keck spectrum did not clearly resolve this quasar as spatially extended, which is consistent with the compact lens configuration, comparable to the seeing of that night. The spectrum itself shows a reddened BAL quasar with several unidentified narrow absorption features (e.g., at 4737, 4778, and 7090 Å). No radio or X-ray counterparts are reported by NED.
GraL J203802.7400814 — This lens, also known as WGD2038-4008, was previously reported in Agnello et al. (2018) from a combined search in WISE and Gaia DR1 over the Dark Energy Survey (DES) footprint, and was independently co-discovered from the GraL ERT analysis and reported in Krone-Martins et al. (2018) and Delchambre et al. (2019). The latter GraL paper reports it as having four Gaia-detected lensed images, an ERT probability of , and a maximum separation of 25. The Keck observation, obtained at a suboptimal PA=90∘ shows two spatially distinct spectra of the reddened lensed quasar, as well as the lensing host galaxy. The [O III] 5007 emission line from the lensed quasar is slightly physically extended, and the lensing galaxy at is clearly identified with [O II] 3727 emission superposed on an early-type galaxy with absorption due to Ca HK, the G-band, and Mg Ib (all indicated with vertical solid marks in Figure 4). Owing to it’s location in the Microscopium constellation, we have named this source the “Microscope Lens”. This lensed system is associated with the ROSAT X-ray source 1RXS J203801.8400818 (Voges et al., 1999). No radio counterpart is identified by NED.
GraL J210329.0085049 — This lensed quasar was identified as a candidate from a Gaia ERT analysis subsequent to Delchambre et al. (2019), with a compact maximum separation of 10. Two lensed quasar spectra are clearly identified in the blue arm of the LRIS data, though they merge at longer wavelengths. The spectra of this source presented in Figure 4 show the two blue arms (extracted with 05 apertures), but a single, scaled red spectrum (extracted with a 20 aperture). We identify a foreground absorption line system at , potentially associated with the lensing galaxy. Similar to the doubly-imaged quasar GraL J234330.6+043557.9 discussed in Krone-Martins et al. (2020), the absorption is significantly stronger in one lensed image (see Fig. 4) than the other. It is assumed that this foreground absorption corresponds to the lensing galaxy, with one of the lensed quasar images intercepting a more dense region of the lensing galaxy. Because of its compact configuration and location on the celestial sphere, we’ve named this source “Aquarius’ Tear”. This system is detected as the X-ray source 1RXS 210328.9085039 (Voges et al., 1999), and no radio counterpart is identified by NED.
5. Confirmed Asterisms
In this section we discuss lensed quasar candidates that were disproved by spectroscopy. Figures 5 and 6 present examples of a few such sources, and Table 6 lists all of the invalidated GraL lens candidates (i.e., asterisms). We represent details on a few of the more interesting interlopers in our sample below.
GraL J060400.6+095545 — This source, identified from an ERT analysis, looked like a promising large quadruply-imaged quasar, with the classic diamond configuration (see Figure 5). The WISE colors indicate the presence of an AGN. However, the spectrum obtained at PA=135∘ reveals that the NW and SE sources are both Galactic. Looking at the image suggests that the NE source, which looks softer and redder than the other components, is likely a galaxy — and an active galaxy given the WISE colors — while the other three components of this lens quasar candidate are instead Galactic. Similar to GraL J071823.4+294431 discussed below, this source appears to correspond to our primary interloper: the chance superposition of a distant AGN with foreground Galactic stars in a configuration that is suggestive of a gravitationally lensed quasar.
GraL J070006.6+121442 — This source, identified as a candidate doubly-imaged quasar, appears as a resolved blue source, approximately 5″ across, with a compact blue core and lobe-like structures stretching from the NW to the SE (see Figure 5). A redder point source is also evident to the NE. This galaxy has very red mid-IR colors (), indicating a likely AGN, and the spectrum we obtained at PA=29∘ shows narrow, high equivalent emission lines from hydrogen, helium, nitrogen, and oxygen (see Figure 6, top panel). At first glance, the spectrum is suggestive of a low-redshift (), low-metallicity starburst, similar to the low-metallicity blue dwarf galaxies reported, for example, by Griffith et al. (2011), and a known contaminant to the WISE AGN selection (e.g., Hainline et al., 2016). However, the He II and [Ne V] lines are unusually strong in this source, suggestive of an AGN. Izotov et al. (2012) report on a sample of eight blue compact dwarf galaxies with [Ne V] emission that they argue are likely associated with several hundred km s-1 radiative shocks. However, in that sample, the He II strengths are 1-4% of the H strength and [Ne V] is less than 1% of the H strength. In contrast, He II is stronger than H in GraL J070006.6+121442, while [Ne V] is of the H strength. This suggests that GraL J070006.6+121442 might be a good candidate for hosting an active nucleus in a nearby dwarf galaxy (e.g., Reines et al., 2013).
GraL J071823.4+294431 — This candidate doubly-imaged quasar, shown in Fig. 5, appears as an enticing configuration consisting of a red galaxy flanked by two point sources, suggestive of an elliptical galaxy lensing a background quasar. Spectroscopy instead reveals the flanking sources to be Galactic stars while the galaxy is an obscured AGN with a very high [O III]:H ratio and relatively narrow H (Figure 6, second panel; Galactic source has been scaled down in flux by 66%). This is the most aesthetic example of one of our most common failure modes: an AGN closely paired with Galactic stars. The AGN is responsible for the red mid-IR colors leading to the candidate selection, while asterisms with Galactic point sources lead to the Gaia selection of a lens candidate.
GraL J090729.3021449 — This candidate doubly-imaged quasar turns out to consist of two distinct quasars at and , separated by (Figure 6, third panel). Absorption from the foreground quasar is evident in the background quasar, providing an opportunity to study the environment and feedback from the foreground AGN (e.g., Hennawi et al., 2006). In addition, there are absorption systems foreground to both quasars, such as the systems shown in Figure 6, providing an opportunity to study the spatial extent and kinematics of quasar absorption line systems.
GraL J122628.5454209 — This was one of the three new candidate quadruply-imaged quasars presented in Krone-Martins et al. (2018), along with the now confirmed GraL J113100.0442000 and GraL J203802.7400814 systems discussed in § 4. With , this source had the lowest ERT probability of all the sources discussed in that paper, which also included several known, confirmed quadruply-imaged quasars; these confirmed lens systems all had . The low was thought due a combination of the optical faintness of several of the lensed images, as well as the proximity of this system to a bright () star at a distance of only . Observations obtained during the first spectroscopic observing run for this project identified the Galactic nature of GraL J122628.5454209. This is consistent with the blue mid-IR colors of the source, , which is unresolved by WISE. In contrast, the two confirmed lenses from that paper have red, colors, indicative of an AGN (e.g., Stern et al., 2012).
GraL J201454.2302452 — This source, shown in Fig. 5, was presented in Delchambre et al. (2019) as a candidate lensed quasar with three Gaia-detected lensed images, an ERT probability of , and a compact maximum separation of 25. Spectroscopic follow-up shows the two eastern sources to be a doubly-imaged quasar at , while the western source is a Galactic star. Figure 6 (bottom panel) shows one of the quasar spectra and the western Galactic source spectrum. Due to imperfect source deblending, faint features from the Galactic star are imprinted on the quasar spectrum, and vice versa.
6. Lens modelling
We have performed gravitational lens modeling of each of the confirmed quad lensed systems using two standard families of mass distribution: a singular isothermal sphere (SIS) and a singular isothermal ellipsoid (SIE; Kormann et al., 1994). The parameters of these models are the Einstein radius , lens galaxy position, and, in the case of the SIE, the lens ellipticity (where is the axis ratio) and position angle PAe. In both cases, an additional shear term has been added to the model to account for the statistical gravitational impact of galaxies along the line-of-sight towards the lens system. For the SIS lens model, this shear term also accounts for ellipticity in the lens. The shear term parameters are its amplitude and its position angle PAg (reported E of N, and pointing towards the mass producing the shear). The modeling has been performed using the public modeling software lensmodel (Keeton, 2001). The following observables were used to constrain the lens models: the relative astrometry between the lensed images, and the observed flux ratios. For each system, the Gaia astrometry and photometry were used except for GraL J065904.1162909, for which positions and fluxes come from SDSS. We used the formal uncertainty on positions but enforced a minimum astrometric uncertainty of 0002 to account for possible perturbation of image positions caused by structures in the lens potential not described by our model (e.g., dark matter subhaloes of ). We also enlarged the uncertainty on the flux ratio to account for deviations from any macro model as caused by microlensing, millilensing, intrinsic variability, and/or differential dust reddening. Table 5 in the Appendix provides a summary of the data used.
The positions of all four lensed images were available for half of the sample. For those systems, we enlarged the flux ratio relative uncertainty to 20%. For the other five systems, data were available for only a triplet of images (see Tables 3 and 4), and a flux ratio relative uncertainty of 10% has been included. For triplets, we have also guessed the position of the fourth image to initiate the modeling. Finally, for a few systems, we have complemented this information with measurements from ancillary data. We have used the PanSTARRS position of the lensing galaxy for GraL J165105.3041725, and of the fourth lensed image for GraL 065904.1+162909.
6.1. Results
The results of the modeling are presented in Tables 3 and 4, and Figures 7 and 8. Models for each systems are discussed below. The most robust parameters from this kind of lens modeling are the Einstein radius and the position angle of the lensing galaxy PAe when four lensed images are observed (e.g., Sluse et al., 2012). Models that involve only three lensed images are more uncertain. Because SIE models are under-constrained when only three lensed images are observed, we chose not to present them.
GraL J024848.7+191331 — A model based on HST imaging of this system was published in Shajib et al. (2019). The HST data confirm the image configuration and Einstein radius of our simple model based on only three lensed images detected by Gaia.
GraL J060710.8215217 — Our model for this compact quad consists of a fold-configuration lens. Our SIS+ model requires a moderate shear (), but this shear could effectively be caused by the lens ellipticity. This model implies that the brightest component visible in the ground-based imaging is in fact composed of a merging pair, with the two, roughly equal brightness components unresolved by Gaia.
GraL J060841.4+422937 — The image configuration and model obtained for this system are similar to GraL J060710.8215217. The fourth image is predicted to be from the brightest component detected in Gaia data.
GraL J065904.1+162909 — This large separation system () is not easily reproduced with a SIS+ model. A substantial shear and a very large ellipticity are required to reasonably reproduce the image positions. However, the flux ratios are poorly reproduced by this model. Since the flux ratios between the images forming the bright triplet substantially deviates from the asymptotic relation linking “cusp” images, we suspect that substantial microlensing is at work in (at least) one of those images (e.g., Mao & Schneider, 1998). On the other hand, the extreme value found for the ellipticity and large Einstein radius () are indicative of a missing ingredient in the mass model, either a nearby massive galaxy, or a galaxy group/cluster along the line-of-sight.
GraL J081828.3261325 — This is the system with the second largest Einstein radius (). Both shear and lens ellipticity are required to reproduce the image configuration, as shown by the large associated with the SIS model. That model is unable to reproduce the observed image positions. This indicates that a galaxy group or cluster may lie along the line-of-sight towards this system.
GraL J113100.0442000 — This system was modeled in GraL IV (Wertz et al., 2019). The models presented here agree with the previous ones.
GraL J153725.3301017 — This system has a rather large . While the model is very uncertain since it is based on three lensed images only, it predicts positions of the fourth image and of the lensing galaxy that are qualitatively compatible with the PanSTARRS imaging. An SIE model (without shear) was presented in Lemon et al. (2019). They find , in agreement with our SIS model.
GraL 165105.3041725 — The lensed images of this very large separation system are well reproduced by our simple models provided that a large external shear is included, as one already expects from the elongated cross-like morphology. In addition, the centroid of the mass model is found to be significantly offset (015) from the observed position of the main lensing galaxy. Note that this is the only system for which we have used a lens galaxy position for the modeling. These properties indicate the presence on the line-of-sight towards this system of one or several massive perturbers, most probably a galaxy group or cluster, possibly at the same redshift as the main deflector. This situation is typical of very large separation systems (e.g., Walsh et al., 1979; Inada et al., 2003; Rusu et al., 2013).
GraL J181730.8+272940 — The best SIS model that reproduces the triplet of Gaia-detected images is a fold-configuration model for which the brightest component is a merging of two images. However, based on multi-band and high-resolution images, Rusu & Lemon (2018) showed that the fourth lensed image suffers from strong extinction by the lensing galaxy, such that this system has effectively a cross-like configuration. This configuration cannot be reproduced with a SIS+ model, but requires a more complex mass distribution and external shear, as shown by Rusu & Lemon (2018). The lens models presented by those authors supersede the ones presented here.
GraL J201749.1+620443 — Our lens model consists of a short-axis cusp configuration, with a fourth lensed image predicted opposite to the observed triplet. Despite the small Einstein radius (), a very large shear is needed to accommodate this model (). The latter could be associated with the nearby red object observable south-west of the lens, which is roughly along the direction producing the shear in our model.
GraL J203802.7400814 — This system is well reproduced by our simple models. The SIE model indicates a moderate shear and ellipticity. The presented models are in qualitative agreement with previously published ones (Agnello et al., 2018; Shajib et al., 2019). The model presented in Shajib et al. (2019), constrained by HST imaging that detects the host galaxies, supersedes the models presented here.
GraL J210329.0085049 — Our model consists of a fold-configuration lens for which the brightest component visible in ground-based imaging is in fact composed of two merged sources. This model requires a large extrinsic shear () and predicts a fourth lensed image as bright as the observed one. The absence of this fourth image in the Gaia data suggests that this model and the predicted image morphology is erroneous.
| Name | PAg | |||||
|---|---|---|---|---|---|---|
| (″) | (∘) | |||||
| GraL J024848.7+191331 | 0.81 | 0.06 | 61 | 0.06 | 0.28 | |
| GraL J060711.0-215218 | 0.82 | 0.10 | 61 | 0.89 | 0.46 | |
| GraL J060841.4+422937 | 0.62 | 0.08 | 20 | 1.09 | 3.43 | |
| GraL J065904.1+162909 | 2.37 | 0.10 | -24 | 118.13 | 69.19 | |
| GraL J081828.3261325 | 3.01 | 0.08 | -53 | 12697.06 | 5.66 | |
| GraL J113100.0442000 | 0.85 | 0.05 | 4 | 86.18 | 4.73 | |
| GraL J153725.3301017 | 1.48 | 0.10 | 30 | 0.02 | 0.04 | |
| GraL J165105.3041725 | 3.46 | 0.31 | -38 | 32.05 | 7.11 | 493.06 |
| GraL J181730.8+272940 | 0.82 | 0.19 | 51 | 0.81 | 5.55 | |
| GraL J201749.1+620443 | 0.69 | 0.22 | 85 | 1.65 | 0.17 | |
| GraL J203802.7400814 | 1.36 | 0.09 | 35 | 21.08 | 1.51 | |
| GraL J210329.0085049 | 0.51 | 0.26 | -30 | 1.69 | 0.18 |
Note. — : Models based only on three lensed image positions. : Model includes lens galaxy position from PanSTARRS.
| Name | PAe | PAg | ||||||
|---|---|---|---|---|---|---|---|---|
| (″) | (∘) | (∘) | ||||||
| GraL J065904.1+162909 | 2.43 | 0.70 | -18 | 0.10 | 83 | 4.10 | 33.34 | |
| GraL J081828.3261325 | 2.87 | 0.36 | 10 | 0.28 | -61 | 0.01 | 8.22 | |
| GraL J113100.0442000 | 0.85 | 0.10 | 25 | 0.04 | -13 | 0.01 | 4.29 | |
| GraL J165105.3041725 | 3.56 | 0.39 | -38 | 0.24 | -38 | 38.68 | 12.21 | 379.52 |
| GraL J203802.7400814 | 1.35 | 0.21 | -58 | 0.13 | 33 | 0.00 | 0.35 |
Note. — Models for which four lensed image positions are detected.
7. Conclusions
We present the results of spectroscopic efforts to verify candidate strongly lensed quasars identified using machine learning methods on Gaia astrometric and photometric data, supplemented with mid-IR photometry from WISE and optical light curves from CRTS and Palomar observatory. We present 12 confirmed quadruply-imaged quasars, seven of which are first reported here. All of the confirmed lenses were either first reported as candidates by the GraL collaboration or were independently identified by GraL and other collaborations. We also present one doubly-imaged quasar, GraL J201454.2302452, that was initially selected as three-image lens. A companion paper, Krone-Martins et al. (2020), reports on the selection and confirmation of doubly-imaged quasars from these efforts. As an aid to future investigations, we also present the spectroscopic failures, where follow-up observations generally revealed the candidates to be either purely Galactic or the chance asterism of Galactic stars and a background, typically active, galaxy.
Delchambre et al. (2019), a previous paper from our collaboration, presented 15 candidate quadruply-imaged quasars. What do our spectroscopic observations reveal about the success rate for these candidates? Of the 15 candidates, we now have spectroscopic follow-up of 12; the three remaining candidates are in the southern sky and are challenging to inaccessible from our primarily northern follow-up facilities at Maunakea and Palomar Mountain (one candidate is at declination, and the other two have declinations below ). Of the 12 observed sources, six are confirmed as quadruply-imaged quasars and a seventh source, GraL J201454.2302452, is a doubly-imaged quasar with a close Galactic interloper that masqueraded as a third lensed image (see § 5). Two more candidates are asterims of a quasar and Galactic stars, and the final three candidates (which include both the highest and the lowest ERT probability candidates from that paper) are purely Galactic. Notably, all three Galactic systems have blue mid-IR colors (), while all nine confirmed quasars have red mid-IR colors, , though two are not sufficiently red to have been identified using the Stern et al. (2012) mid-IR color criterion (i.e., ). Of the three remaining candidates from Delchambre et al. (2019) lacking spectroscopic follow-up, only GraL J053036.9373011 has WISE colors indicative of a quasar. With and a very compact configuration with three Gaia sources within 10, this is the highest priority source for future spectroscopy. Were we to impose a modest and simple mid-IR color criterion of on the Gaia lensed quasar candidates from Delchambre et al. (2019), then our spectroscopy would confirm that all 9 observed candidates (100%) include an active galaxy, with seven (78%) including a lensed quasar and six (67%) confirmed as the quadruply-imaged quasars sought by Delchambre et al. (2019).
This paper presents the twelve confirmed GraL quadruply-imaged quasars as of Summer 2020, which accounts for approximately a 20% increase in the number of confirmed quadruply-imaged quasars. This work sets the stage for multi-wavelength follow-up activities. Besides photometric monitoring which will enable using these sources as cosmological probes, we also have ongoing follow-up campaigns that include high-resolution radio follow-up, X-ray observations, and near-infrared adaptive optics integral field unit spectroscopy to improve modeling and enable scientific exploitation of these rare systems. The results presented here have also guided revised machine learning approaches by the GraL team to identify new lensed quasars based on the forthcoming Gaia data releases and public data sets, such as the recently published Gaia Early Data Release 3 (Gaia Collaboration et al., 2020). The hunt continues.
References
- Agnello et al. (2018) Agnello, A., Lin, H., Kuropatkin, N., et al. 2018, MNRAS, 479, 4345
- Ahmed & Mandic (2011) Ahmed, M. U. & Mandic, D. P. 2011, Phys. Rev. E, 84, 1918
- Allington-Smith et al. (2002) Allington-Smith, J. R., Murray, G., Content, R., et al. 2002, PASP, 114, 892
- Assef et al. (2018) Assef, R. J., Stern, D., Noirot, G., et al. 2018, ApJS, 234, 23
- Bellm et al. (2019) Bellm, E. C., Kulkarni, S. R., Graham, M. J., et al. 2019, PASP, 131, 18002
- Blackburne et al. (2011) Blackburne, J. A., Pooley, D., Rappaport, S., & Schechter, P. L. 2011, ApJ, 729, 34
- Blackburne et al. (2015) Blackburne, J. A., Kochanek, C. S., Chen, B., Dai, X., & Chartas, G. 2015, ApJ, 798, 95
- Braibant et al. (2017) Braibant, L., Hutsemékers, D., Sluse, D., Goosmann, R. 2017, A&A, 607, A32
- Chao et al. (2020) Chao, D. C.-Y., Chan, J. H.-H., Suyu, S. H., et al. 2020, A&A, 640, 88
- Chartas et al. (2016) Chartas, G., Rhea, C., Kochanek, C., et al. 2016, AN, 337, 356
- Chen et al. (2019) Chen, G. C.-F., Fassnacht, C. D., Suyu, S. H., et al. 2019, MNRAS, 490, 1743
- Collett et al. (2018) Collett, T. E., Oldham, L. J., Smith, R. J., et al. 2018, Science, 360, 1342
- Delchambre et al. (2019) Delchambre, L., Krone-Martins, A., Wertz, O., et al. 2019, A&A, 622, 165
- Drake et al. (2009) Drake, A. J., Djorgovski, S. G., Mahabal, A., et al. 2009, ApJ, 696, 870
- Ducourant et al. (2018) Ducourant, L., Wertz, O., Krone-Martins, A., et al. 2018, A&A, 618, 56
- Finet & Surdej (2016) Finet, R. & Surdej, J. 2016, A&A, 590, 42
- Flesch (2015) Flesch, E. W. 2015, PASA, 32, 10
- Gaia Collaboration et al. (2016b) Gaia Collaboration, Brown, A. G. A., Vallenari, A., et al. 2016, A&A, 595, A2
- Gaia Collaboration et al. (2018) Gaia Collaboration, Brown, A. G. A., Vallenari, A., et al. 2018, A&A, 616, A1
- Gaia Collaboration et al. (2020) Gaia Collaboration, Brown, A. G. A., Vallenari, A., et al. 2020, arXiv:2012.01533
- Gaia Collaboration et al. (2016a) Gaia Collaboration, Prusti, T., de Bruijne, J. H. J., et al. 2016, A&A, 595, A1
- Gilman et al. (2019) Gilman, D., Birrer, S., Treu, T., Nierenberg, A., & Benson, A. 2019, MNRAS, 487, 5721
- Graham et al. (2019) Graham, M. J., Kulkarni, S. R., Bellm, E. C., et al. 2019, PASP, 131, 78001
- Griffith et al. (2011) Griffith, R. L., Tsai, C.-W., Stern, D., et al. 2011, ApJ, 736, L22
- Hainline et al. (2016) Hainline, K. N., Reines, A. E., Greene, J. E., & Stern, D. 2016, ApJ, 832, 119
- Griffith et al. (2011) Griffith, R. L., Tsai, C.-W., Stern, D., et al. 2011, ApJ, 736, L22
- Hamuy et al. (1994) Hamuy, M., Suntzeff, N. B., Heathcote, S. R., Walker, A. R., Gigoux, P. & Phillips, M. M. 1994, PASP, 106, 566
- Hennawi et al. (2006) Hennawi, J. F., Prochaska, J. X., Burles, S., et al. 2006, ApJ, 651, 61
- Hook et al. (2004) Hook, I. M., Jørgensen, I., Allington-Smith, J. R., Davies, R. L., Metcalfe, N., Murowinski, R. G., & Crampton, D. 2004, PASP, 116, 425
- Inada et al. (2003) Inada, N., Oguri, M., Pindor, B., et al. 2003, Nature, 426, 6968
- Izotov et al. (2012) Izotov, Y. I., Thuan, T. X. & Privon, G. 2012, MNRAS, 427, 1229
- Keeton (2001) Keeton, C. R. 2001, ApJ, submitted (arXiv:0102340)
- Khramtsov et al. (2019) Khramtsov, V., Sergeyev, A., & Spiniello, M., et al. 2019, A&A, 632, 56
- Kormann et al. (1994) Kormann, R., Schneider, P., & Bartelmann, M. 1994, A&A, 284, 285
- Krone-Martins et al. (2018) Krone-Martins, A., Delchambre, L., Wertz, O., et al. 2018, A&A, 616, 1
- Krone-Martins et al. (2020) Krone-Martins, A., Graham, M. J., Stern, D., et al. 2020, ApJ, submitted (arXiv:1912.08977)
- Lemon et al. (2018) Lemon, C.A., Auger, M. W., McMahon, R.G, & Ostrovski, F. 2018, MNRAS, 479, 5060
- Lemon et al. (2019) Lemon, C.A., Auger, & M. W., McMahon, R.G 2019, MNRAS, 483, 4242
- Lemon et al. (2020) Lemon, C.A., Auger, M. W., McMahon, R.G, et al. 2020, MNRAS, 494, 3491
- Mao & Schneider (1998) Mao, S. & Schneider, P. 1998, MNRAS, 295, 587
- Massey & Gronwall (1990) Massey, P. & Gronwall, C. 1990, ApJ, 358, 344
- More et al. (2016) More, A., Oguri, M., Kayo, I., et al. 2016, MNRAS, 456, 1595
- Nierenberg et al. (2020) Nierenberg, A. M., Gilman, D., Treu, T., et al. 2020, MNRAS, 493, 5314
- Oke et al. (1995) Oke, J. B., Cohen, J. G., Carr, M., et al. 1995, PASP, 107, 375
- Ostrovski et al. (2017) Ostrovski, F., McMahon, R. G., Connolly, A. J., et al. 2017, MNRAS, 465, 4325
- Ostrovski et al. (2018) Ostrovski, F., Lemon, C. A., Auger, M. W., et al. 2018, MNRAS, 473, L116
- Pooley et al. (2009) Pooley, D., Rappaport, J., Blackburne, I., Schechter, P. L., Schwab, J., & Wambsganss, J. 2009, ApJ, 698, 1892
- Reines et al. (2013) Reines, A. E., Greene, J. E., & Geha, M. 2013, ApJ, 775, 116
- Rusu et al. (2013) Rusu, C. E., Oguri, M., Iye, M., Inada N., Kayo, I., Shin, M.-S., Sluse, D., Strauss, M. 2013, ApJ, 765, 139
- Rusu & Lemon (2018) Rusu, C. E. & Lemon, C. A. 2018, RNAAS, 4, 187
- Shajib et al. (2019) Shajib, A. J.; Birrer, S.; Treu, T., et al. 2019 MNRAS, 483, 5649
- Shajib et al. (2020) Shajib, A. J.; Birrer, S.; Treu, T., et al. 2020 MNRAS, 494, 6072
- Sluse et al. (2011) Sluse, D., Schmidt, R., Courbin, F., et al. 2011, A&A, 528, A100
- Sluse et al. (2012) Sluse, D., Chantry, V., Magain, P., Courbin, F., & Meylan, G. 2012, A&A, 538, A99
- Stern et al. (2012) Stern, D., Assef, R. J., Benford, D. J., et al. 2012, ApJ, 753, 30
- Voges et al. (1999) Voges, W., Aschenbach, B., Boller, Th., et al. 1999, A&A, 349, 389
- Walton et al. (2015) Walton, D. J., Reynolds, M. T., Miller, J. M., Reis, R. C., Stern, D., & Harrison, F. A. 2015, ApJ, 805, 161
- Walsh et al. (1979) Walsh, D., Carswell, R. F., Weymann, R. J. 1979, Nature, 279, 381
- Wertz et al. (2019) Wertz, O., Stern, D., Krone-Martins, A., et al. 2019, A&A, 628, 17
Facilities: CRTS, Gaia, Gemini (GMOS), Keck:I (LRIS), NTT (EFOSC2), Palomar (DBSP), WISE, ZTF.
©2020. All rights reserved.
Table 5 presents the astrometric and photometric data used for the lens modeling described in § 6; these data come from Gaia for all sources other than the western component of GraL J065904.1+162909, and the listed Gaia photometry corresponds to the -band mean magnitudes (Vega); for that one exception, the data comes from SDSS. Table 6 presents the GraL lens candidates which spectroscopic observations failed to confirm as lensed quasars.
| Name | RA | err RA | Dec | err Dec | |
|---|---|---|---|---|---|
| (″) | (″) | (″) | (″) | (mag) | |
| GraL J024848.7+191331 | 0.0000 | 0.002 | 0.0000 | 0.002 | 20.41 |
| 0.8553 | 0.004 | -1.4426 | 0.003 | 20.71 | |
| -0.1478 | 0.002 | -0.8383 | 0.002 | 20.41 | |
| GraL J060711.0215218 | 0.0000 | 0.002 | 0.0000 | 0.005 | 20.90 |
| 1.2907 | 0.002 | -0.7385 | 0.003 | 20.86 | |
| 0.9647 | 0.002 | 0.7982 | 0.002 | 19.32 | |
| GraL J060841.4+422937 | 0.0000 | 0.008 | 0.0000 | 0.010 | 20.13 |
| -1.2462 | 0.002 | 0.2580 | 0.002 | 18.23 | |
| -0.6614 | 0.003 | 0.8846 | 0.003 | 19.86 | |
| GraL J065904.1+162909 | 0.0000 | 0.002 | 0.0000 | 0.002 | 18.59 |
| -4.7491 | 0.002 | -2.2357 | 0.002 | 20.05 | |
| -0.0849 | 0.002 | -1.9017 | 0.002 | 19.94 | |
| 1.1879 | 0.003 | 0.9889 | 0.010 | 20.00 | |
| GraL J081828.3261325 | 0.0000 | 0.002 | 0.0000 | 0.002 | 19.74 |
| 4.3682 | 0.002 | 3.6783 | 0.002 | 17.58 | |
| 0.4577 | 0.002 | 5.5737 | 0.002 | 19.94 | |
| 4.4929 | 0.002 | 4.3175 | 0.002 | 17.52 | |
| GraL J113100.0442000 | 0.0000 | 0.002 | 0.0000 | 0.002 | 19.38 |
| -1.6280 | 0.002 | -0.1000 | 0.002 | 20.13 | |
| -0.6888 | 0.002 | -1.1864 | 0.002 | 20.31 | |
| -0.3454 | 0.002 | 0.3246 | 0.002 | 19.32 | |
| GraL J153725.3301017 | 0.0000 | 0.002 | 0.0000 | 0.002 | 20.32 |
| 0.8423 | 0.002 | -1.9630 | 0.003 | 20.45 | |
| 2.8427 | 0.002 | -1.6485 | 0.002 | 20.22 | |
| GraL J165105.3041725 | 0.0000 | 0.002 | 0.0000 | 0.002 | 19.60 |
| -3.2119 | 0.002 | -5.7522 | 0.002 | 19.49 | |
| -7.8631 | 0.002 | -6.3014 | 0.002 | 18.99 | |
| -6.3679 | 0.002 | -1.6598 | 0.002 | 20.04 | |
| GraL J165105.3041725-G | -4.5961 | 0.010 | -3.1504 | 0.010 | |
| GraL J181730.8+272940 | 0.0000 | 0.002 | 0.0000 | 0.002 | 18.93 |
| 1.2633 | 0.002 | 0.1584 | 0.002 | 20.72 | |
| 1.2565 | 0.002 | -1.2832 | 0.002 | 20.07 | |
| GraL J201749.1+620443 | 0.0000 | 0.002 | 0.0000 | 0.002 | 19.15 |
| -0.5011 | 0.020 | -0.4097 | 0.060 | 20.14 | |
| 0.4052 | 0.009 | -0.2760 | 0.041 | 19.71 | |
| GraL J203802.7400814 | 0.0000 | 0.002 | 0.0000 | 0.002 | 20.26 |
| 0.1354 | 0.002 | -2.0863 | 0.002 | 19.65 | |
| -2.1721 | 0.002 | -0.3813 | 0.002 | 19.90 | |
| -1.3791 | 0.002 | -2.0573 | 0.002 | 19.61 | |
| GraL J210329.0085049 | 0.0000 | 0.007 | 0.0000 | 0.008 | 20.43 |
| -0.9107 | 0.038 | 0.0664 | 0.017 | 19.08 | |
| -0.2587 | 0.002 | 0.7528 | 0.002 | 18.47 |
| Name (Type) | Coordinates | Night | PA | Exp. Time (s) | Notes |
|---|---|---|---|---|---|
| J0001+2040 | 00:01:39, +20:40:00 | N05-P | 97∘ | quasar () + star | |
| J0009+3719 | 00:09:52, +37:19:11 | N05-P | 320∘ | quasar () + star | |
| J0015+4853 | 00:15:20, +48:53:07 | N17-K | 210∘ | quasar () + star | |
| N17-K | 262∘ | quasar () + star | |||
| J0036+2751 | 00:36:04, +27:51:14 | N05-P | 53∘ | quasar () + star | |
| J0101+6719 | 01:01:23, +67:19:06 | N08-K | 164∘ | star + star | |
| N08-K | 74∘ | star + star | |||
| J0103+3607 | 01:03:20, +36:07:05 | N05-P | 48∘ | star + likely obscured AGN | |
| J0109+5002 | 01:09:46, +50:02:45 | N17-K | 239∘ | 300 | AGN () + star + star |
| J0112+3248 | 01:12:27, +32:48:38 | N06-K | 15∘ | quasar () + star | |
| J0115+5625 | 01:15:59, +56:25:06 | N06-K | 356∘ | star + star | |
| J0218+7445 | 02:18:23, +74:45:23 | N09-K | 145∘ | 300 | close stellar pair (or single star) |
Note. — The first ten asterisms are presented here to illustrate the format of this table. The on-line version of the journal contains the full list of invalidated GraL lens candidates.