Anomalous Stellar Populations in LSB Galaxies
Abstract
We present new HST WFC3 near-IR observations of the CMD’s in two LSB galaxies, F575-3 and F615-1, notable for having no current star formation based on a lack of H emission. Key features of the near-IR CMD’s are resolved, such as the red giant branch (RGB), the asymptotic giant branch (AGB) region and the top of the blue main sequence (bMS). F575-3 has the bluest RGB of any CMD in the literature, indicating an extremely low mean metallicity. F615-1 has unusually wide RGB and AGB sequences suggesting multiple episodes of star formation from metal-poor gas, possibly infalling material. Both galaxies have an unusual population of stars to the red of the RGB and lower in luminosity than typical AGB stars. These stars have normal optical colors but abnormal near-IR colors. We suggest that this population of stars might be analogous to local peculiar stars like Be stars with strong near-IR excesses owing to a surrounding disk of hot gas.
1 Introduction
The advent of space imaging allows the direct inspection of the stellar populations in nearby galaxies. Depending on their distance, the resolved stellar populations can reach below the red clump and into the main sequence (Weisz et al. 2019), regions of fundamental interest in untangling the star formation history of galaxies. More distant galaxies, outside the Local Group, we must be satisfied with information about the high luminosity portion of a galaxy’s color-magnitude diagram (CMD), the RGB, the region of AGB stars and the top of the main sequence. Many of these stars either have short lifetimes (i.e., the top of the main sequence) or have recently left the main sequence and RGB (i.e., AGB stars). Both types are of high interest in galaxies with some evidence of recent star formation (blue colors or H emission).
Optical CMD’s provide a sharp view of the early phases of star formation (SF): the top of the main sequence and the blue helium burning branch (the so-called blue plume). A rule of thumb is that resolution of approximately two magnitudes below the tip-of-the-RGB (TRGB) allows determination of the last Gyr of star formation using CMD-fitting algorithms such as MATCH (Dolphin 2002, see Weisz et al. 2015). Near-IR CMD’s provide a longer timescale view of the star formation history of a galaxy with more information on the AGB population (with lifetimes in the 3 to 5 Gyrs range). In addition, the position of the RGB and AGB stars is a strong function of metallicity, allowing for some information on the chemical enrichment history of a galaxy to be deduced.
This study is a continuation of HST imaging of a subset of the low surface brightness (LSB) catalog of Schombert et al. (1997). Late-type LSB galaxies are very blue, an indicator of recent star formation and/or very low metallicities. Current star formation is not uncommon in LSB galaxies (Schombert, McGaugh & Maciel 2013) although typically at very low levels to match their low stellar densities. In parallel, low metallicity is presumed as their low stellar densities plus low current SFR implies a suppressed history of star formation and, therefore, slow chemical evolution. However, LSB galaxies form a surprisingly tight correlation between total stellar mass and their current SFR (the so-called main sequence for star-forming galaxies, Noeske et al. 2007, Speagle et al. 2014, McGaugh, Schombert & Lelli 2017) implying a steady rate of star formation averaged over a Hubble time.
As can be seen in Figure 1 of Schombert, McGaugh & Lelli (2019), the collection of low-mass HSB and LSB galaxies form a well-defined sequence just slightly to the right of the line of constant star formation. Thus, the current SFR in low-mass galaxies is fairly similar to the average SFR over a Hubble time and excludes a scenario where the past SFR is much higher (or lower) as this would dramatically over or under produce the final stellar mass of the galaxy (see also Kroupa et al. 2020). One could imagine a much higher past SFR with a later epoch of initial star formation, but this goes against the evidence of old ( 10 Gyrs) stars in observed CMD’s (Schombert & McGaugh 2014). The simplest monotonic function that reproduces the main sequence is a weakly declining exponential SFH with very little room for large deviations from this history, such as strong bursts in recent epochs, without wildly different observed optical and near-IR colors (see Figure 3, Schombert, McGaugh & Lelli 2019).
This proposed smooth SFH is in strong contrast to the observed SFH in many nearby dwarfs as deduced from their resolved CMD’s (Weisz et al. 2011). Global colors, color gradients and SED modeling can only constrain a galaxy’s SFH to a certain degree. A much sharper view is obtained by resolving the underlying stellar populations, even just the upper portion of the CMD. Using optical CMD’s, Weisz et al. (2014) decoded the SFH of 40 nearby Local Group dwarfs and concluded that an exponentially declining SFR is a good match to most dwarfs. However, the fraction of stellar mass produced as a function of time varied significantly from low-mass to high-mass dwarfs. Several dwarfs also display long quiescent epochs between stronger than average bursts, i.e. not the smooth, monotonic exponential one presumes.
Imaging in the near-IR also provide a view into the chemical history of a galaxy. Metallicity serves as a secondary clock of star formation as enrichment is a relatively rapid process even for galaxies with lower SFRs. Decreasing the age of a stellar population to increase its mean SFR would drive the chemical enrichment to higher final values. The mean metallicity of LSB galaxies either through O/H determination (McGaugh 1994) or direct measures of their rHeB branches (Schombert & McGaugh 2015) are extremely low ([Fe/H] 1.5) and argue against periods of strongly elevated star formation in the past. Their high gas fractions indicates that metal-poor gas is still within the galaxy boundaries and unprocessed into stars. Recent burst epochs can be reconciled with low current [Fe/H] values if these bursts use part of this unprocessed gas supply.
For this study, we have selected two seemingly opposite LSB galaxies in their optical and near-IR colors, yet with similar stellar masses and gas fractions. In addition, both have no detectable H emission signaling current SF (i.e., they are currently in a quiescent phase). By selecting two quiescent galaxies with very different colors, we hope to untangle their SFH and apply this knowledge to a wider spectrum of LSB galaxy colors. We have selected near-IR imaging as the addition bonus of investigating the proportion of asymptotic giant branch (AGB) stars in LSB galaxies, a key component to modeling their values for studies of the baryonic mass in galaxies.
2 Data
The two galaxies chosen for near-IR HST imaging are F575-3 (also known as KDG215 and D575-3) and F615-1 (also known as KDG023). Both galaxies were cataloged (Schombert et al. 1992) during a visual search of PSS-II IIIaJ plates (Reid et al. 1991) on the Palomar 48-inch Schmidt telescope between 1987 and 1989. The goal of that catalog was to increase the number of LSB galaxies under the UGC criterion of a one arcmin diameter given the increased surface brightness sensitivity of the latest Kodak blue emulsions. Discovery was by a simple eyepiece inspection with cross reference to the transparent overlays produced by the Smithsonian Astrophysical Observatory that labeled all NGC, IC and UGC objects on each Schmidt plate (see Schombert et al. 1997). A previous search of Sculptor region included a handful of the Palomar LSB dwarfs (Karachentseva 1968) which were re-discovered (not an uncommon event for LSB galaxies). As we have published several follow-up papers on these objects without knowing their KDG designations, we will continue to use their Palomar designations.
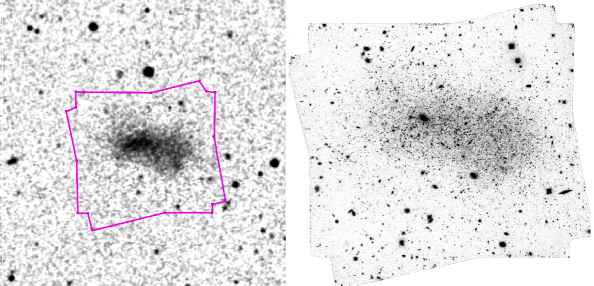
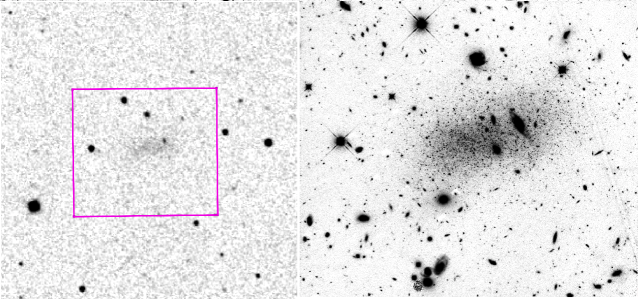
The visual appearance of both galaxies on the IIIaJ plates (see Figures 1 and 2) satisfied a ‘dI’ classification. This was owing to a smooth, exponential shape to the objects, no indication of HSB knots (typical of dIrr galaxies) or disk-like morphology (dS). The dI’s are distinguished from dE by being less elliptical in their isophotes and not as centrally concentrated, for example a core that is offset from their outer isophotes. Ultimately, the detection of HI at Arecibo was the final criteria for the dI classification.
Past observations for F575-3 and F615-1 are summarized in Table 1. HI detection was obtained in Eder & Schombert (2000), updated ALFALFA observations gives HI fluxes of 5.510.06 and 2.460.05 Jy respectfully (Haynes et al. 2018). Optical and H imaging was obtained on the KPNO 2.1m (Schombert, McGaugh & Maciel 2013). 3.6m imaging was acquired for both galaxies during cycle 25 (Schombert & McGaugh 2014) with total 3.6 magnitudes of 14.400.08 and 13.480.05. Using the distances determined by the TRGB method (see §4), these luminosities map into gas and stellar masses as given by the prescriptions outlined in Schombert, McGaugh & Lelli (2020) and listed in Table 1.
For the distances listed in Table 1, the H imaging from Schombert, McGaugh & Maciel (2013) would have detected even a single OB HII region. There are several LSB galaxies in that sample with H fluxes corresponding to SFR at, or below, the yr-1 level, thus, we believe any current SF would have been detected. From their stellar masses, the main sequence for LSB galaxies predicts between and yr-1 of star formation (i.e., between one OB association and an Orion complex level event). In addition to the lack of H, no star clusters were detected in the WFC3 images and any optical knots from ground-imaged turned out to be background galaxies in the HST imaging. Our conclusion is that there is no recent SF ( 50 Myrs) in these two dwarfs, despite their extremely high gas fractions.
F575-3 and F615-1 are similar in morphology and gas fraction (plus lack of H emission), but differ in their optical to near-IR colors. Whereas, F615-1 has the colors typical to an early-type spiral (see Table 1 and Figure 2 from Schombert, McGaugh & Lelli 2019), F575-3 is the bluest galaxy in the LSB catalog with a color of 0.26, similar to the blue colors of a starburst irregular. However, despite its red color, F615-1 has a high gas fraction indicating it is not a quenched dI. F575-3 has an even higher gas fraction making its lack of current SF truly anomalous among late-type LSB dwarfs.
| F575-3 | F615-1 | |
|---|---|---|
| RA (J2000) Dec | 125541.0191233 | 024325.5164400 |
| 14.1 | 16.6 | |
| ()a | 4.5 | 4.5 |
| ()b | 4.8 | 9.1 |
| 0.91 | 0.67 | |
| 38 arcsecs (0.9 kpc) | 81 arcsecs (4.2 kpc) | |
| B-V | 0.26 | 0.78 |
| V-3.6 | 1.25 | 3.51 |
| D (Mpc) | 5.10.2 | 10.60.5 |
3 F110W/F160W Imaging
Images for this project were obtained with HST using the Wide Field Camera 3 (WFC3). The WFC3 is a fourth-generation imaging instrument with a near-IR channel that uses a 1k1k HgCdTe array with a pixel scale 0.1350.121 arcsec/pix and a field of view 136123 arcsec. Our exposures used the F110W and F160W filters located inside the cold shield, which are the nearest equivalents to the traditional Johnson and .
Eight orbits were used in early 2018 for program HST-GO-15427 (PI: Schombert), four orbits for each galaxies, two orbits per filter. A four point dither was used to improve resolution and eliminate cosmic rays. Due to the low stellar density nature of the targets, point source crowding was not a problem. The resulting raw FLC frames were combined using the AstroDrizzle package (Gonzaga 2012), which aligns the images, identifies any additional cosmic rays, removes distortion, and then combines the images after subtracting the identified cosmic rays. The output DRC FITS images are used for position reference, but photometry is performed on the raw FLC images.
Photometry of the drizzled frames was performed using the DOLPHOT package (Dolphin 2000) and the WFC3 modules. DOLPHOT performs point-spread function (PSF) fitting on all of the flat-fielded and CTE corrected images per field simultaneously. A refinement of the shifts between the WCS of the observations, scale, and rotation adjustments is done by DOLPHOT after a first estimate of these tasks is done by AstroDrizzle. Some manual masking to background was applied, but otherwise the standard techniques and parameters were used including distortion and encircled energy corrections plus the new WFC3 zeropoints. Luminosities are expressed in the HST VEGAMAG system, and comparison to models or simulations was made converting models into the HST filter system.
The detection threshold was set for 3 above local sky. Sources within 50 pixels of the edges were rejected, as were sources that overlapped within three pixels. Given these conditions, there were 5,350 point sources for F575-3 and 2,462 for F615-1, which maps well into the expected surface brightness differences from their images. Errors in varied from 0.01 at 24 mags to 0.25 at 27 mags. Equivalent errors are found one magnitude brighter in F160W. Incompleteness was primarily due to background galaxies that account for 5 to 8% of the field of view. Completeness was 100% down to 25.5 F160W mags, 70% by 26.0.
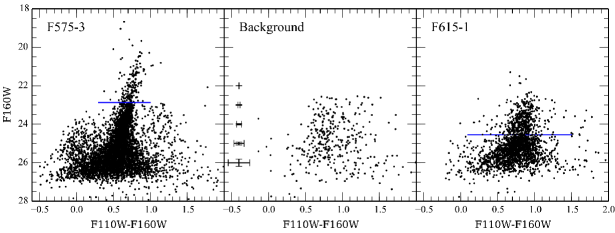
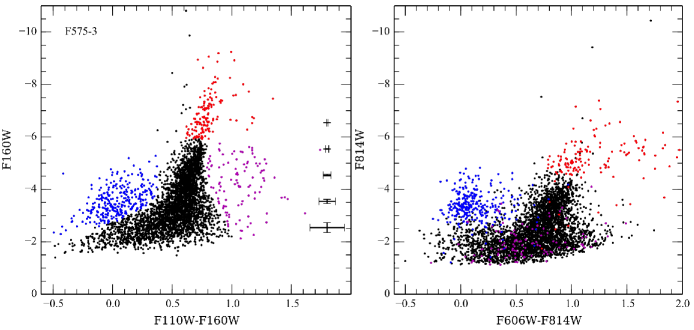
The resulting CMD’s, corrected for Galactic extinction, are shown in Figure 3. Given the similarity in global characteristics, both galaxies have high gas fractions, irregular morphology and no detectable current SF, the dichotomy in their CMD’s is striking (although less surprising when their differences in optical colors is considered). F575-3 displays all of the features of a star-forming dwarf galaxy with a prominent blue and red helium branches (bHeB and rHeB), strong M-type AGB colony and a dominant blue main sequence (bMS). F615-1, in contrast, is deficient in bHeB stars with a weak bMS population and few young AGB’s. F615-1 also has unusually wide RGB and AGB branches.
Correction for Milky Way foreground stars and background distant galaxies is problematic as both galaxies fill the WFC3 frame (F615-1 less so than F575-3 due to its higher distance). F575-3 has a higher central surface brightness and, although smaller in isophotal radius than F615-1, has a significant population to the edge of the frame. Examining just the 20% of the frame around the edges produces a CMD with all same features of the core region, a distinct RGB and clear TRGB gap. F615-1 is lower in mean surface brightness, but more extended in size. Dividing the F615-1 frame into elliptical area that contains the 23 mag arcsec-2 isophote results in a nearly 50/50 division of pixels. We display the outer region as the background CMD in middle panel of Figure 3. As both F575-3 and F615-1 are of high galactic latitude, foreground contamination should be similar.
While there is a suggestion of a RGB in the foreground/background CMD, the distribution is more in alignment with a Milky Way M dwarf population that range in colors from 0.5 to 1.0. Redder objects are probably high-redshift background galaxies that have colors ranging from 0.8 to 1.5 (see Cowie et al. 1994). While a majority of distant galaxies at these apparent magnitudes are resolved, and thus eliminated by the photometry algorithms, a few compact galaxies would enter into the sample. The number of foreground stars with colors less than 1.0 in the background CMD is slightly higher than expected from comparison star counts as a function of apparent magnitude (Robin et al. 2003) which would seem to indicate that even at large radii there still are detectable RGB stars in the frame. The redder than RGB color objects will be discussed in §9.
The foreground corrected CMD’s are very much in alignment with their global optical colors, with F575-3 being extremely blue in both and , while F615-1 has colors typical of an early-type spiral. The integrated colors deduced from the CMD’s is also in agreement with their measured colors. The estimated TRGB magnitude is shown as a blue line in Figure 3 and discussed in the next section.
4 Distance
F575-3 and F615-1 were selected for HST imaging with the expectation that both were near the edge of useful CMD analysis. Both were believed to have distances of 9 to 10 Mpc based on HI determined velocities compared to a simple Virgo infall model. F575-3 has a CMB3K velocity of 716 km sec-1 (which resolves into a distance of 9.9 Mpc for ); however, CosmicFlows-3 (Tully et al. 2019) gives a distance of 4.1 Mpc. F615-1 has a CMB3K velocity of 595 km sec-1 (which resolves into a distance of 7.9 Mpc); however, CosmicFlows-3 gives it a distance of 12.1 Mpc. Between our near-IR observations and the original HI detections, an ACS campaign obtained F606 and F814 images of F575-3 by Cannon et al. (2018). Using a standard TRGB distance analysis, Cannon et al. found a distance of 5.110.2 Mpc, slightly larger than its CosmicFlows-3 distance.
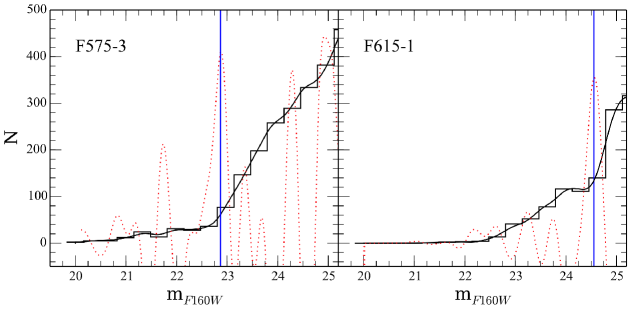
While TRGB determination is more difficult in the near-IR bandpasses, we can attempt a confirmation of F575-3 distance using the F110W-F160W CMD. From a Sobel filter test to the RGB (see Figure 4), we find a fit of . A similar analysis for F615-1 finds . Unlike the F814W filter, the F160W absolute magnitude of the TRGB () varies with the mean color of the RGB (reflecting the mean metallicity of the underlying stellar population, Freedman et al. 2020). An empirical correlation was found by Dalcanton et al. (2012) and updated by Durbin et al. (2020), but we note that this correlation is about 0.08 mags brighter than expectations from theoretical models and globular cluster observations. Using RGB colors (see §5) of 0.70 for F575-3 and 0.81 for F615-1, this results in F160W values of 5.32 and 5.58 respectfully with uncertainties on the mean TRGB color of 0.01 (which translates into an error of 0.02 in the calibration). The resulting TRGB distances are then 4.4 Mpc for F575-3 and 10.6 Mpc for F615-1.
The F575-3 distance is slightly less than the F814W value from Cannon et al. (2018) and slightly more than the expected distance from CosmicFlows-3. Given the more accurate nature of the F814W TRGB, we adopt the Cannon et al. distance of 5.1 Mpc. The F615-1 distance is smaller than the expected CosmicFlows-3 distance of 12.1, but with no other information to draw upon, we adopt a distance of 10.6 Mpc.
5 RGB Population
For near-IR CMD’s in the literature, the RGB is the most prominent feature and typically contains over 80% of the stars brighter than . A distinct upper edge of the RGB in luminosity is defined by the tip-of-the-RGB (TRGB) effect, where helium ignition occurs at a fixed temperature and, therefore, constant luminosity (Sweigart & Gross 1978). There are well-known variations in the shape and brightness of the RGB due to age and metallicity, but most RGB’s are dominated by an old ( Gyrs), metal-poor (0.5) population. For many star-forming dwarfs, there will be contaminant populations of rHeB and EAGB (early AGB) stars that have similar luminosities and colors as RGB stars (see §6). However, the shape and position of the RGB is primarily due to the old stars with similar metallicities (i.e. during an era of slow enrichment), and the number of EAGB stars in the RGB region is very small compared to the RGB’s themselves.
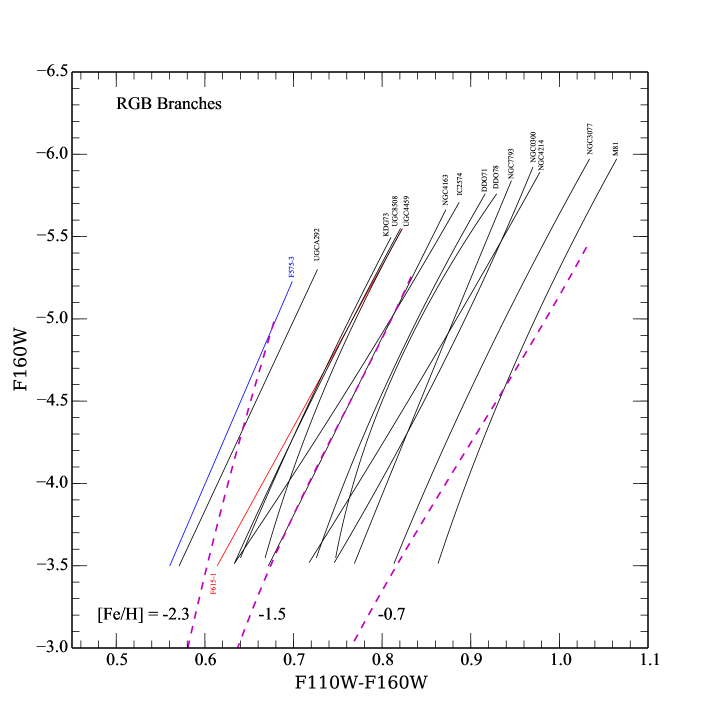
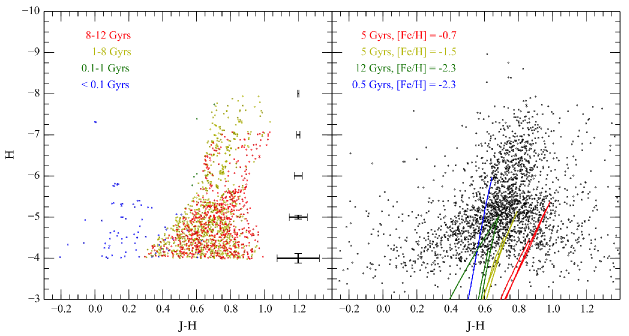
The RGB ridgeline tracks for F575-3 and F615-1 (and selected dwarfs from the literature for comparison) are shown in Figure 5. While the expectations from stellar models is that the near-IR RGB is close to a linear vertical feature, there is some evidence of curvature, particularly for the more massive dwarfs. For our analysis, we have taken the shape of the RGB from a ridgeline analysis of the F110W-F160W CMD between the TRGB and a base limit of 3.5. A ridgeline is preferred for galaxies with strong recent SF as they have a significant rHeB branch that can dominate the blue side of the RGB. Selecting the ridge on the red side of the rHeB selects only those older stars before helium core burning.
The top of the RGB is defined by the magnitude of the TRGB, which is taken from the empirical relationship between the color of the top of the RGB and (Durbin et al. 2020). As can been seen in Figure 5, there is a slight tendency for more curvature for redder RGB’s. This is easily explained if there is a range of ages or metallicity to the underlying stellar population, which is expected from the complex SFH’s suggested by optical CMD’s (Weisz et al. 2014).
The centerline of the RGB is a good measure of the global [Fe/H] of a galaxy and a majority of the high luminosity stars are RGB stars, making the determination of the centerline computationally easy. While younger mean age can move the position slightly blueward, the dominant parameter that determines the centerline of the RGB is metallicity (parametrized by [Fe/H]). For example, the difference between a 5 and 12 Gyrs RGB is 0.04 in F110W-F160W, whereas the difference on 0.5 dex in [Fe/H] is 0.16. We note that this [Fe/H] value will likely under-estimate the the metallicity of the youngest stars as the RGB is typically dominated by old stars. This has been demonstrated by Durbin et al. (2020) who found the color of the RGB at the TRGB is well correlated with galaxy mass and, therefore, mean metallicity. In fact, the red edge of the RGB will basically define the highest metallicity of the old stars in a galaxy.
For comparison, three isochrone tracks are shown in Figure 5 for a 12 Gyrs RGB of the indicated values (Pietrinferni et al. 2006). As noted by Dalcanton et al. (2012), the TRGB is significantly higher than predicted by the isochrones. The proposed explanation is a mismatch between model colors and HST filters, but this has not been demonstrated. The slopes of the RGB’s match the intermediate metallicity RGB isochrones, but are steeper on the red side and too shallow on the blue side, again, for reasons that are not clear.
The RGB ridgelines cover a wide range in [Fe/H] from the most metal-rich dwarf (NGC3077, [Fe/H] 0.6) to the smallest dwarf in the ANGST sample, UGCA292 ([Fe/H] 2.0). With respect to other near-IR CMD’s, F575-3 is on the extreme blue edge of the samples with a global metallicity that is similar to the oldest metal-poor MW globulars ([Fe/H] 2.0). It’s TRGB color (F110W-F160W=0.68) is the bluest of any galaxy with a resolved near-IR CMD. The blue edge of the RGB in F575-3 is bluer than any 12 Gyrs isochrone indicating that a metal-poor and young ( 5 Gyrs) population must also present (see also Cannon et al. 2018).
F615-1, on the other hand, is slightly more metal-rich and is grouped with several other low-mass dwarfs (i.e., KDG73, UGC8508 and UGC4459). F615-1 sits on the low side of these low-mass dwarfs with an estimated value between 2 and 1.5 (a formal fit produces a value of 1.7). Its RGB is unusual in that it is twice the width of other dwarf galaxies RGB’s (see §8), so while the mean metallicity is one of the lowest of the low-mass dwarfs, there is considerable dispersion in the metallicities of underlying stellar population.
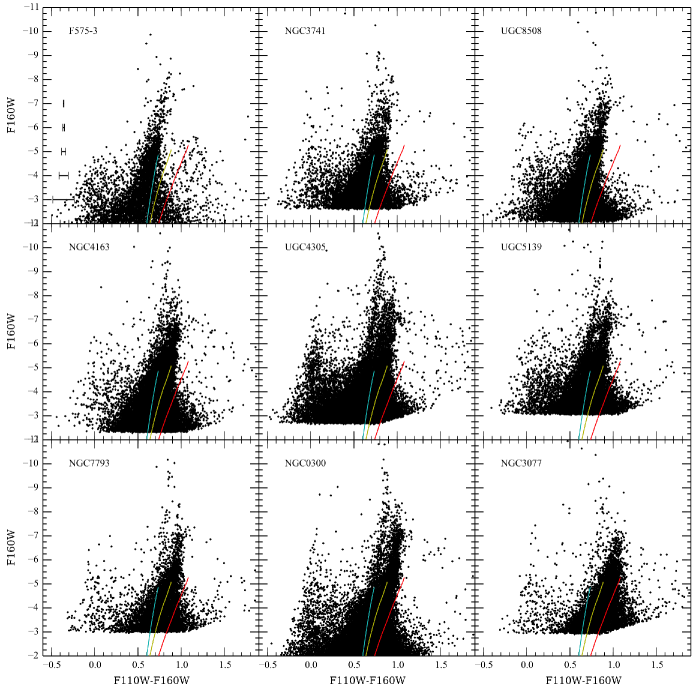
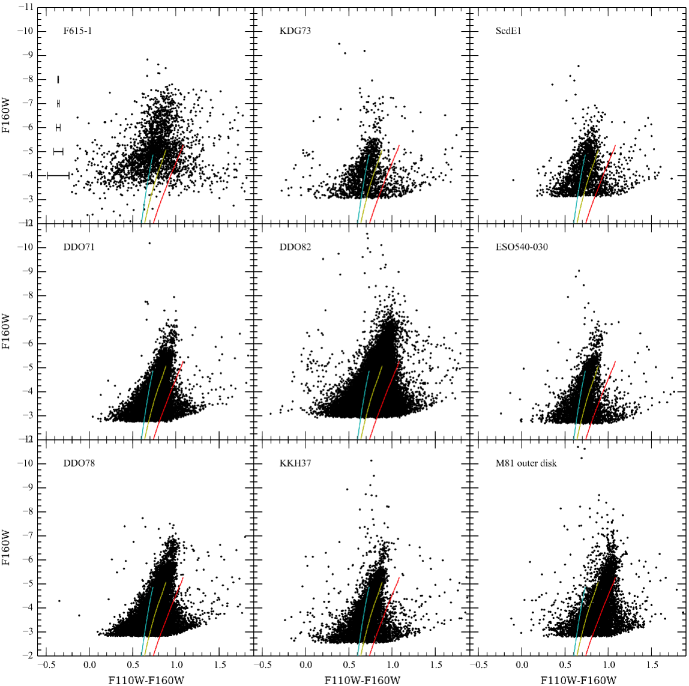
A clearer demonstration of the differences in RGB color and shape is found in Figures 6 and 7. Here we have selected a number of near-IR CMD’s from the literature from galaxies of similar stellar masses as F575-3 and F615-1 and divided the samples into galaxies with prominent RGB’s and limited young stars (i.e., old) versus those with prominent blue main sequences in the near-IR (i.e., young). The designation of “young” versus “old” by no means minimizes the rich SFH of dwarf galaxies with episodes of SF that produce a mixture of young and old stars in most dwarfs. We simply divide the CMD’s by morphology if their features are dominated by young stellar populations versus older stellar populations. This is not a statement of the time of galaxy formation. Both Figures are sorted by metallicity (from upper left to lower right) based on the correlation between TRGB color and metallicity from Dalcanton et al. (2012).
In F575-3, the shape and width of the RGB is similar to other young dwarf galaxies in the literature. The narrow RGB in young dwarfs indicates a narrow range in metallicity and age (i.e., fast chemical enrichment). The isochrones shown in Figure 6 are all for 12 Gyrs old populations with [Fe/H] values of 2.3, 1.5 and 0.7. While most dwarfs have old RGB populations that match a range in [Fe/H] from 1.5 to 0.7, F575-3 has the bluest RGB and only the very lowest metallicity models match the red side of the RGB for a population older than 5 Gyrs.
Bluer RGB’s with higher current metallicities can be matched to the data but only with younger ages. For example, at the mean F110W-F160W color of F575-3’s RGB, an age of 1 Gyrs ([Fe/H] = 1.5) is required. This exactly reproduces the scenario deduced from the optical CMD by Cannon et al. (2018) where over 60% the stellar mass of F575-3 is less than 2 Gyrs old. The surprising caveat is that a population this young requires the near-IR TRGB to be a full magnitude brighter than observed (in the near-IR, there is little change in the optically determined F814W TRGB). In addition, based on the blue edge of the RGB, the chemical enrichment of the older population does not appear to have achieved [Fe/H] values above MW globular cluster metallicities, or the younger population must have formed from newly accreted metal-poor gas.
The RGB for F615-1 also has some distinct differences when compared to the other dwarfs with primarily old stellar populations. The mean metallicity of F615-1’s RGB is similar to other low-mass dwarfs, such as KDG73 and ScdE1. However, the width of the RGB is much broader, approximately twice the width at the TRGB than other old dwarfs in the literature. While the RGB width in near-IR is primarily a metallicity effect (i.e., the rapid chemical enrichment from 12 to 5 Gyrs), the broader width in F615-1 argues for a combination of varying metallicity and varying age in the RGB population. For example, the mean metallicity of the F615-1’s RGB is approximately 1.7. This leaves very little room for metallicity variation from initial globular cluster values of 2 in order to widen the RGB. In fact, the blue side of the RGB suggests an inverse chemical enrichment scheme. This region can only be populated with a young ( 1 Gyrs) population of very low metallicity ([Fe/H 2). Given that the red side implies a population which is at least older than 5 Gyrs with [Fe/H] 1, then the younger population must have formed from low metallicity gas, probably an infall event from extensive reservoir of metal-poor gas as suspected for F575-3 (see §8).
6 Above the RGB
Stars above the TRGB are comprised from a mixture of origins that, through very different paths of stellar evolution, end up with high luminosities and RGB colors. For example, old stars of low metallicity produce a population of thermally pulsing AGB stars (TP-AGB) near the luminosity. At optical wavelengths, the TP-AGB stars span a wide range of colors due to a combination of dust in their circumstellar envelopes and large variations in molecular line spectra with photospheric temperature (Frogel et al. 1990). At near-IR wavelengths, AGB stars form into two distinct groups, those just above the TRGB (having the appearance of an extended RGB, called M-type AGBs) and those to the red of the RGB (due to the dredge-up of carbon, referred to as C-type AGBs). The RGB region below the TRGB has a number of AGB stars as well (EAGBs); however, their numbers are typically quite small compared to the number of hydrogen shell burning RGBs in the same region of the CMD (Rosenfield et al. 2014). As younger AGB stars are more massive and, therefore, brighter, they dominate the area above the TRGB.
Other stars above the TRGB include very young stars (during their helium burning phase) which form the red helium-burning branch (rHeB) with similar colors to the RGB but usually higher IR luminosities and typically form a distinct branch on the blue side of the RGB and AGB sequences. The TP-AGB population has colors that are slightly redder than rHeB stars and, except for a small number of extremely red AGB’s, they are indistinguishable in color from RGB stars. Unless the two sequences are distinct, the age and metallicity of stars above the RGB can be ambiguous.
A singular fact, from comparison to stellar isochrones, is that a majority the stars above the TRGB are less than 5 to 6 Gyrs in age and a majority of the stars two magnitudes above the TRGB (depending on the SFH of the galaxy) are lowest in age of the AGB population. Thus, the extent of the AGBs upward in luminosity is a crude measure of the age of the AGB population as a whole. The position of the stars above the AGB, with respect to the RGB ridgeline, is also very sensitive to metallicity. Given their young age, the metallicity of AGB stars (as given by their colors) are, effectively, the current [Fe/H] of the galaxy unless there is strong evidence of significant star formation in the last few Gyrs (i.e., involving more than 50% the total stellar mass of the galaxy).
For many of the dwarfs in Figure 6, the extended RGB and a distinct rHeB is obvious (e.g., NGC4163 and NGC0300). With significant recent SF, the rHeB is populated at higher metallicities than the RGB stars. Typically, the rHeB displays a 0.5 to 0.75 increase in [Fe/H] from the ridgeline of the RGB and forms an excellent measure of current [Fe/H] (see Schombert & McGaugh 2015). We note that F575-3 has a very weak rHeB despite a strong blue main sequence (typically a signature of SF bursts on scales of 500 Myrs), too weak to estimate the current [Fe/H] value from the youngest stars.
To quantify the difference between F575-3 and F615-1 and other dwarfs, we place a box along the RGB ridgeline ( 0.1 in color) from to (as guided by CMD simulations, this excludes the lower portion of the rHeB) and count the stars in this box (the RGB fraction). We then compare that count with a box above but redder than the upper portion of the rHeB (the AGB fraction).
For the younger dwarfs, the typical RGB/AGB ratio ranges from 8 to 12:1 reflecting more recent SF (as also indicated by the increase in bMS stars, see §7). The ratio for F575-3 is 9:1, consistent with the other dwarfs that display recent and current SF. Though F575-3 displays no current SF, it has the very blue colors of a star-forming dwarf and an optical CMD that indicates strong SF over the last Gyr.
In general, F615-1’s CMD has similar characteristics to other older dwarf CMD’s, but with an apparently stronger AGB population compared to the RGB. For the older dwarfs (Figure 7) the typical ratio for RGB stars to the stars above the TRGB is between 16 to 20:1. This reflects the downturn in SF in the last few Gyrs as can be seen in SFH tracks from Weisz et al. (2014). There are certainly fewer AGB’s with luminosities brighter than 8 in the older dwarfs (DDO82 is the exception with its relatively strong bMS population). However, F615-1 has a factor of four more stars above the TRGB (a RGB/AGB ratio of 4:1) than other old dwarfs. As this is a signature of SF in the last few Gyrs, the interpretation is an epoch of higher SF in the recent past.
A perplexing caveat to these interpretations of the near-IR CMD is that there is no current SF in F615-1 (no H) and its global colors are similar to other low SFR systems such as early-type spirals. There is a mild enhancement of bMS stars compared to other old dwarfs (see §7), but none of the bright, ionizing OB complexes associated with strong SF (see Figure 8 of Schombert & McGaugh 2015). In addition, while there is an overabundance of AGB stars above the TRGB, they are primarily low in luminosity with very few stars brighter than 8. F615-1 is closest in near-IR CMD morphology with DDO82 (middle panel of Figure 7), which both have small bMS populations. Often with a young bMS population a number of very bright AGB stars are found and possibly some rHeB stars (signaling an epoch of star formation in the last 300 Myrs). F615-1 is missing this brighter AGB population and any rHeB population.
The AGB population above TRGB in F615-1 is consistent with a range of ages from 2 to 8 Gyrs, with blue side representing old ([Fe/H] = 2) stars and the red side populated by younger 2 to 5 Gyrs stars and [Fe/H] values reaching to 0.5 (see §6). We note that to get the correct ratio of RGB to AGB stars as seen in F615-1’s CMD, most of the stars in the AGB must be between 2 to 6 Gyrs with [Fe/H] values between 2 to 1.5 suggesting a second epoch of SF using unenriched gas.
We note that our sample does not display an obvious population of carbon-rich AGB stars in either F575-3 nor F615-1. In the corresponding ground-based near-IR filter set, such stars dominate a roughly diagonal sequence that starts near the TRGB and extends to redder colors and fainter magnitudes (see, for example, the 2MASS CMD’s for LMC in Dalcanton et al. 2012). There are hints of such C-type AGB sequences in the CMD’s of NGC0300 and UGC4305, but it is not a common feature for all dwarfs. Part of the motivation for near-IR imaging was the existence of a number of very red AGB candidates in the F555W-F814W CMD’s of LSB galaxies (Schombert & McGaugh 2014). However, as can be seen in Figure 10 in §9, those stars have normal near-IR RGB colors, i.e., not the colors of carbon-rich AGBs.
7 Blue Main Sequence
The region blueward of F110W-F160W=0.3 is populated by stars representing the most recent SF ( 100 Myrs), the blue main sequence (bMS). This region is dominated by (1) high-mass stars still on the main sequence, (2) stars on the blue edge of their helium burning phase (bHeB) and (3) stars transitioning between the red and blue helium burning sequences. In all of these cases, these are stars with ages less than 0.5 Gyrs. The blue stars in this region in the near-IR CMD are also the same population as is seen in optical CMD’s (see Figure 10).
For the young dwarfs, the typical ratio between RGB stars and the bMS is between 8 and 12:1, although UGC4305 and UGC5139 have ratios near 5:1. F575-3 has a ratio of 9:1, slightly higher but consistent with other young dwarfs. For old dwarfs, with less recent SF, the ratios range from 50 to 200:1. Surprisingly, F615-1 has a ratio of 7:1, i.e., an unexpected amount of bMS stars given the red global colors and no H emission.
While the bMS population in both F575-3 and F615-1 is mildly centrally concentrated, they do not display any star-forming complexes, such as bright OB associations. This is in sharp contrast to the bright star-forming complexes seen in our previous HST imaging of three H bright LSB galaxies (Schombert & McGaugh 2015). While the lumpy morphology for F575-3 and F615-1 suggested some ancient star groups, these in fact turned out to be background galaxies. The underlying stellar populations in both systems is smooth and devoid of any color coherence reflecting their star forming past. This is in agreement with the estimates from the CMD’s that there has been very little SF in the last 500 Myrs, which is sufficient time to mix the younger and AGB stars through galaxy rotation and turbulence.
There is little to conclude from the bMS population. The amount of recent SF based on the bMS is consistent with their stellar mass, as F615-1 has a slightly stronger bMS population (compared to its RGB) than F575-3. However, we must reconcile the lack of current SF, and plentiful gas supply, with the obvious bMS population and conclude that the recent SFH must have been extremely erratic (i.e., bursts of SF on timescales of 100 to 500 Myrs) to avoid prominent H emission but allow significant numbers of the observed A and B stars. A skewed IMF would could also be entertained, but that type of SF is not seen in other LSB galaxies (Schombert & McGaugh 2015).
8 Chemical History
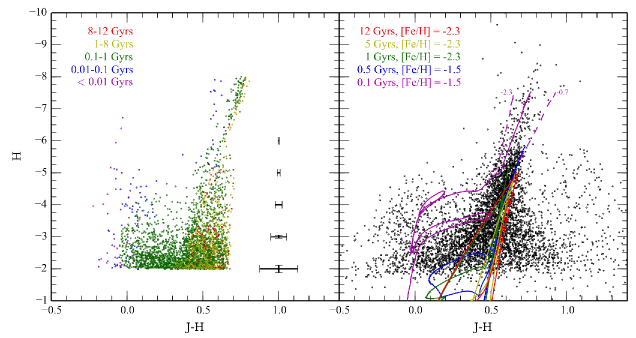
With a narrow RGB and a well-defined near-IR AGB sequence, it is possible to reconstruct the chemical enrichment history of F575-3 since its star formation history (SFH) is well mapped from its optical CMD (Cannon et al. 2018). In the right panel of Figure 8 a series of low metallicity ([Fe/H] = 2.3) isochrones are displayed against the RGB data of F575-3 (HST colors have been converted to for chemical model comparison). The red edge is a firm limit and there are no physically real isochrone tracks redward of 0.7 with ages greater than 5 Gyrs and metallicities greater than 1.0. Ages greater than 2 Gyrs only make up 40% of the underlying stellar population (as deduced from the optical CMD by Cannon et al. ) and the sharp red edge implies very little chemical enrichment up to that age. Tracks with MW globular metallicities are shown up to a population that is 1 Gyrs old and are consistent with the width of the RGB. Thus, we interpret the RGB colors to imply that no chemical enrichment is required to explain the width of the RGB, a range of ages outlined by the optical CMD is sufficient.
In addition, the centroid of the AGB region is also extremely sensitivity to metallicity. Tracks for a 0.1 and 0.5 Gyrs population with a [Fe/H] value of 1.5 are shown (a modest chemical enrichment from MW globular metallicities of 2.3) alongside tracks of 2.3 and 0.7 for the youngest stars. The 0.5 Gyrs population traces the bottom of the AGB region displaying the completing effects of decreasing age and increasing metallicity. The metallicity distribution of AGB stars in F575-3 is consistent with this range of [Fe/H] values for the youngest population. A 0.1 Gyrs population with a metallicity greater than 0.7 would have an RGB color of 0.8, which is outside the observed RGB boundary. Thus, we are forced to conclude that the old stellar population (comprising 40% of the stellar mass from Cannon et al. 2018) is composed of metal-poor, MW globular type population of stars. The other half of the stellar mass in F575-3 is composed of fairly young ( 2 Gyrs) stars with modest metallicities (1.5 [Fe/H] 0.5). Chemical evolution in F575-3 has been extremely slow, probably at globular cluster levels for over 10 Gyrs then with a sharp increase to 1.5 in only the last Gyr, this late burst also producing a majority (60%) of the stars (Cannon et al. 2018).
The left panel of Figure 8 displays an IAC-STAR simulation (Aparicio & Gallart 2004) of the SFH from Cannon et al. and the chemical enrichment scenario deduced above, blurred to the same photometric uncertainty as found in the data. It has all of the same features as the data, although F575-3 is missing the stars less than 100 Myrs old (i.e., the bright OB stars what would produce H emission). Thus, we conclude some process either 1) halted SF in the last 100 Myrs without removing a significant fraction of the gas (i.e., not quenching), or 2) the SFH of F575-3 is one many of microbursts of SF (shorter than 100 Myrs to avoid features in the near-IR) but sufficient in strength to produce 60% of the stellar mass over the last 2 Gyrs. At the same time, these bursts must only raise the metallicity of the remaining gas a small amount, a difficult task in a closed box model where even a small burst results in rapid enrichment. Otherwise, we conclude later generations form from a mixture of enriched and non-enriched gas.
A similar analysis is shown in Figure 9 for F615-1. Here a series of younger tracks ( = 5 Gyrs) are shown for [Fe/H] values of 1.5 and 0.7 to demonstrate the problem of reproducing the red edge of the RGB using low metallicity values and ages greater than 8 Gyrs. The blue side is bluer than any low metallicity ([Fe/H] 2) and old ( 8 Gyrs) population can produce. A young and metal-poor population (e.g., 0.5 Gyrs and [Fe/H]=2.3 as shown) is required to reach the blue side of the RGB.
In addition, the AGB region requires a different range of age and metallicities to produce 1) its red and blue edges plus 2) the lack of very bright AGB’s and also 3) combined with the high proportion of AGB to RGB stars. A spread of 4 to 8 Gyrs stars with intermediate metallicities satisfies the above criterion, however, a constant SF scenario is ruled out for the need of a low metallicity SF burst in the 4 to 6 Gyr age range to increase the AGB to RGB ratio. As with Figure 8, an IAC-STAR simulation is found in the left panel of Figure 9, blurred to the photometric uncertainties of the data, that include all of the elements discussed above and a small 500 Myrs population to account for the bMS population.
The uniqueness of the above two population simulations is problematic. While it is encouraging that the SFH predicted by the optical CMD in F575-3 is an excellent match to the near-IR CMD, the lack of current SF drives a microburst interpretation which is not defined in the simulations. A similar problem occurs in the simulation for F615-1 where there is clear evidence for different epochs of star formation with later SF involving new, metal-poor gas. The broad width in color of the RGB and AGB populations argues for a more complicated chemical enrichment history, but the red and blue edges limit the endpoints to much less than the solar metallicities seen in high-mass dwarf irregulars. The mass-metallicity relation can thus be preserved despite a varying SFH between different types of dwarf galaxies.
9 Be Stars
The three major regions of a galaxy’s CMD are the RGB, above the RGB (the AGB region) and the blue main sequence (bMS). Additional regions, such as the red clump and the horizontal branch, are only visible in nearby systems. Each of these three regions is well explored by standard stellar evolution isochrones and numerous stellar codes exist to reproduce a CMD from an input star formation history and chemical enrichment model (see Conroy & van Dokkum 2016). Figure 8 and 9 are our best estimates for the SFH of two dwarf galaxies presented herein based on the limits outlined in the previous sections.
However, a fourth region of the CMD is poorly understood or even explored in the CMD literature. This is the region below the TRGB and redward of the RGB. This region is typically ignored for good reason, as there are no physically meaningful stellar evolutionary tracks that reach into this region. As metallicity increases, stellar isochrones move to the red in near-IR color space. However, even the tip of an old 12 Gyr population with solar metallicity barely reaches a F110W-F160W color of 1.0.
Inspection of Figures 7 and 6 shows that several dwarfs have small, but statistically significant, populations of stars with luminosities below the TRGB, but redder than any possible stellar isochrone (e.g., ScdE1 and DDO82). Among the young dwarfs, both UGC4305 and NGC3077 display this behavior. These stars can not be dismissed as stars with poor photometry as many lie above the 100% completeness region with errors in color of 0.05. Both F575-3 and F615-1 display even higher fractions of stars in this region than other dwarfs in the literature.
An obvious answer to this anomalous population is that they are heavily reddened EAGB stars. During the first dredge-up phase it is not uncommon for early AGB stars, with luminosities below the TRGB, to become shrouded in dust. Their heavily reddened colors would occupy this region of the near-IR CMD with F110W-F160W colors between 0.2 and 0.6 mags redder than normal EAGB stars. This amount of reddening corresponds to, roughly, between 8 and 15 mags of extinction in (F555W), so these stars would be invisible in the optical CMDs.
To check this hypothesis, we can make a direct comparison between this red population’s F110W-F160W colors to their F606W-F814W colors. For F575-3, F606W/F814W data were obtained in 2012 HST program GO-12878 and published in Cannon et al. (2018). For the overlapping field of view, there are 4083 stars in common. The resulting F606W-F814W CMD is shown in Figure 10. This Figure has been color coded for its corresponding regions in the near-IR CMD (left panel) such that red symbols are AGB stars, blue are bMS stars and magenta are stars in this strange region redward of the RGB. As can be seen, both the bMS and AGB stars map from optical the near-IR in similar positions. In the near-IR, the bMS stars continue to be blue and the AGB stars are found above the TRGB in the optical plus a few have redder than RGB colors, probably due to dust shells.
However, the stars in the red region do not display the characteristics of a heavily reddened population of EAGB stars (i.e., they should not be detected in the optical). Instead, these stars are somewhat fainter with optical colors that place them between the red side of the bMS and the blue side of the RGB. In other words, they have relatively normal optical colors but a sharp, unexpected near-IR excess.
The expectation for foreground MW stars between 21 and 26 mag is approximately 40 stars in the WFC3 field, most of these being M dwarfs (Robin et al. 2003). However, the typical M star color is between 0.5 and 0.8 in , which is much bluer than this red population. In addition, there is no correlation between Galactic latitude and the occurrence of this red population in other studies. Based on deep galaxy counts (Cowie et al. 1994), an expected 300 background galaxies would appear in the field between 21 and 26 mag. They would have colors between 0.7 and 1.5 in (based on colors) but 88% of them would have resolved diameters greater than 3 WFC3 pixels and be rejected by the photometry algorithms. The remaining 40 sources would have red colors, but also red optical colors (their mean redshifts are around 0.4) and this is not consistent with the optical colors of the red population (see below and Figure 10).
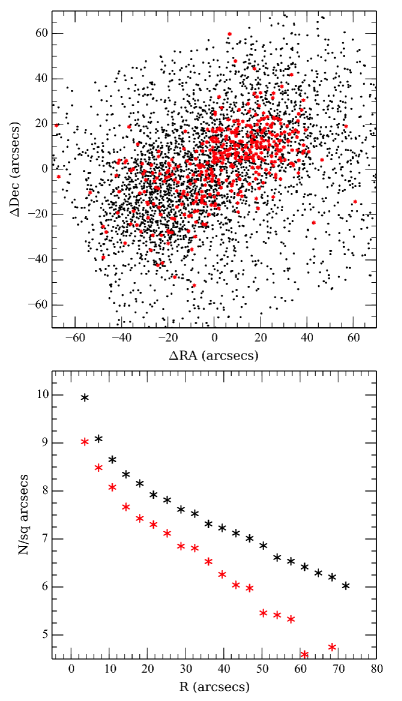
Lastly, if this population was a foreground or background component, then one would expect it have a spatial distribution of a uniform nature compared to the general stellar population. Figure 11 displays the distribution of star counts for the total population of F575-3 (black symbols) and the population of stars redder than =0.8. The red population is clearly as centrally concentrated as the galaxy stars and does not display a uniform distribution across the field of view as would be expected for foreground stars or background galaxies.
It turns out that there exists a class of stars with just these very characteristics, the Ap/Be class of stars (hereafter, just Be stars, Porter & Rivinius 2003). Be stars often display slightly reddened optical colors combined with excess near-IR luminosity, particularly in the band ( 0.5 to 1.0, Miroshnichenko et al. 1999). Based on far-IR photometry and kinematics studies, the most common explanation for the characteristics of Be stars is that they are intermediate mass, post-MS stars that formed with a surplus of star-forming debris (gas and dust). Due to rapid rotation, the surrounding debris forms into a hot plasma disk that, when heated by the underlying hot star, produces near-IR excess due to scattering and free-free emission. At low metallicities, the dust mass is low and extinction in the optical is minimal resulting in a luminous star with slightly redder optical colors and sharply redder near-IR colors. The near-IR excess is highly variable due to the rapid evolution of the star and the changing geometry of the underlying gas cloud, thus, the near-IR excess varies in a manner uncorrelated with stellar luminosity.
The properties of Be stars exactly matches the behavior observed for the stellar population to the red of the RGB. In addition, as Be stars are a subset of rapidly evolving high-mass stars, the proportion of stars in the bMS should partially reflect the number of Be stars on the red side of the RGB. While it is unclear the duration of the Be phase, the source of those stars are the ones currently occupying the bMS. In that regard, there does seem to be a loose connection between the two populations. For example, NGC3077, NGC3741 and NGC4163 (see Figure 6) all have notable Be populations and strong bMS populations. In the old dwarfs, the few with recent SF, such as DDO82 and KDG73, also have notable Be populations. However, there is no strong correlation between the ratio of the bMS and Be populations nor the RGB/AGB population. Our two LSB dwarfs have the strongest Be populations with only weak bMS populations. Without a framework or scenario to understand the timescale for transition from blue star to a peculiar star, the evolution of this population will await further study.
10 Conclusions
Nearly all late type dwarf galaxies reside on the star forming main sequence such that their current SFR is close to their past average SFR. This conclusion is based on the current condition of a galaxy: its total stellar mass and current SFR. The path to reach this endpoint can be quite complex, as indicated by the SFH’s from optical CMD’s such as Weisz et al. (2014). In this paper, we investigate the SFH of two LSB dwarfs whose stellar masses predict detectable current star formation, but neither have H emission (Schombert et al. 2013). HST WFC3 imaging in near-IR filters produced CMD’s with a resolution down to four magnitudes below the TRGB. We summarize our observations as the following:
-
•
While both F575-3 and F615-1 are gas-rich, LSB dwarfs, they differ significantly in their optical and near-IR colors. Their near-IR CMD’s reflect this same difference in global colors with F575-3 having a very blue RGB and an abundant bMS population to match its extremely blue optical colors. F575-3 has similar recent SF features in its CMD when compared to other star-forming dwarf galaxies in the literature, yet has no current SF (i.e., H emission or obvious bright OB clusters). F615-1 has a intermediate color RGB and a strong AGB population to match its early-type optical and near-IR colors. F615-1 also compares well with dwarfs that display older population features, but is unusual in having much wider RGB and AGB sequences and a detectable bMS population.
-
•
The shape and position of RGB in F575-3 indicates that a majority of the old stars in the RGB are an extremely metal-poor population. If the oldest stars are between 8 and 12 Gyrs old (as indicated by the optical CMD in Cannon et al. 2018) then the resulting [Fe/H] must be at the level of MW globular clusters ([Fe/H] 2). This would be the most metal-poor stellar population for any galaxy of its total stellar mass. The AGB population displays the characteristics of a young (an age between 1 and 2 Gyrs) population with intermediate metallicities ([Fe/H] 1.5) that would make F575-3 a very slow evolving dwarf in terms of chemical enrichment.
-
•
F615-1 differs from other old dwarfs in having an RGB and AGB region that is twice as wide as the typical dwarf. The red side can be reached with a 4 to 6 Gyrs population of intermediate metallicity (an older population with higher metallicities is inconsistent with the position and numbers of stars in the AGB region). The blue side of the RGB requires a population as young, or younger, and more metal-poor than the population on the red side. This argues for bursts of star formation using unprocessed gas to produce the more recent generations of very metal poor stars.
-
•
The population simulations for F575-3, guided by optical CMD’s, are an excellent match to the observed near-IR CMD and confirm a SFH with a late burst in SF that produced 60% of the stellar mass, then halted in the last 100 Myrs (in agreement with the optical CMD of Cannon et al. 2018). As the gas supply in F575-3 is high, quenching is not a solution to the sudden halt in SF. As the distribution of HI is fairly uniform (although kinematically disordered), SF appears to be highly erratic, perhaps induced by recent tidal events (Cannon et al. 2018).
-
•
The population simulations for F615-1 are less certain as a range of ages, metallicity and bursts can produce the observed features in the near-IR CMD. This lack of uniqueness presents a problem for extracting the exact SFH, however, we can rule out a simple exponentially declining SF, due to the mismatch of the AGB to RGB stars. To reproduce the unusually high AGB to RGB ratios requires a fairly strong burst approximately 4 to 6 Gyrs ago with low to moderate SF levels to the present day.
-
•
There is an unusual population of stars in both F575-3 and F615-1 that are fainter than the TRGB yet impossibly red in the near-IR according to any possible stellar evolutionary tracks. These stars have normal optical colors which excludes extinction as an explanation for their IR excess. We propose a class of stars analogous to Milky Way Be stars to explain this population. As rapidly rotating, optically blue, post-MS stars, they produce a gas disk that, when heated by the underlying B star, produces near-IR free-free emission. This population is clearest in F575-3 thanks to its very blue RGB, but examination of the CMDs in Figs. 5 and 6 suggests that similar populations may be president in other dwarfs as well.
Despite a slowly evolving SFH for both of these LSB dwarfs, neither match the definition of “transitional” dwarfs as proposed by Dellenbusch et al. (2008). Both galaxies are lacking in current SF, but have copious amounts of HI gas and strong evidence for significant SF in the recent past. In fact, their positions on the galaxy main sequence are consistent with other dwarfs of similar stellar mass if one considers a slightly longer timescale of star formation than probed by H emission.
With more flexibility to the SFH of a dwarf galaxy, the idea that dwarfs fall into three basic types becomes more plausible. These three types, outlined by Weisz et al. (2015), are 1) early burst, 2) late burst and 3) constant SF. If SF does not proceed monotonically, but rather in a series of microbursts, these categories would still apply under broader SF resolution. One point to note is that old isochrones ( 8 Gyrs) are nearly identical in the near-IR CMD. There is no change to our conclusions if the epoch of initial star formation begins at 12 or 8 Gyrs and very little difference even at 6 Gyrs.
Acknowledgements
This work was based on observations made with the NASA/ESA Hubble Space Telescope, obtained at the Space Telescope Science Institute, which is operated by the Association of Universities for Research in Astronomy, Inc., under NASA contract NAS 5-26555. Support for program GO-15427 was provided by NASA through a grant from the Space Telescope Science Institute, which is operated by the Association of Universities for Research in Astronomy, Inc., under NASA contract NAS 5-26555. Software for this project was developed under NASA’s AIRS and ADAP Programs. This work is based in part on observations made with the Spitzer Space Telescope, which is operated by the Jet Propulsion Laboratory, California Institute of Technology under a contract with NASA. Other aspects of this work were supported in part by NASA ADAP grant NNX11AF89G and NSF grant AST 0908370. As usual, this research has made use of the NASA/IPAC Extragalactic Database (NED) which is operated by the Jet Propulsion Laboratory, California Institute of Technology, under contract with the National Aeronautics and Space Administration. One of us [JS] is especially grateful to the late Karl Rakos, whose conversations of Ap/Be stars in the control room of the KPNO 4m during long narrow band exposures of distant ellipticals finally reach fruition with the discovery of these populations in nearby dwarfs.
References
- Aparicio & Gallart (2004) Aparicio, A., & Gallart, C. 2004, AJ, 128, 1465
- Cannon et al. (2018) Cannon, J. M., Shen, Z., McQuinn, K. B. W., et al. 2018, ApJ, 864, L14
- Conroy & van Dokkum (2016) Conroy, C., & van Dokkum, P. G. 2016, ApJ, 827, 9
- Cowie et al. (1994) Cowie, L. L., Gardner, J. P., Hu, E. M., et al. 1994, ApJ, 434, 114.
- Dalcanton et al. (2012) Dalcanton, J. J., Williams, B. F., Melbourne, J. L., et al. 2012, ApJS, 198, 6
- Dellenbusch et al. (2008) Dellenbusch, K. E., Gallagher, J. S., Knezek, P. M., et al. 2008, AJ, 135, 326
- Dolphin (2000) Dolphin, A. E. 2000, PASP, 112, 1383
- Dolphin (2002) Dolphin, A. E. 2002, MNRAS, 332, 91
- Durbin et al. (2020) Durbin, M. J., Beaton, R. L., Dalcanton, J. J., et al. 2020, arXiv e-prints, arXiv:2006.08559
- Eder & Schombert (2000) Eder, J. A., & Schombert, J. M. 2000, ApJS, 131, 47
- Frogel et al. (1990) Frogel, J. A., Mould, J., & Blanco, V. M. 1990, ApJ, 352, 96
- Freedman et al. (2020) Freedman, W. L., Madore, B. F., Hoyt, T., et al. 2020, ApJ, 891, 57
- Gonzaga & et al. (2012) Gonzaga, S., & et al. 2012, The DrizzlePac Handbook
- Haynes et al. (2018) Haynes, M. P., Giovanelli, R., Kent, B. R., et al. 2018, ApJ, 861, 49
- Karachentseva (1968) Karachentseva, V. E. 1968, Communications of the Byurakan Astrophysical Observatory, 39, 61
- Kroupa et al. (2020) Kroupa, P., Haslbauer, M., Banik, I., et al. 2020, arXiv:2007.07905
- McGaugh (1994) McGaugh, S. S. 1994, ApJ, 426, 135
- McGaugh et al. (2017) McGaugh, S. S., Schombert, J. M., & Lelli, F. 2017, ApJ, 851, 22
- Miroshnichenko et al. (1999) Miroshnichenko, A. S., Mulliss, C. L., Bjorkman, K. S., et al. 1999, MNRAS, 302, 612
- Noeske et al. (2007) Noeske, K. G., Weiner, B. J., Faber, S. M., et al. 2007, ApJ, 660, L43
- Orban et al. (2008) Orban, C., Gnedin, O. Y., Weisz, D. R., et al. 2008, ApJ, 686, 1030
- Pietrinferni et al. (2006) Pietrinferni, A., Cassisi, S., Salaris, M., et al. 2006, ApJ, 642, 797
- Porter & Rivinius (2003) Porter, J. M., & Rivinius, T. 2003, PASP, 115, 1153
- Reid et al. (1991) Reid, I. N., Brewer, C., Brucato, R. J., et al. 1991, PASP, 103, 661
- Robin et al. (2003) Robin, A. C., Reylé, C., Derrière, S., et al. 2003, A&A, 409, 523.
- Rosenfield et al. (2014) Rosenfield, P., Marigo, P., Girardi, L., et al. 2014, ApJ, 790, 22
- Schombert et al. (1992) Schombert, J. M., Bothun, G. D., Schneider, S. E., et al. 1992, AJ, 103, 1107
- Schombert et al. (1997) Schombert, J. M., Pildis, R. A., & Eder, J. A. 1997, ApJS, 111, 233
- Schombert et al. (2013) Schombert, J., McGaugh, S., & Maciel, T. 2013, AJ, 146, 41
- Schombert & McGaugh (2014) Schombert, J., & McGaugh, S. 2014, PASA, 31, e036
- Schombert & McGaugh (2015) Schombert, J., & McGaugh, S. 2015, AJ, 150, 72
- Schombert et al. (2019) Schombert, J., McGaugh, S., & Lelli, F. 2019, MNRAS, 483, 1496
- Schombert et al. (2020) Schombert, J., McGaugh, S., & Lelli, F. 2020, arXiv e-prints, arXiv:2006.08615
- Speagle et al. (2014) Speagle, J. S., Steinhardt, C. L., Capak, P. L., et al. 2014, ApJS, 214, 15
- Sweigart & Gross (1978) Sweigart, A. V., & Gross, P. G. 1978, ApJS, 36, 405
- Tully et al. (2019) Tully, R. B., Pomarède, D., Graziani, R., et al. 2019, ApJ, 880, 24
- Weisz et al. (2011) Weisz, D. R., Dalcanton, J. J., Williams, B. F., et al. 2011, ApJ, 739, 5
- Weisz et al. (2014) Weisz, D. R., Dolphin, A. E., Skillman, E. D., et al. 2014, ApJ, 789, 147
- Weisz et al. (2015) Weisz, D. R., Dolphin, A. E., Skillman, E. D., et al. 2015, ApJ, 804, 136.
- Weisz et al. (2019) Weisz, D. R., Dolphin, A. E., Martin, N. F., et al. 2019, MNRAS, 489, 763